1. Introduction
The physical and mental well-being of the ageing population is a serious challenge for all countries as the pace of the aging population is currently much faster than anticipated [
1]. People over seventy are prone to having age-related medical conditions [
2], which consume a major part of national health spending [
3]. Elderly people with medical conditions require regular physical monitoring. This makes it difficult for such vulnerable people to live independently, and they either have to live in care homes or rely upon private care. However, many elderly people prefer to live independently in their own homes, rather than moving to other facilities later in their lives. Sensor-based activity monitoring facilitates elderly people to live independently and safely, as such systems can provide some reasonable level of health monitoring.
HAR is a widely researched area and can be categorized into two classes based on the type of device for HAR, namely wearables and non-wearable HAR. Wearable systems predominantly use accelerometer and gyroscope sensors [
4,
5,
6] in the form of fitness bands and body-worn sensors [
7,
8]. In [
9], wearable sensors and machine learning algorithms are used to identify anomalous gestures and provides temporal information such as duration and frequency. The authors use situation calculus and neural networks for modeling and detecting motion disorders. In [
10], the authors used smartphones and a deep neural network-based system for continuous HAR.
Wearable devices are popular among the youth, as most of them connect with mobile devices, but this technology is not well suited for the elderly population as they might forget to wear it or can lose it easily. HAR for elderly people is mainly helpful to highlight any risks or dangerous situation. This implies that the elderly person has to wear it to every place for the whole time. This situation makes wearable devices comparatively inconvenient for the elder generation.
A non-wearable system uses external sensor hardware. An RGB depth sensor such as Kinect can be used to recognize spatial and temporal features for HAR [
11]. Thermal infrared imaging technology [
12] and vision-based activity recognition by mobile cameras [
13] provide robust results in HAR. Acoustic sensors are also used to recognize human actions in day-to-day life by collecting data using a microphone [
14]. In another work, the authors presented a methodology for automatic segmentation and recognition of continuous human activity using digital cameras in [
15].
However, these approaches are intrusive and lack the privacy required by the elderly population.
Privacy perseverance and comfort of non-wearables can be achieved by using a radar sensor system for continuous monitoring [
16]. radar sensor technology is extensively applied for gesture, respiration rate, human activity, and fall detection analysis [
17]. Low-cost radar sensors are a wise choice for HAR, and there are several ways to recognize human activity using radar sensors.
HAR has a wide scope of research and many studies are currently undergoing to develop a robust HAR by employing deep neural networks (DNNs). Ref. [
18] used sparse and non-uniform point cloud for accurate individual HAR, and out of many classifiers, a time-distributed CNN combined with a bi-directional Long Short-Term Memory (LSTM) provided accurate results on raw radar profiles. Ref. [
19] developed a light-weighted neural network to accurately recognize individual human activity using a mm-Wave radar sensor. These HAR systems did not utilize feature extraction techniques. Ref. [
20] applied two feature extraction methods, namely: local Discrete Cosine Transform (DCT) and CVAE for individual activities. These feature extraction methods provided robust results over traditional supervised feature extraction methods.
Ref. [
21] used a combination of CNN and recurrent neural network (RNN) architecture for HAR. To reduce the dependency on the labels, Ref. [
22] proposed a semi-supervised transfer learning (TL) algorithm. This algorithm has two modules. The first module is unsupervised domain adaptation and the second one is the supervised semantic transfer. These HAR systems did not utilize feature extraction techniques as well. In [
23], the authors addressed human activity recognition using deep learning and leveraged multi-resolution information from multiple spectrograms. They employed three time-frequency analysis methods to create single spectrograms with varying resolutions, combining them into a composite spectrogram for input to a VGG16 deep convolutional neural network. The composite spectrogram enhanced recognition accuracy compared to using individual spectrograms for six activities. The research work reported in [
24] provided a hidden Markov model (HMM) likelihood matrix of Doppler shifts for feature extraction to overcome the limitation of a fixed sliding window. Ref. [
25] provided an intelligent system using Markov modelling and the so-called Upper Confidence Bound method for a medical reminder system.
One of the main limitations of the previous works on the use of radar data is that they used individual activity recordings of equal duration, where either the number of the activity frames were kept constant, or the time for the activity series was kept constant [
26,
27]. In real life, the length and duration of different activities are not consistently the same. However, such pre-processed analysis could be a challenge because in real life different activities are performed continuously one after another. A real-time monitoring system should be capable of detecting activities captured in different lengths of frames and duration. However, both (equalized and non-equalized series) approaches were studied in this research to get a better insight into the need of frame equalization.
Though the series of activities were equalized in the second approach, the number of frames per activity per series still varies. This approach is still unexplored and has huge potential for future research.
In this paper, a mm-wave radar sensor is used for the recognition of continuous recordings of human activities. In [
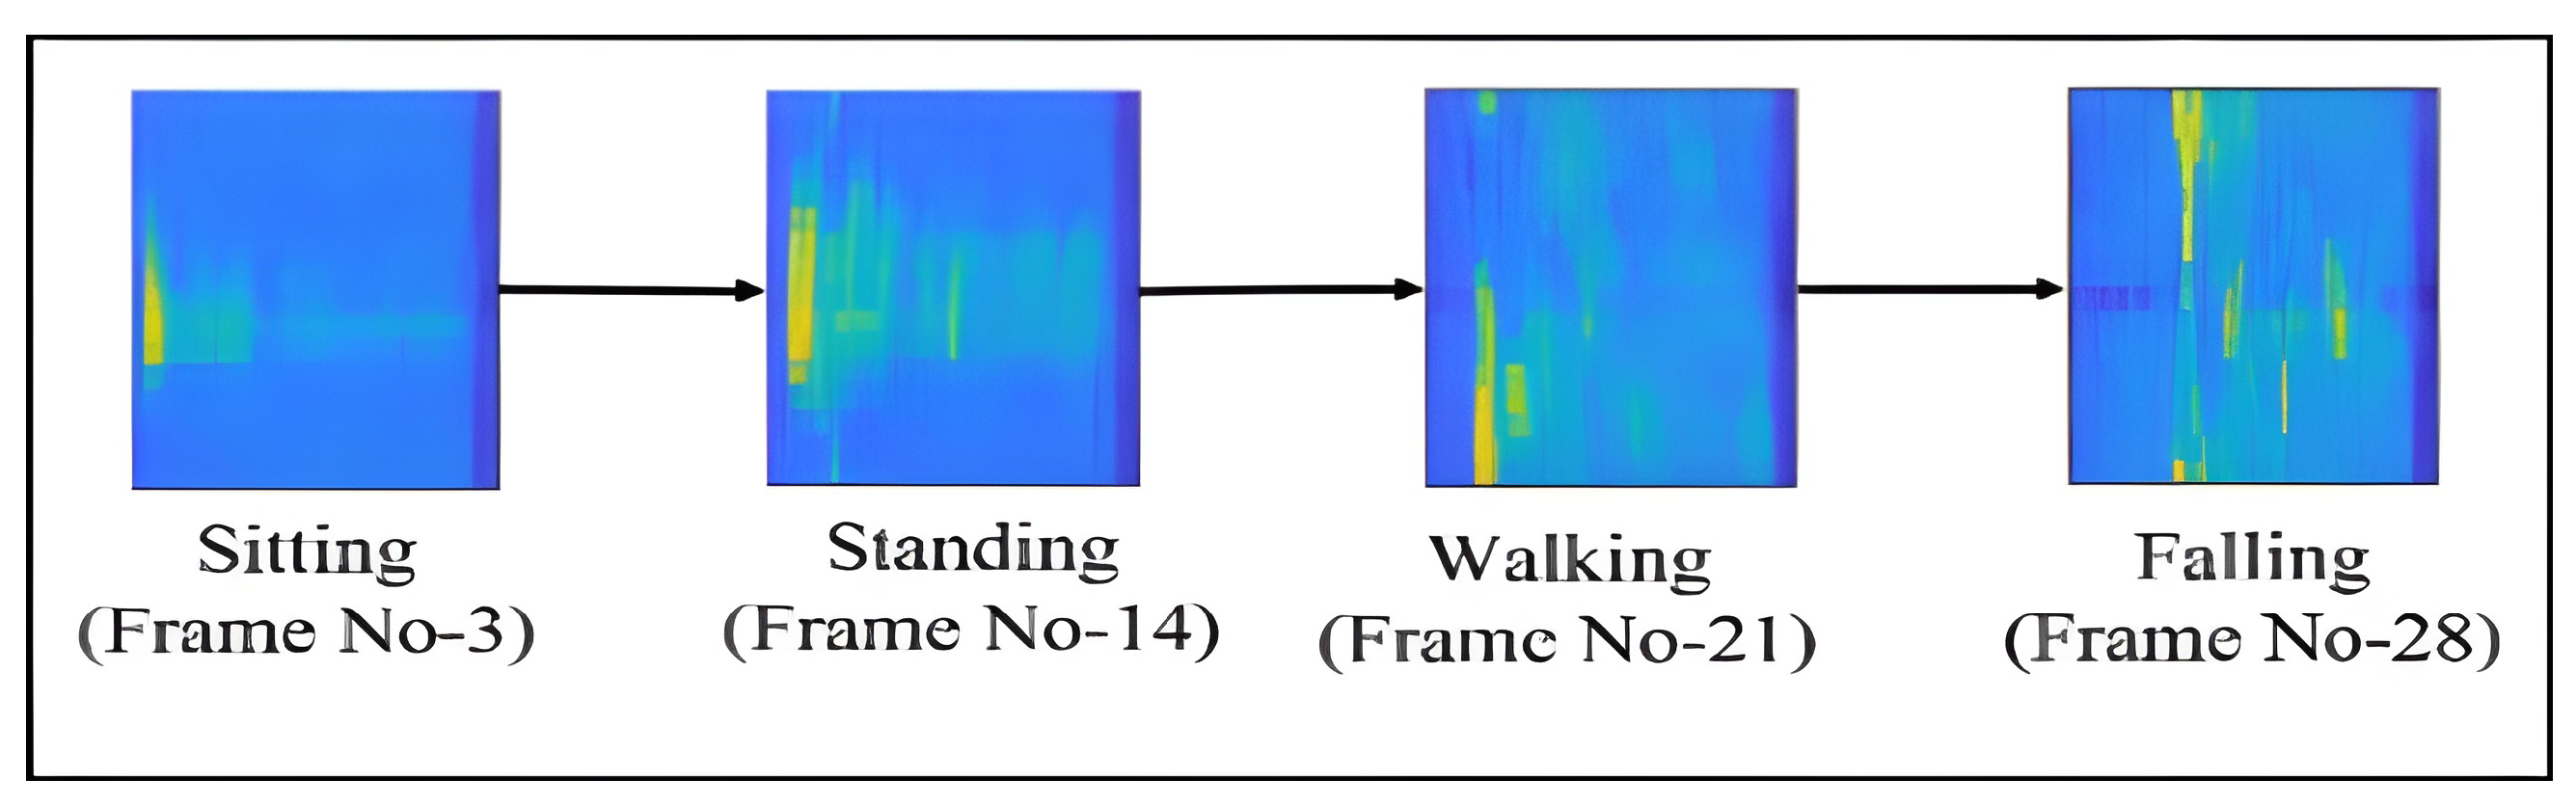
28], authors have employed mm-wave sensor data of six subjects, with a total of twenty un-equalized series of activities data, for the recognition of human activities by applying the DTW algorithm. Building upon our prior research, this paper expands the scope of our study to encompass ten subjects and analyzes a dataset comprising one hundred series of activities. Ten subjects performed a series of daily activities, such as sitting, sit-to-stand, and walking, which were recorded. The series of activities also contains an extreme condition where a person is having a fall and requires attention. The same series of activities are repeated ten times by all subjects. That allows capturing the variations in activity patterns of individual subjects as well as the diverse patterns of different subjects. Unlike the existing methods, the different activity recordings are not isolated in the series. Instead, the recognition is performed using the whole data series of different activities. A sensor named TI IWR-1443
® single-chip mm-wave was integrated into the system for accurate activity recognition. We use the series of two-dimensional (2D) range-Doppler frame of mm-wave radar sensor as the basic data. Each range-Doppler frame gives information about the objects’ velocity (Doppler) versus their distance to the sensor within the environment. The acquired 2D frames include a large number of pixels. Therefore, feature extraction techniques are employed to reduce the number of variables for recognition models. For the purpose of supervised feature extraction, activity detection and evaluation, the data have been labelled manually.
For the classification of continuous human activities, two approaches are studied in this paper. In the first approach, the length of each series of activities are kept as it is (without any frame equalization) whereas in the second approach, the number of frames per series of activities are equalised by the gradient-based frame equalization algorithm. Classification for the first approach is performed by supervised DTW (dynamic time warping). The DTW is applied on raw pixels of the collected frames and also on the extracted features obtained by a deep Convolutional Variational Auto Encoder (CVAE) based on two different strategies. In the second approach, the classification is performed by supervised Long Short-term Memory (LSTM) after various feature extraction methods are used. Besides the conventional CNN-LSTM strategy, a novel pipeline is introduced that separates the feature extraction and time series analysis to alleviate the effect of limited training sample and overfitting of the models. A supervised CVAE strategy is cascaded by an LSTM step for the time-series analysis which outperforms the other methods.
The main contributions of this paper are the following:
The data collection for continuous human activity recognition using mm-wave radar sensor.
Two new pipelines based on Supervised CVAE-DTW and CVAE-LSTM for continuous and accurate HAR.
A comparative study with other state-of-the-art methods for HAR.
Section 2 of the paper explains the use of the mm-wave radar sensor and the data collection. The data analysis, incorporating the methodology, is outlined in
Section 3, followed by the experimental results and discussion in
Section 4. Conclusions are outlined in
Section 5.
3. Data Analysis
In this section, continuous HAR is carried out using two strategies. In the first approach, the original size of each series of activities is preserved as it is. The DTW is used in this approach for the classification of the activities in the time-series of radar frames data. The input data for DTW are provided using two different strategies. First, the raw radar array data are used, while in the second strategy, feature extraction based on CVAE was performed before classification. This allows for studying the impact of feature extraction by comparing the classification results of DTW with and without feature extraction.
In the second approach, a gradient-based frame equalization was performed to equalize the length of each series of activities. Then, they are fed to the analysis pipeline including some feature extraction methodologies such as supervised and unsupervised CVAE (Sup-EnLevel and UnSup-EnLevel), CNN, and PCA followed by classification based on LSTM. The LSTM model is an improvement to the general recurrent network and provides better result as it handles the vanishing gradient problem [
31]. These approaches are described in the following sections.
3.1. HAR with Un-Equalized Series of Activities
The purpose of this study is to recognize indoor human activities in a continuous manner. In a day-to-day life, a person performs multiple activities and the duration of the activities varies depending on the type of activity, the subjects and their mood or condition. So that, even for the same activity performed by the same person, the time taken can be different. The data collection experiments also demonstrate that the activity patterns, the number of frames per activity series and the time taken to perform the series of activities are highly varying. That is very similar to the day-to-day routine of an elderly person. To deal with data analysis of asynchronous series of activities, three types of inputs are provided to the DTW algorithm for activity classification. The following outlines the continuous HAR approach for un-equalized series of activities.
Section 3.1.1 delves into the DTW algorithm, which is utilized for classifying un-equalized series of activities. As depicted in
Figure 5, the classification of continuous HAR with un-equalized series of activities is explored both with and without feature extraction in
Section 3.1.2 and
Section 3.1.3, respectively. In
Section 3.1.3, we introduce the CVAE approach, which is employed for both UnSup-EnLevel and Sup-EnLevel feature extraction techniques.
Section 3.1.3 A outlines the unsupervised feature extraction by CVAE, while
Section 3.1.3 B and
Section 3.1.3 C detail the proposed supervised feature extraction pipeline by CVAE.
3.1.1. Dynamic Time Warping
The DTW algorithm is an effective method for finding an optimal alignment between two sequences of data under certain restrictions. This makes DTW widely useful in a variety of applications. DTW measures the similarity between two temporal series. Since each subject activity profile and gesture pattern might be different, DTW allows quantifying the similarity between the labelled and unlabeled series. This is performed based on a cost function and allows the recognition of each category of activity, such as sitting, sit-to-stand, walking, and falling. Two sequences are warped in a nonlinear fashion to match the actions to each other [
32]. The DTW does not require huge number of labelled data for matching two sequences, like a neural network or a hidden Markov model (HMM) [
33].
Consider two time-dependent sequences of different sizes. Here,
X is a series of activities, with the number of frames
n.
Y is an another series of activities, with
m being the number of frames.
Mapping of
X to the
Y will give an
matrix. In this matrix, the distance between the
and
frames of the respective series
X and
Y will be a squared Euclidean distance given in (
3). In this context, opting for the squared Euclidean distance is a prudent decision, as it yields improved outcomes, when dealing with multivariate radar imagery data.
In (
3), equation
l is the counter of pixels over the 16 × 256 frame size.
The above equation shows the distance between two frames
and
in the two series. The idea of the DTW is to find a path of the best pair of similar frames between two series. For this aim, first, a cumulative cost matrix including the cumulative summation of distances is computed. The computation of the elements of this cost matrix is iterative and is based on Dynamic Programming (DP). Each element of the cost matrix is the cumulative distance, with the following initial condition.
The cumulative distance
can be calculated by adding c(
,
) in the current frame and the minimum cumulative distance from the adjacent frames shown in (
5).
Next, the series of cumulative distances within the cost matrix are found forming a warping path
W. The path consists of a set of adjacent matrix elements defined as:
where
for
and
, where
K is the total number of elements in the path
W. So, the warping path series can be expressed as
.
The DTW algorithm follows three constraints to calculate the warping path and the warping cost. The constraints are as follows.
Boundary Constraint: This states that the warping path starts at and ends at .
Monotonicity Constraint: This constraint says that the warping path can not go back. It either stays the same or moves forward. This suggests that and .
Continuity Constraint: Every point in the series should be used and indexes can only be increased by 0 or 1. In other words, the point comes from , or .
The total cost of a given warping path
W between two series
X and
Y is
and is shown in (
7).
Then, the optimum path corresponds to the minimum warping cost and is computed based on the following criteria:
3.1.2. Activity Detection without Feature Extraction
In this approach to HAR, the raw 2D data of dimension NF × 16 × 256 are first applied to the unsupervised DTW algorithm for the classification of the four human activities. As such, the classification is performed at the pixel level for the frames in the series. Thus, this approach is called the UnSupervised Pixel Level (UnSup-PLevel) method.
3.1.3. Activity Detection with Feature Extraction
Considering the 2D Doppler radar profiles, there are many local dependencies between the pixels of a frame. In addition, the specific patterns that can be used to distinguish the frames of different activities are not spread over the whole space of the profiles. Then, the effect of reducing the dimensionality of the pixels by extraction and encoding local features is investigated. In this study, CVAE is used for feature extraction. The CVAE is explained in the next section.
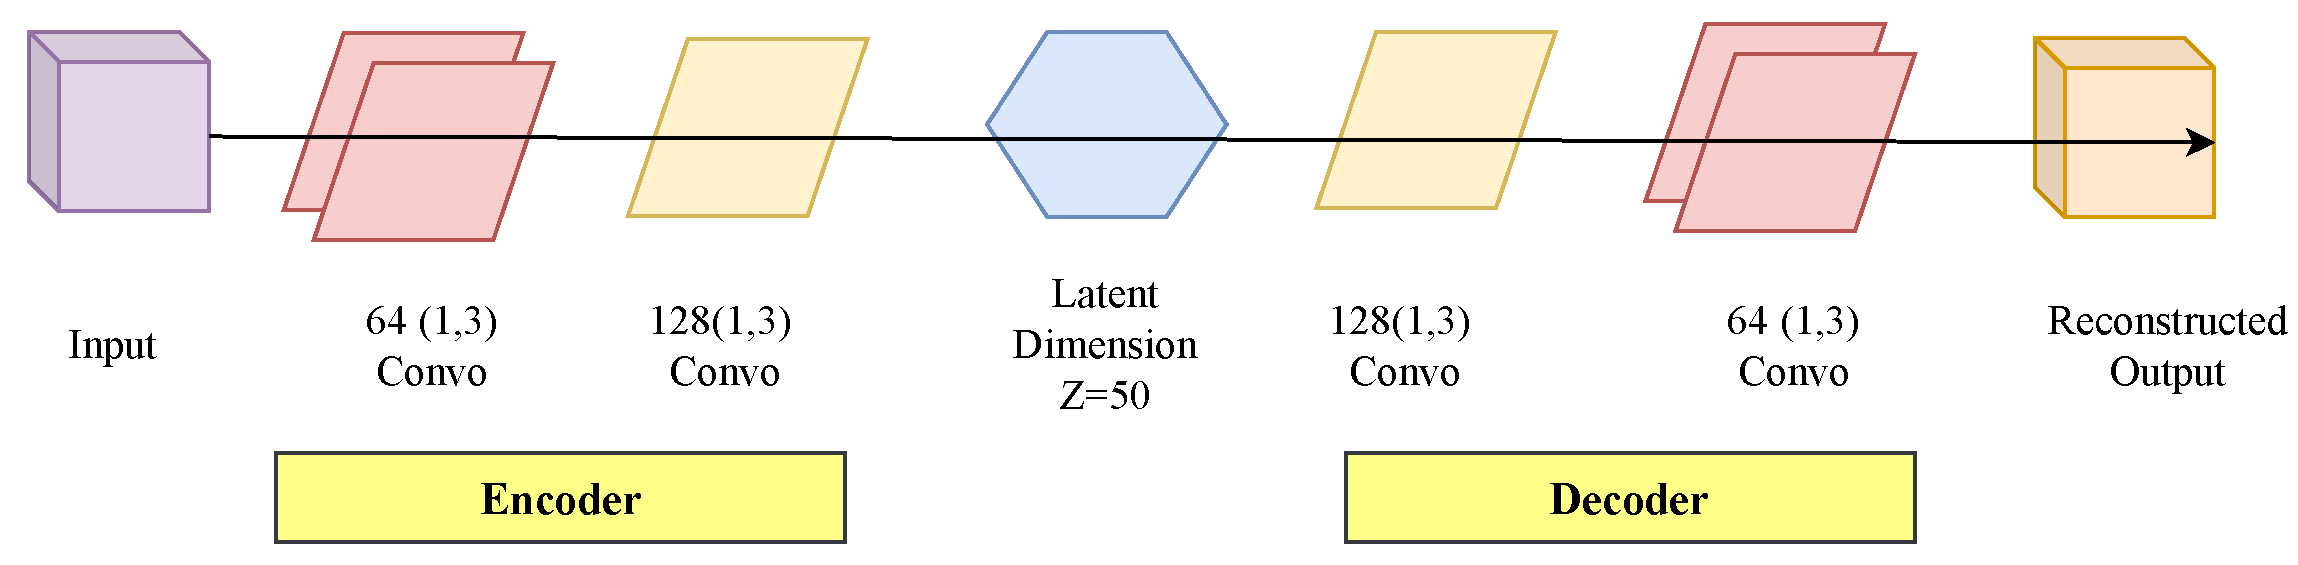
Convolutional Variational Auto-Encoder: The Variational Autoencoder (VAE) is the model whose latent layer represents a normal distribution. VAE helps to improve data reconstruction and reduces overfitting. The CVAE is the combination of VAE and Convolutional Auto Encoder and has the benefits of both methods. The CVAE is a generative model which has a similar network frame as the Autoencoder. The CVAE architecture includes an encoder and decoder network [
34]. This concept of CVAE helped to extract the feature of the time series captured from the mm-wave sensor for HAR. The encoder part of CVAE maps the original data space into the compressed low-dimensional latent space. On the other hand, the decoder reconstructs the original data reversing the operations to sample from the low dimensional latent space [
35]. The encoder is a recognition network and on the other hand, the decoder is a generative model. The loss in the CVAE is the addition of reconstruction loss and a second term which is the Kullback-Leibler divergence (KL divergence) [
36].
The architecture of CVAE with 50 latent dimensions is shown in
Figure 6.
A. Unsupervised-Encoded Level (Unsup-Enlevel) Feature Extraction
To extract features based on an unsupervised strategy, all training series of 2D frames of size including all four activities are considered and used for training the CVAE model. We refer to this approach as unsupervised encoded feature level (UnSup-EnLevel) feature extraction. In addition, the 2D frames are vectorized to the form of and CVAE is applied to the 1D data and trained using vectorized data. To improve the performance of feature extraction, the latent dimensions are varied with a step size of five (from five to sixty) to find an optimum latent dimension. The latent dimensionality with the highest training accuracy is chosen for training the CVAE model. Next, the features extracted by the CVAE are used for DTW analysis. It was found that the vectorized inputs work better rather than the 2D frames in terms of the training accuracy of the models developed for these datasets.
B. Supervised-Encoded Level (Sup-EnLevel) Feature Extraction
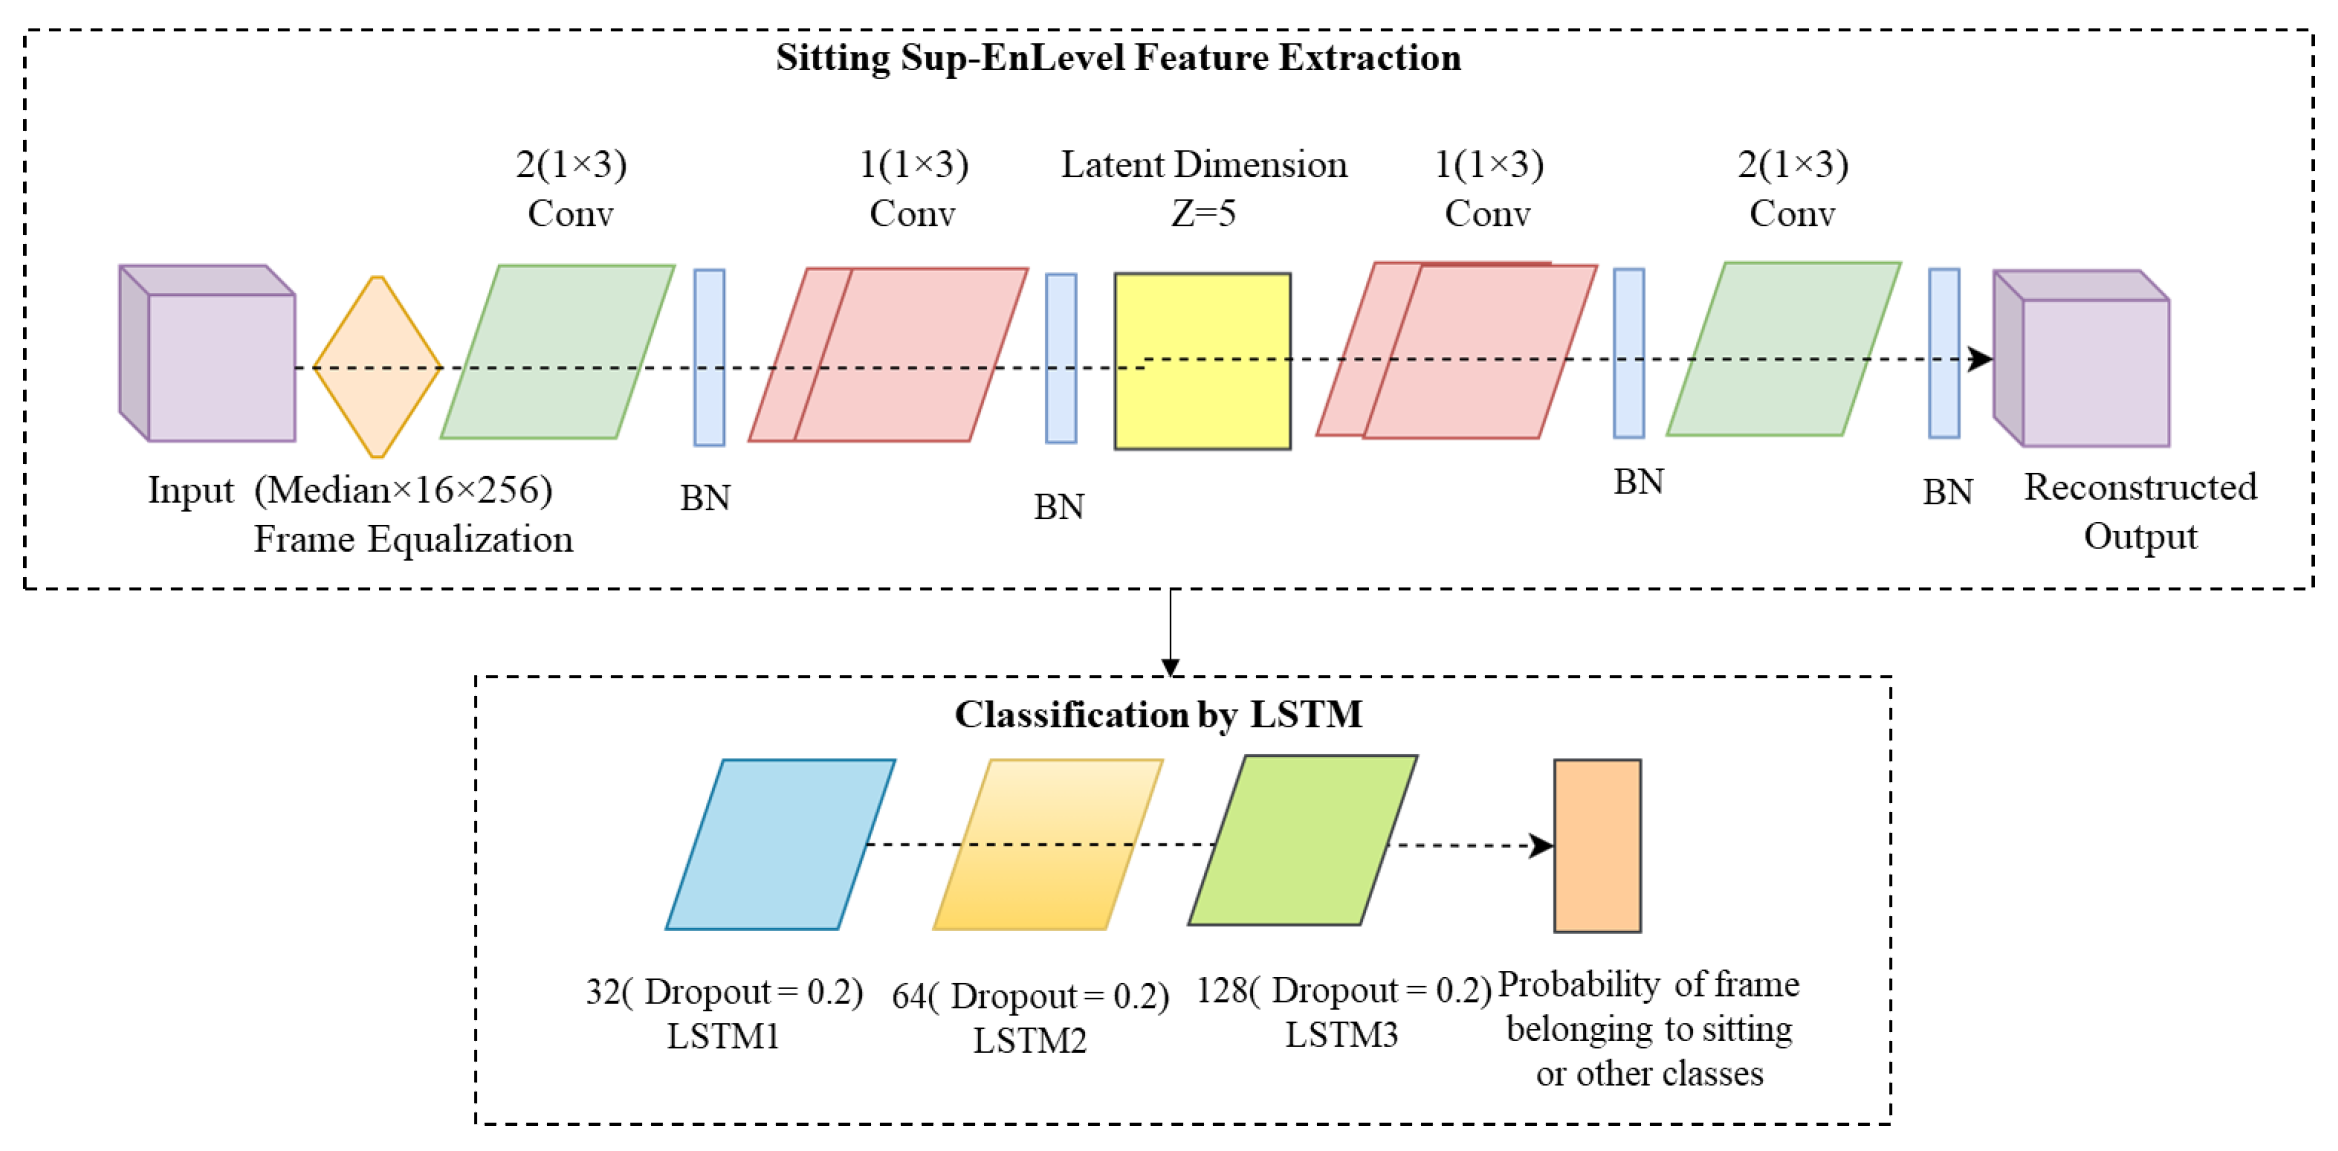
In order to improve the accuracy of activity recognition, a supervised feature extraction framework is considered. For this aim, the training and validation raw data frames corresponding to each of the four activities including sitting, sit-to-stand, walking, and falling, were used to create four sub-datasets. These sub-datasets were used to train and validate four CVAE models. The CVAE models with the latent dimension 5 yielded superior results after a systematic search for the optimum latent dimension. The architecture of the sitting activity supervised-CVAE model is shown in
Figure 7. The architectures of the other three CVAE models were almost identical to
Figure 7, however the hyperparameters were tuned according to the given data. These four CVAE models will create four feature sets for each test series that is fed to all four models. The comprehensive pipeline for Sup-EnLevel feature extraction with DTW is elaborated upon in the subsequent section.
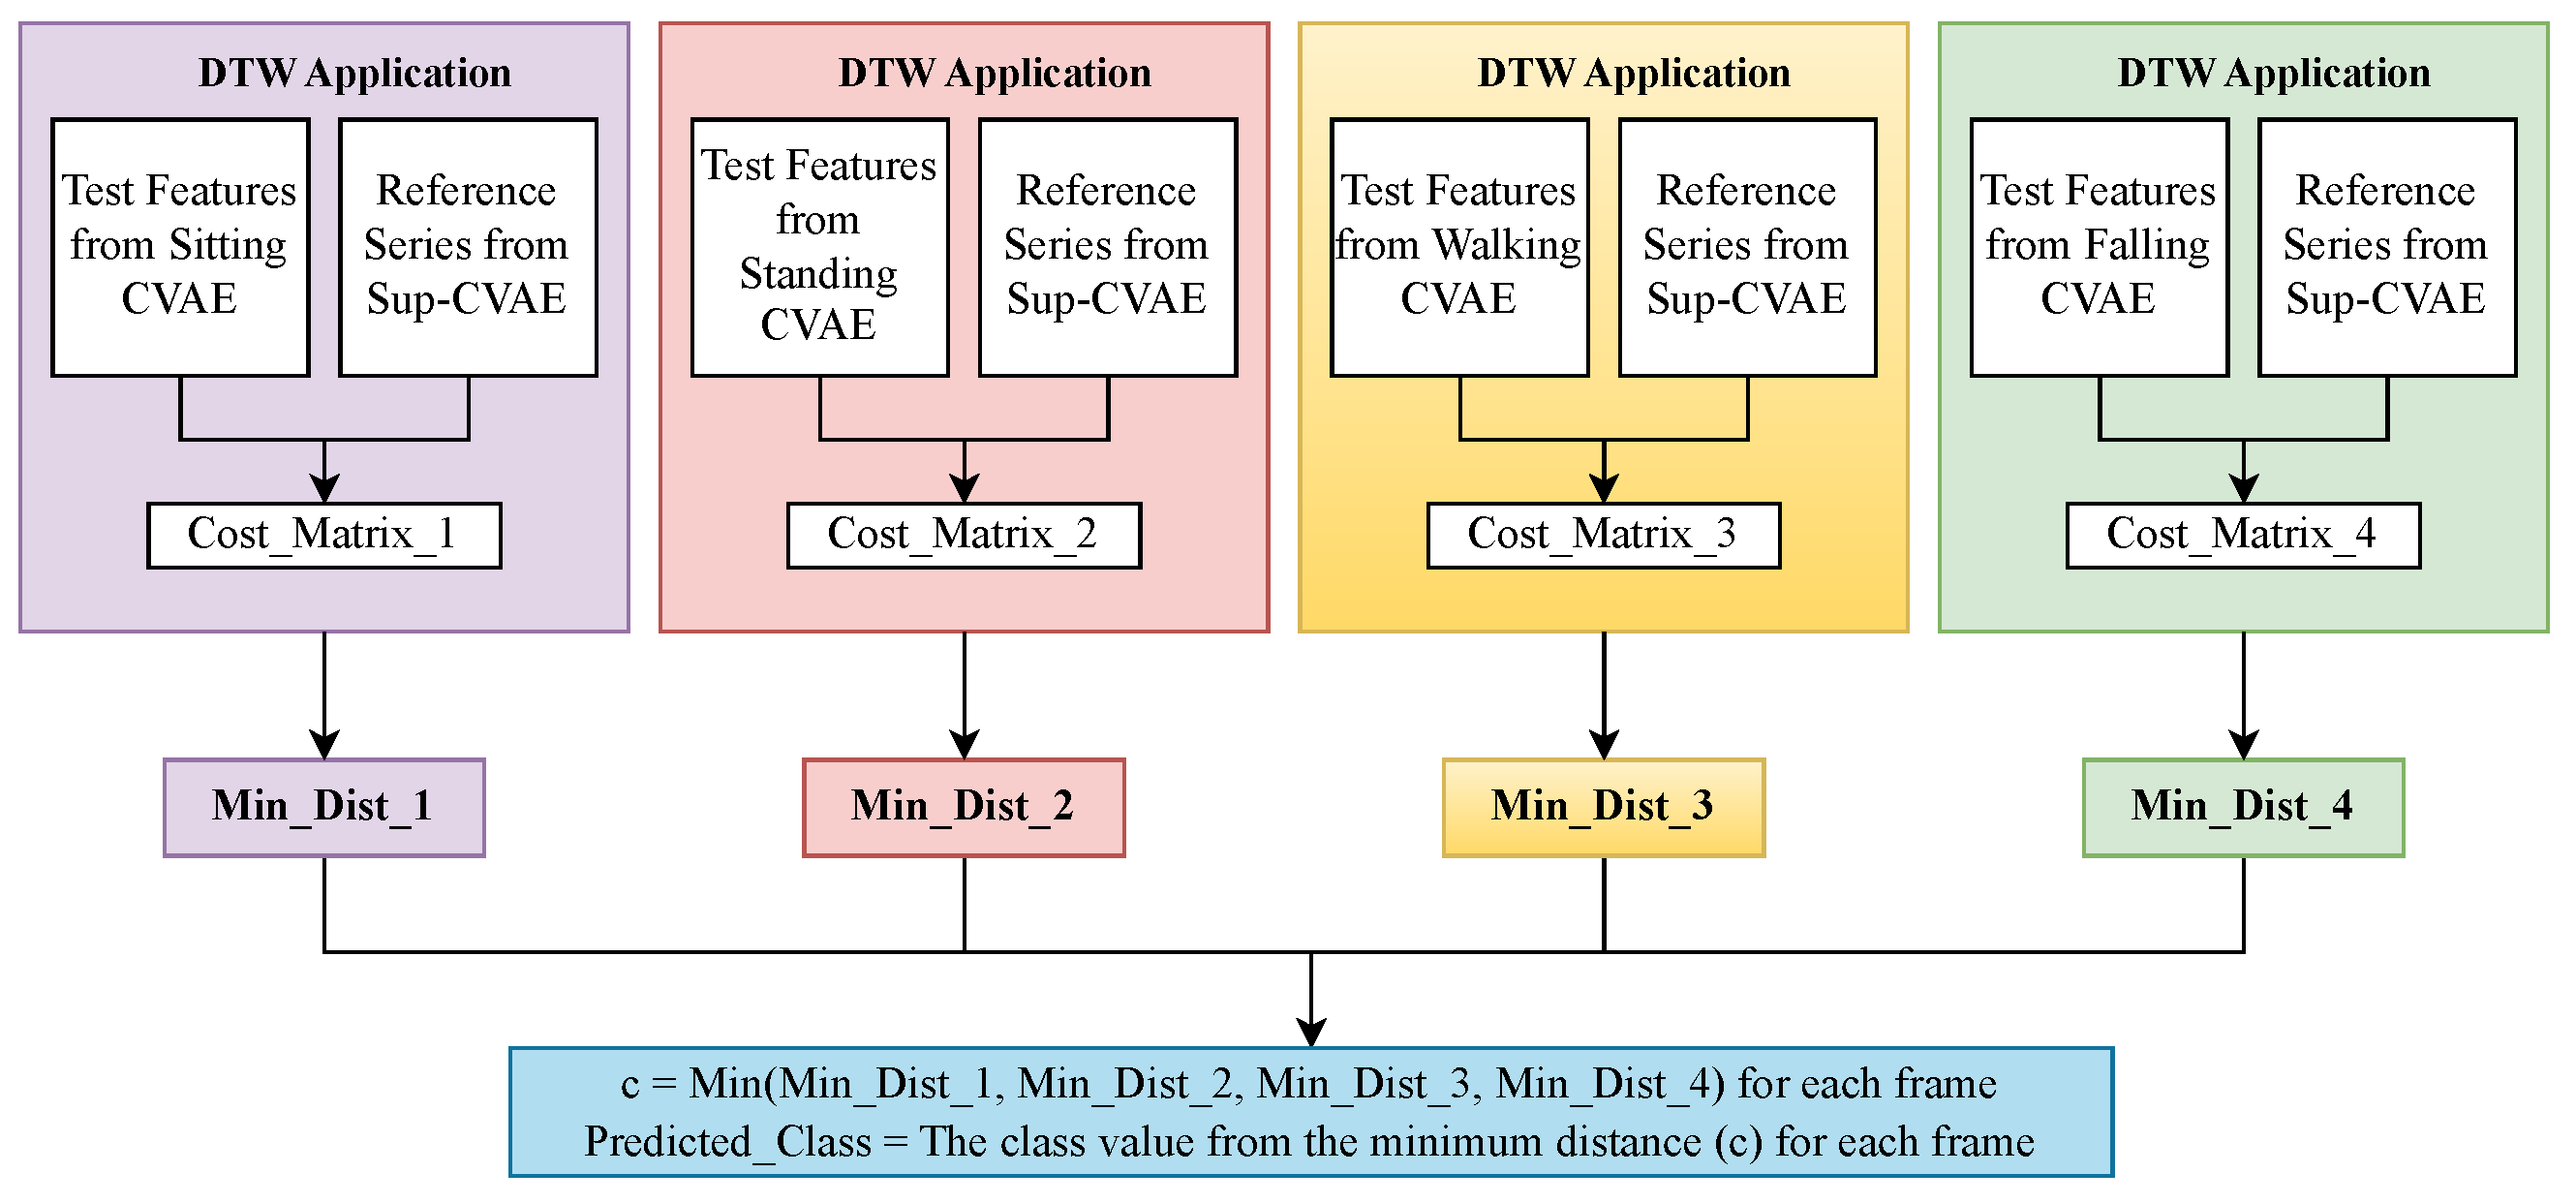
C. The Proposed Supervised Pipeline for DTW-based on Sup-EnLevel Features
The evaluation of four sets of Sup-EnLevel features by DTW is a challenging task as four sets of testing data features were extracted from four supervised CVAE models. The flowchart for the evaluation is shown in
Figure 8. The reference series with the supervised features are used to apply DTW against each set of testing series. The application of DTW for each set of testing series features will provide a cost matrix. The minimum cost distance for each test series frame is calculated for each feature set. This implies that there are four minimum distance values for each test frame. The minimum distance from these four matrices is found and the corresponding class of the feature set from which this minimum distance is extracted, is considered as the predicted label. The mathematical explanation of this approach is outlined below.
Taking into account a test activity series denoted as
A, which has four distinct sets of features originating from four supervised CVAE models, namely sitting, sit-to-stand, walking, and falling, referred to as
,
,
, and
respectively. Consider a reference series labeled as
, whose known labels are precisely established. The process of feature extraction from the Ref series results in the creation of a series called
. Subsequently, the DTW algorithm is applied independently to the four sets of features from series
A and the
series. These pairings are:
-
,
-
,
-
, and
-
. Below, you will find the mathematical expression that describes the evaluation of the classification of the test series, focusing on the Sup-EnLevel feature extraction with DTW method. To facilitate comprehension, the explanation provided will focus solely on the sitting activity model. Suppose the
has
n number of frames and
has
m number of frames. Equations (
9) and (
10) shows test series
and
respectively.
The same methodology is applied to the remaining three sets of extracted feature series,
,
, and
. To implement the DTW approach, the initial step involves computing the square of the Euclidean distance between the
and
frames of the
series and the
series by (
11). In this equation,
l represents the number of latent dimensions (5 in this case), that were utilized during the training of the four supervised CVAE models.
The cumulative distance
is calculated by using (
12) for
and
.
The Cost_Matrix_1 represents a cumulative distance matrix with dimensions
. In a similar manner, Cost_Matrix_2, Cost_Matrix_3, and Cost_Matrix_4 serve as cost matrices corresponding to the
,
, and
features in relation to
, respectively. For each frame within the
series, we select the minimum cost value and store it in Min_Dist_1. Likewise, we create Min_Dist_2, Min_Dist_3, and Min_Dist_4 arrays. Then, for each frame
, the minimum value among the corresponding four elements in those four arrays will be selected.
Then, the variable denotes the minimum value for each frame, and we utilize the index of the reference frame associated with this minimum cost to predict the class of the given test series frame.
3.2. HAR with Equalized Series of Activities
Human activity can be recognized individually or in the continuous manner. In most studies, the time or the number of frames per activity is kept fixed at the time of data collection [
37,
38]. If the activity series do not have an equal number of frames, then frame-equalization methods are applied to keep the number of frames per activity series constant.
Table 1 shows that the frames to complete the given activity vary widely with each subject and the standard deviation for each subject (for 10 times series of activities) is 94 frames. The high deviation in time series length suggests that the frame equalization must be performed carefully, so that no significant frame loss or redundant frame generation occur. In this study, interpolation and extrapolation of the frames were performed based on a new gradient-based frame equalization strategy. The main idea is to measure the level of variations between the sequential frames using the gradient function. Then, using that as a measure of variation in sequential frames. First, the length of the median length of the series is considered as the intended length to equalize. Then, for the activity series with the higher number of frames than the median requiring frame removal, the smooth parts of the sequence with the lowest absolute gradient magnitude are removed. In the case of series with lower number of frames than the median, more frames were added between the two frames with highest absolute gradient values based on their average frame.
The data used in this study have 100 series of activities and the median of the number of frames is 24. After performing the frame equalization procedure, all 100 series of activities have 24 frames each. Despite the frame equalization processing, the number of frames per activity and per series still varied; however, the total number of frames per series was attained equal.
Reviewing the literature shows that the LSTM has achieved a prominent result for the classification of time series data [
39]. In [
40,
41], the LSTM network was applied for HAR and good results were achieved. In our study, LSTM is applied for the frame-wise classification for the data of equalized frames per series. The architecture of the LSTM is described in the section below.
Long Short Term Memory For Classification: Recurrent neural networks (RNNs) have achieved a reliable performance in many applications. The major problem with RNNs is that the effect of the input decreases with each hidden layer and it almost vanishes when it reaches the output layer. The loss of input information affects the cyclic network connection of RNN [
31]. The decaying gradient problem was addressed in the Long Short-term Memory (LSTM) networks. LSTM consists of a set of recurrently connected subnets or memory blocks. Each block contains one or more self-connected memory cells and three are multiplicative units: the input, the output, and the forget gates. The architecture of LSTM is similar to that of the RNN; however, the hidden layers of the RNN were replaced by memory units to store the information for a longer period of time.
The data collected in the form of a time series are increasing exponentially. Distance-based algorithms have achieved good results for time series classification. Many deep neural network architectures also provided robust results for time series data analysis. However, LSTM can learn temporal dependencies [
42] and LSTM has proven to be successful at a range of tasks that require a long memory range [
43]. The mentioned qualities of LSTM make it an ideal candidate for sequence-to-sequence frame classification. The employed architecture of a sequence-to-sequence LSTM model for unsupervised feature extraction is presented in
Figure 9.
In the presented LSTM architecture, two layers of LSTM were combined. The input to the LSTM layer was chosen using some different feature extraction methods, including CNN, unsupervised CVAE, and PCA. The drop out ratio was added to avoid the overfitting issue. The feature extraction methods applied to the equalized frames will be presented in the next section.
3.2.1. LSTM Classification with Feature Extracted by CNN
One of the important factors in the performance of a classifier is the quality of the features fed to the LSTM layers. The feature extraction, performed using a convolutional neural network (CNN), has shown encouraging results for classification problems. Feature extraction by CNN also provided promising results for HAR as well [
43].
CNN is a widely used efficient architecture for automatic feature extraction. In contrast to the classic fully connected networks (FCN) that require the extraction of relevant features from raw images based on expert knowledge and decisions, CNN architecture allows the automatic extraction of features from the images through optimization of the kernel weights, based on the gradient descent algorithm. It also benefits from fantastic characteristics, such as weight sharing and pooling that allow for the scaling up of the design for deeper models with more layers of convolutional feature extraction [
44].
A standard CNN architecture is made up of five layers. The first layer comprises an input layer. The input layer will hold the information of the input images and the pixel values. The second layer is the convolutional layer. The convolutional layer applies local kernels to the image map for linear feature extraction. In fact, the output of this layer is a scalar product between the kernel weights and the local receptive fields of the image going under the kernel. Then, a non-linear activation function is applied to the linearly extracted features based on convolution. That ensures the approximation of a complex function based on the CNN architecture, for modeling the nonlinear relation between the images and the targets. After the convolutional and activation layers, a pooling layer is used to downsample the dimensionality of the feature maps. Depending on the depth of the model, several convolution, activation, and pooling layers might cascade. Finally, the feature maps are floored and fed into a fully connected network for decision making. The fully connected network will work exactly as a standard artificial neuron network (ANN). A fully connected layer is employed for the classification. However, in this study, CNN is employed as a feature extractor, and the extracted features are fed into the LSTM layers. Then, no FCN layer is used. The designed architecture based on the CNN for feature map extraction and LSTM layers for this study is presented in
Figure 10.
3.2.2. LSTM Classification with Feature Extracted by CVAE
In the above CNN-LSTM architecture, the weights of the convolutional layers for feature extraction were optimized together with the LSTM layer during the optimization process. However, due to the limited number of training samples, the learning process might be influenced, e.g., due to early stopping to avoid overfitting. On the other hand, it is not possible to employ transfer learning strategies to adopt features from the common pre-trained model given the special type of mm-wave radar image modalities used in this work. One possible solution is to separate the learning and optimization process for the convolutional feature extraction and the time-series analysis based on LSTM. This can help to perform training in two separate steps for two less complex models. For this aim, two different strategies are considered using the equalized frame data for feature extraction: (1) An unsupervised CVAE-LSTM framework (UnSUp-EnLevel) and (2) a supervised CVAE-LSTM (Sup-EnLevel) framework. The details of these two approaches are described in
Section 3.2.2 A and
Section 3.2.2 B below.
A. An unsupervised CVAE-LSTM (UnSup-EnLevel with LSTM) framework An unsupervised CVAE framework, similar to that explained in
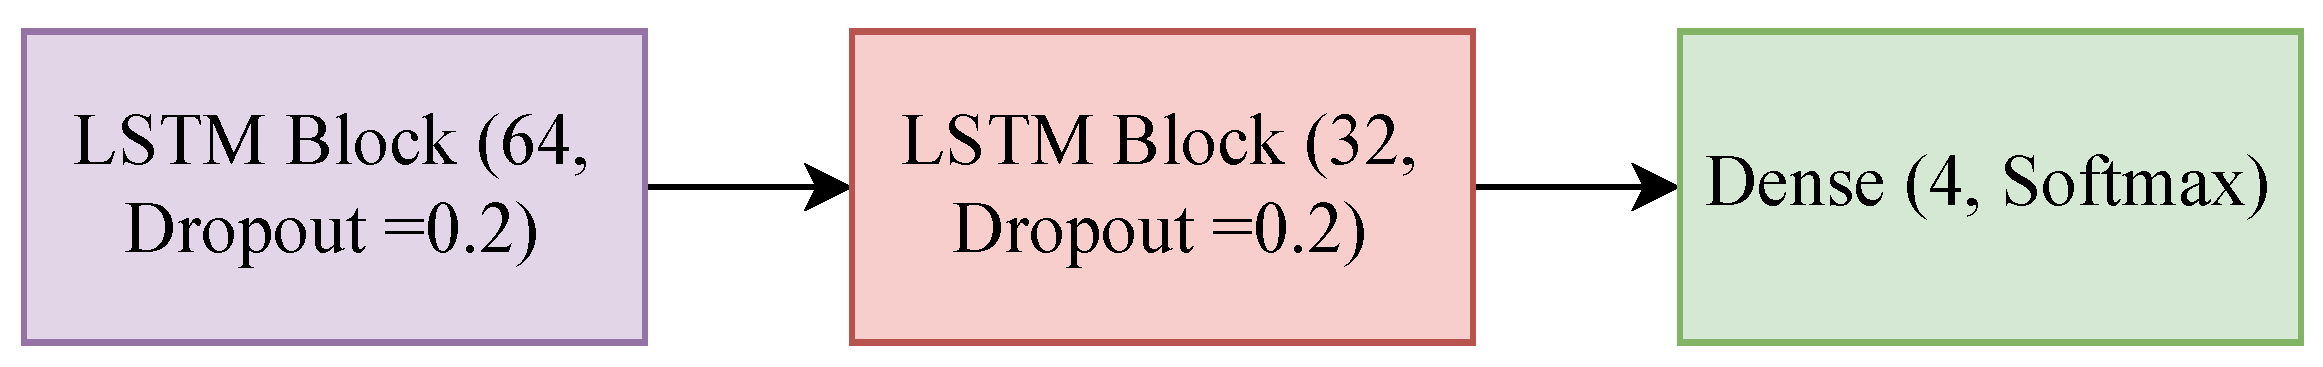
Section 3.1.3 B, has been employed to extract features to be fed later to an LSTM architecture. The input of the unsupervised CVAE network is the gradient-based equalized data. The unsupervised CVAE model has been optimized and stepwise hyper parameter tuning has been carried out to find the finest architecture. Then, two different two-layer LSTM models of units 64 and 32 have been trained using each of the extracted feature sets to classify the human activities. The Unsup-CVAE-LSTM architecture is presented in
Figure 11.
B. The proposed Supervised pipeline for LSTM-based on Sup-EnLevel Features
A supervised strategy to extract features based on CVAE using each of the individual class’ data is considered, similar to what has been described in
Section 3.1.3 C above. The strategy for supervised CVAE feature extraction and LSTM is presented in
Figure 12. As shown in
Figure 12, four datasets of sitting, sit-to-stand walking, and falling were created using equalized series data. These four datasets were used for the training and validation of four CVAE networks (Sit-CVAE, Sit-to-stand-CVAE, Walk-CVAE, and Fall-CVAE) for feature extraction. For each CVAE model, a separate LSTM model was trained and validated; this yielded sit-LSTM, sit-to-stand LSTM, walk-LSTM, and fall-LSTM. Sit-CVAE was also used to extract the less relevant features from the sit-to-stand, walk, and fall series. Then, all four class features extracted from Sit-CVAE were used as an input to sit-LSTM. Of these four classes’ data in sit-LSTM, the sitting series will have influential features, whereas the other three series will have insignificant attributes. The described input data were used to train sit-LSTM for a binary classification model of sit vs the other classes. Similarly, sit-to-stand-LSTM, walk-LSTM, and fall-LSTM networks were trained. The architectures of supervised sit-CVAE and sit-LSTM are illustrated in
Figure 13. The labels were predicted by majority voting of probabilities of the four LSTM models.
3.2.3. LSTM Classification for Feature Extraction Based on PCA
Given the high dimensionality of the original mm-wave radar frames (
), the standard PCA analysis has been used to reduce the number of features. Then, using the transformed features into the lower dimensional space, an LSTM model can be used for decision-making.Therefore, in this work, PCA is used to transform data linearly into a lower dimensional space. Reviewing the literature shows that the number of selected principal components is decided based on the accuracy of the model, or their percentage of the explained variance [
45].
In this work, the original data of
are used to employ PCA. For this aim, first the data are reshaped to
. Then, various numbers of principal components such as 256, 1296, and 2116 were experimented with for the purpose of feature extraction, and the gained validation accuracies were compared. Results showed that selecting 2116 features would gain the best results. Then, the extracted features based on PCA were applied to the LSTM model for classification. The PCA-LSTM framework is presented in
Figure 14.
4. Results
In this section, the results obtained with the methods described in
Section 3 are presented. This includes the results achieved with and without the frame equalization process. In total, 80 series were considered as train data, whereas 20 series were considered as test data. The length of each series differs in the non-equalized frame data whereas each series of human activities with equalized frames has 24 frames, as this is the median number of frames of all 100 series.
The performance of classification is assessed at the frame level and activity level by calculating an accuracy measure. For frame-based accuracy, the accuracy is calculated based on the ratio of the number of correctly classified frames over the total number of frames, while for the activity-based accuracy, the number of correctly classified activities (which include a group of frames) is divided by the total number of activities. An activity is considered to be correctly classified if all its frames are classified correctly.
The results for both approaches are presented in the following section.
4.1. Experimental Results Based on DTW and the Un-Equalized Series
The dataset was collected from 10 subjects and each subject performed the activity series 10 times, but the time and length of the activity series varied widely. The median of all 100 series of activities is 24 frames.
Figure 15 provides the subject-wise series length comparison with the median. This figure shows that the lengths of all the series of subject-1 and subject-2 are higher than the median, whereas subject-10 has all its series lengths lower than the median. Subject-4 has five series longer than the median and another five series shorter than the median. Only six out of one hundred series lengths are similar to the median series length.
The non-equalized activity series of data are divided into training and testing sets using careful analysis. The subject-wise train and test data division is given in
Table 2.
Visualizing the Optimal Path using DTW
Although the one hundred series, including sitting, sit-to-stand, walking, and falling activities, show similar patterns, the series are different in their patterns and number of frames. That is even the case for the 10 series of activities performed by the same subject.
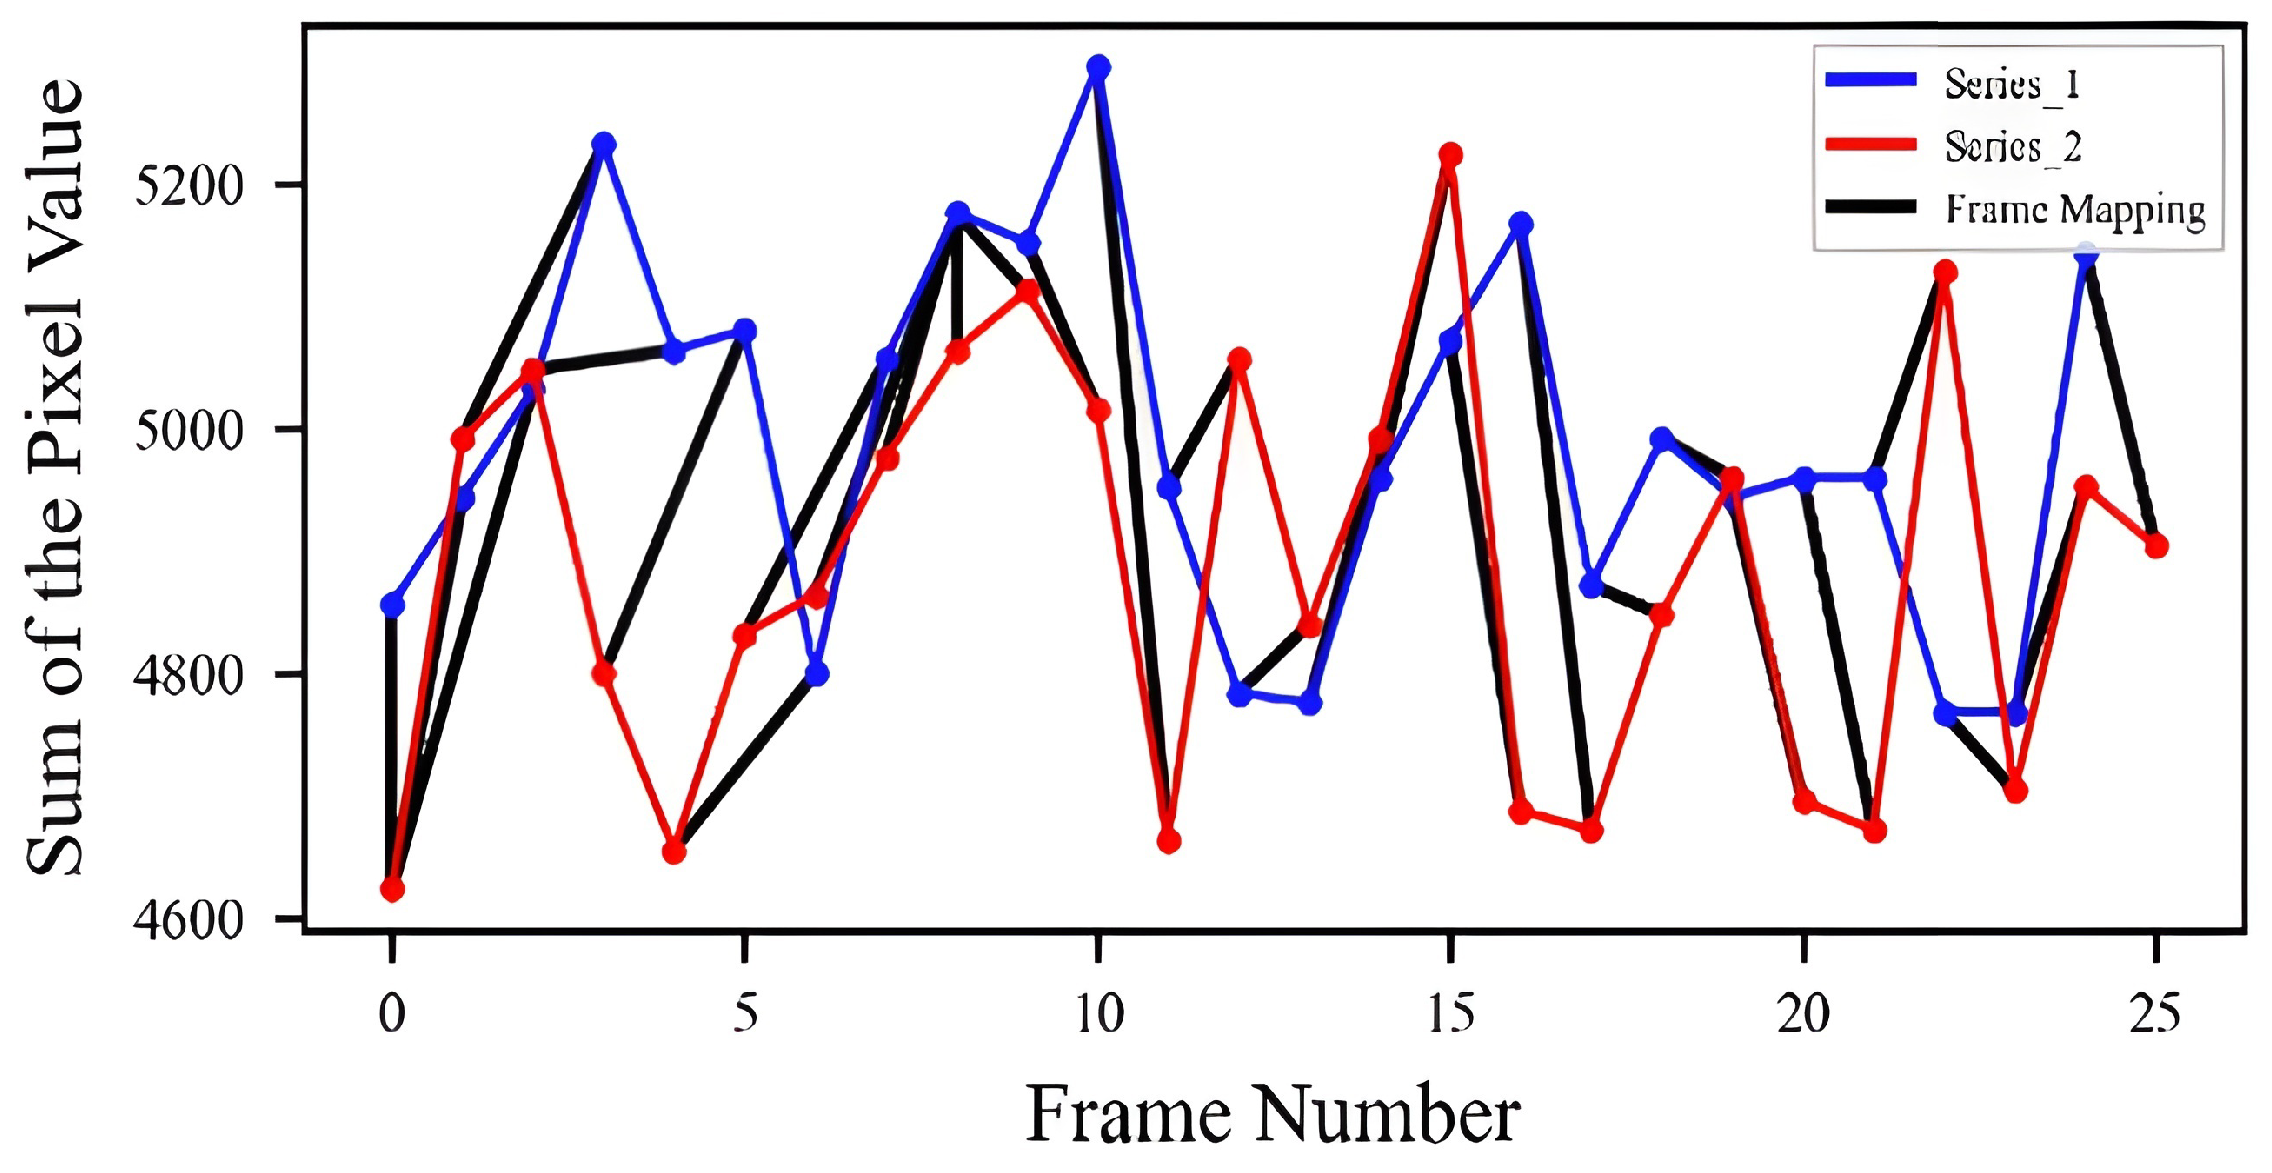
Figure 16 shows two series of activities performed by two subjects. Since each frame is of size
, the sum of the pixel values of each frame is used to show each frame as a point on this plot. As can be seen, the two trends have some level of similarity, but differ in duration. The optimal alignment of the two series is shown as a black color line connecting the corresponding frames of the two series represented by blue and red color lines. The optimal path found based on the DTW algorithm and the UnSup-PLevel features was used for finding the matching frames of the two series in this case.
The DTW cost matrix computed for the two series is shown in
Figure 17 where the optimal path is also highlighted. The corresponding frame-wise labels of the two series shown in
Figure 17 are presented in
Table 3 to check the activities using the optimal path. As the straight line suggests, there is a high similarity between the two series of activities.
In the first approach, un-equalized series of activities were used as input data. DTW is applied to all the training and test samples at pixel level first. Then, CVAE is applied to the series of 2D frames as well as to the vectorized frames (1D data). To train an unsupervised CVAE model, the 80 training activity series were used. The training inputs for CVAE models were of size when 2D inputs were used, and it was when the 1D vectorized inputs were used. The series of frames were vectorized without shuffling the samples. After training the CVAE model, the final encoding part of the model was used to extract the encoded features from both training and test series frames. The test series includes a total of 593 frames (20 activity series). The extracted features per frame and the series of features were used by the DTW for the classification of four human activities. Then, by considering one series from the training dataset as a reference, the activities in the testing dataset were found by comparing their warping path.
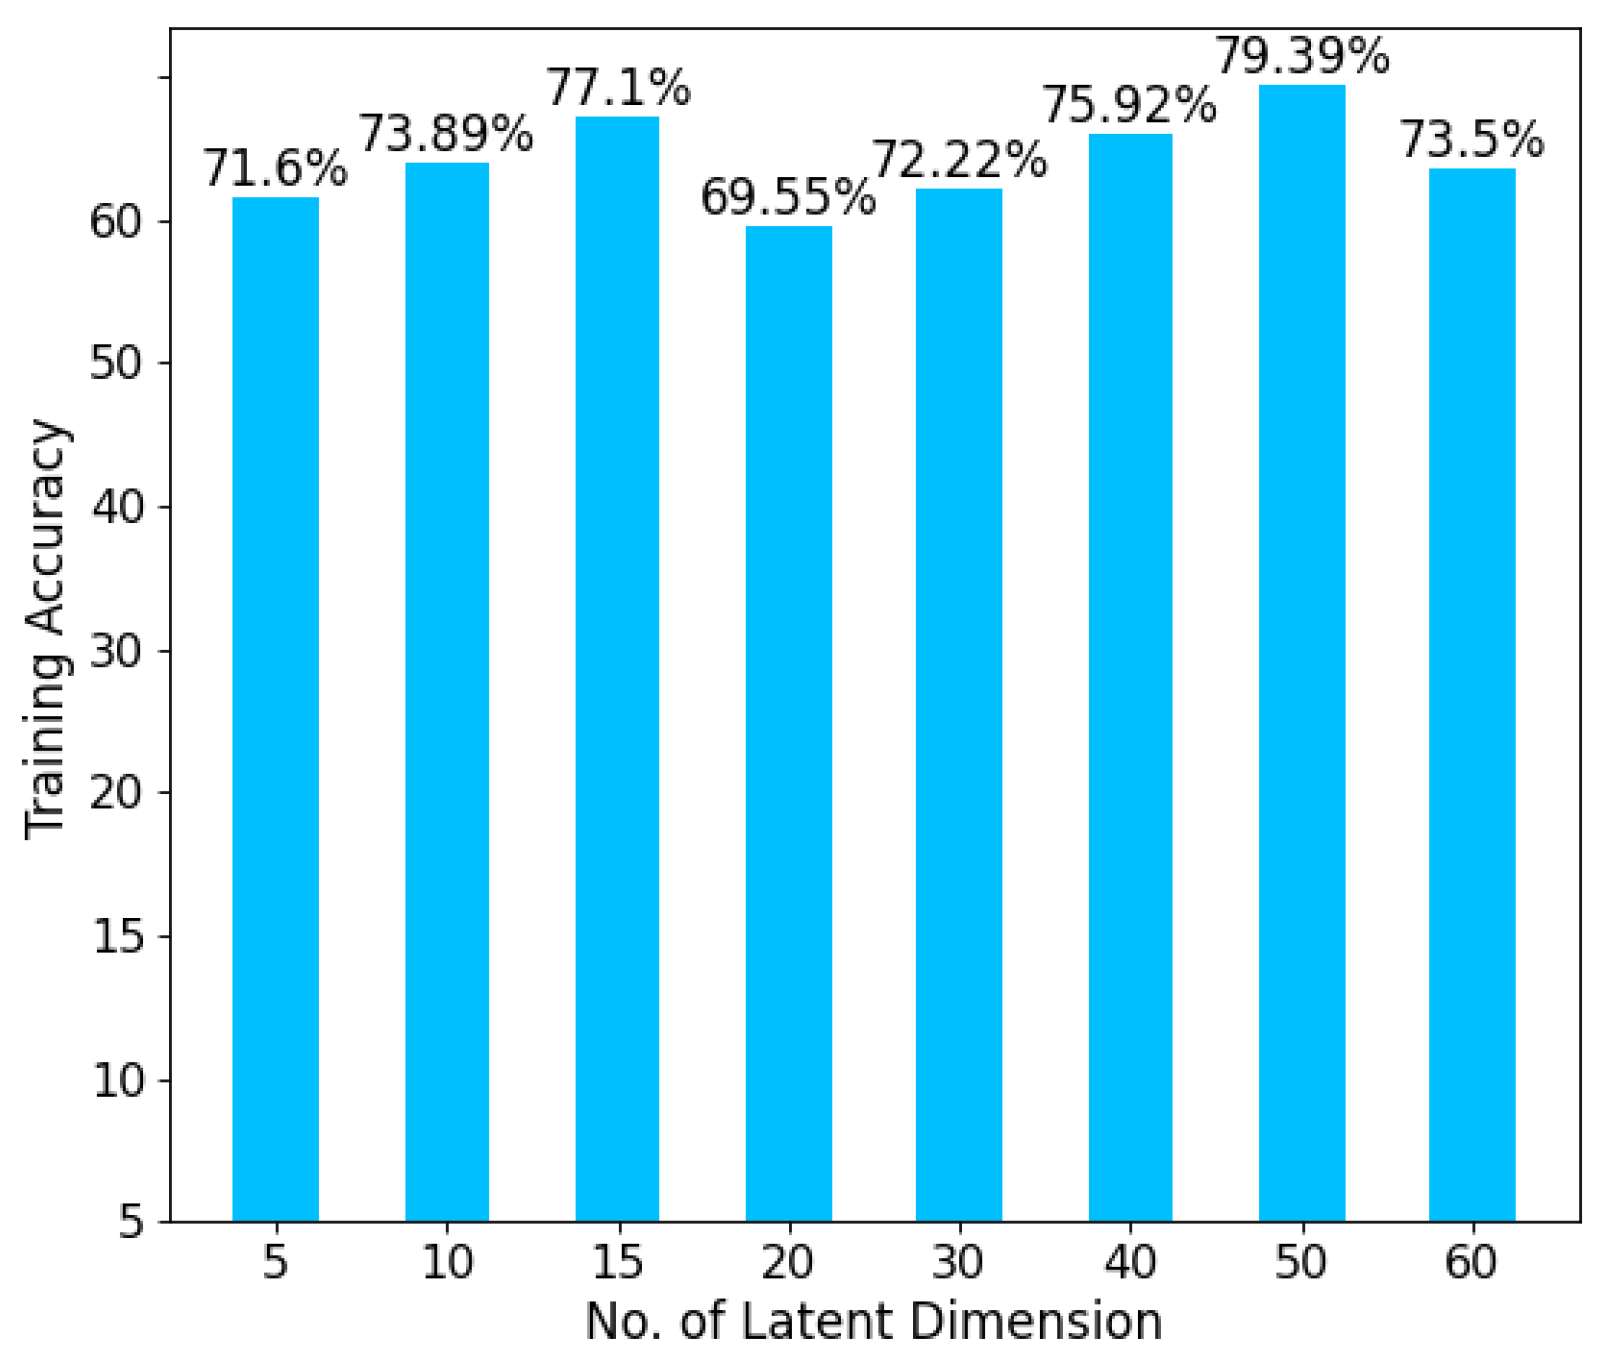
It was found that the accuracy is higher when the data were vectorized. In order to identify the optimum number of encoded features and latent dimensionality in the unsupervised CVAE architecture, a systematic search was conducted. As such, the number of latent features varied from five to sixty with a varied step size of five and ten. It was observed that the classification performance is highly dependent on the latent space dimensionality. A comparison of the effect of latent space dimensionality on the frame-based accuracy is shown in
Figure 18. From the above result, it is evident that the extracted features with a latent dimensionality of 50 have the highest training accuracy (79.39%) among other latent dimensions.
In the CVAE architecture, the activation function of type ‘relu’ is chosen to build the encoder and decoder, and the regularization L1 (Lasso Regression) is used to avoid overfitting in the network. The Adam optimizer is used to optimize the training of the network. To avoid the exploding gradients, the clipnorm value is used to keep the gradient under the limit. The number of epochs was estimated by trial-and-error (80 in this experiment) and the best results obtained were with a learning rate of 0.00001 with a batch size of 32.
In the case of the CVAE model with supervised feature extraction, the series of frames for each activity type were considered separately. Then, each class data were used to train a CVAE model, resulting in four models for feature extraction. The optimum number of latent dimensions of five provided good results for all four activities. For training the CVAE models, minor changes were applied to the same architecture of the CVAE model that was used for the unsupervised analysis. For the model trained using the sitting dataset, the learning rate was decreased to 0.0001, the number of epochs was increased to 40, and the batch size was 16. The drop out of 0.2 was applied after batch normalization for the optimum result. The learning rate of 0.001 was used for all three of the other CVAE models of the sit-to-stand, walking, and falling activities. The number of epochs was 40, 20, and 20 for sit-to-stand, walk, and fall, respectively. The sit-to-stand and walk activities had a batch size of sixteen, whereas falling had a batch size of eight. L2 kernel regulization was applied to all the layers. The optimization was performed at both the architectural and hyperparameter levels to reduce the overfitting problem. As the feature space is very large due to the high dimension of the data, the architecture level optimization was carried out by the attentive step-by-step observation whereas, the hyperparameter tuning was carried out using a grid search where the parameters were tuned between a given range.
As explained in the above section, the accuracy evaluation of the DTW algorithm is performed using frame-based and activity-based criteria for all three types of inputs—UnSup-PLevel, UnSup-EnLevel, and Sup-EnLevel features.
Table 4 presents a comparison of the frame-based training and test accuracy. It illustrates the effectiveness of the Sup-EnLevel feature extraction, which was trained with four CVAE models and combined with DTW, as depicted in
Figure 8. This approach outperformed the other two strategies during training. However, it is worth noting that the UnSup-PLevel method consistently demonstrated a strong performance in both training and test scenarios, without the need for annotations.
The evaluation results for the activity-based criteria are shown in
Table 5 and
Table 6. They are calculated based on the number of activities for which of their frames were correctly classified. The results suggest that the analysis pipeline based on UnSup-PLevel input to DTW without any feature extraction was comparable to the other analysis pipeline based on Sup-EnLevel extracted features for the classification. Among all activity types, the testing accuracy results suggest that DTW has poorly recognized the sit-to-stand activity using all three types of inputs. That is due to the nature of this activity, seen in a few frames, being labelled subjectively, as it includes the transition from sitting to standing, which is not easy to judge explicitly. In the case of other activities, DTW worked reasonably well using the UnSup-PLevel and Sup-EnLevel features.
4.2. Experimental Results Based on LSTM and the Equalized Series
The data with equalized frame series of activities have 100 series of 24 frames each. The interpolation and extrapolation of each series of activities were performed by applying the gradient-based frame equalization.
The train, validation, and test data distribution in the equalized series data was performed with manual splitting of the data samples by using prior knowledge; however, the frames per activities series were not shuffled, as the series of activities frames is in the form of time series. In the case of time series classification, the past data frames are essential to predict the future frame class. To extract features from the series of frames, four different strategies were considered as described earlier in
Section 3.2. First, a CNN-LSTM model was trained including both feature extraction (CNN layers) and prediction based on the time-series of features (LSTM layers). This was shown in
Figure 11. In this case, the weights of the whole model are learned all at the same time, based on the optimization of the network. In the other three methods, the feature extraction was conducted separately and then the learned features were fed into the LSTM model as shown in
Figure 9,
Figure 11 and
Figure 13. The three feature extraction methods include Unsup-EnLevel, Sup-EnLevel and PCA. All the models were trained using training (80%) and validation data. The validation data were 15% of the training data. Then, they were tested using the test set (20%). The evaluation of the results and the computation of activity detection performance are conducted by comparing the result with manually annotated labels.
To implement the feature extraction methods, the mm-wave radar frames values are normalized between the range of −1 to 1 and the labels were converted into one hot encoder for the better result.
The CNN-LSTM model has a batch size of 4 and the model was trained over 1000 epochs with a callback of early stopping, when the model stops improving. The learning rate was kept at 0.0001 and the RMSProp was used as an optimizer. The ReLu activation function was used for the hidden layers. To avoid the issue of overfitting, a layer of batch normalization is added after each convolutional layer in each block. A drop out ratio of 0.05 is added after each maxpooling layer.
The unsupervised CVAE was performed to extract highly effective features. In this model, the latent dimension of 50 provided a better result. All other specifications of the CVAE model were kept exactly the same as the UnSup-EnLevel model. The output is in the form of
, where 2400 is the number of samples and 50 represents the extracted features. After dividing the data manually into train and test sets as shown in
Table 2, the training data had the shape of
and the test data had the shape of
. The size of the validation set is
. The model used an RMSProp optimizer and categorical cross entropy as a loss function. The learning rate is kept at 0.00001 and the batch size is 4. A sequential model of two LSTM layers was built for the classification as shown in
Figure 9.
While extracting features from the supervised CVAE, four different models for each class have been trained. The specification of each model is kept the same as the Sup-EnLevel feature extraction. In the equalized frame activity series, there are, in total, 2400 frames that belong to one of the four classes. In the equalized data, the sitting activity has 596 frames, sit-to stand has 466 frames, walking has the highest number of frames with 926, and the falling activity has 412 frames. The train and validation frames are used for developing the four CVAE models. The latent dimension is kept at 5 for this model. In order to train the supervised CVAE-LSTM framework, a combination of and kernel normalization was used, where is kept at 0.0005 and was 0.001. Each convolutional layer in the supervised CVAE was followed by batch normalization and drop out ratio. The drop out ratio was kept 0.6, 0.7, 0.4, and 0.7 for sit, sit-to-stand, walk, and fall, respectively.
PCA was employed using the Scikit library in Python. One of the conditions for using PCA for the feature selection is that the number of maximum selected features is based on the minimum value between number of samples (2400 in our case) and number of available features (4096), so the possible optimal number of features would be less than 2400. In this case, we have used three principal components (PCs) setups—256 (
), 1296 (
), and 2116 (
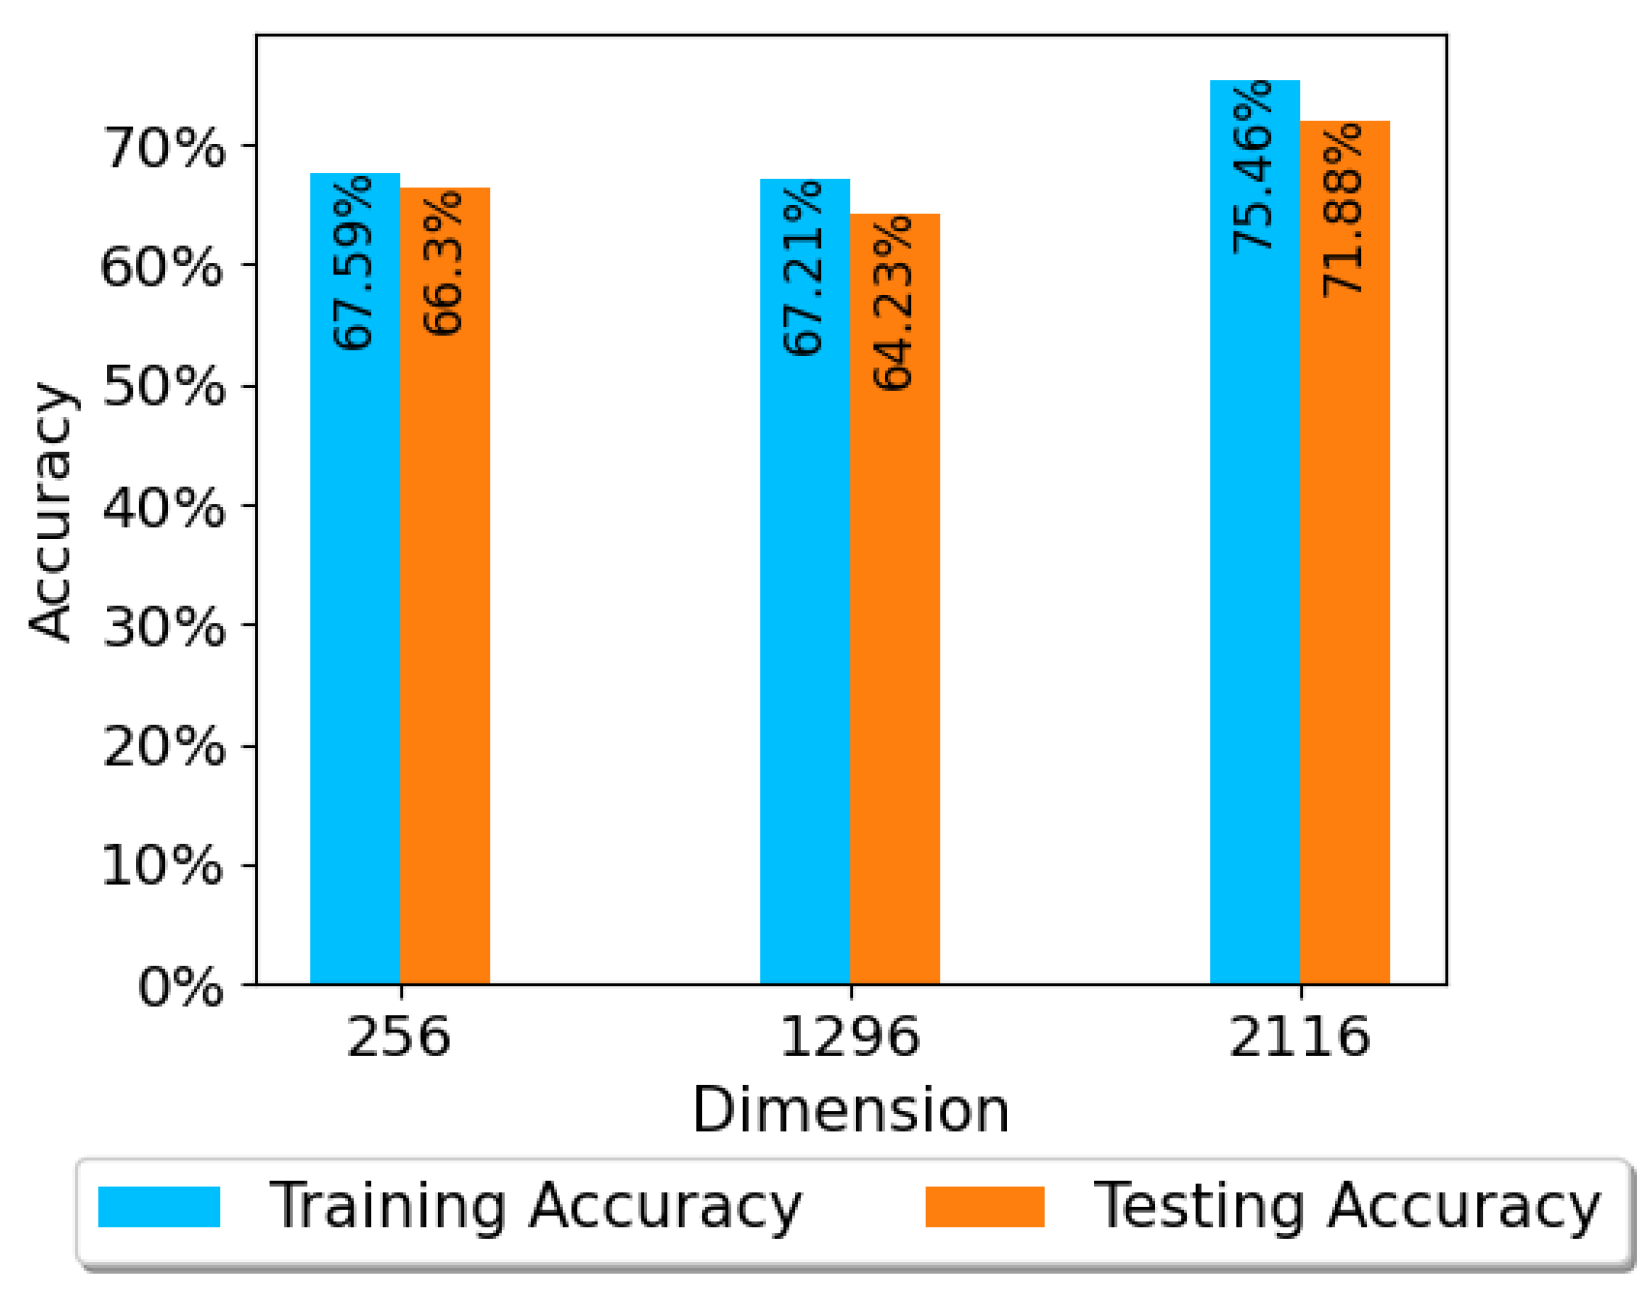
)—in which the data were reshaped for the LSTM architecture. In order to select the optimum number of PCs, the model accuracy was validated using three different numbers of components. The result of the PCA approach for a different number of components is presented in
Figure 19. The Figure shows that selecting 2116 PCs achieved the highest accuracy among all three approaches.
The result of the four approaches to feature extraction and time-series prediction based on LSTM at frame-level test accuracy is provided in
Table 7 below. The extracted features were fed to the LSTM network for the classification of four activities, i.e., sitting, sit-to-stand, walking, and falling. Activity-level train and test classification accuracy by the LSTM network for four inputs (features extracted by CNN, UnSUp-EnLevel, Sup-EnLevel and PCA) are reported in
Table 8 and
Table 9. Out of all the feature extraction strategies, Sup-EnLevel strategy along with LSTM excelled in the classification of continuous HAR.
Figure 20 displays the confusion matrix for the most effective Sup-Enlevel approach employing LSTM. Within this matrix, it becomes evident that sitting activity frames are often confused with the sit-to-stand activity. Similarly, sit-to-stand activity is primarily misidentified as walking or sitting. In the case of walking, it tends to be misclassified as sit-to-stand, while instances of falling are mistakenly categorized as any of the other three activities. It is noteworthy that, in most instances, misclassifications occur during transitions between activities.
4.3. Discussion
At present, HAR is a well-researched area with a vast number of research studies, but HAR for the elderly population is still a challenging problem. Most studies use the recordings of individual activities. The continuous recording of activities for HAR in this work makes the problem more challenging and different from other studies, which use individual activity recordings as input for HAR.
A comparison of the activity classification results presented in the previous section showed that the model based on the extracted features using unsupervised CVAE and LSTM for prediction achieved the lowest accuracy, even when the optimum latent dimension was used. That is because of the high level of diversity among the input frames, given the nature of the four activities. This heterogeneity influences the CVAE model’s capability to generalize well. An improvement was achieved after separating the data of each activity (except the challenging class of sit-to-stand, as discussed earlier) and developing the feature extraction models based on the individual activities’ data.
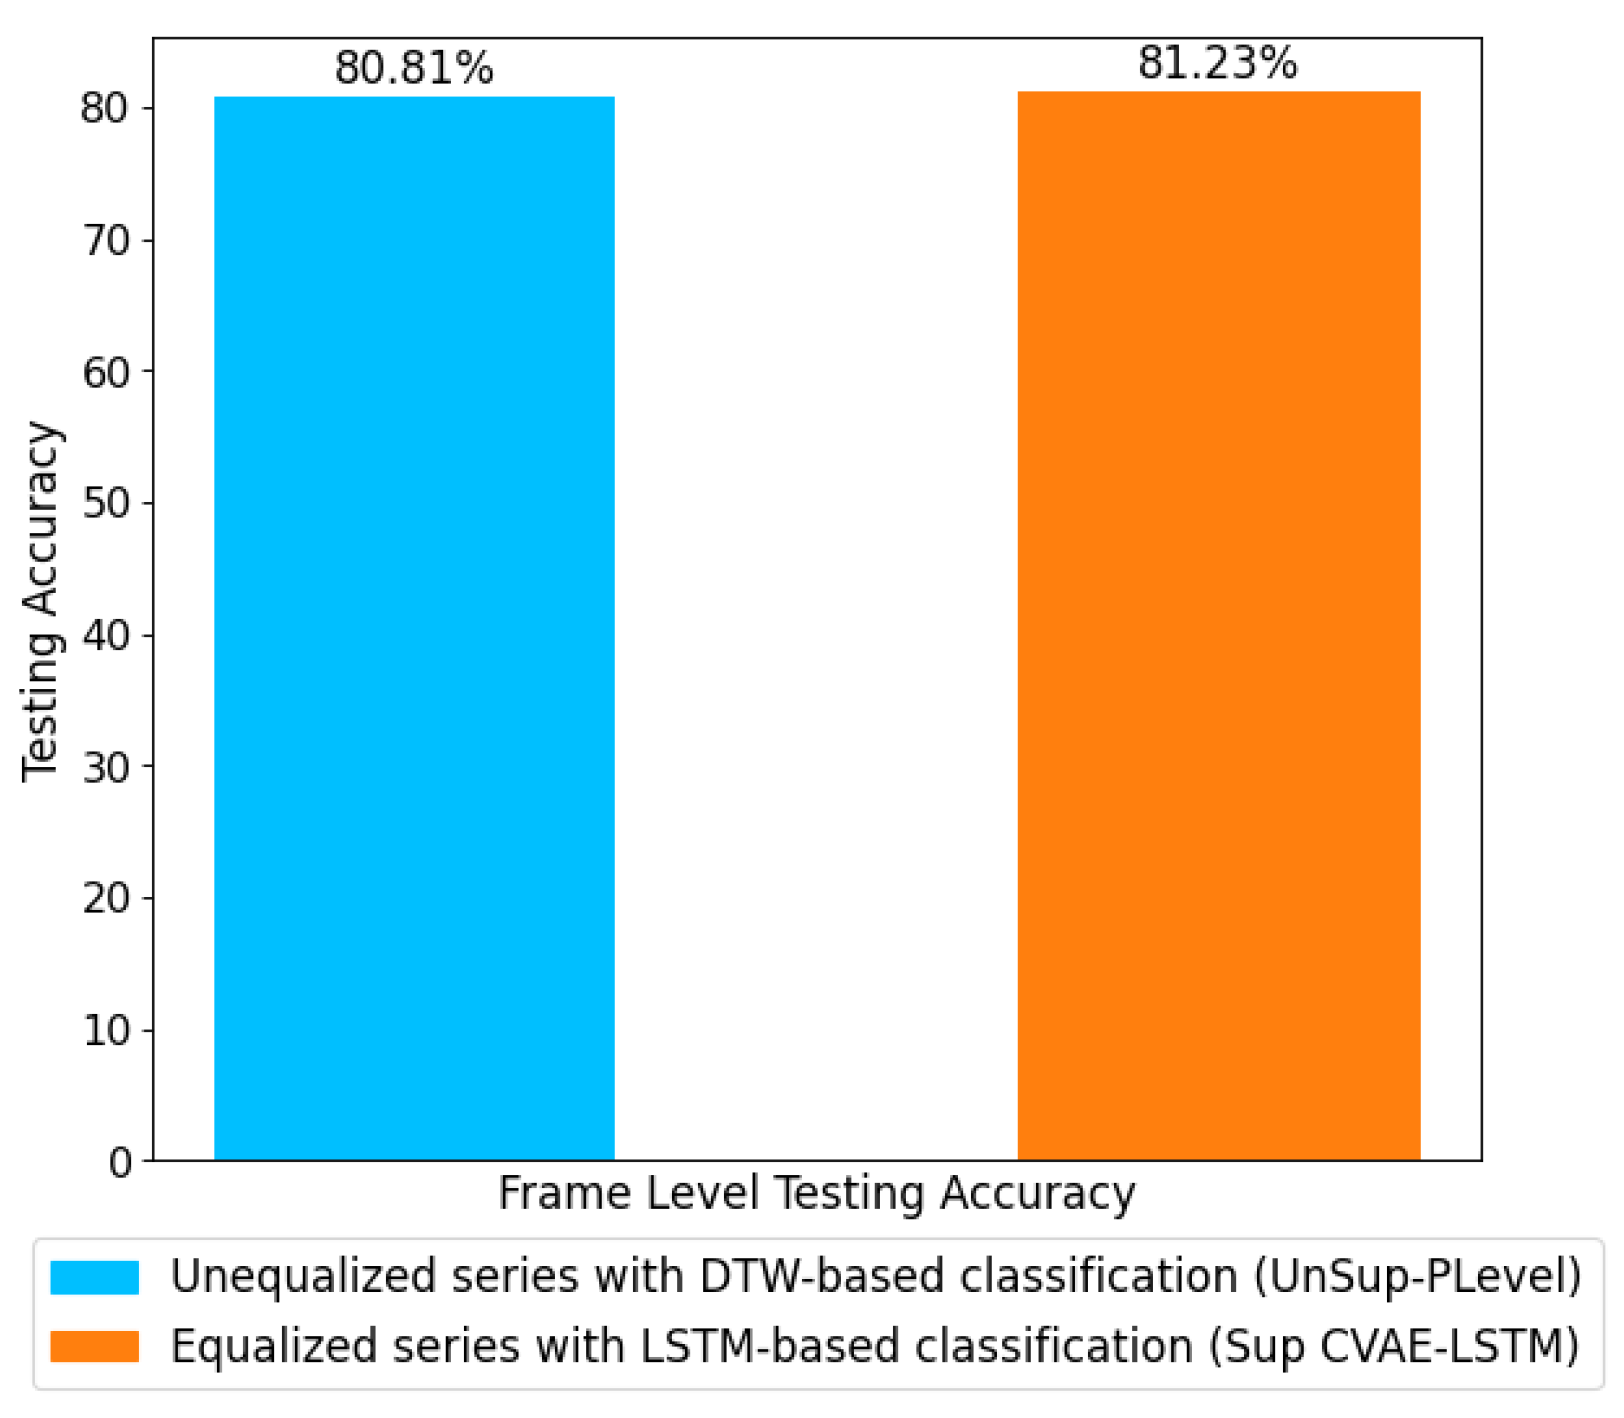
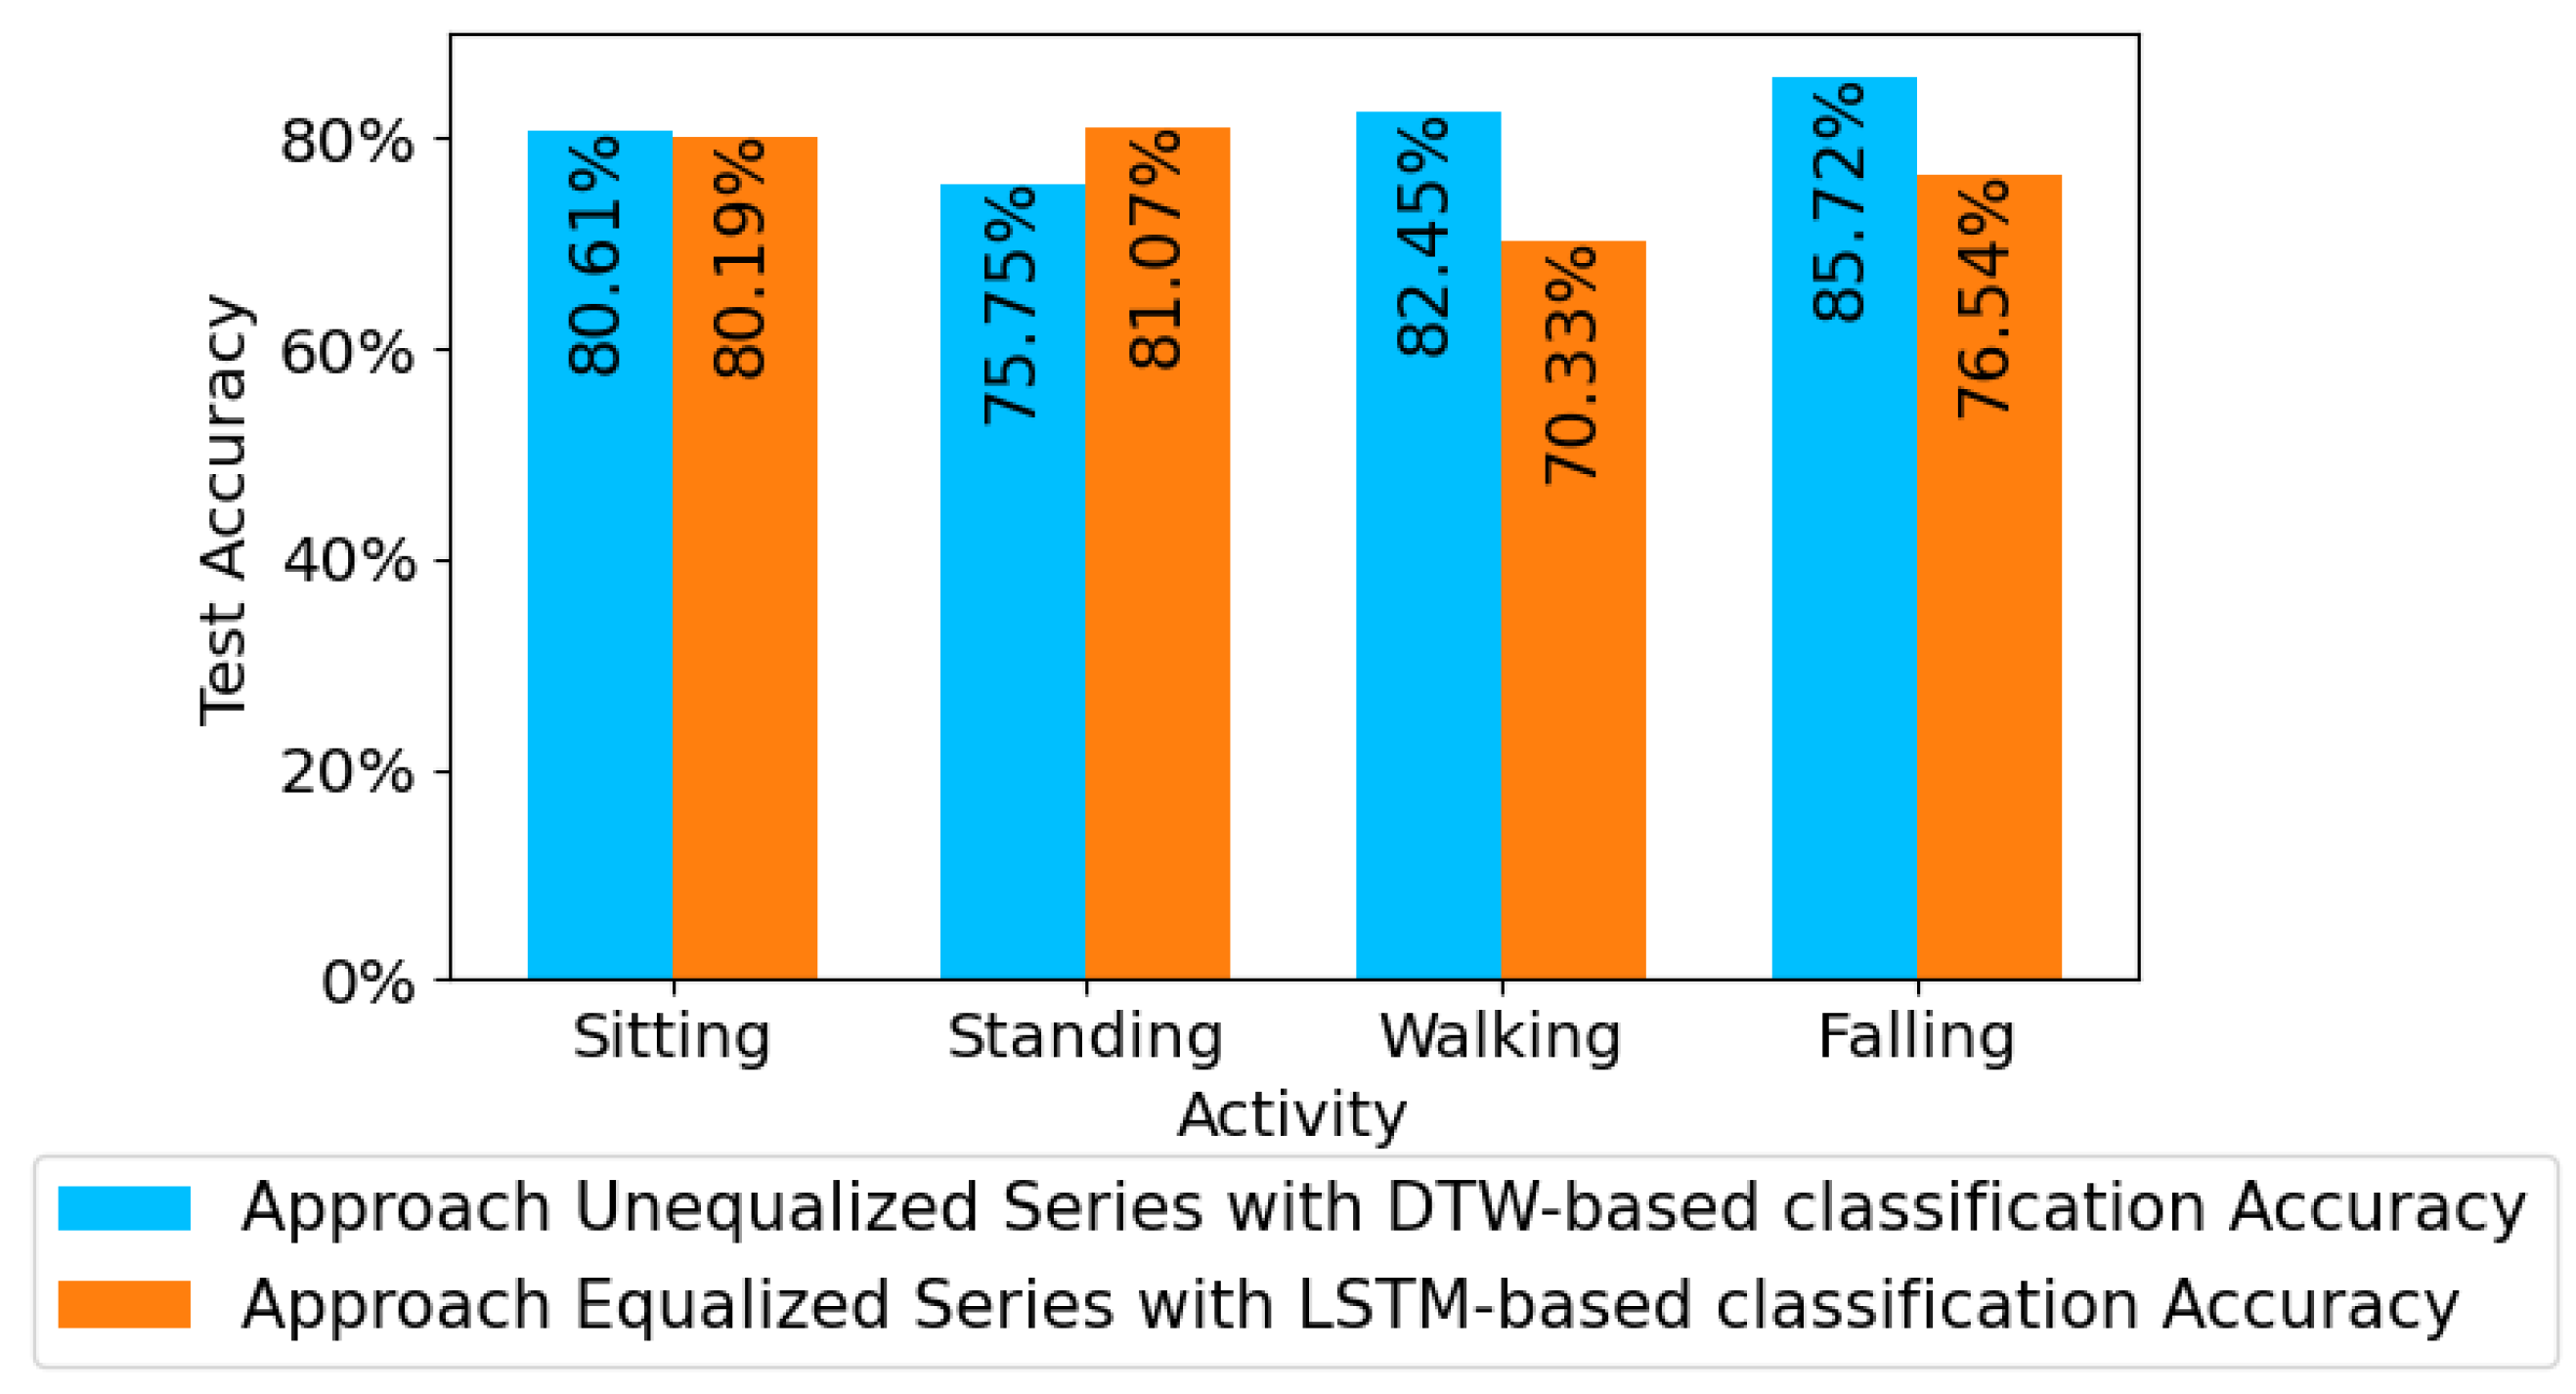
It is expected that the training data for a CVAE model would include more similar frames, each describing different variations of the same activity type. That is the case for less dynamic activities, such as sitting, where most frames are similar. However, for more dynamic activities, such as walking and especially falling, that is not the case as the frames might include significantly different patterns during the fall. That can influence the success and generalization of the CVAE model for feature extraction. The feature extraction with CNN provided reliable results, but it could not outperform supervised CVAE feature extraction. Due to the complexity of the NN models and the limited samples, separating the feature extraction architecture and the time-series architecture would reduce the complexity of each model and allow for better learning of the weights. Other feature extraction strategies will be explored in our future work to consider the series of frames and their sequential dependencies rather than the individual frames. The sup-EnLevel approach with equalized series data has a superior performance to the Unsup-PLevel approach, which is the best-performing approach with unequalized series data at the frame-level evaluation. Overall, supervised CVAE feature extraction performed well with both DTW and LSTM classification. However, as illustrated in
Figure 21 and
Figure 22, the most successful supervised CVAE-LSTM strategy has outperformed the most successful UnSup-PLevel DTW technique. This implies that the distance-based and easy-to-implement DTW strategy was effective, but the more complex LSTM classification model performed better. In
Section 4, it is evident that, when combined with Sup-EnLevel feature extraction and LSTM, the utilization of gradient-based series equalization enhances the probability of achieving accurate continuous human activity recognition (HAR). This comparison supports future studies on continuous human activity detection.
None of the algorithms could classify all the activities of the series correctly and, for each series, there exist some incorrectly classified frames. The misclassification mainly occurred at the transition points from one activity to the other, whereas the middle frames of the activities were classified with high accuracy. This observation is crucial for designing future HAR classification strategies for continuous frame streams. The limited data with high feature space and subjective manual labeling also hves a potential impact on the results. Another limitation of this study is that it deals with only four human activities and with only one distress condition (fall). In future studies, more types of activities will be included to accommodate the day-to-day patterns of gestures.

 ,
, 


