

Sensor Fusion for Occupancy Estimation: A Study Using Multiple Lecture Rooms in a Complex Building


Abstract
:1. Introduction
- How much can the occupancy estimation accuracy be improved using multiple sensors?
- How can one single model be trained for all rooms in a building?
- How does the quality of the estimation in a room behave when only using data from other rooms?
2. Materials and Methods
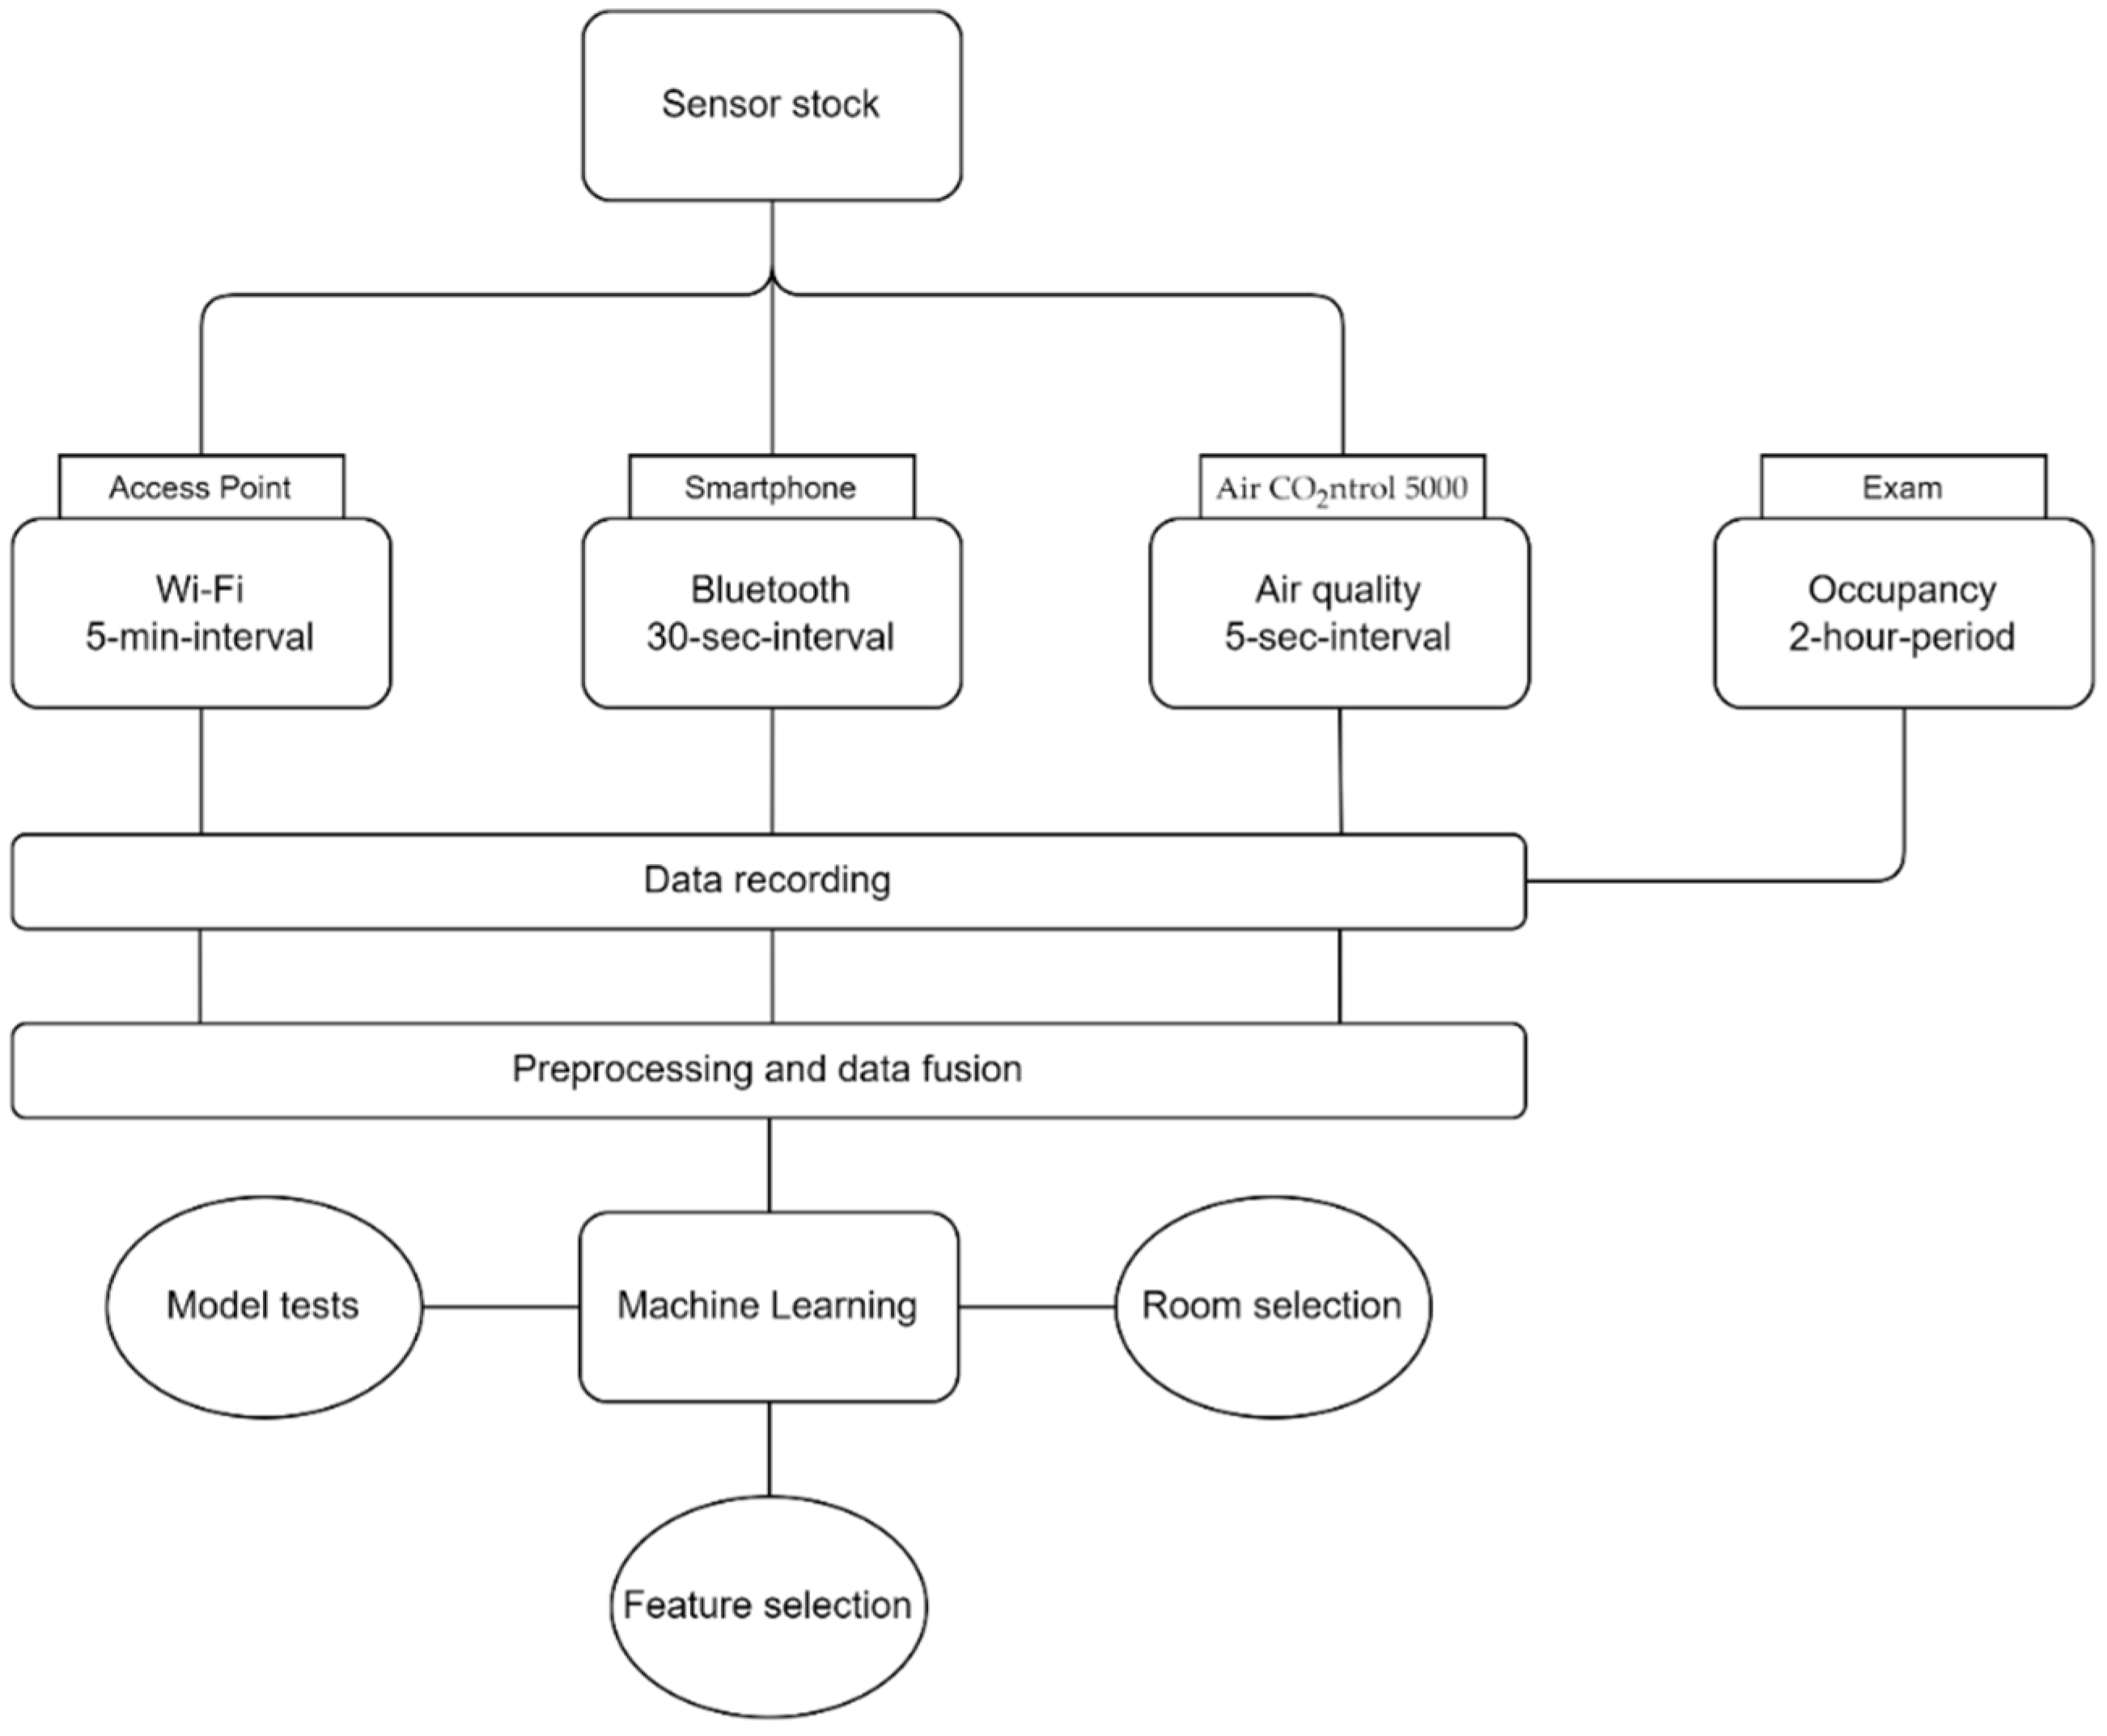
2.1. Methodology
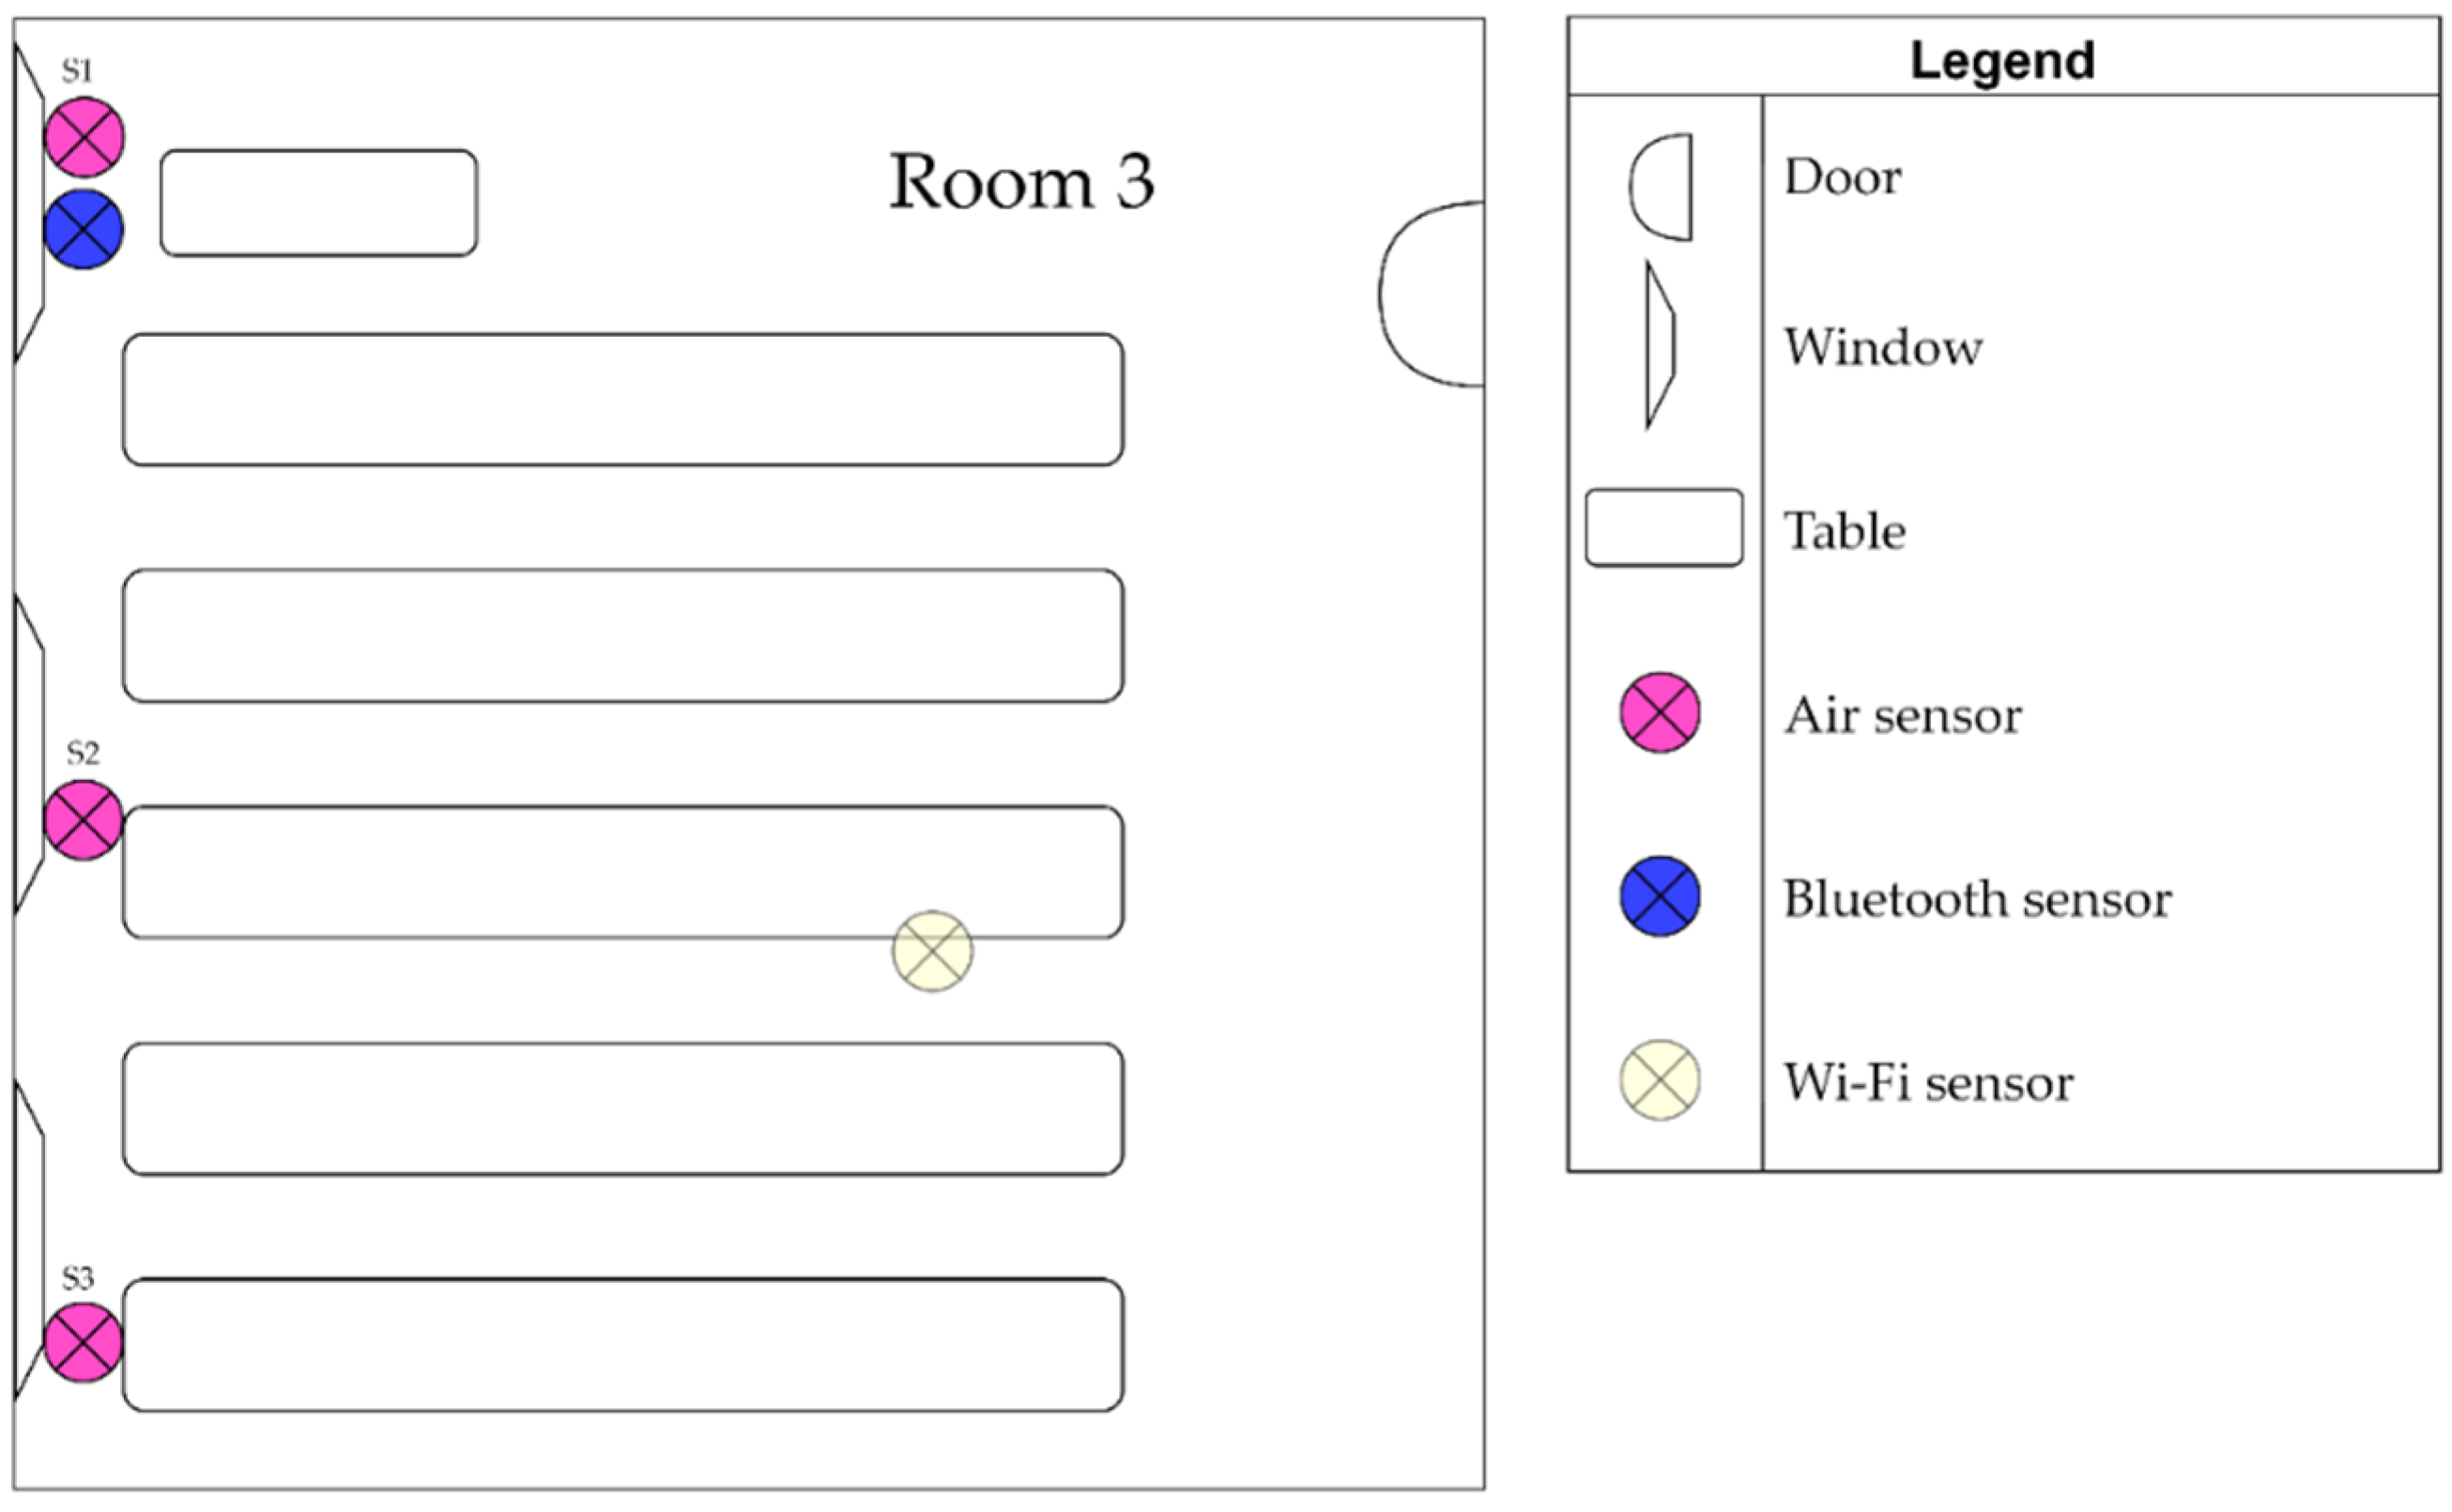
2.2. Data Recording
2.3. Preprocessing
2.4. Machine Learning Approach
3. Results and Discussion
4. Conclusions and Future Work
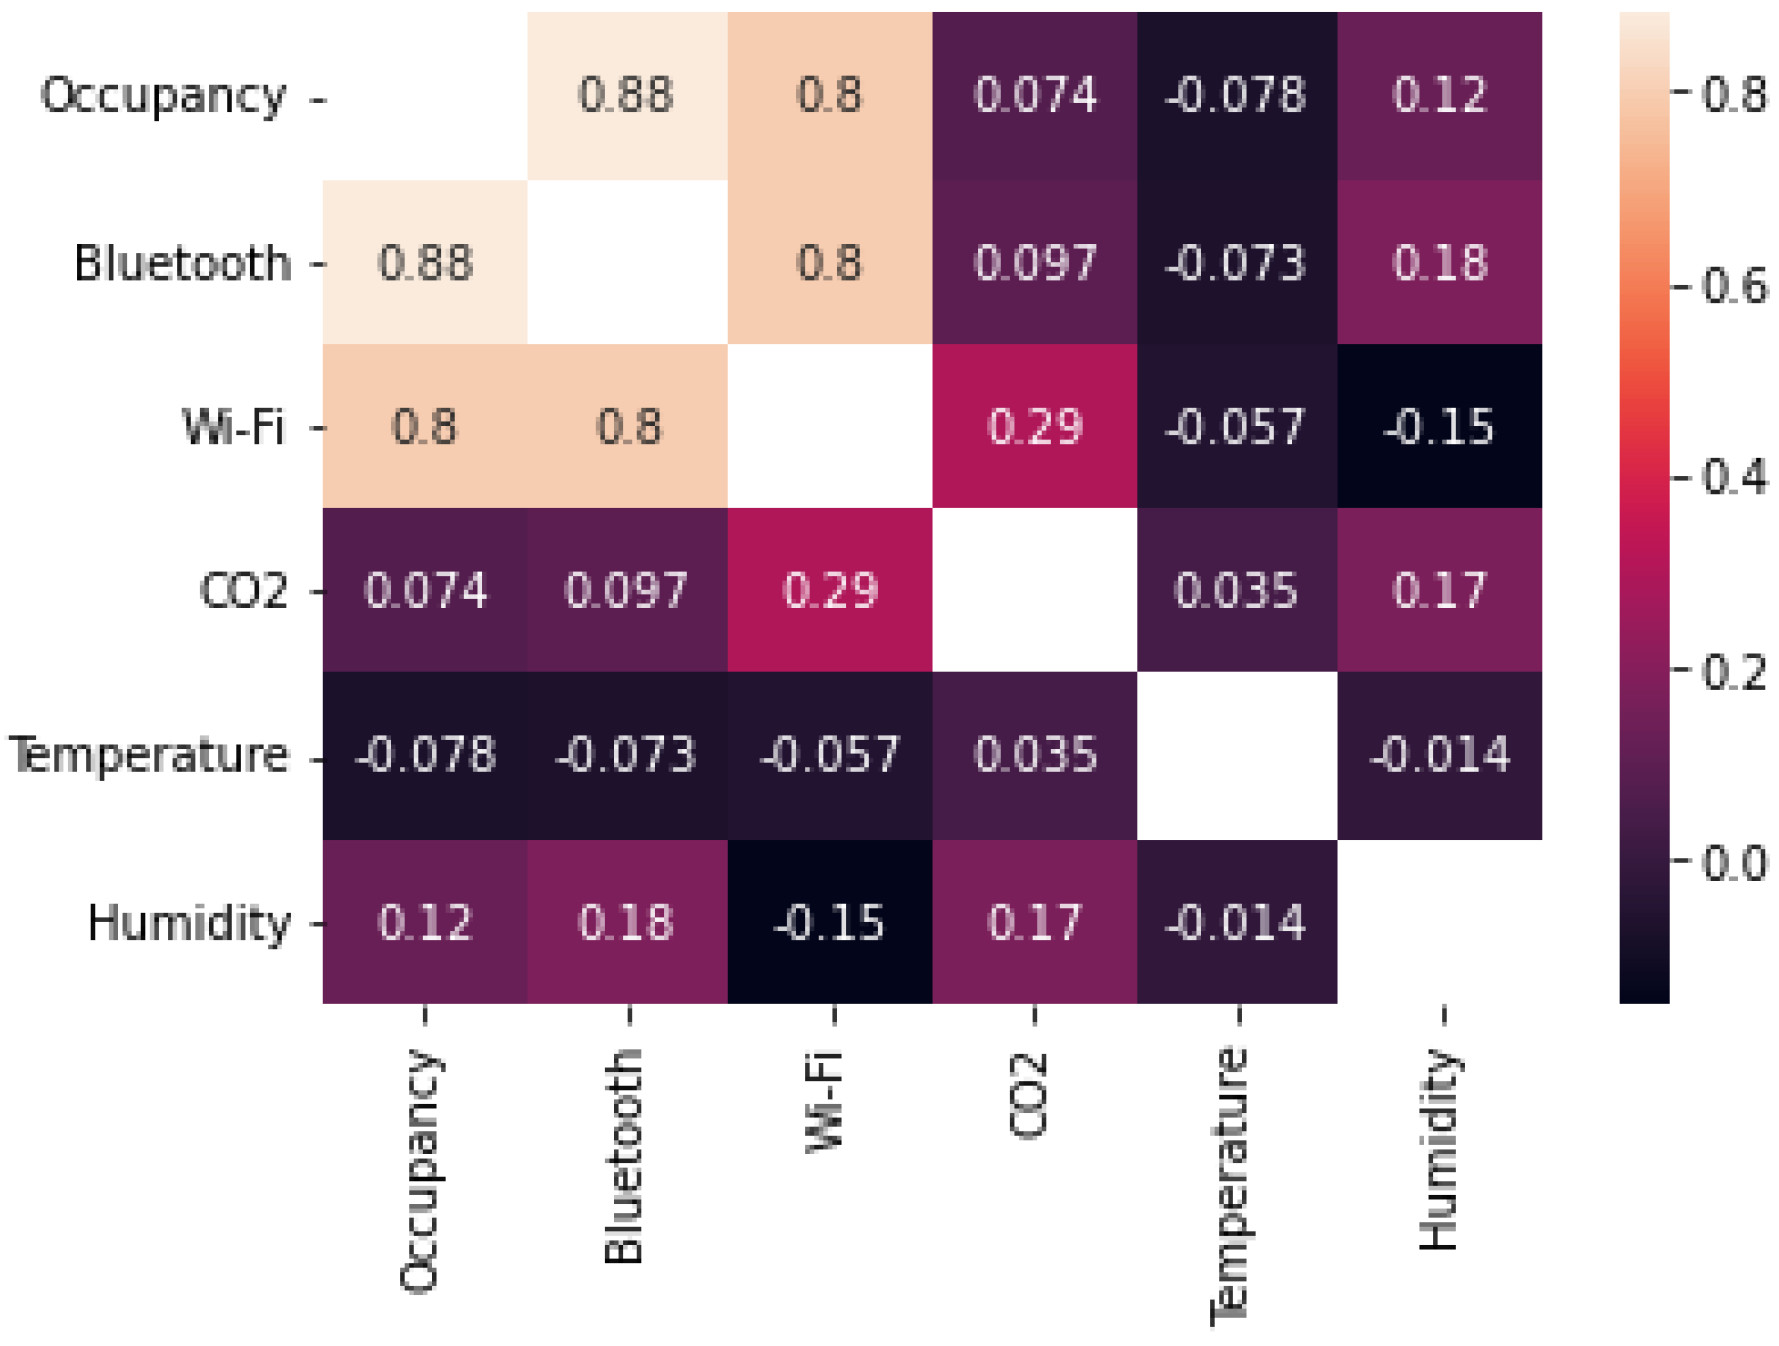
- Wherever applicable, due to infrastructure, multiple sensors should be used for data gathering. The quality of estimation always benefits from combining different sensors, compared to models with only one sensor. However, using all sensors might not be the best solution. Through test cases, the best combination of different sensors should be determined. In the case of our study, we improved the RMSE from 17.4 to 6.2, combining different features compared to only using one feature.
- It is possible to train a single model for all rooms in a building. However, the model must be trained with data from all rooms in the building, which may lead to higher costs in bigger buildings with more rooms. This leads to our final finding.
- When defining training data for the model, the dataset should contain data from every room. A trained model from certain rooms shows no convincing results when tested in a new unknown room. This shows the complex differences in infrastructure inside a building. By only testing their model on one or two rooms, almost all studies did not respect this factor. For smaller buildings with fewer rooms, the effort would be manageable. For bigger buildings, sensors should be integrated into infrastructure and the data readings should be as automatic as possible to minimize effort.
Author Contributions
Funding
Data Availability Statement
Acknowledgments
Conflicts of Interest
References
- Ahmad, J.; Larijani, H.; Emmanuel, R.; Mannion, M.; Javed, A. Occupancy detection in non-residential buildings—A survey and novel privacy preserved occupancy monitoring solution. Appl. Comput. Inform. 2020, 17, 279–295. [Google Scholar] [CrossRef]
- Filippoupolitis, A.; Oliff, W.; Loukas, G. Bluetooth Low Energy based Occupancy Detection for Emergency Management. In Proceedings of the 15th International Conference on Ubiquitous Computing and Communications and 8th International Symposium on Cyberspace and Security, Los Alamitos, CA, USA, 14–16 December 2016. [Google Scholar] [CrossRef]
- Tekler, Z.D.; Low, R.; Gunay, B.; Andersen, R.K.; Blessing, L. A Scalable Bluetooth Low Energy Approach to Identify Occupancy Patterns and Profiles in Office Spaces. Build. Environ. 2020, 171, 106681. [Google Scholar] [CrossRef]
- Guillaume, A.-A. Estimating Occupancy Using Indoor Carbon Dioxide Concentrations Only in an Office Building: A Method and Qualitative Assessment. In Proceedings of the 11th REHVA World Congress “Energy Efficient, Smart and Healthy Buildings”, Prague, Czech Republic, 16–19 June 2013. [Google Scholar]
- Alam, A.G.; Rahman, H.; Kim, J.-K.; Han, H. Uncertainties in neural network model based on carbon dioxide concentration for occupancy estimation. J. Mech. Sci. Technol. 2016, 31, 2573–2580. [Google Scholar] [CrossRef]
- Melfi, R.; Rosenblum, B.; Nordman, B.; Christensen, K. Measuring Building Occupancy Using Existing Network Infrastructure. International Green Computing Conference and Workshops, Orlando, FL, USA. 25–28 July. [CrossRef]
- Lee, S.; Ha, K.N.; Lee, K.C. A pyroelectric infrared sensor-based indoor location-aware system for the smart home. IEEE Trans. Consum. Electron. 2006, 52, 1311–1317. [Google Scholar] [CrossRef]
- Diaper, G. The Hawthorne Effect: A fresh examination. Educ. Stud. 1990, 16, 261–267. [Google Scholar] [CrossRef]
- Wolf, S.; Cali, D.; Krogstie, J.; Madsen, H. Carbon dioxide-based occupancy estimation using stochastic differential equations. Appl. Energy 2019, 236, 32–41. [Google Scholar] [CrossRef]
- Simma, K.C.J.; Mammoli, A.; Bogus, S.M. Real-Time Occupancy Estimation Using WiFi Network to Optimize HVAC Operation. Procedia Comput. Sci. 2019, 155, 495–502. [Google Scholar] [CrossRef]
- Yang, Z.; Li, N.; Becerik-Gerber, B.; Orosz, M. A Multi-Sensor Based Occupancy Estimation Model for Supporting Demand Driven HVAC Operations. In Proceedings of the 2012 Symposium on Simulation for Architecture and Urban Design, Orlando, FL, USA, 26–30 March 2012; pp. 49–56. [Google Scholar]
- Benezeth, Y.; Laurent, H.; Rosenberger, C. Towards a sensor for detecting human presence and characterizing activity. Energy Build. 2011, 43, 305–314. [Google Scholar] [CrossRef]
- Munoz-Salinas, R.; Medina-Carnicer, R.; Madrid-Cuevas, F.J.; Carmona-Poyato, A. People detection and tracking with multiple stereo cameras using particle filters. J. Vis. Commun. Image Representat. 2009, 20, 339–350. [Google Scholar] [CrossRef]
- Wang, F.; Feng, Q.; Chen, Z.; Zhao, Q.; Cheng, Z.; Zou, J.; Zhang, Y.; Mai, J.; Reeve, H. Predictive control of indoor environment using occupant number detected by video data and CO2 concentration. Energy Build. 2017, 145, 155–162. [Google Scholar] [CrossRef]
- Zhang, R.; Lam, K.P.; Chiou, Y.-S.; Dong, B. Information-theoretic environment features selection for occupancy detection in open office spaces. Build. Simul. 2012, 5, 179–188. [Google Scholar] [CrossRef]
- HPE—Hewlett Packard Enterprise Development LP. Aruba 7000 Series Mobility Controllers. 2022. Available online: https://www.arubanetworks.com/assets/ds/DS_7000Series.pdf (accessed on 20 July 2022).
- Google LLC. Flutter. Available online: https://flutter.dev/ (accessed on 17 August 2022).
- Iotbymukund. How to Calculate Distance from the RSSI value of the BLE Beacon. 2016. Available online: https://iotandelectronics.wordpress.com/2016/10/07/howto-calculate-distance-from-the-rssi-value-of-the-ble-beacon/ (accessed on 19 July 2022).
- Roussel, C.; Ruthmann, S.; Klauer, T.; Czommer, R. Practical Indoor Navigation for Smartphones Based on a Metrological Investigation. AGIT J. Appl. Geoinform. 2021, 7, 26–35. [Google Scholar] [CrossRef]
- Teleszewski, T.; Gładyszewska-Fiedoruk, K. The concentration of carbon dioxide in conference rooms: A simplified model and experimental verification. Int. J. Environ. Sci. Technol. 2019, 16, 8031–8040. [Google Scholar] [CrossRef] [Green Version]
- OGC. OGC SensorThings API. Available online: https://www.ogc.org/standards/sensorthings (accessed on 17 August 2022).


| Date | Time | Identifier | Room Size [m2] | People in Exam |
|---|---|---|---|---|
| 4 July 2022 | 09:47–12:32 | Room 1 | 407.75 | 49 |
| 6 July 2022 | 07:25–10:25 | Room 1 | 407.75 | 58 |
| 6 July 2022 | 10:13–12:58 | Room 2 | 59.61 | 6 |
| 7 July 2022 | 11:35–14:21 | Room 3 | 59.01 | 16 |
| 8 July 2022 | 08:25–12:30 | Room 4 | 90.23 | 15 |
| 8 July 2022 | 12:30–17:01 | Room 4 | 90.23 | 25 |
| 11 July 2022 | 08:33–11:24 | Room 3 | 59.01 | 10 |
| 12 July 2022 | 08:28–11:44 | Room 5 | 78.40 | 12 |
| 12 July 2022 | 11:52–14:49 | Room 2 | 59.61 | 13 |
| 13 July 2022 | 08:40–11:50 | Room 5 | 78.40 | 22 |
| 14 July 2022 | 09:29–12:05 | Room 5 | 78.40 | 18 |
| 14 July 2022 | 12:05–14:19 | Room 5 | 78.40 | 8 |
| 15 July 2022 | 08:42–11:27 | Room 1 | 407.75 | 45 |
| Attribute | Feature Importance | Standard Error | p-Value |
|---|---|---|---|
| Bluetooth | 10.82 | 0.336 | 0.000 |
| Wi-Fi | 1.59 | 0.361 | 0.000 |
| Carbon dioxide | −1.03 | 0.287 | 0.000 |
| Temperature | −0.28 | 0.259 | 0.283 |
| Relative humidity | 0.47 | 0.286 | 0.098 |
| Test Room | Training | Testing | RMSE | CV [%] |
|---|---|---|---|---|
| Room 1 | 0.70 | −2.10 | 31.4 | 82.6 |
| Room 2 | 0.68 | 0.67 | 2.7 | 38.6 |
| Room 3 | 0.71 | −1.82 | 8.5 | 77.3 |
| Room 4 | 0.78 | −0.05 | 10.4 | 74.3 |
| Room 5 | 0.85 | −2.81 | 13.6 | 123.6 |
Publisher’s Note: MDPI stays neutral with regard to jurisdictional claims in published maps and institutional affiliations. |
© 2022 by the authors. Licensee MDPI, Basel, Switzerland. This article is an open access article distributed under the terms and conditions of the Creative Commons Attribution (CC BY) license (https://creativecommons.org/licenses/by/4.0/).
Share and Cite
Roussel, C.; Böhm, K.; Neis, P. Sensor Fusion for Occupancy Estimation: A Study Using Multiple Lecture Rooms in a Complex Building. Mach. Learn. Knowl. Extr. 2022, 4, 803-813. https://doi.org/10.3390/make4030039
Roussel C, Böhm K, Neis P. Sensor Fusion for Occupancy Estimation: A Study Using Multiple Lecture Rooms in a Complex Building. Machine Learning and Knowledge Extraction. 2022; 4(3):803-813. https://doi.org/10.3390/make4030039
Chicago/Turabian StyleRoussel, Cédric, Klaus Böhm, and Pascal Neis. 2022. "Sensor Fusion for Occupancy Estimation: A Study Using Multiple Lecture Rooms in a Complex Building" Machine Learning and Knowledge Extraction 4, no. 3: 803-813. https://doi.org/10.3390/make4030039