Article

Modelling and Optimization of Machining of Ti-6Al-4V Titanium Alloy Using Machine Learning and Design of Experiments Methods

1
LABOMAP Laboratory, Arts Et Metiers Institute of Technology, HESAM University, Rue Porte de Paris, F-71250 Cluny, France
2
PIMM Laboratory, Arts Et Metiers Institute of Technology, CNRS, CNAM, HESAM University, 151 Boulevard de l’Hopital, F-75013 Paris, France
3
LAMPA Laboratory, Arts Et Metiers Institute of Technology, HESAM University, 2 Boulevard Du Ronceray, F-49035 Angers, France
*
Author to whom correspondence should be addressed.
J. Manuf. Mater. Process. 2022, 6(3), 58; https://doi.org/10.3390/jmmp6030058
Submission received: 1 March 2022 / Revised: 18 May 2022 / Accepted: 23 May 2022 / Published: 27 May 2022
(This article belongs to the Special Issue Advances in Modelling of Machining Operations)

Abstract

:
Ti-6Al-4V titanium is considered a difficult-to-cut material used in critical applications in the aerospace industry requiring high reliability levels. An appropriate selection of cutting conditions can improve the machinability of this alloy and the surface integrity of the machined surface, including the generation of compressive residual stresses. In this paper, orthogonal cutting tests of Ti-6Al-4V titanium were performed using coated and uncoated tungsten carbide tools. Suitable design of experiments (DOE) was used to investigate the influence of the cutting conditions (cutting speed Vc, uncut chip thickness h, tool rake angle γn, and the cutting edge radius rn) on the forces, chip compression ratio, and residual stresses. Due to the time consumed and the high cost of the residual stress measurements, they were only measured for selected cutting conditions of the DOE. Then, the machine learning method based on mathematical regression analysis was applied to predict the residual stresses for other cutting conditions of the DOE. Finally, the optimal cutting conditions that minimize the machining outcomes were determined. The results showed that when increasing the compressive residual stresses at the machined surface by 40%, the rake angle should be increased from negative (−6°) to positive (5°), the cutting edge radius should be doubled (from 16 µm to 30 µm), and the cutting speed should be reduced by 67% (from 60 to 20 m/min).

1. Introduction

Recently, the use of titanium and its alloys has increased, owing to its outstanding properties. It has been applied in many practical applications, such as those related to the aerospace, energy, and biomechanical sectors [1]. However, machining such alloys is always a big challenge, since their outstanding properties weaken the machining ability. The development of the additive manufacturing (AM) processes could be an alternative way to fabricate these difficult-to-machine materials into near-net shape parts. Nonetheless, finish machining is still required on the additive manufactured alloys to meet the dimensional and surface requirements of the application [2]. High cutting forces, high temperatures, high tool wear, machining vibrations, and poor machined surface integrity can be generated if the cutting conditions are not selected properly [3]. Therefore, researchers aimed to find the optimal cutting conditions (including the rake angle, clearance angle, cutting speed, uncut chip thickness, etc.) that minimise such machining outcomes.
Many experimental studies and numerical simulations of Ti-6Al-4V titanium alloy machining have been performed to investigate the influence of the cutting conditions on the major outcomes. Wyen and Wegener [4] investigated the influence of the cutting edge radius and cutting speed on the forces in orthogonal cutting of Ti-6Al-4V titanium alloy. For the range of cutting conditions that were investigated, they showed that both cutting and thrust forces increased with the cutting edge radius. They also showed that the cutting force decreased with the cutting speed, while the influence of the cutting speed on thrust force was non-linear and dependent on the cutting edge radius. Further analysis needs to be conducted to investigate this interaction between edge radius and cutting speed. Yen et al. [5] also found that both cutting and thrust forces increased as the cutting edge radius increased in the orthogonal cutting of AISI 1020 with uncoated cemented carbide. Fang and Wu [6] found that both cutting and thrust forces decreased with the cutting speed in the high-speed orthogonal cutting of Ti-6Al-4V titanium alloy using coated carbide tools.
The chip formation process of Ti-6Al-4V titanium alloy, which is affected by the mechanical behaviour (plasticity and fracture) of the work material [7], cutting regime parameters [8], tool geometry/material [8], and metalworking fluid [9], has been extensively studied. Li et al. [10] studied the serrated chip formation in orthogonal cutting of Ti-6Al-4V titanium alloy for different tool rake angles and cutting speeds using numerical simulation. The segmentation degree Gs was proposed to quantitatively characterize the chip geometry, which increased with the cutting speed and decreased with the tool rake angle. Hua and Shivpuri [11] used numerical simulation to investigate the crack initiation and propagation inside the FDZ in the orthogonal cutting of Ti-6Al-4V titanium alloy. The discontinuous chip was obtained at low cutting speed (1.2 m/min), and the serrated chip at high cutting speed (600 m/min). They observed that crack propagation changed from the chip root to the free surface of the deformed chip in FDZ when the cutting speed increased from 1.2 m/min to 600 m/min. Cotterell and Byrne [12] examined the chip geometry using a high speed camera, and deduced that chip segmentation frequency increased when the cutting speed increased from 4 to 140 m/min.
Machining changes the mechanical, microstructural, and topographical states of the machined surface and subsurface, also known as surface integrity [13]. It includes the residual stress, microhardness, surface roughness, grain size, phase transformation, and all possible surface defects induced by machining (microchip debris, material plucking, tearing, dragging, and smearing). Residual stress distribution of the machined surface and subsurface is considered one of the surface integrity parameters most influent in the functional performance and life of the components, including in fatigue life and corrosion resistance [14,15].
Zlatin and Field [16] demonstrated that depending on the aggressivity of the cutting conditions, tensile or compressive residual stresses can be produced in the milling of Ti-6Al-4V alloy. In particular, gentle milling conditions generated compressive residual stresses, while aggressive conditions generated tensile stresses. Norihiko et al. [17] showed that residual stresses at the machined surface in the turning of Ti-6Al-4V alloy were compressive in both cutting and feed directions when using both uncoated cemented carbide and natural diamond tools. These stresses were slightly less compressive when a natural diamond tool was used, compared to the cemented carbide. Wet cutting conditions (soluble oil in water) also induced slightly less compressive stresses when compared to dry cutting. Sun and Guo [18] also showed that the residual stresses in both cutting and feed directions were compressive in the down milling of Ti-6Al-4V alloy, for a range of cutting speeds and feeds of 50 m/min to 110 m/min and 0.06 to 0.14 mm/tooth, respectively. They also showed that residual stresses become more compressive as the cutting speed increases up to 80 m/min. Beyond this speed, the residual stresses slightly decrease in compression, due to the thermal effects. An opposite trend was observed with the feed, where the residual stresses are less compressive when the feed increases. Madyira et al. [19] have experimentally investigated the residual stresses in the dry longitudinal turning of Ti-6Al-4V alloy. They found that residual stresses at the machined surface changed from compressive to tensile when the cutting speed increased from 50 m/min to 175 m/min. The critical cutting speed was 150 m/min, above which the residual stresses were tensile. Yang et al. [20] proposed a hybrid modelling approach, combining 2D finite element simulations of the milling of Ti-6Al-4V alloy and a statistical model to predict the residual stress on the machined surface. They also found that residual stress changed from compressive to tensile by increasing the cutting speed, but also by increasing the feed. Chen et al. [21] investigated the influence of cutting edge radius (less than 5 μm, 28 μm, and 50 μm) and cooling/lubricating conditions (dry, MQL, LN2, hybrid with LN2 and MQL) on residual stress in the cutting direction in the orthogonal cutting of Ti-6Al-4V alloy. They observed that machining with larger cutting edge radii and hybrid cooling (LN2 + MQL) significantly increased the magnitude and depth of the compressive residual stress. The increases of the residual stress with the cutting edge radius can be attributed to the strong increase in the thrust force.
According to the previous review, researchers tend to investigate the effects of a limited number of cutting process parameters on the machining process outcomes. The reason is that the experimental tests become very expensive in terms of time and resources when a large number of cutting parameters needs to be investigated. Design of experiments (DOE) methodology can be an alternative method for investigating the influence of multiple cutting parameters on the machining outcomes. These methods can significantly reduce the number of experimental tests, thus reducing the costs and ensuring valid and unbiased conclusions. As a statistical methodology, it allows the researchers to establish a statistical correlation between a set of input factors and output responses. In the machining process, the input factors include the cutting regime parameters (cutting speed, feed, depth of cut), tool geometry, etc., while the output response are the machining outcomes, such as forces, temperature, tool life, surface integrity parameters, etc. [22]. Depending on the number of factors and the experimental objective, different DOE methods can be applied, including the response surface methodology, factorial design, and Taguchi methods. The response surface methodology (RSM) was used by Mia et al. [23] to investigate the effects of cutting speed, feed, and tool geometry on the cutting forces in turning of Ti-6Al-4V titanium alloy. It was found that a lower-to-medium cutting speed (~110 m/min) could achieve the balance between low cutting force and feed force with productivity. Kandráč et al. [24] combined the Taguchi method and numerical simulation to investigate the influence of the cutting regime parameters on the forces in orthogonal cutting of Ti-6Al-4V titanium alloy. According to them, cutting edge radius is the main influencing factor on the forces, followed by the feed and tool rake angle. Using analysis of variance (ANOVA), Khanna and Davim [25] showed that the feed was the most influencing factor in both cutting and feed forces when orthogonally cutting three titanium alloys (Ti-6Al-4V, Ti54M, and Ti10.2.3).
The development of machining or cutting models to predict the process outcomes also contributes for the reduction of the cost and time of such experimental tests. However, practical machining operation, such as turning, milling, and drilling, require the development of three-dimensional (3D) cutting models. Though numerical simulation can be a cost-effective method compared to the experimental tests, the calculation time to solve such 3D cutting models is extremely high. Moreover, these models are too complex to be solved analytically. Therefore, predictive models based on artificial intelligence (AI), can significantly contribute for the reduction of the calculation time. Moreover, these AI-based predictive cutting models open new perspectives for the real-time control of the machining process using a digital twin approach [26,27]. Outeiro [28] has developed and applied a modelling and optimisation procedure based on artificial neural network (ANN), RSM, and genetic algorithm (GA) methods to predict the surface integrity and identify the optimum combination of cutting parameters, leading to the best surface integrity for the turning of AIS H13 tool steel using coated cemented carbide and PCBN cutting tools. An ANN was developed and trained using experimental surface integrity data, in particular the residual stresses and the surface roughness. Then, the ANN was used to simulate both residual stresses and surface roughness for different combinations of machining parameters. Next, an RSM was applied to evaluate the influence of each cutting parameter on the residual stresses and surface roughness. In order to decrease the magnitude of the tensile residual stresses and surface roughness, both the feed and depth of cut must be reduced, while the cutting edge angle must be increased. Finally, the optimal cutting conditions inducing low tensile residual stresses and low surface roughness were determined using the GA. Umbrello et al. [29] proposed a hybrid approach, combining numerical simulation using finite element method (FEM) and ANN for predicting the residual stresses and to determine the optimal cutting conditions in the turning of AISI 52,100 bearing steel using chamfered and honed cemented carbide tools. Even if Outeiro [28] and Umbrello et al. [29] used similar approaches, the nature of the data used to train the ANN is different. Outeiro [28] used exclusively experimental surface integrity data, while Umbrello et al. [29] used residual stress data obtained from numerical simulations of the machining. In the case of machining of Ti-6Al-4V titanium alloy, very few research works have proposed cutting models based on the ANN for predicting the surface roughness in high speed turning [30], the machinability [31], the surface roughness in turning based on vibration signals [32], and the material removal rate [33]. Moreover, an adaptive neuro-fuzzy inference system (ANFIS) [31] was also used for predicting machinability.
The objectives of the present research work were: (1) to investigate the influence of the cutting parameters (cutting speed Vc, uncut chip thickness h, tool rake angle γn, and the cutting edge radius rn) on the forces (cutting Fc and thrust Ft forces), chip compression ratio (CCR), and residual stresses at the machined surface (SRS), in the orthogonal cutting of Ti-6Al-4V titanium alloy; (2) to determine the optimal cutting conditions that minimize the forces CCR and SRS. To achieve these objectives, a full factorial DOE composed of four factors (the cutting parameters) and two levels per factor was designed and used to analyse the forces and CCR. However, since the residual stress measurements were time consuming and very expensive, they were only determined for selected cutting conditions. To obtain (predict) the residual stresses for other cutting conditions, a data-driven model based on the machine learning (ML) algorithm, in particular on the least squares versus stochastic regression method, was developed. The data was obtained from experimental machining tests using several techniques and types of equipment. All the tests were performed under dry cutting conditions, which are very useful for sustainable manufacturing [34]. Finally, the optimal cutting conditions that minimized the forces, CCR and SRS individually, were determined because they reduced the energy required to separate (cut) the material, thus enhanced the surface integrity of the machine parts.

2. Experimental Setup and Cutting Conditions

In this study, the Ti-6Al-4V titanium alloy obtained by rolling and annealing was used, since it is still one of the most used titanium alloys in several industries, including the aerospace, energy, and medical industries. This alloy is composed of a two-phase structure (α + β). The chemical composition of this alloy is presented in Table 1.
Vickers microhardness of the workpiece was measured in five locations using a loading of 300 gf with 10 s loading time, while the grain sizes were measured based on standard ASTM E112-12. The average microhardness and grain size of this alloy were 330 ± 18 HV and 15.5 ± 1.8 µm, respectively.
Orthogonal cutting tests in a planing configuration (Figure 1) were conducted using uncoated cemented carbide cutting tools (inserts’ references TNMA160408 and TPUN160308; tool holders’ references DTFNR2020K16 and CTFPR2020-16). The geometry of the workpiece in Ti-6Al-4V titanium was parallelepiped with the dimensions 40 × 20 × 4 mm. The cutting direction was along the 40 mm length, which corresponded to the X-direction in Figure 1. Tool geometry in the tool-in-hand system (ISO standard 3002:1982) was carefully measured using an Alicona InfiniteFocusSL microscope. This geometry was represented in Table 2, together with the corresponding values of the cutting regime parameters (cutting speed Vc, uncut chip thickness h, and width of cut w). Two levels of cutting speed, uncut chip thickness, tool rake angle, and tool cutting edge radius were used. The values of the tool geometry and cutting parameters were selected based on the recommendations of the toolmaker for machining Ti-6Al-4V alloy. Only two levels per parameter were used to reduce the number of experimental tests. A new cutting edge was used for each test to eliminate the effect of tool wear on the results. Moreover, since the cutting length was just 40 mm, no evidence of tool wear was detected after each test. All the tests were conducted without any metal working fluid.
During the tests, cutting force Fc (along the X-direction) and thrust force FT (along the Z-direction) were measured by a piezoelectric dynamometer, Kistler model 9119AA2, together with a charge amplifier, Kistler model 5019B. Moreover, the chips and machined workpieces were collected for further analysis. Chips were prepared for the metallographic analysis as described in the standard ASTM E3-11 [35]. They were mounted in the cylindrical moulds of thermoplastic polymers, and underwent heat and pressure during the moulding cycle. Then, they were ground and polished until a scratch free surface was obtained. Finally, they were etched using Kroll chemical solution to reveal the microstructure. After polishing and etching, the samples were observed in the optical microscope to measure the chip geometry. Figure 2 shows the serrated chip morphology typical of machining Ti-6Al-4V titanium alloy. This figure shows the chip parameters: peak, valley and pitch. Peak is the maximum chip thickness, valley is the minimum chip thickness, and the pitch is the distance between two adjacent peaks. To ensure a good repeatability, each chip geometry parameter was measured 5 times for each cutting condition in a single chip sample, representative of such condition.
CCR is a quantitative measure of plastic deformation in metal cutting [36], and it is the ratio between the chip thickness (h1) and the uncut chip thickness (h), represented by the following equation,
C C R = h 1 h
Since the chip thickness varies from a minimum (equal to the valley) and a maximum value (equal to the peak), three CCR values can be calculated for each cutting condition: a minimum (CCRmin), a maximum (CCRmax), and an average (CCRaver).
After machining, residual stresses were measured at the machined surface of the workpieces using the X-ray diffraction (XRD) technique, in the cutting direction (longitudinal or along the X-direction) and perpendicular to this direction (transversal or along the Y-direction) using Seifert XRD 3000 PTS equipment. Measurements were conducted using the copper K-α radiation from the {213} crystallographic plane of the Ti-6Al-4V alloy. Diffractograms were recorded for 29 tilt angles ψ varying between −45° and +45°. To calculate the residual stress, the sin2ψ method was used [37]. The X-ray elasticity constants ½ S2 and S1 providing the proportionality between measured strains and calculated stresses was calculated using an elastic self-consistent model: ½ S2 = 11.68 × 10⁻⁶ MPa−1, S1 = −2.83 × 10⁻⁶ MPa−1. Measurements were performed once in the middle of the machined surface. The irradiated zone had a 4 mm length and 2 mm width. The penetration depth of the X-ray radiation was about 5 µm.
The influence of four selected cutting parameters (cutting speed Vc, uncut chip thickness h, tool rake angle γn, and the cutting edge radius rn) on the forces (cutting Fc and thrust Ft forces), chip compression ratio (CCR), and residual stresses (RS) were investigated. A 2k factorial DOE was applied to investigate the influence of the four selected cutting parameters (factors) on both cutting force Fc, thrust force Ft, and CCR (responses). This DOE was composed of 4 factors and 2 levels per factor, so a total of 16 combinations of cutting conditions was proposed, as shown in Table 3. Since the residual stress measurements are time-consuming and very expensive, they were only determined by XRD for 7 cutting conditions, as shown in Table 3. To obtain (predict) the residual stresses for the other cutting conditions, an ML algorithm based on the least squares versus stochastic regression was used, described as follows.

3. Machine Learning

Mathematical Regression Analysis: Least-Squares Versus Stochastic Regressions

Consider the variable y depending on the feature x, both assumed known at different data-points ( x i ,   y i ), whose relation is assumed to be described by a linear regression y i = f ( x i ) = a x i + b . For computing the regression coefficients (a and b), the least squares procedure proceeds by minimizing the cost function S ,
S = 1 2 i ( y i f ( x i ) ) 2 = 1 2 i ( y i ( a x i + b ) ) 2
with the index (i) covering the number of samples, i = 1 n . When using the linear regression at each data-point, it results in the following equations,
b + a x 1 = y 1
b + a x n = y n
whose compact matrix form is given by
( x 1 1 x n 1 ) ( a b ) = ( y 1 y n )
or alternatively by
X ( a b ) = Y
The multiplication of this last equation by X T results in the following linear system,
X T X ( a b ) = X T Y
which can be transformed into
( i x i 2 i x i i x i n ) ( a b ) = ( i x i y i i y i )
The solution of this linear system is given by,
a = C o v ( x , y ) V a r ( x )
b = y ¯ a x ¯
where y ¯ and x ¯ are the mean values of y and x , respectively.
If the output y follows at x i , a normal distribution (also known as Gaussian, denoted by i) with standard deviation σ i and zero mean, the data should be distributed normally, with standard deviation σ i and with the mean given by a x i + b . Therefore, the cost function is now given by,
S = 1 2 i N σ i ( y i f ( x i ) ) = 1 2 i N σ i ( y i ( a x i + b ) )
which becomes equivalent to the maximum likelihood estimation. This procedure can be easily generalized to multi-parametric settings. The previous problem simplifies considerably if the standard deviation is considered constant.
To make a preliminary analysis, different data points were generated by considering a = 0.5 ,   b = 0 , and σ = 0.1 . The above-described statistical approach is compared with the usual least-squares approximation, as shown in Figure 3. In order to show the procedure performance for three different situations, three different couples (a, b) have been randomly chosen, as represented in Figure 3a, Figure 3b, and Figure 3c, respectively. For each couple (a, b), the reference solution consists of a linear model using considered parameters a and b. Then, a set of data points is distributed around that linear solution by using a random distribution with zero mean value and a standard deviation, represented by the bars in the figures. When constructing the regression, according to the procedure just described, the minimization procedure proceeds from the generated data, while ignoring its origin, computing two linear regressions (red and blue) based respectively on Gaussian and classical least square minimization. The just described procedure is easily generalized for addressing multi-parametric regressions with richer nonlinear regressions.

4. Experimental Results and Analysis

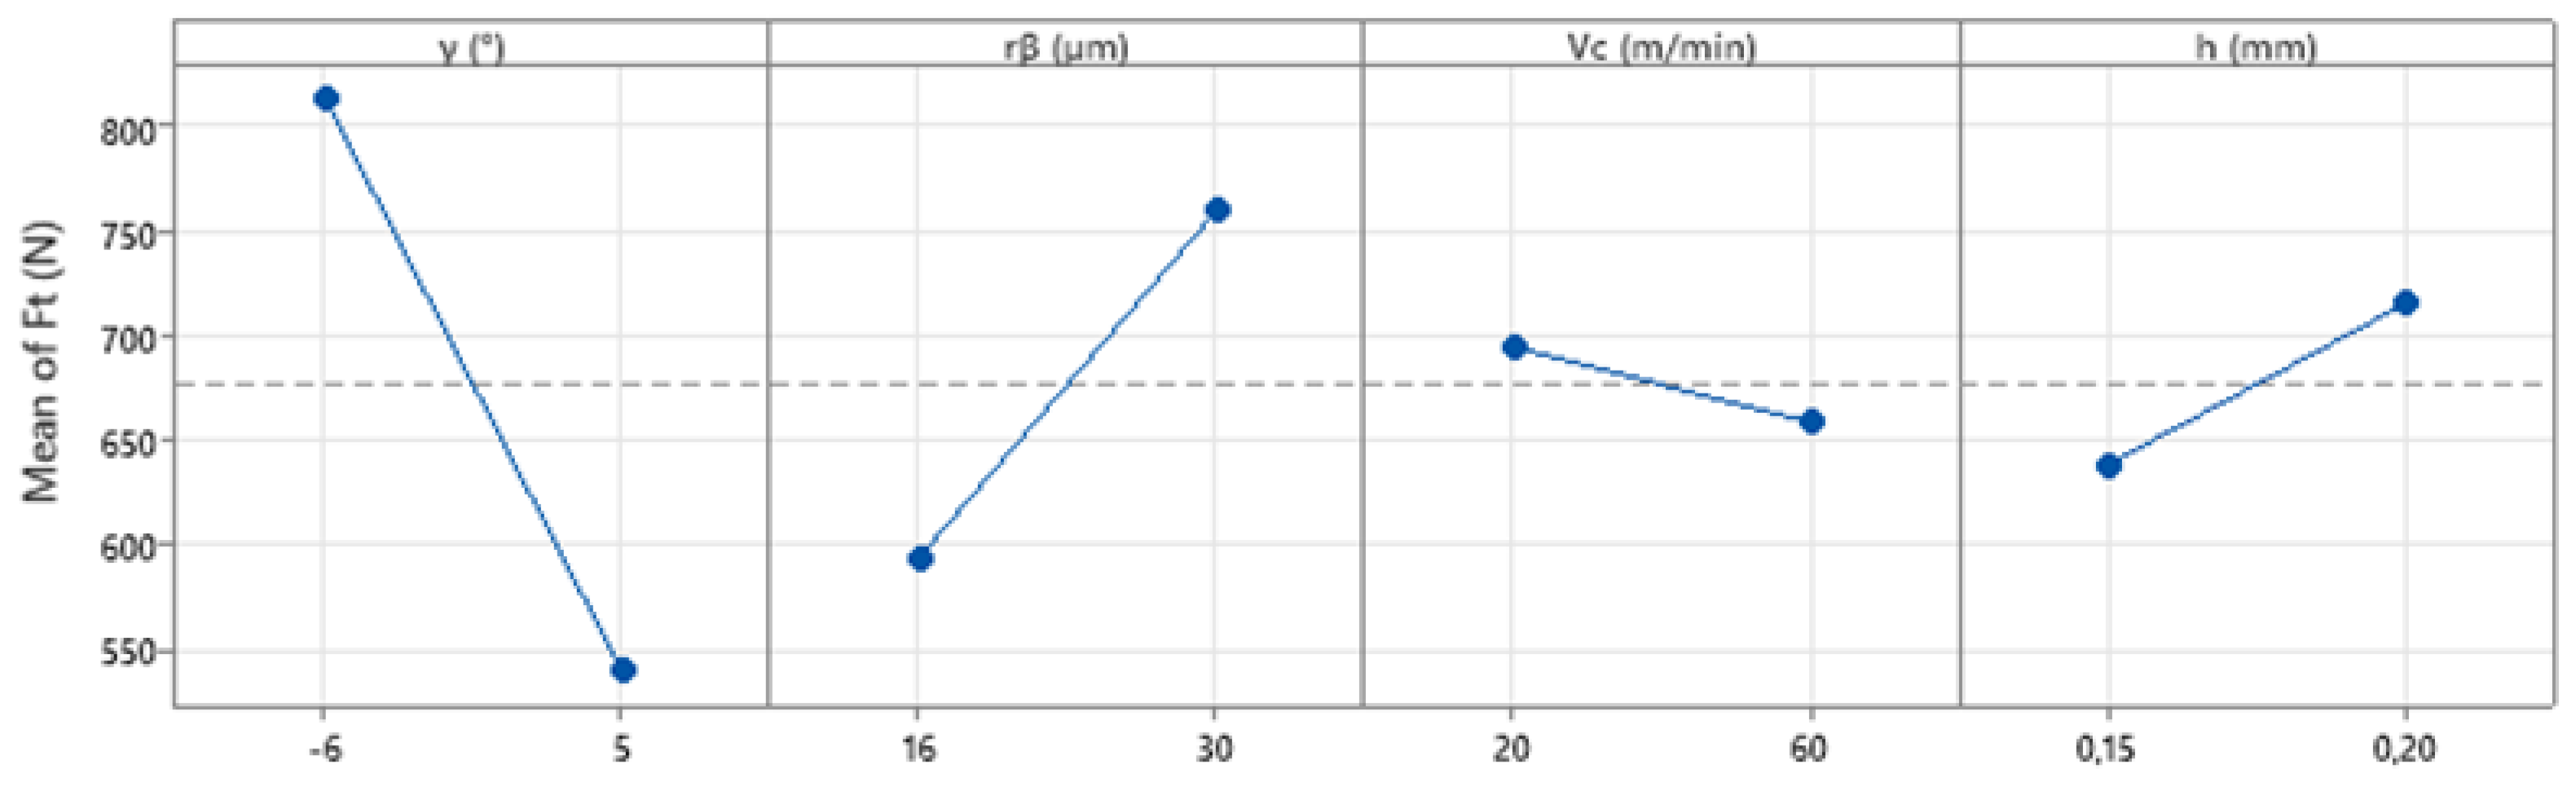
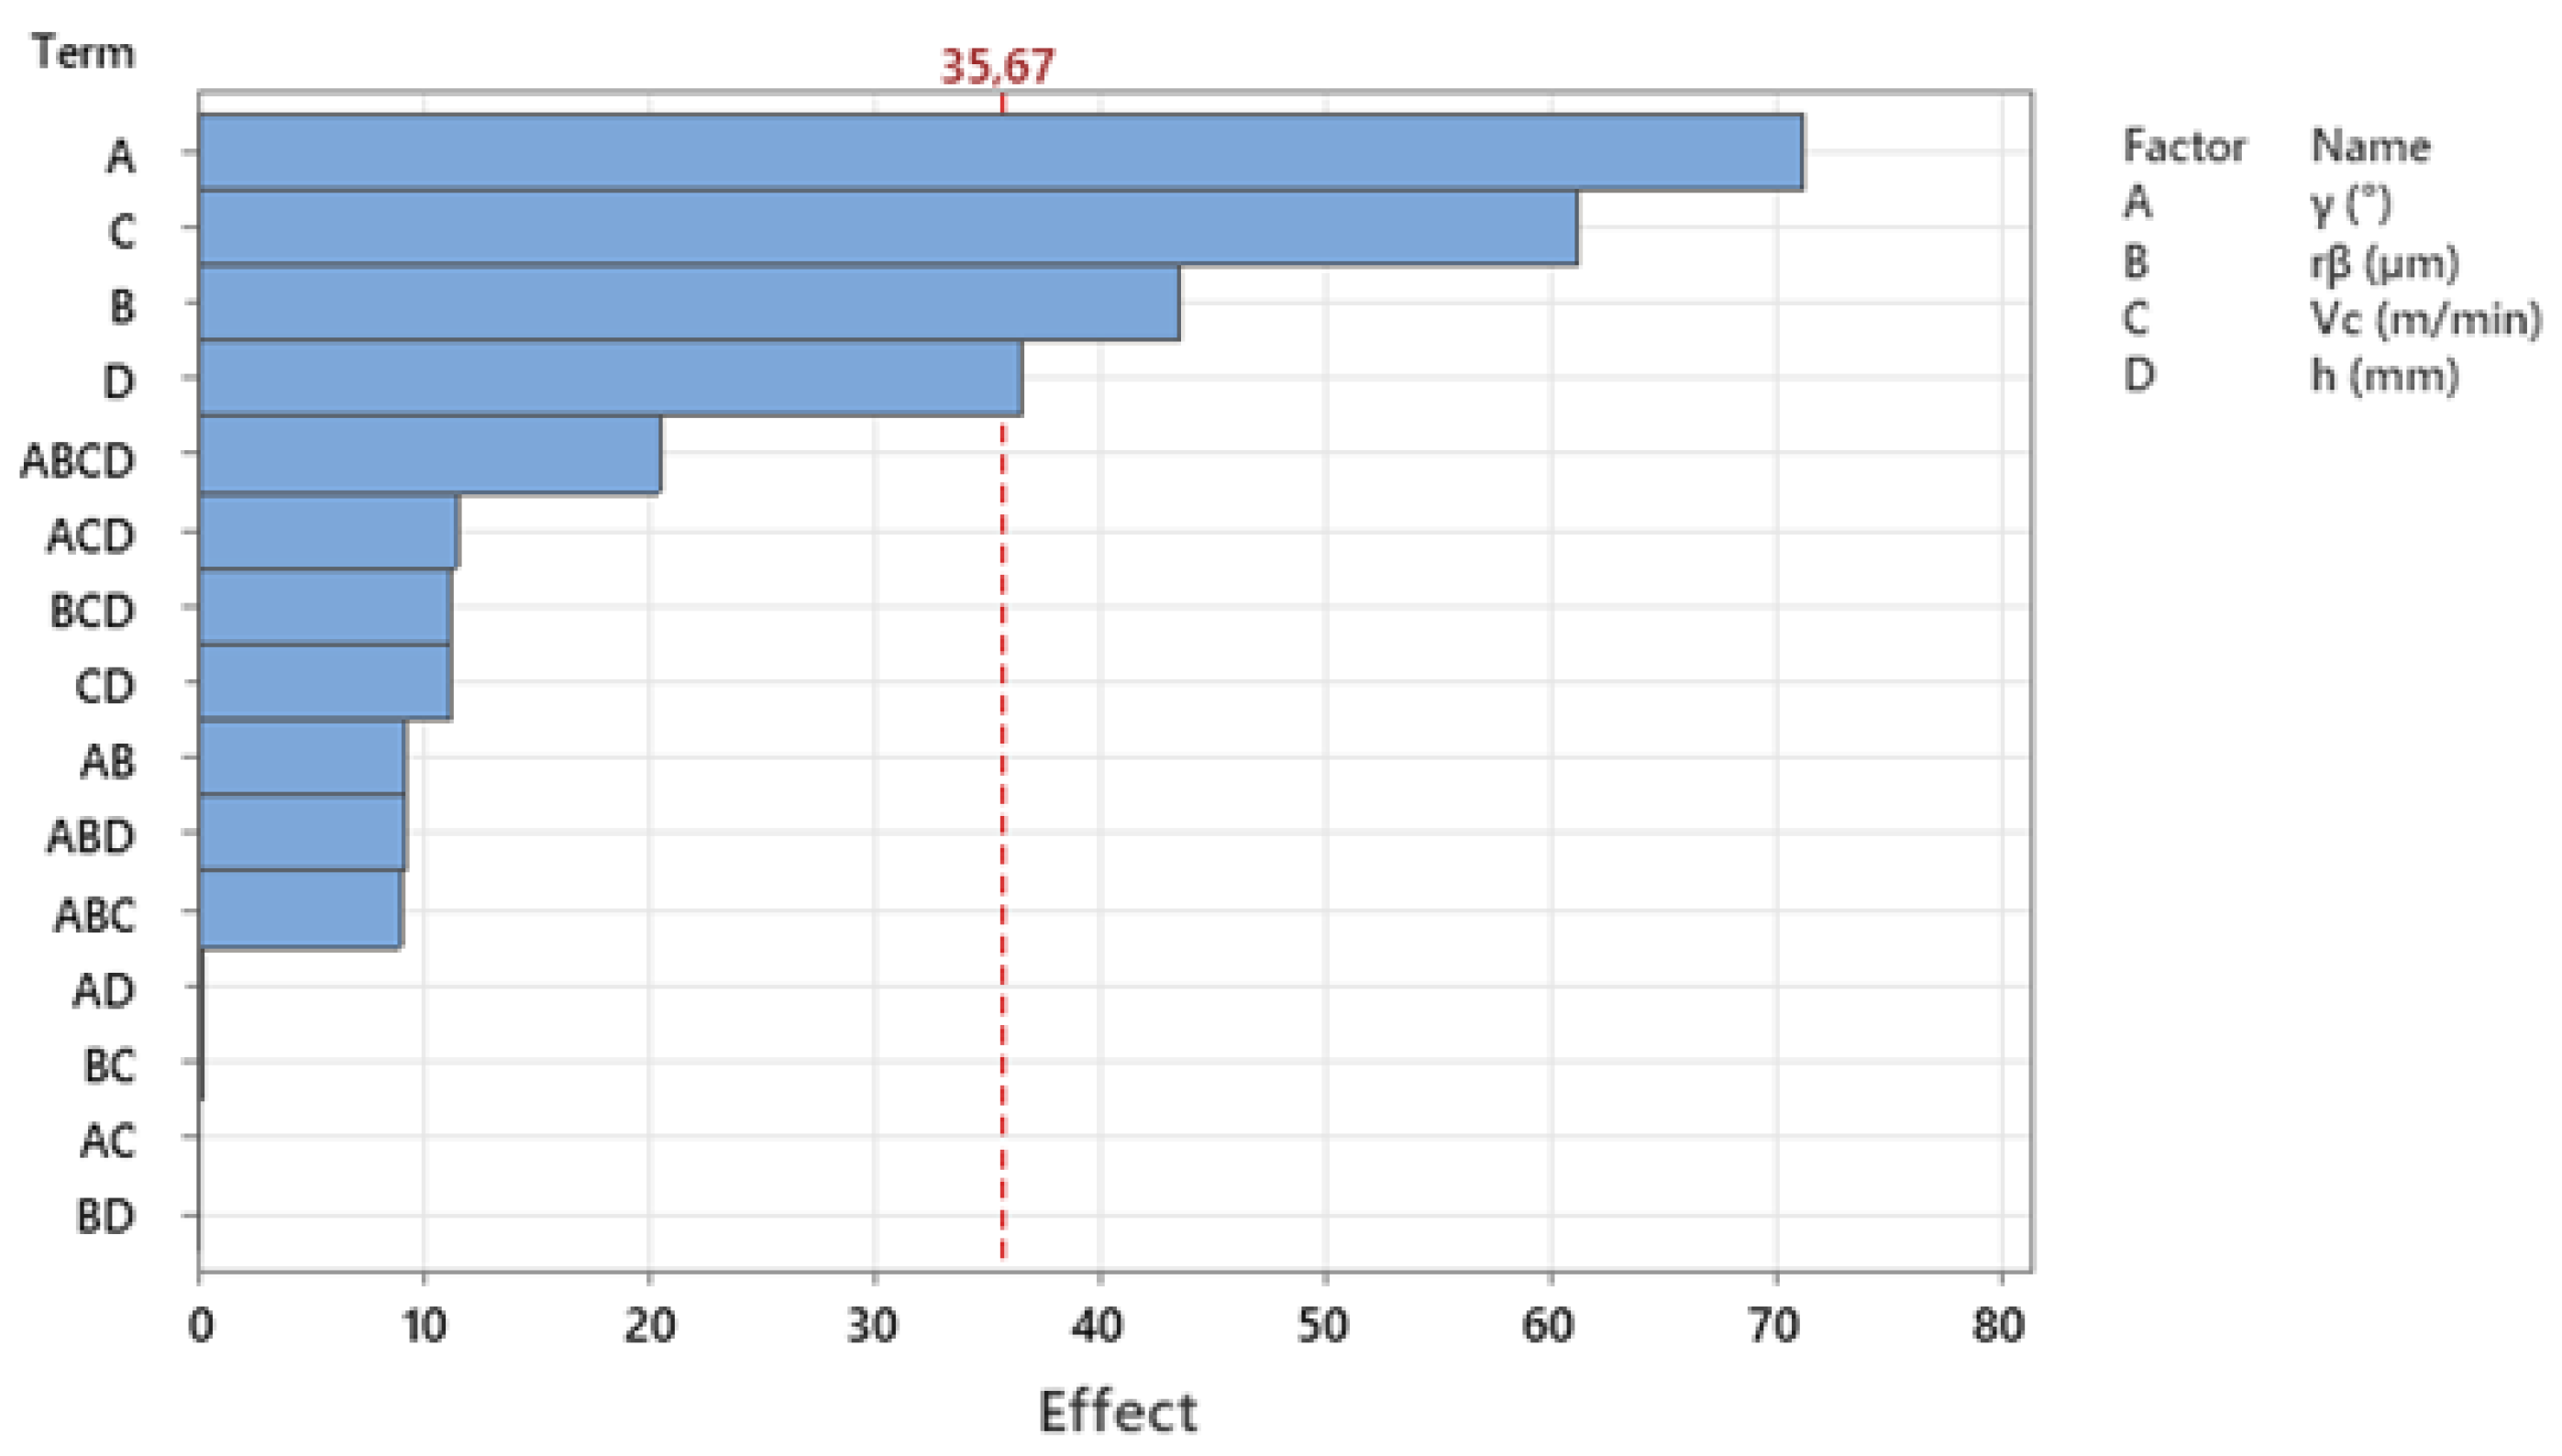
4.1. Cutting and Thrust Forces

It is important to study the forces in machining operations since they strongly affect tool wear, vibrations, part distortion, and surface integrity. Table 4 shows the experimental cutting and thrust forces (responses) of the 2k factorial DOE. For the sake of simplicity, only the average and standard deviation are presented in this table, but all the responses from the three repetitions per test were used in the statistical analysis of the DOE. The same presentation of the results was also used for the CCR and residual stresses.
A DOE analysis is performed using the Minitab statistical software. The forces results are used to construct a mathematical (regression) model of the forces (Fc and Ft). To get a compact model equation, the significant factors (cutting parameters) and their interactions are identified using Pareto analysis, as shown in Figure 4 and Figure 5. As shown in Figure 4, the significant factors affecting the cutting force Fc are γn, rn, Vc and h. The interactions between these four cutting parameters do not show any influence on Fc. As shown in Figure 5, the thrust force Ft is also affected by the same parameters affecting Fc, as well as some of their interactions, including the two-way interactions: γn × h, Vc × h, Vc × rn, and rn × h, and the three-way interactions: γn × h × rn. However, the influence of these interactions on Ft is very small compared to the main factors. Therefore, the regression models of the forces should exclude the interactions between the factors, without compromising the precision of the models. These models are represented by the following equations:
Fc (N) = 475.4 – 13.54 γn (°) + 4.47 rn (µm) – 3.229 Vc (m/min) + 5456 h (mm)
(R-sq = 0.94)
Ft (N) = 160.0 – 24.774 γn (°) + 11.780 rn (µm) – 0.886 Vc (m/min) + 1533 h (mm)
(R-sq = 0.97)
The graphical representations of the influence of the cutting parameters on the Fc and Ft forces are shown in Figure 6 and Figure 7. These figures show that both Fc and Ft forces decrease when the tool rake angle (γn) and cutting speed (Vc) increase, and they increase with the tool edge radius (rn) and uncut chip thickness (h).
To explain some of these results, as well as those of the CCR and residual stresses, the cutting process should be viewed as a forming process that takes place in the components of the cutting system, which are so arranged that the external energy applied to this system causes the separation of a layer of material from the bulk workpiece [38]. The process of physical separation of a solid body into two or more parts is known as fracture. Therefore, factors affecting the fracture strain, such as state of stress (stress triaxiality and Lode parameter), strain rate, and temperature, also affect metal cutting results (forces, temperatures, CCR, surface integrity, etc.) [39,40,41].
The decrease in the Fc and Ft forces with the increase of the cutting speed from 20 to 60 m/min can be attributed to the simultaneous action of the: (1) decreases in the strain at fracture due to the increases in the strain rate [42,43], and (2) increases in the material thermal softening due to the increases in the temperature at the first deformation zone in metal cutting [44]. The decrease in the Fc and Ft forces with the increase in the tool rake angle from negative (−6°) to positive (+5°) is due to the increase in the stress triaxiality near the point of chip separation from the rest of the workpiece, which reduces the strain at the fracture of the work material, as explained by Abushawashi et al. [39]. In contrast, the Fc and Ft forces increase as the uncut chip thickness and the edge radius increase. It is evident that these parameters also affect the stress triaxiality near the point of chip separation from the rest of the workpiece, and thus, the forces [45]. However, the uncut cross-section (the product h × w) and the tool-chip contact length increase with the uncut chip thickness, thus increasing the Fc and Ft forces. Wyen and Wegener [4] investigated the influence of the cutting edge radius on the cutting forces in machining Ti-6Al-4V alloy and concluded that the friction coefficient at the tool-chip interface increased with the cutting edge radius. Therefore, it is expected that the forces also increase, as shown in Figure 6 and Figure 7.
Finally, the optimal cutting conditions that minimizes both forces can be determined, as shown in Table 5.

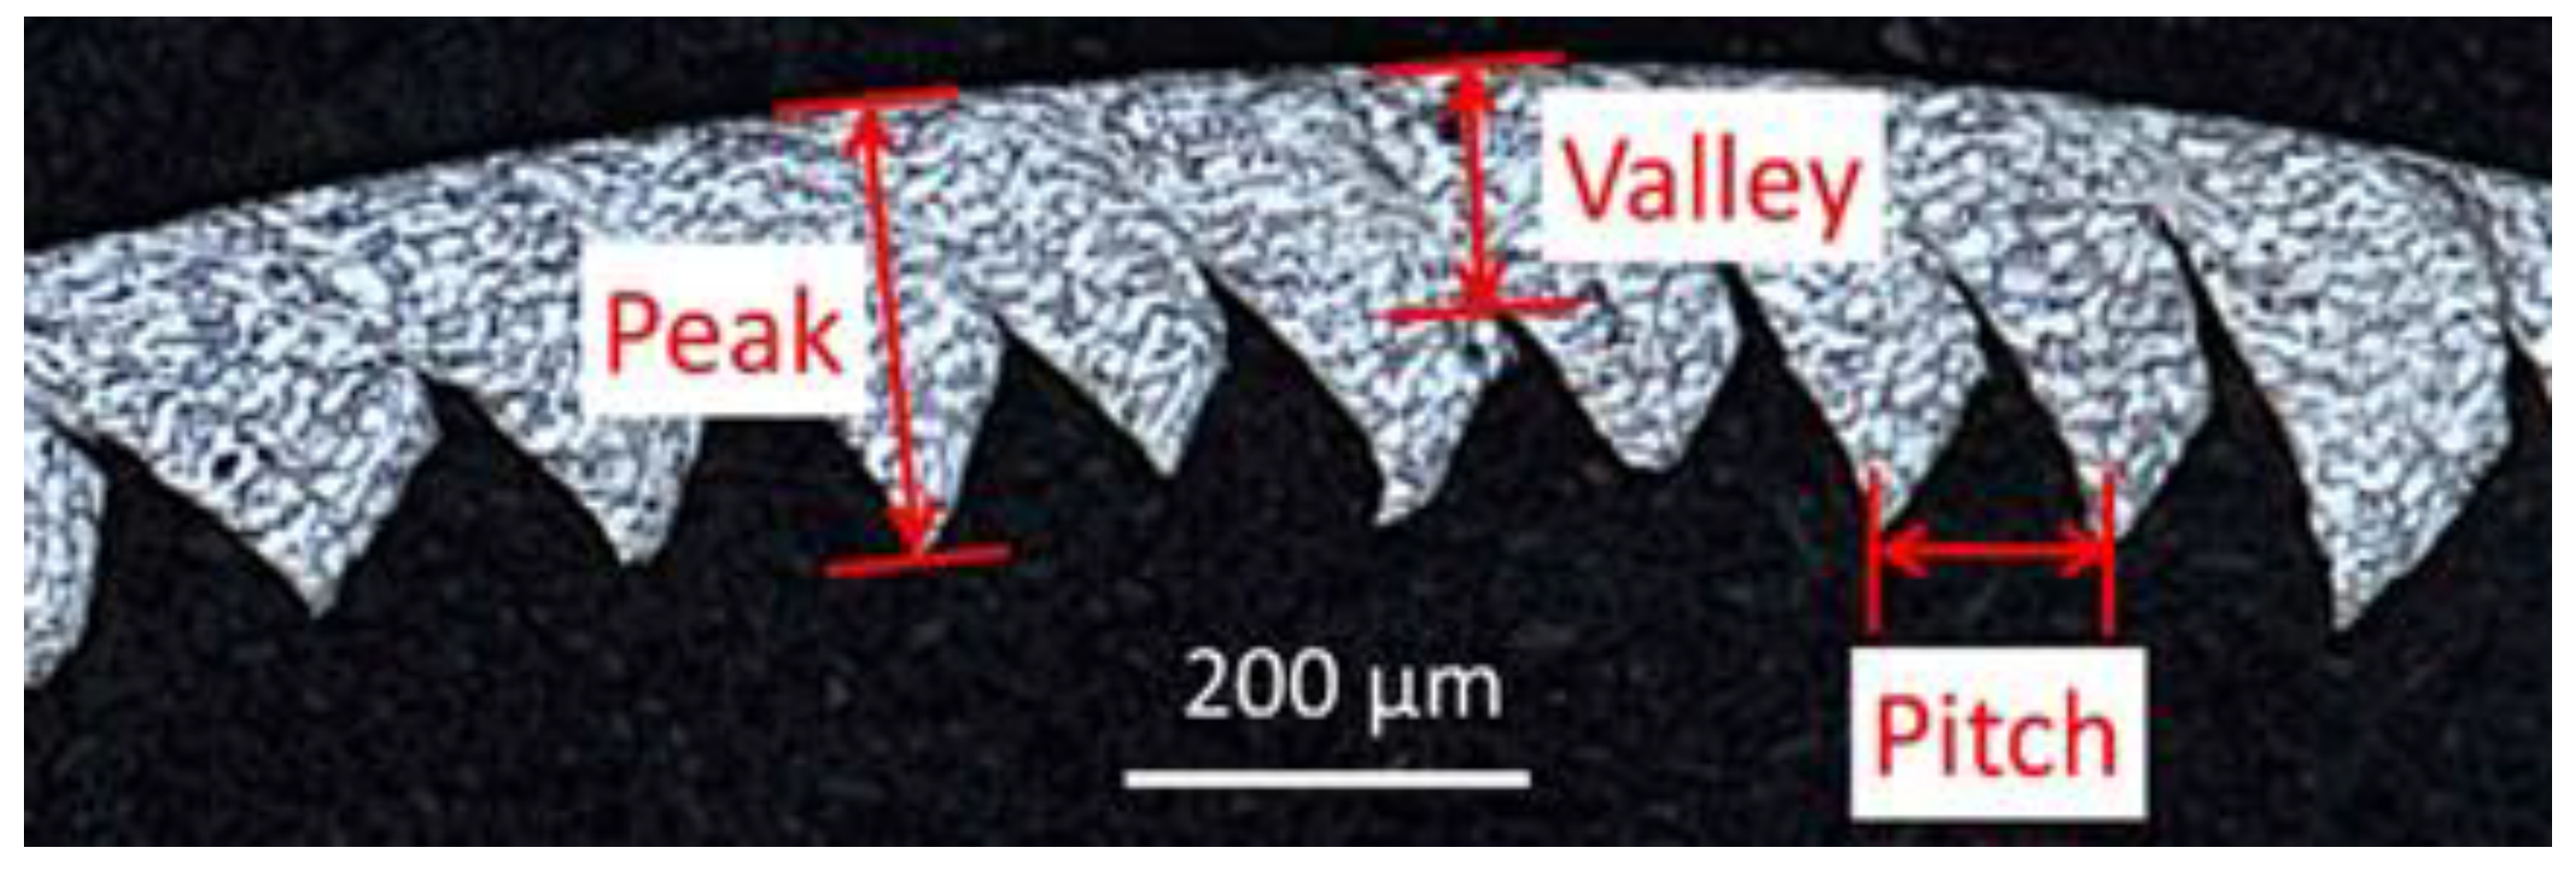
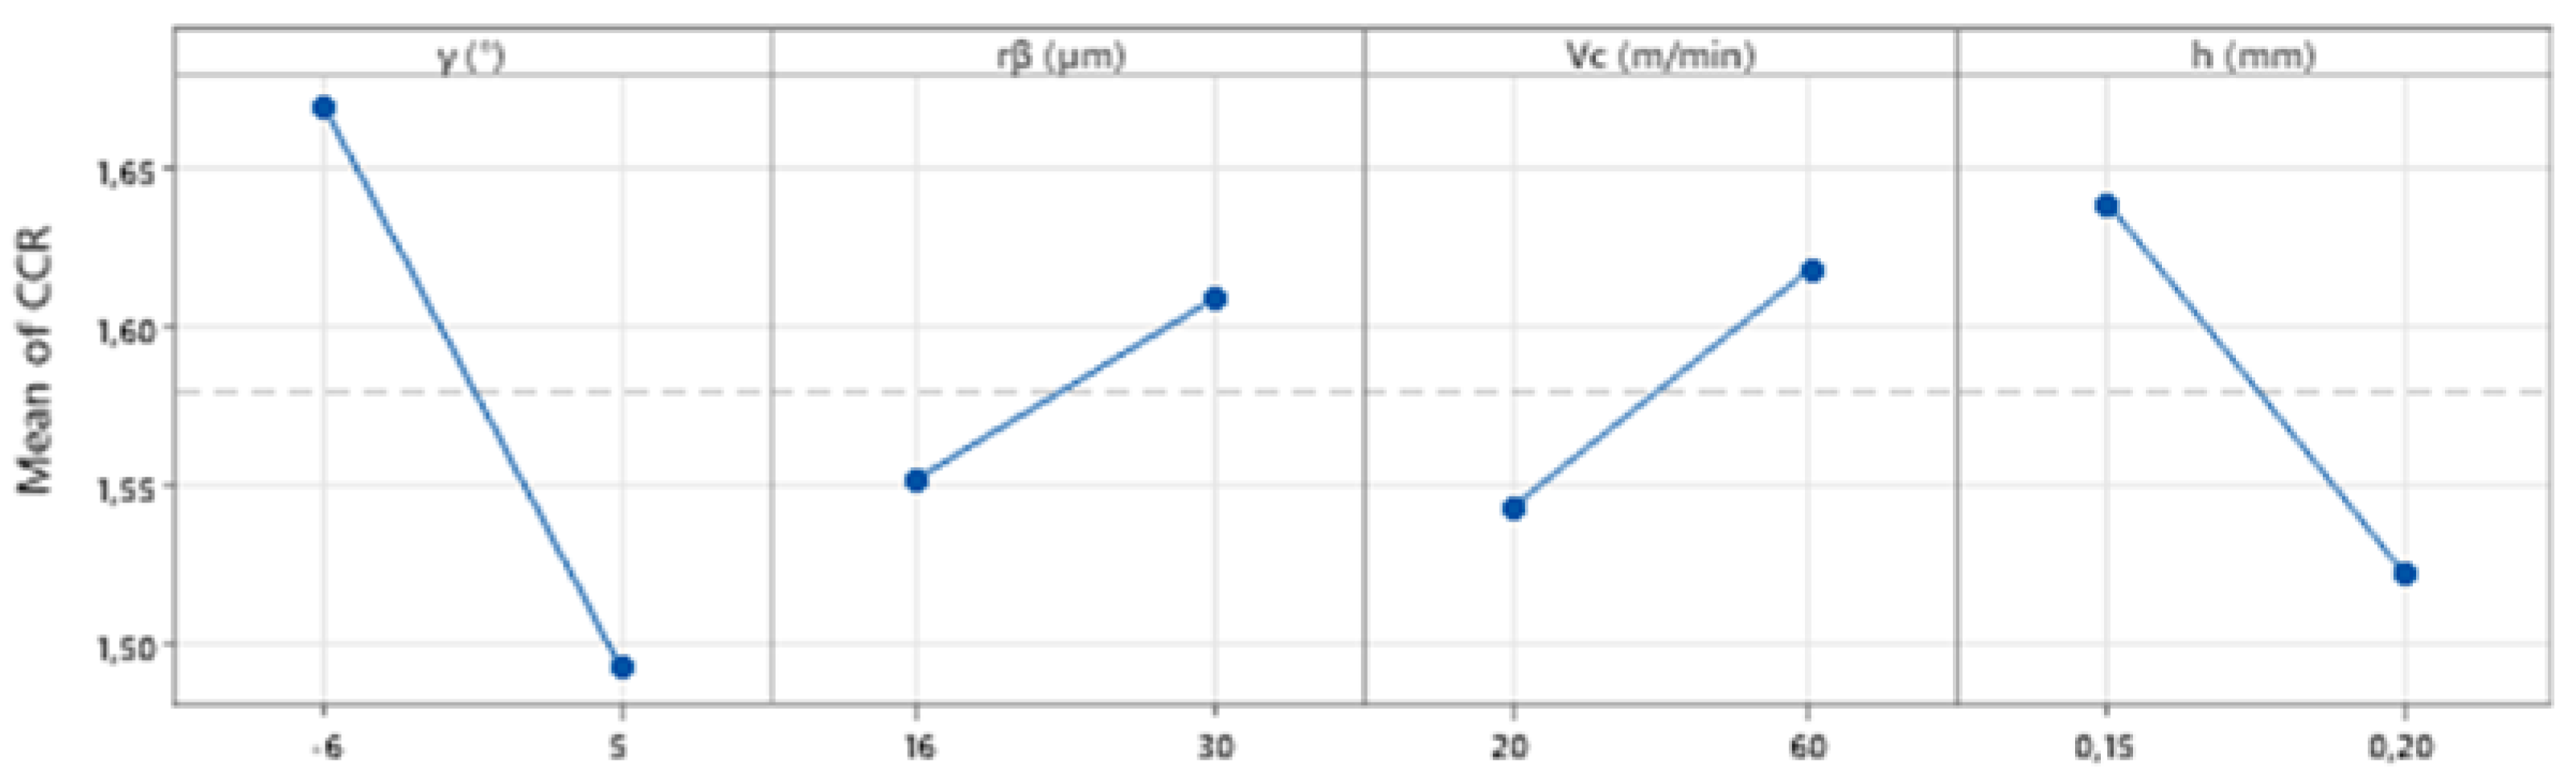
4.2. Chip Compression Ratio (CCR)

After measuring the chip geometry for all the cutting conditions, the maximum chip compression ratio (CCRmax) was calculated because it represents the maximum plastic deformation in metal cutting. This CCRmax is shown in Table 6 (hereafter referred as CCR).
Similar DOE analysis was performed for the CCR. As shown in Figure 8, Pareto analysis permits the discovery that all the factors, and some interactions between them, are affecting the CCR.
Then, the regression model of the CCR is obtained, as shown by the following equation:
CCR = 1.58025 − 0.08808 γn (°) + 0.02825 rn (µm) + 0.03754 Vc (m/min) − 0.05825 h (mm)
− 0.01900 γn (°) ∗ rn (µm) − 0.03096 γn (°) ∗ Vc (m/min) + 0.02808 γn (°) ∗ h (mm)
− 0.03529 rn (µm) ∗ Vc (m/min) − 0.01587 γn (°) ∗ rn (µm) ∗ Vc (m/min)
+ 0.02050 γn (°) ∗ rn (µm) ∗ h (mm) + 0.04121 γn (°) ∗ Vc (m/min) ∗ h (mm)
+ 0.01763 γn (°) ∗ rn (µm) ∗ Vc (m/min) ∗ h (mm)
(R-sq = 0.86)
Since the R-sq is relatively low, almost all the interactions are included in the model.
The graphical representation of the influence of the cutting parameters on the CCR is shown Figure 9 and Figure 10. The empty slots in Figure 10 represent some interactions that are not relevant according to the Pareto analyses. These figures show that CCR decreases as the tool rake angle (γn) and uncut chip thickness (h) increase, and it increases with the tool edge radius (rn) and cutting speed (Vc). Compared to the forces, the influence of the cutting parameters on the CCR is the same concerning the tool geometry (γn and rn), but opposite concerning the cutting regime parameters (cutting speed and uncut chip thickness).
The decrease in CCR with the increase in the tool rake angle was also observed in the orthogonal cutting of Ti-1023 titanium alloy [46]. As for the forces, this can also be explained by the decrease in the strain at fracture due to the increase in the strain rate [42,43]. Moreover, the increase in the CCR with the cutting edge radius can also be explained by the increase in the friction coefficient at the tool-chip interface [4]. Concerning the effect of the cutting speed on CCR, several studies have shown that it depends on the cutting speed range [37,47]. Ren et.al. [48] have found that in the orthogonal cutting of Ti-6Al-4V alloy, the CCR decreases between 10 m/min and 70 m/min, then increases between 70 m/min and 120 m/min, and finally decreases until 160 m/min. In the present study, more levels of cutting speed would be required to verify this evolution of the CCR with the cutting speed. The variation of the CCR with the uncut chip thickness revealed a decreasing trend, which is similar to what is found in the literature [48,49].
Finally, the optimal cutting conditions that minimizes CCR can be determined, as shown in Table 7.
Compared to the forces, the optimal cutting conditions for minimizing the CCR are the same concerning the tool geometry, but opposite concerning the cutting speed and uncut chip thickness.

4.3. Residual Stresses at the Machined Surface

Table 8 show the results of the residual stress measurements at the machined surfaces (SRS) for 7 selected cutting conditions. They are always high compressive in the longitudinal direction (SRSL), reaching about −600 MPa, whereas in the transversal direction (SRST), they show low compressive and low tensile stresses.
To obtain the (predicted) residual stress at the machined surface for the remain cutting conditions, the ML algorithm based on the mathematical regression analysis presented in Section 3 is applied using the data shown in Table 8. It consists of a four-dimensional regression of low degree, because of the reduced number of data and the potential error that the data involve. As soon as the regression is obtained, by using the dataset (training set), as reported in Figure 11 with the accuracy indicators (RMSE et R2 indexes), and the standard deviation extracted from the distance from the data points to the regression prediction. The predictions are performed in the conditions where residual stresses were not measured, while indicating the corridor defined by plus and minus two times the standard deviation (Figure 12). The obtained regression equations are represented by:
SRSL (MPa) = −202.623 – 13.188 γn (°) – 14.352 rn (µm) + 0.257 Vc (m/min) + 414.667 h (mm)
(R-sq = 0.97)
SRST (MPa) = −108.671 – 6.485 γn (°) – 3.119 rn (µm) + 1.533 Vc (m/min) + 733.333 h (mm)
(R-sq = 0.76)
As can be seen by the R-sq, the 7 tests are sufficient for predicting the residual stresses in the longitudinal (X) direction (R-sq = 0.97), but not adequate in the transversal (Y) direction (R-sq = 0.76). Additional experimental data is required to achieve a better regression using the same methodology, which will provide better predictions.
Table 9 summarizes both measured and predicted residual stresses in both longitudinal and transversal directions. In this table, it is important to note that the deviation intervals measured and predicted have a different meaning. In the case of the ones measured, the interval refers to the eventual error that the measurement could contain due to the method used to calculate the residual stresses and the instrumental error, and then it does not correspond to any statistics obtained from repeated measures. On the contrary, the intervals indicated as predicted refer to the statistics associated with the measurements themselves and provide the interval in which the value of the measurement is expected (3 times the calculated standard deviation).
DOE analysis was performed considering the residual stresses data obtained experimentally and predicted by regression analysis. As shown in Figure 13, Pareto analysis revealed that the significant factors affecting the residual stress in transversal direction (SRST) are γn, rn, Vc, and h. These factors are also significantly affecting the residual stress in the longitudinal direction (SRSL), as well as some of their interactions, as shown in Figure 14. Considering these significant factors and their integrations, the regression model of the residual stresses is obtained, as shown by the following equations:
SRSL (MPa) = −192.4 – 13.205 γn (°) – 14.339 rn (µm) + 415 h (mm)
(R-sq = 0.99)
SRST (MPa) = −108.3 – 6.477 γn (°) – 3.107 rn (µm) + 1.531 Vc (m/min) + 730 h (mm)
(R-sq = 0.92)
The interactions between the factors were neglected without compromising the precision of the models.
The graphical representation of the influence of the cutting parameters on the residual stresses is shown in Figure 15 and Figure 16. As shown in Figure 15, SRSL increases in compression as the tool rake angle (γn) and tool edge radius (rn) increase, while it is negligibly affected by the cutting speed (Vc) and uncut chip thickness (h). In the case of the SRST (Figure 16), it also increases in compression as the tool rake angle (γn) and tool edge radius (rn) increase, while it decreases in compression and become tensile with the increase in the cutting speed (Vc) and uncut chip thickness (h).
To explain the residual stresses results, one should consider that they are generated by heterogeneous (gradient) plastic deformation induced in the workpiece (from the surface to the bulk) by the cutting process [40]. This gradient of plastic deformation is induced by the complex interaction between the thermal and mechanical phenomena developed during the cutting process [40]. The mechanical action of the cutting tool on the machined surface can induced tensile or compression residual stresses, depending on the magnitude of the mechanical loading and unloading to which a micro-volume of the work material is submitted, as described by Liu and Barash [50], and later by Wu and Matsumoto [51]. As far as the thermal (heat) phenomenon is concerned, it mainly contributes to the formation of tensile residual stresses, caused by heterogeneous plastic deformation due to the thermal expansion and contraction of the affected surface machined layers. However, this heat also influences the mechanical properties of the work material, and thus, indirectly, the residual stress formation in the machined part. Phase transformation, which is a consequence of both thermal and mechanical phenomena, can produce both tensile and compressive stresses, depending on the material volume variation [52].
The previous considerations permit the conclusion that to explain the results presented above, a complete analysis of the thermal and mechanical phenomena generated during the dry orthogonal cutting of Ti-6Al-4V titanium alloy is necessary. It should be mentioned that this analysis is out of the scope of current work. Moreover, the comparison of the residual stresses obtained in this work with those stresses found in the literature for the same work material reference, machining operation, and corresponding process parameters is rather difficult. In fact, small variations in the mechanical properties of the work material, metalworking fluid composition and delivery method, machine tool dynamics, etc., have a strong influence on the residual stresses [40]. Therefore, it is useless to find justifications for the influence of the cutting conditions on residual stresses without a proper analysis of the thermal and mechanical phenomena that generated such residual stresses.
Finally, the optimal cutting conditions that maximizes the compressive surface residual stresses in both directions can be determined, as shown in Table 10.

5. Conclusions

The present research work uses full factorial DOE and ML to investigate the orthogonal cutting of Ti-6Al-4V titanium alloy. The DOE permitted the evaluation of the influence of the cutting conditions (cutting speed Vc, uncut chip thickness h, tool rake angle γn, and the cutting edge radius rn) on the major machining outcomes (forces, chip compression ratio, and residual stresses at the machined surface) and the determination of the optimal cutting conditions. Several experimental techniques and types of equipment were used to obtain these machining outcomes. The cutting forces were measured using a piezoelectric dynamometer; chip geometry was investigated by optical microscopy, and then CCR was calculated. Residual stresses were determined using the XRD technique. Due to the time consumed and the cost of the residual stress measurements, they were only measured for selected cutting conditions of the DOE. Then, the ML method, based on the mathematical regression analysis, was applied to predict the residual stresses for other cutting conditions of the DOE. In comparison to the literature, a restricted amount of experimental data was used to test the accuracy of the data-driven model to predict the residual stresses. The results show that:
  • Both forces decrease when the tool rake angle (γn) and cutting speed (Vc) increase, and they increase with the tool edge radius (rn) and the uncut chip thickness (h).
  • CCR decreases as the tool rake angle (γn) and uncut chip thickness (h) increase, and it increases with the tool edge radius (rn) and cutting speed (Vc).
  • Longitudinal residual stress (SRSL) decreases as the tool rake angle (γn) and tool edge radius (rn) increase, while it is negligibly affected by the cutting speed (Vc) and the uncut chip thickness (h).
  • Transversal residual stress (SRST) also decreases as the tool rake angle (γn) and tool edge radius (rn) increase, while it increases with the cutting speed (Vc) and uncut chip thickness (h).
As far as the optimal cutting conditions are concerned, they are different depending on the machining outcome (they minimize the forces, minimize the plastic deformation, or maximizing the compressive residual stresses). From a practical perspective, if the objective is to improve the functional performance and life of the components, then the residual stresses are the most important outcome. In this case, the compressive residual stresses should be maximized by modifying the rake angle (γn), cutting edge radius (rn), uncut chip thickness (h), and cutting speed (Vc). The results showed that when increasing the compressive residual stresses at the machined surface by 40%, the rake angle should be increased from negative (−6°) to positive (5°), the cutting edge radius should be doubled (from 16 µm to 30 µm), and the cutting speed should be reduced by 67% (from 60 to 20 m/min).
In the future, the accuracy of the data-driven model (ML) prediction will be improved by: (i) better statistical characterization of the measurement variability and its eventual dependence on the problem features; and (ii) a larger sampling to improve the regression and consequently, the prediction accuracy. Moreover, the approach used in this research work based on a suitable DOE and ML should be applied to practical machining operations, such as turning, milling, and drilling. The benefits of applying this approach for these operations are significant, due to the high number of process parameters involved and to the huge calculation time to conduct the numerical simulations of such operations.

Author Contributions

Conceptualization, J.O.; methodology, J.O. and F.C.; software, W.C. and A.A.; validation, W.C.; formal analysis, W.C., J.O. and A.A.; investigation, W.C.; resources, W.C.; data curation, W.C.; writing—original draft preparation, J.O. and W.C.; writing—review and editing, J.O., W.C., F.C. and A.A.; visualization, W.C.; supervision, J.O.; project administration, J.O.; funding acquisition, J.O. All authors have read and agreed to the published version of the manuscript.

Funding

This research work was funded by Seco Tools and Safran Companies, and by China Scholarships Council Program (CSC grant number 201606320213).

Data Availability Statement

Not applicable.

Acknowledgments

The authors would like to express their gratitude for the financial support provided by Seco Tools and Safran Companies. The financial support from the China Scholarships Council Program is also appreciated. They would like to thank Bertrand Marcon from Arts and Metiers Institute of Technology for his support in conducting the machining tests.

Conflicts of Interest

The authors declare no conflict of interest.

Abbreviations

The following abbreviations and nomenclature are used in this manuscript.
MLMachine learning
RSMResponse surface methodology
ANNArtificial neural network
GAGenetic algorithms
FDZFirst deformation zone
SDZSecond deformation zone
TDZTertiary deformation zone
DOEDesign of experiments
FEMFinite element method
PCBNPolycrystalline cubic boron nitride
ANFISAdaptive neuro-fuzzy inference system
CCRChip compression ratio
CCRmaxMaximum chip compression ratio
SRSResidual stresses at the machined surface
SRSLResidual stresses at the machined surface in the longitudinal direction
SRSTResidual stresses at the machined surface in the transversal direction
RSResidual stresses
XRDX-ray diffraction
FcCutting force (N)
FtThrust force (N)
VcCutting speed (m/min)
hUncut chip thickness (mm)
h1Chip thickness (mm)
αnFlank angle (°)
γnRake angle (°)
rnCutting edge radius (µm)
wWidth of cut (mm)
xIndependent variable
yDependent variable
( x i ,   y i )Data points
a, bregression coefficients
SCost function
y ¯ and x ¯ Mean values of y and x
iNormal distribution

References

  1. Leyens, C.; Peters, M. Titanium and Titanium Alloys: Fundamentals and Applications; Wiley-VCH: Weinheim, Germany, 2005. [Google Scholar]
  2. Lee, J.-Y.; Nagalingam, A.P.; Yeo, S.H. A Review on the State-of-the-Art of Surface Finishing Processes and Related ISO/ASTM Standards for Metal Additive Manufactured Components. Virtual Phys. Prototyp. 2021, 16, 68–96. [Google Scholar] [CrossRef]
  3. Sarıkaya, M.; Gupta, M.K.; Tomaz, I.; Pimenov, D.Y.; Kuntoğlu, M.; Khanna, N.; Yıldırım, Ç.V.; Krolczyk, G.M. A State-of-the-Art Review on Tool Wear and Surface Integrity Characteristics in Machining of Superalloys. CIRP J. Manuf. Sci. Technol. 2021, 35, 624–658. [Google Scholar] [CrossRef]
  4. Wyen, C.-F.; Wegener, K. Influence of Cutting Edge Radius on Cutting Forces in Machining Titanium. CIRP Ann. 2010, 59, 93–96. [Google Scholar] [CrossRef]
  5. Yen, Y.-C.; Jain, A.; Altan, T. A Finite Element Analysis of Orthogonal Machining Using Different Tool Edge Geometries. J. Mater. Processing Technol. 2004, 146, 72–81. [Google Scholar] [CrossRef]
  6. Fang, N.; Pai, P.S.; Edwards, N. A Comparative Study of High-Speed Machining of Ti-6Al-4V and Inconel 718—Part II: Effect of Dynamic Tool Edge Wear on Cutting Vibrations. Int. J. Adv. Manuf. Technol. 2013, 68, 1417–1428. [Google Scholar] [CrossRef]
  7. Abushawashi, Y.; Xiao, X.; Astakhov, V. A Novel Approach for Determining Material Constitutive Parameters for a Wide Range of Triaxiality under Plane Strain Loading Conditions. Int. J. Mech. Sci. 2013, 74, 133–142. [Google Scholar] [CrossRef]
  8. Upadhyay, V.; Jain, P.K.; Mehta, N.K. Comprehensive Study of Chip Morphology in Turning of Ti-6Al-4V. In Proceedings of the 5th International and 26th All India Manufacturing Technology, Design and Research Conference AIMTDR 2014, Guwahati, India, 12–14 December 2014. [Google Scholar]
  9. Bermingham, M.J.; Kirsch, J.; Sun, S.; Palanisamy, S.; Dargusch, M.S. New Observations on Tool Life, Cutting Forces and Chip Morphology in Cryogenic Machining Ti-6Al-4V. Int. J. Mach. Tools Manuf. 2011, 51, 500–511. [Google Scholar] [CrossRef]
  10. Li, A.; Zang, J.; Zhao, J. Effect of Cutting Parameters and Tool Rake Angle on the Chip Formation and Adiabatic Shear Characteristics in Machining Ti-6Al-4V Titanium Alloy. Int. J. Adv. Manuf. Technol. 2020, 107, 3077–3091. [Google Scholar] [CrossRef]
  11. Hua, J.; Shivpuri, R. Prediction of Chip Morphology and Segmentation during the Machining of Titanium Alloys. J. Mater. Processing Technol. 2004, 150, 124–133. [Google Scholar] [CrossRef]
  12. Cotterell, M.; Byrne, G. Dynamics of Chip Formation during Orthogonal Cutting of Titanium Alloy Ti–6Al–4V. CIRP Ann. 2008, 57, 93–96. [Google Scholar] [CrossRef]
  13. Jawahir, I.S.; Brinksmeier, E.; M’Saoubi, R.; Aspinwall, D.K.; Outeiro, J.C.; Meyer, D.; Umbrello, D.; Jayal, A.D. Surface Integrity in Material Removal Processes: Recent Advances. CIRP Ann.-Manuf. Technol. 2011, 60, 603–626. [Google Scholar] [CrossRef]
  14. Denguir, L.A.; Outeiro, J.C.; Fromentin, G. Multi-Physical Analysis of the Electrochemical Behaviour of OFHC Copper Surfaces Obtained by Orthogonal Cutting. Corros. Eng. Sci. Technol. 2020, 56, 189–198. [Google Scholar] [CrossRef]
  15. M’Saoubi, R.; Outeiro, J.C.; Chandrasekaran, H.; Dillon, O.W., Jr.; Jawahir, I.S. A Review of Surface Integrity in Machining and Its Impact on Functional Performance and Life of Machined Products. IJSM 2008, 1, 203. [Google Scholar] [CrossRef]
  16. Zlatin, N.; Field, M. Procedures and Precautions in Machining Titanium Alloys. In Titanium Science and Technology; Jaffee, R.I., Burte, H.M., Eds.; Springer: Boston, MA, USA, 1973; pp. 489–504. ISBN 978-1-4757-1346-6. [Google Scholar]
  17. Narutaki, N.; Murakoshi, A.; Motonishi, S.; Takeyama, H. Study on Machining of Titanium Alloys. CIRP Ann. 1983, 32, 65–69. [Google Scholar] [CrossRef]
  18. Sun, J.; Guo, Y.B. A Comprehensive Experimental Study on Surface Integrity by End Milling Ti–6Al–4V. J. Mater. Process. Technol. 2009, 209, 4036–4042. [Google Scholar] [CrossRef]
  19. Madyira, D.; Laubscher, R.; van Rensburg, N.J.; Henning, P. High Speed Machining Induced Residual Stresses in Grade 5 Titanium Alloy. Proc. IMechE 2013, 227, 208–215. [Google Scholar] [CrossRef]
  20. Yang, D.; Liu, Z.; Ren, X.; Zhuang, P. Hybrid Modeling with Finite Element and Statistical Methods for Residual Stress Prediction in Peripheral Milling of Titanium Alloy Ti-6Al-4V. Int. J. Mech. Sci. 2016, 108–109, 29–38. [Google Scholar] [CrossRef]
  21. Chen, G.; Caudill, J.; Chen, S.; Jawahir, I.S. Machining-Induced Surface Integrity in Titanium Alloy Ti-6Al-4V: An Investigation of Cutting Edge Radius and Cooling/Lubricating Strategies. J. Manuf. Processes 2022, 74, 353–364. [Google Scholar] [CrossRef]
  22. Aveiro, P. Design of Experiments in Production Engineering; Davim, J.P., Ed.; Management and Industrial Engineering; Springer International Publishing: Cham, Switzerland, 2016; ISBN 978-3-319-23837-1. [Google Scholar]
  23. Mia, M.; Khan, M.A.; Dhar, N.R. Study of Surface Roughness and Cutting Forces Using ANN, RSM, and ANOVA in Turning of Ti-6Al-4V under Cryogenic Jets Applied at Flank and Rake Faces of Coated WC Tool. Int. J. Adv. Manuf. Technol. 2017, 93, 975–991. [Google Scholar] [CrossRef]
  24. Kandráč, L.; Maňková, I.; Vrabel’, M.; Beňo, J. Finite Element Simulation of Cutting Forces in Orthogonal Machining of Titanium Alloy Ti-6Al-4V. Appl. Mech. Mater. 2014, 474, 192–199. [Google Scholar] [CrossRef]
  25. Khanna, N.; Davim, J.P. Design-of-Experiments Application in Machining Titanium Alloys for Aerospace Structural Components. Measurement 2015, 61, 280–290. [Google Scholar] [CrossRef]
  26. Altintas, Y.; Aslan, D. Integration of Virtual and On-Line Machining Process Control and Monitoring. CIRP Ann. 2017, 66, 349–352. [Google Scholar] [CrossRef]
  27. Kim, D.-H.; Kim, T.J.Y.; Wang, X.; Kim, M.; Quan, Y.-J.; Oh, J.W.; Min, S.-H.; Kim, H.; Bhandari, B.; Yang, I.; et al. Smart Machining Process Using Machine Learning: A Review and Perspective on Machining Industry. Int. J. Precis. Eng. Manuf.-Green Technol. 2018, 5, 555–568. [Google Scholar] [CrossRef]
  28. Outeiro, J.C. Surface Integrity Predictions and Optimisation of Machining Conditions in the Turning of AISI H13 Tool Steel. Int. J. Mach. Mach. Mater. 2014, 15, 122–134. [Google Scholar] [CrossRef]
  29. Umbrello, D.; Ambrogio, G.; Filice, L.; Shivpuri, R. A Hybrid Finite Element Method–Artificial Neural Network Approach for Predicting Residual Stresses and the Optimal Cutting Conditions during Hard Turning of AISI 52100 Bearing Steel. Mater. Des. 2008, 29, 873–883. [Google Scholar] [CrossRef]
  30. D’Mello, G.; Pai, P.S.; Shetty, R.P. Surface Roughness Modeling in High Speed Turning of Ti-6Al-4V–Artificial Neural Network Approach. Mater. Today Proc. 2017, 4, 7654–7664. [Google Scholar] [CrossRef]
  31. Harsha, N.; Kumar, I.A.; Raju, K.S.R.; Rajesh, S. Prediction of Machinability Characteristics of Ti6Al4V Alloy Using Neural Networks and Neuro-Fuzzy Techniques. Mater. Today Proc. 2018, 5, 8454–8463. [Google Scholar] [CrossRef]
  32. Upadhyay, V.; Jain, P.K.; Mehta, N.K. In-Process Prediction of Surface Roughness in Turning of Ti–6Al–4V Alloy Using Cutting Parameters and Vibration Signals. Measurement 2013, 46, 154–160. [Google Scholar] [CrossRef]
  33. Rajaparthiban, J.; Sait, A.N. Experimental Investigation on Machining of Titanium Alloy (Ti 6Al 4V) and Optimization of Its Parameters Using ANN. Mechanics 2018, 24, 449–455. [Google Scholar] [CrossRef] [Green Version]
  34. Pimenov, D.Y.; Mia, M.; Gupta, M.K.; Machado, A.R.; Tomaz, Í.V.; Sarikaya, M.; Wojciechowski, S.; Mikolajczyk, T.; Kaplonek, W. Improvement of Machinability of Ti and Its Alloys Using Cooling-Lubrication Techniques: A Review and Future Prospect. J. Mater. Res. Technol. 2021, 11, 719–753. [Google Scholar] [CrossRef]
  35. ASTM E3-11; Standard Guide for Preparation of Metallographic Specimens. ASM International: West Conshohocken, PA, USA, 2017.
  36. Astakhov, V.P.; Shvets, S. The Assessment of Plastic Deformation in Metal Cutting. J. Mater. Processing Technol. 2004, 146, 193–202. [Google Scholar] [CrossRef]
  37. Noyan, I.C.; Cohen, J.B. Residual Stress—Measurement by Diffraction and Interpretation; Society for Experimental Mechanics; Springer: New York, NY, USA, 1987. [Google Scholar]
  38. Astakhov, V.P. Metal. Cutting Mechanics; CRC Press: Boca Raton, FL, USA, 1998. [Google Scholar]
  39. Abushawashi, Y.; Xiao, X.; Astakhov, V. Practical Applications of the “Energy–Triaxiality” State Relationship in Metal Cutting. Mach. Sci. Technol. 2017, 21, 1–18. [Google Scholar] [CrossRef]
  40. Outeiro, J.C. Residual Stresses in Machining. In Mechanics of Materials in Modern Manufacturing Methods and Processing Technique; Elsevier: Amsterdam, The Netherlands, 2020. [Google Scholar]
  41. Denguir, L.A.; Outeiro, J.C.; Fromentin, G.; Vignal, V.; Besnard, R. A Physical-Based Constitutive Model for Surface Integrity Prediction in Machining of OFHC Copper. J. Mater. Processing Technol. 2017, 248, 143–160. [Google Scholar] [CrossRef] [Green Version]
  42. Cheng, W.; Outeiro, J.; Costes, J.-P.; M’Saoubi, R.; Karaouni, H.; Astakhov, V. A Constitutive Model for Ti6Al4V Considering the State of Stress and Strain Rate Effects. Mech. Mater. 2019, 137, 103103. [Google Scholar] [CrossRef] [Green Version]
  43. Wang, B.; Xiao, X.; Astakhov, V.P.; Liu, Z. The Effects of Stress Triaxiality and Strain Rate on the Fracture Strain of Ti6Al4V. Eng. Fract. Mech. 2019, 219, 106627. [Google Scholar] [CrossRef]
  44. Hou, J.; Zhou, W.; Duan, H.; Yang, G.; Xu, H.; Zhao, N. Influence of Cutting Speed on Cutting Force, Flank Temperature, and Tool Wear in End Milling of Ti-6Al-4V Alloy. Int. J. Adv. Manuf. Technol. 2014, 70, 1835–1845. [Google Scholar] [CrossRef]
  45. Abushawashi, Y. Modelling of Metal Cutting as Purposeful Fracture of Work Material. Ph.D. Thesis, Michigan State University, East Lansing, MI, USA, 2013. [Google Scholar]
  46. Storchak, R.; Möhring, S. Determination of Johnson–Cook Constitutive Parameters for Cutting Simulations. Metals 2019, 9, 473. [Google Scholar] [CrossRef] [Green Version]
  47. Zorev, N.N. Metal Cutting Mechanics; Pergamon Press: Oxford, UK, 1966. [Google Scholar]
  48. Ren, C.; Ke, Z.; Chen, G.; Wu, J. Modeling of Tool-Chip Contact Length for Orthogonal Cutting of Ti-6Al-4V Alloy Considering Segmented Chip Formation. Trans. Tianjin Univ. 2016, 22, 525–535. [Google Scholar] [CrossRef]
  49. Iqbal, S.A.; Mativenga, P.T.; Sheikh, M.A. A Comparative Study of the Tool–Chip Contact Length in Turning of Two Engineering Alloys for a Wide Range of Cutting Speeds. Int J. Adv. Manuf Technol 2009, 42, 30–40. [Google Scholar] [CrossRef]
  50. Liu, C.R.; Barash, M.M. The Mechanical State of the Sublayer of a Surface Generated by Chip-Removal Process, Part 1: Cutting with a Sharp Tool. J. Eng. Ind. 1976, 98, 1192–1201. [Google Scholar] [CrossRef]
  51. Matsumoto, Y.; Barah, M.M.; Liu, C.R. Effect of Hardeness on the Surface Integrity of AISI 4340 Steel. J. Eng. Ind. 1986, 108, 169–175. [Google Scholar] [CrossRef]
  52. Scholtes, B. Residual Stresses Introduced by Machining. In Advance in Surface Treatments, Technology-Applications-Effects, International Guidebook on Residual Stresses; Pergamon Press: Oxford, UK, 1987; pp. 59–71. [Google Scholar]
Figure 1. Schematic representation of the orthogonal cutting tests.
Jmmp 06 00058 g001
Figure 2. Parameters of the chip geometry measured by optical microscope.
Jmmp 06 00058 g002
Figure 3. Comparing the least-squares (quadratic) and the stochastic (Gaussian) regressions for three different situations (ac), and three different couples (a,b).
Jmmp 06 00058 g003aJmmp 06 00058 g003b
Figure 4. Pareto analysis of the factors affecting the cutting force (Fc) based on all cutting conditions.
Jmmp 06 00058 g004
Figure 5. Pareto analysis of the factors affecting the thrust force (Ft) based on all cutting conditions.
Jmmp 06 00058 g005
Figure 6. Influence of the cutting parameters on the cutting force (Fc) based on all cutting conditions.
Jmmp 06 00058 g006
Figure 7. Influence of the cutting parameters on the thrust force (Ft) based on all cutting conditions.
Jmmp 06 00058 g007
Figure 8. Pareto analysis of the factors affecting CCR based on all cutting conditions.
Jmmp 06 00058 g008
Figure 9. Influence of the cutting parameters on the CCR based on all cutting conditions.
Jmmp 06 00058 g009
Figure 10. Influence of the interactions between cutting parameters on the CCR based on all cutting conditions.
Jmmp 06 00058 g010
Figure 11. Accuracy indicators for the (a) longitudinal and (b) transversal residual stresses (cutting conditions 1, 3, 5, 6, 7, 13, and 14).
Jmmp 06 00058 g011
Figure 12. Residual stress predictions for the (a) longitudinal and (b) directions and corresponding corridor (cutting conditions 2, 4, 8, 9, 10, 11, 12, 15, and 16).
Jmmp 06 00058 g012
Figure 13. Pareto analysis of the factors affecting the residual stresses in the transversal direction (SRST) based on all cutting conditions.
Jmmp 06 00058 g013
Figure 14. Pareto analysis of the factors affecting the residual stresses the longitudinal direction (SRSL) based on all cutting conditions.
Jmmp 06 00058 g014
Figure 15. Influence of the cutting parameters on the SRSL based on all cutting conditions.
Jmmp 06 00058 g015
Figure 16. Influence of the cutting parameters on the SRST based on all cutting conditions.
Jmmp 06 00058 g016
Table 1. Chemical composition of Ti-6Al-4V.
ElementAlVFeOCNTi
Composition (wt. %)6.304.070.160.180.0100.005Remain
Table 2. Tool geometry and cutting regime parameters used in orthogonal cutting tests.
ParameterValue
Cutting speed, Vc (m/min)20; 60
Uncut chip thickness, h (mm)0.15; 0.2
Tool cutting edge radius, rn (µm)16 ± 1.1; 30 ± 1.9
Tool rake angle, γn (°)5 ± 0.13; −6 ± 0.25
Tool clearance angle, αn (°)6 ± 0.23
Width of cut, w (mm)4
Metalworking fluidNo
Table 3. Design of experiments matrix and available results (x—data is available; NA—not available).
#Cutting
Condition Number
γn
(°)
rn
(µm)
Vc
(m/min)
h
(mm)
ForcesCCRRS
1516200.15xxx
2530200.15xxNA
3516200.20xxx
4530200.20xxNA
5516600.15xxx
6530600.15xxx
7516600.20xxx
8530600.20xxNA
9−616200.15xxNA
10−630200.15xxNA
11−616200.20xxNA
12−630200.20xxNA
13−616600.15xxx
14−630600.15xxx
15−616600.20xxNA
16−630600.20xxNA
Table 4. Experimental results of cutting and thrust forces.
Cutting
Condition Number
γn
(°)
rn
(µm)
Vc
(m/min)
h
(mm)
Fc
(N)
Ft
(N)
1516200.151268 ± 10479 ± 29
2530200.151284 ± 6601 ± 12
3516200.201522 ± 47517 ± 31
4530200.201549 ± 19639 ± 8
5516600.151109 ± 28394 ± 15
6530600.151157 ± 9572 ± 24
7516600.201364 ± 32463 ± 8
8530600.201436 ± 11649 ± 27
9−616200.151354 ± 21681 ± 8
10−630200.151443 ± 8894 ± 25
11−616200.201673 ± 17 810 ± 18
12−630200.201709 ± 8931 ± 0
13−616600.151209 ± 18633 ± 9
14−630600.151370 ± 180843 ± 53
15−616600.201536 ± 8773 ± 12
16−630600.201587 ± 2934 ± 20
Table 5. Optimal cutting conditions for minimizing the forces.
γn (°)rn (µm)Vc (m/min)h (mm)Ft (N) Fc (N)
516600.15394.7501103.88
Table 6. Calculated CCR based of the measurements to the chip geometry.
Cutting
Condition Number
γn
(°)
rn
(µm)
vc
(m/min)
h
(mm)
CCR
(-)
1516200.151.50 ± 0.06
2530200.151.60 ± 0.05
3516200.201.35 ± 0.03
4530200.201.49 ± 0.04
5516600.151.60 ± 0.07
6530600.151.39 ± 0.07
7516600.201.48 ± 0.03
8530600.201.52 ± 0.02
9−616200.151.57 ± 0.09
10−630200.151.70 ± 0.05
11−616200.201.49 ± 0.07
12−630200.201.63 ± 0.11
13−616600.151.83 ± 0.05
14−630600.151.92 ± 0.08
15−616600.201.59 ± 0.07
16−630600.201.61 ± 0.07
Table 7. Optimal cutting conditions for minimizing the CCR.
γn (°)rn (µm)Vc (m/min)h (mm)CCR (-)
516200.201.35
Table 8. Experimental results of the residual stresses at the machined surface.
Cutting Condition Numberγn
(°)
rn
(µm)
Vc (m/min)h
(mm)
SRSL
(MPa)
SRST
(MPa)
1516200.15−454 ± 141−73 ± 58
2530200.15NANA
3516200.20−387 ± 589 ± 60
4530200.20NANA
5516600.15−400 ± 7252 ± 60
6530600.15−619 ± 68−51 ± 61
7516600.20−423 ± 3825 ± 85
8530600.20NANA
9−616200.15NANA
10−630200.15NANA
11−616200.20NANA
12−630200.20NANA
13−616600.15−273 ± 5364 ± 71
14−630600.15−479 ± 8657 ± 69
15−616600.20NANA
16−630600.20NANA
Table 9. Experimental and predicted/estimated residual stress results at the machined surface.
Cutting Condition Numberγn
(°)
rn (µm)Vc (m/min)h
(mm)
SRSL
(MPa)
SRST
(MPa)
SRS Measured or Predicted
1516200.15−454 ± 14173 ± 58Measured
2530200.15−631 ± 37−94 ± 53Predicted
3516200.20−387 ± 589 ± 60Measured
4530200.20−611 ± 37−57 ± 53Predicted
5516600.15−400 ± 7252 ± 60Measured
6530600.15−619 ± 68−51 ± 61Measured
7516600.20−423 ± 3825 ± 85Measured
8530600.20−600 ± 374 ± 53Predicted
9−616200.15−285 ± 3721 ± 53Predicted
10−630200.15−486 ± 37−22 ± 53Predicted
11−616200.20−265 ± 3757 ± 53Predicted
12−630200.20−466 ± 3714 ± 53Predicted
13−616600.15−273 ± 5364 ± 71Measured
14−630600.15−479 ± 8657 ± 69Measured
15−616600.20−254 ± 37119 ± 53Predicted
16−630600.20−455 ± 3775 ± 53Predicted
Table 10. Optimal cutting conditions for maximizing the compressive residual stresses.
γn (°)rn (µm)Vc (m/min)h (mm)SRST (MPa) SRSL (MPa)
530200.15−93.75−631.75
Publisher’s Note: MDPI stays neutral with regard to jurisdictional claims in published maps and institutional affiliations.

