Article

Microstructure Evolution in Inconel 718 Produced by Powder Bed Fusion Additive Manufacturing

1
Department of Mechanical Engineering, University of Alabama in Huntsville, Huntsville, AL 35805, USA
2
BAM Federal Institute for Materials and Research and Testing, 12205 Berlin, Germany
3
Academic Centre for Materials and Nanotechnology, AGH University of Science and Technology, aleja Mickiewicza 30 Krakow, 30-059 Malopolskie, Poland
4
Materials Science and Engineering Division, Propulsion and Structures Technology, Development Directorate FCDD-AMT-MPS, Huntsville, AL 35808, USA
*
Author to whom correspondence should be addressed.
J. Manuf. Mater. Process. 2022, 6(1), 20; https://doi.org/10.3390/jmmp6010020
Submission received: 20 December 2021 / Revised: 18 January 2022 / Accepted: 25 January 2022 / Published: 29 January 2022
(This article belongs to the Topic Additive Manufacturing)

Abstract

:
Inconel 718 is a precipitation strengthened, nickel-based super alloy of interest for the Additive Manufacturing (AM) of low volume, complex parts to reduce production time and cost compared to conventional subtractive processes. The AM process involves repeated rapid melting, solidification and reheating, which exposes the material to non-equilibrium conditions that affect elemental segregation and the subsequent formation of solidification phases, either beneficial or detrimental. These variations are difficult to characterize due to the small length scale within the micron sized melt pool. To understand how the non-equilibrium conditions affect the initial solidification phases and their critical temperatures, a multi-length scale, multi modal approach has been taken to evaluate various methods for identifying the initial phases formed in the as-built Inconel 718 produced by laser-powder bed fusion (L-PBF) additive manufacturing (AM). Using a range of characterization tools from the bulk differential thermal analysis (DTA) and x-ray diffraction (XRD) to spatially resolved images using a variety of electron microscopy tools, a better understanding is obtained of how these minor phases can be properly identified regarding the amount and size, morphology and distribution. Using the most promising characterization techniques for investigation of the as-built specimens, those techniques were used to evaluate the specimens after various heat treatments. During the sequence of heat treatments, the initial as-built dendritic structures recrystallized into well-defined grains whose size was dependent on the temperature. Although the resulting strength was similar in all heat treated specimens, the elongation increased as the grain size was refined due to differences in the precipitated phase distribution and morphology.

1. Introduction

Nickel-based super alloys, such as Inconel 718, are used in aerospace applications due to their ability to retain their strength and resistance to corrosion at temperatures up to 650 °C [1,2,3]. Inconel 718 components can be produced by either casting, powder metallurgy sintering, or the thermomechanical processing of either cast or sintered preforms to form wrought materials. The slow kinetics of the phase transformations in Inconel 718 retards the formation of detrimental phases making it favorable for fusion welding of complex assemblies [2,4] and suitable for additive manufacturing (AM).
Use of AM reduces the cost of fabricating Inconel 718 components with its ability to directly build complex assemblies and eliminate subsequent joining operations. Since Inconel 718 components can be produced using powder metallurgy, powders are readily available for use in AM processes. Table 1 provides a summary of the phases commonly found in Inconel 718 and includes the solidification phases of γ, Laves and MC carbides, which are typically niobium carbides (NbC). The precipitation phases include δ and the strengthening precipitates γ’ and γ″. Depending on their size, morphology and distribution, the solidification phases are reported to either be beneficial, as in the case of the MC type carbides for controlling grain size and morphology [5,6,7,8,9,10,11], or detrimental in the case of the Laves phase [12,13]. The role of the δ phase in resulting morphology has been less studied [14]. As noted in Table 1, Nb is the dominant element in the solidification phases as well as in the subsequent formation of δ, γ’ and γ″.
With any solidification process, segregation of alloying elements occurs dependent on the cooling rate [17,18]. Equilibrium solidification paths are noted to start with the formation of Nickel-Iron-Chromium (Ni-Fe-Cr) γ dendrites in the range of 1340 to 1360 °C [19,20,21]. This leaves the inter-dendritic regions Nb rich. Depending on the carbon content, MC type carbides are favored to form in the range of 1280 to 1265 °C and Laves in the slightly lower range of 1160 to 1175 °C [17,22,23]. Dissolution of the Laves phase in subsequent heat treatments is noted to be difficult to achieve since extended heat treatments at lower temperatures result in grain growth and increasing the temperature to its solubility range of 1076 to 1160 °C can result in incipient melting at the grain boundaries [2,6,22,24].
The cooling rate during solidification also affects the amount of the Laves phase formed as noted in casting practices where increasing the rate is used to minimize the Laves phase formation [18]. Since the solidification rates in laser powder bed fusion (L-PBF) are in the range of 103 to 106 °C/s, Laves formation is expected to be minimized in AM processing as compared to castings or weldments [18,20,25]. However, the resulting distribution, morphology and volume fraction of the Laves phase is often cited as a concern regarding its effect on the mechanical properties [26,27,28]. The formation of discontinuous globular Laves phase along grain boundaries has been reported to improve the quasi-static room temperature strength in addition to elevated temperature stress rupture properties [29]. If the particles significantly coarsen, the Laves phase is reported to have a detrimental effect on the strength and fatigue properties [26]. Thus, the size and morphology of the Laves phase is strongly correlated with its resulting effect on mechanical properties [16].
The δ phase can either precipitate during heat treatments or result from over aging of the metastable γ″ phase. Our understanding of the δ phase precipitation is based on wrought material processing. In wrought material, the δ phase typically forms along grain boundaries within the range of 870 to 1065 °C [5,6,7,8,9,10,11]. At temperatures below 1010 °C, an acicular shape is favored, and at temperatures over 1040 °C, a global shape is favored. In recent studies in L-PBF of Inconel 625 [14], the formation of the δ phase was noted to be influenced by the degree of homogenization. Both the δ phase and the MC carbide phases are effective at pinning grain boundaries and influencing the resulting grain structure [7,8,9,29]. The effect on the resulting grain morphology and mechanical properties are reflected in the heat treatment standards for Inconel 718. In wrought materials a solution treatment below the δ solvus is recommended for applications requiring high tensile and fatigue strength [30] and above the δ solvus is recommended for applications requiring optimum ductility and impact properties [31].
In fully homogenized materials, a solutionizing temperature is used prior to a two-step aging treatment to precipitation the γ’ and γ″ phases within the temperature range of 720 to 620 °C [32,33,34]. In Inconel 718, the γ″ phase is reported to be the primary strengthener. As noted in Table 1, these phases differ only as variations on the cubic closed-packed structure, related to the ordering of the alloying atoms thus affecting the symmetry sites and Kikuchi diffraction. Due to the similarity in crystallographic structure among the γ matrix and γ’/γ″ phases, it is difficult to individually identify these phases on the basis of bulk diffraction alone. In addition, the nanometer sized strengthening precipitates require use of high resolution transmission electron microscopy (TEM) imaging to resolve [32,35]. The effectiveness of aging heat treatment is thus indicated by tensile or hardness results.
Although many studies have investigated the as-built (AB) microstructure of Inconel 718 fabricated by laser-powder bed fusion (L-PBF), spatial phase identification is based on the elemental composition and morphology in the Nb-rich inter-dendritic regions of the AB cellular structure [23,26,36,37,38,39,40,41,42]. Among the possible phases, diffraction can be used to distinguish the Laves and δ phases, if they are present in sufficient quantity and size. The ability to distinguish between the γ matrix and γ’/γ″ strengthening phase cannot be resolved using bulk diffraction techniques due to similarity in the cubic closed-packed structure and are too small to be observed without higher resolution TEM.
Thus, it is challenging to adequately describe the starting microstructure of an AM build considering both bulk and spatial distributions. Optimization of heat treatments for L-PBF Inconel 718 are developed based on control and manipulation of the starting microstructure to achieve the desired performance. Proper identification of secondary phases in complex microstructures such as Inconel 718 must consider both composition and crystal structure especially considering the non-equilibrium conditions. By taking a multi-length scale, multi-modal approach toward characterization of both the composition, critical temperatures, and crystal structure of the AB L-PBF Inconel 718, secondary phases in the AB microstructure can be accurately identified to guide selection of heat treatments.
Due to the rapid solidification nature of the AM process, development of post processing methods for L-PBF AM Inconel 718, have questioned the use of heat treatments developed for wrought alloys. These heat treatments range from direct aging in one step vs. the standard two-step aging treatment developed for wrought materials [5,43,44]. Most recently ASTM Standard F3055 has been published for processing of L-PBF Inconel 718 [45]. This standard builds on those previously developed for wrought Inconel 718 [30,31], adding stress relief and hot isostatic press (HIP) and homogenization steps. The use of HIP/homogenization parameters are related to those developed for cast Inconel 718 for control of the solidification phases and minimizing porosity. The time-temperature-transformation (TTT) diagrams developed for wrought Inconel 718 show the tradeoffs controlling the formation of δ vs. γ’/γ″ and do not show Laves [46]. It is interesting to note that the Laves phase is shown on the TTT diagrams for cast alloys, but not for wrought materials [18,20,25,47]. As Nb is a prominent element in Inconel 718, careful control of the heat treatment cycles is used to control the volume fractions of each of the phases summarized in Table 1. Careful control of time and temperature is required to promote the formation of the δ phase along with the metastable γ’ and γ″ phases [4,46]. The precipitation and growth of the δ phase has been widely studied in the development of wrought processing whereas control of the Laves phase has been widely studied in the development of cast processing. Optimization of post processing for L-PBF AM materials presents a need for proper identification and quantification of the various phases formed under the non-equilibrium processing. As noted in a recent study of L-PBF Inconel 625, the micro segregations within the inter-dendritic regions can affect the precipitation sequence [14].

2. Materials and Methods

Inconel 718 used in this study were argon atomized MicroMelt 718 AM powders from Carpenter Powder Products. Starting elemental chemistry of the feedstock was analyzed by WestmorelandMechanical Testing & Research, Inc. located in Youngstown, PA, USA. Analysis of the heavier elements used Inductively Coupled Plasma (ICP) optical emission spectroscopy (OES), in accordance with ASTM E1479-16 [48]. Analysis of the lighter elements was made in accordance with ASTM E1019-18 with combustion for carbon and inert gas fusion (IGF) for oxygen and nitrogen [49]. Both the powders and the resulting AM material were analyzed for alloy element stability and introduction of contaminants using 10 gm samples.
The size and shape analysis of the starting powders was obtained from Horiba Instruments, Inc. located in Irvine, CA, USA. A Horiba model LA-9, laser diffraction particle size analyzer measured the dry powders using an air-jet dispersion method at 0.40 MPa for 5000 s. Approximately 100 particles were used in the analysis.
The specimens were printed on a Concept Laser model M2 machine with a 90° alternating pattern for each layer. The energy density was 95.2 J/mm3 with a laser power of 180 W. The deposition parameters were 0.105 mm hatch spacing, 30% overlap, 600 mm/s scan speed, and 0.035 mm layer thickness. Deposition parameters were determined from previous studies for optimizing the resulting density.
After printing, subsets of three specimens each underwent the heat treatment cycles listed in Table 2 in accordance with ASTM F3055 [45] and AMS 5663 [30]. One set of samples remained in the AB condition. A second set of samples were directly aged (DA) per the two-step process and allowed to air cool. A third set, denoted ST + Age, underwent a solutionizing treatment (ST) followed by a rapid quench (Q) prior to a two-step aging. The fourth set were subjected to a full heat treatment (FHT), in accordance with ASTM Standard F3055 that consisted of a stress relief (SR) followed by slow cooling (SC) and then HIPed followed by a SC [45]. The specimens were quenched (Q) after the homogenization (Homo) cycle and ST cycles. A two-step age was applied and specimens air cooled. The ST temperatures selected were within the specified range of 941 to 1010 °C [30].
Representative samples were mounted and metallographically prepared using standard practices with a 0.5 μm Al2O3 final polish. Optical micrographs (OM) were prepared for each specimen in the build plane (XY) and build direction (Z). A Zeiss XioVert.A1m Inverted Microscope for Reflected Light Techniques was used to record images from the as-polished samples in addition to those etched with waterless Kalling’s to reveal grain boundaries.
Before etching, bright field images were taken of un-etched samples to record the void size and morphology in two orientations. Sufficient images were recorded at 200× magnification to obtain 100 voids rejecting indications of less than 6 pixels (or 2.7 μm) as noise.
After the OM, the specimens were re-polished to remove the etchant and initial images recorded in a LEO 1530VP field emission gun (FEG) scanning electron microscope (SEM). Backscattered electron (BSE) images were collected to highlight the distribution of Nb-rich regions. Elements were verified using an Oxford energy dispersive spectrometer (EDS).
Detection of critical temperatures associated with phase changes utilized a differential thermal analysis (DTA) with a SETARAM TAG 24 thermo-balance. Endothermic and exothermic effects were monitored over the range of 600 °C to 1400 °C at a rate of 20 K/min during heating and a rate of 10 K/min during cooling. Two heating and cooling cycles were run with an estimated temperature accuracy of +5 °C. Sample mass varied from 32 to 46 mg.
Bulk sample phase identification used a Seifert 3000 PTS x-ray diffractometer (XRD) with a 50 scan/channel semiconductor detector. The XRD was configured with a Co Kα source and was operated at 40 kV and 40 mA over the 2-theta range of 35 to 95° with a step scan of 0.02° for 1200 s.
To obtain spatially resolved information on phase distribution, initial specimens were prepared for TEM. These TEM foils were extracted using a focused ion beam (FIB) in a FEI Quanta 3D field emission gun (FEG) with platinum (Pt) as the protection coating. A JEOL JEM-2200FS TEM equipped with an EX 24065 JGP detector was used for imaging and EDS analysis. The JEOL TEM was operated at 200 kV and was configured with a field emission electron gun (FEG).
Due to the surface sensitivity of Transmission Kikuchi Diffraction (TKD) analysis, conventional TEM preparation was used for a second set of TEM foils to eliminate potential FIB-induced artifacts. Slices of the specimens were mechanically thinned to approximately 100 to 150 μm and 3 mm diameter foils were removed using a punch. The foils were thinned to electron transparency using a Tenupol-3 electropolisher set at 25 V and 18 mA using an electrolyte of ethanol (950 mL) + butanol (100 mL) + perchloric acid (50 mL) maintained at −40 °C. Subsequent imaging of the conventional TEM foils used a FEI Versa 3D FEG SEM operated at 30 keV for TKD analysis. The TEM foil was mounted in an electron backscatter detector (EBSD) holder at the standard 70° tilt. Once in the SEM, the holder was tilted to put the thin foil at a −20° angle to the primary electron beam. An EDAX TSL EBSD was used to obtain the crystallographic information with an EDS detector to verify the elements present.
Round sub-sized specimens were machined for tensile testing from the AB as well as the various heat treatments. A total of 3 specimens were machined for each of the heat treatment steps outlined in Table 2. The specimens had a nominal 0.64 cm diameter and a 7.6 cm nominal gage length and were tested with the tensile axis aligned with the build direction (Z). All tensile tests were conducted on a screw-driven mechanical actuator which used a linear variable differential transformer for displacement feedback. Stress measurements were based on loads obtained from an 89 kN load cell and specimen dimension measurements. Strain measurements were obtained from a 2.5 cm extensometer calibrated to 50% strain. All tests were run in displacement control at a constant crosshead velocity of 0.13 cm/min per ASTM standard E8 [50].

3. Results

3.1. Powder and Elemental Analysis

A Gaussian distribution from 10 to 70 μm of the starting powder was obtained from the powder size analysis. The median size was 27.2 μm and the mean size was 28.4 μm with an aspect ratio of 0.98. Table 3 lists the elemental analysis for the powder and the L-PBF specimens as compared to ASTM Standard B637-18 for wrought Inconel 718 [51]. Although the values are within the standard specification limits, there are slight variations noted between the initial powder and the deposited L-PBF specimens which are attributed to non-homogeneities in the powder in addition to the deposited material.

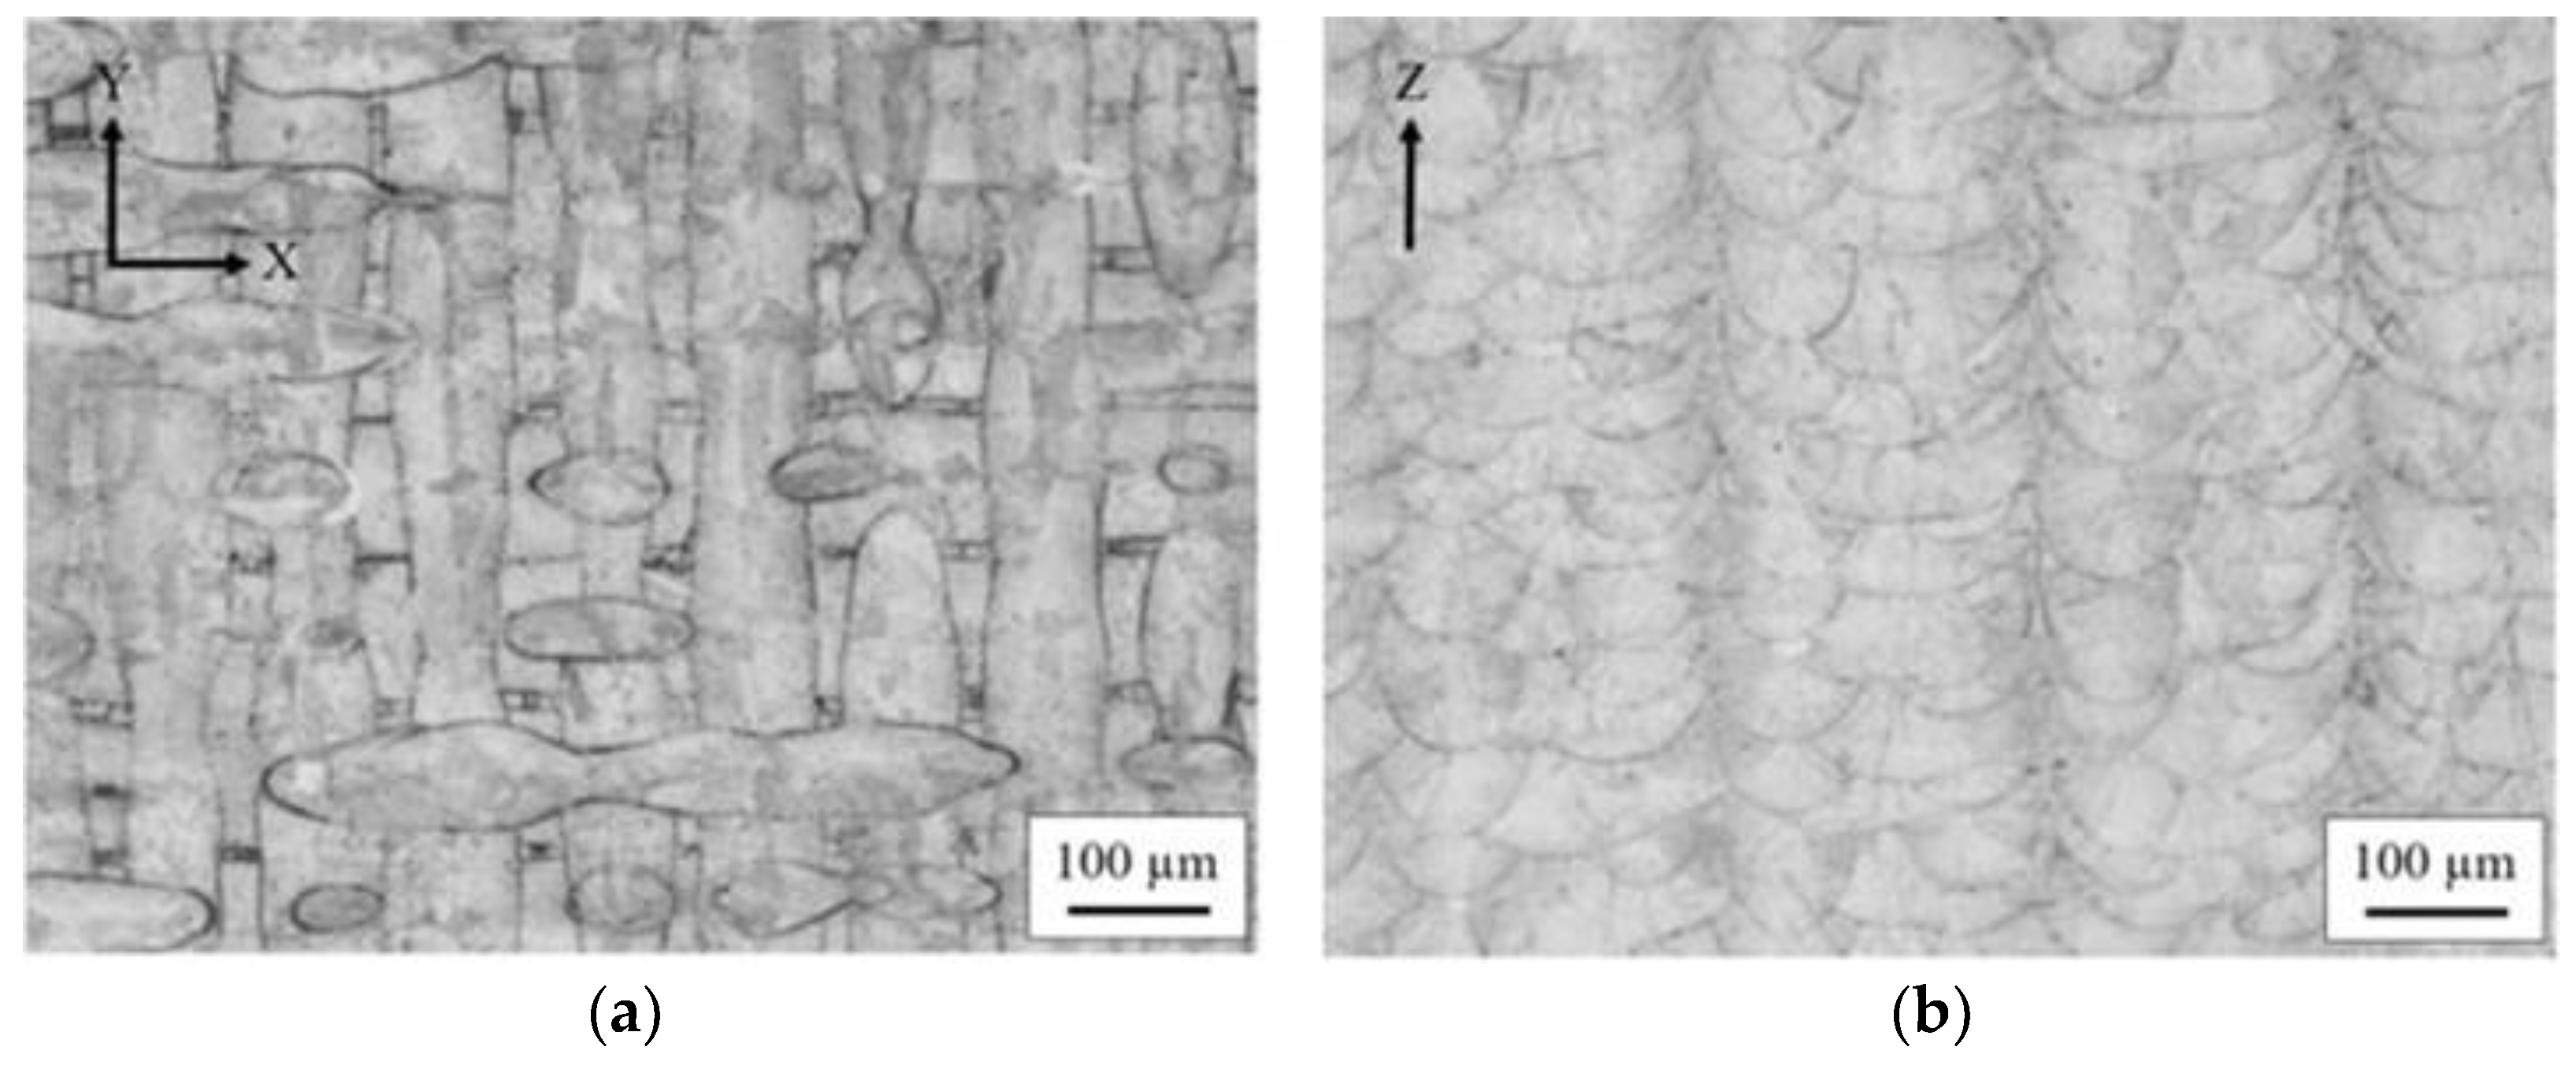
3.2. Optical Microscopy Images

The results of the void analysis from the un-etched samples are presented in Table 4. The similar size in the build plane and build direction indicate spherical voids, indicative of trapped gases [52,53]. The average void size is noted to increase slightly after initial heat treatment consistent with expansion of trapped gases. Following the HIP process in the FHT, the voids are noted to be slightly reduced in size with a decrease in area fraction [54,55]. With the void fraction less than 1%, no detrimental effect on the tensile results is expected [54,55,56].
Optical microscopic images in Figure 1 of the AB microstructure show a basket-weave pattern in the build plane due to the overlapping of alternating 90° layers. Distortion of melt pools along the build direction is due to the melting, solidifying and re-melting of layers. SEM BSE image of the corresponding AB microstructure shown in Figure 2a–d, reveals an inhomogeneous microstructure, common for L-PBF processing where the initial basket weave pattern is retained. Within the higher magnification images in Figure 2c,d, a mixture of cellular and elongated structures is revealed with the bright regions corresponding to the Nb-enriched inter-dendritic regions.

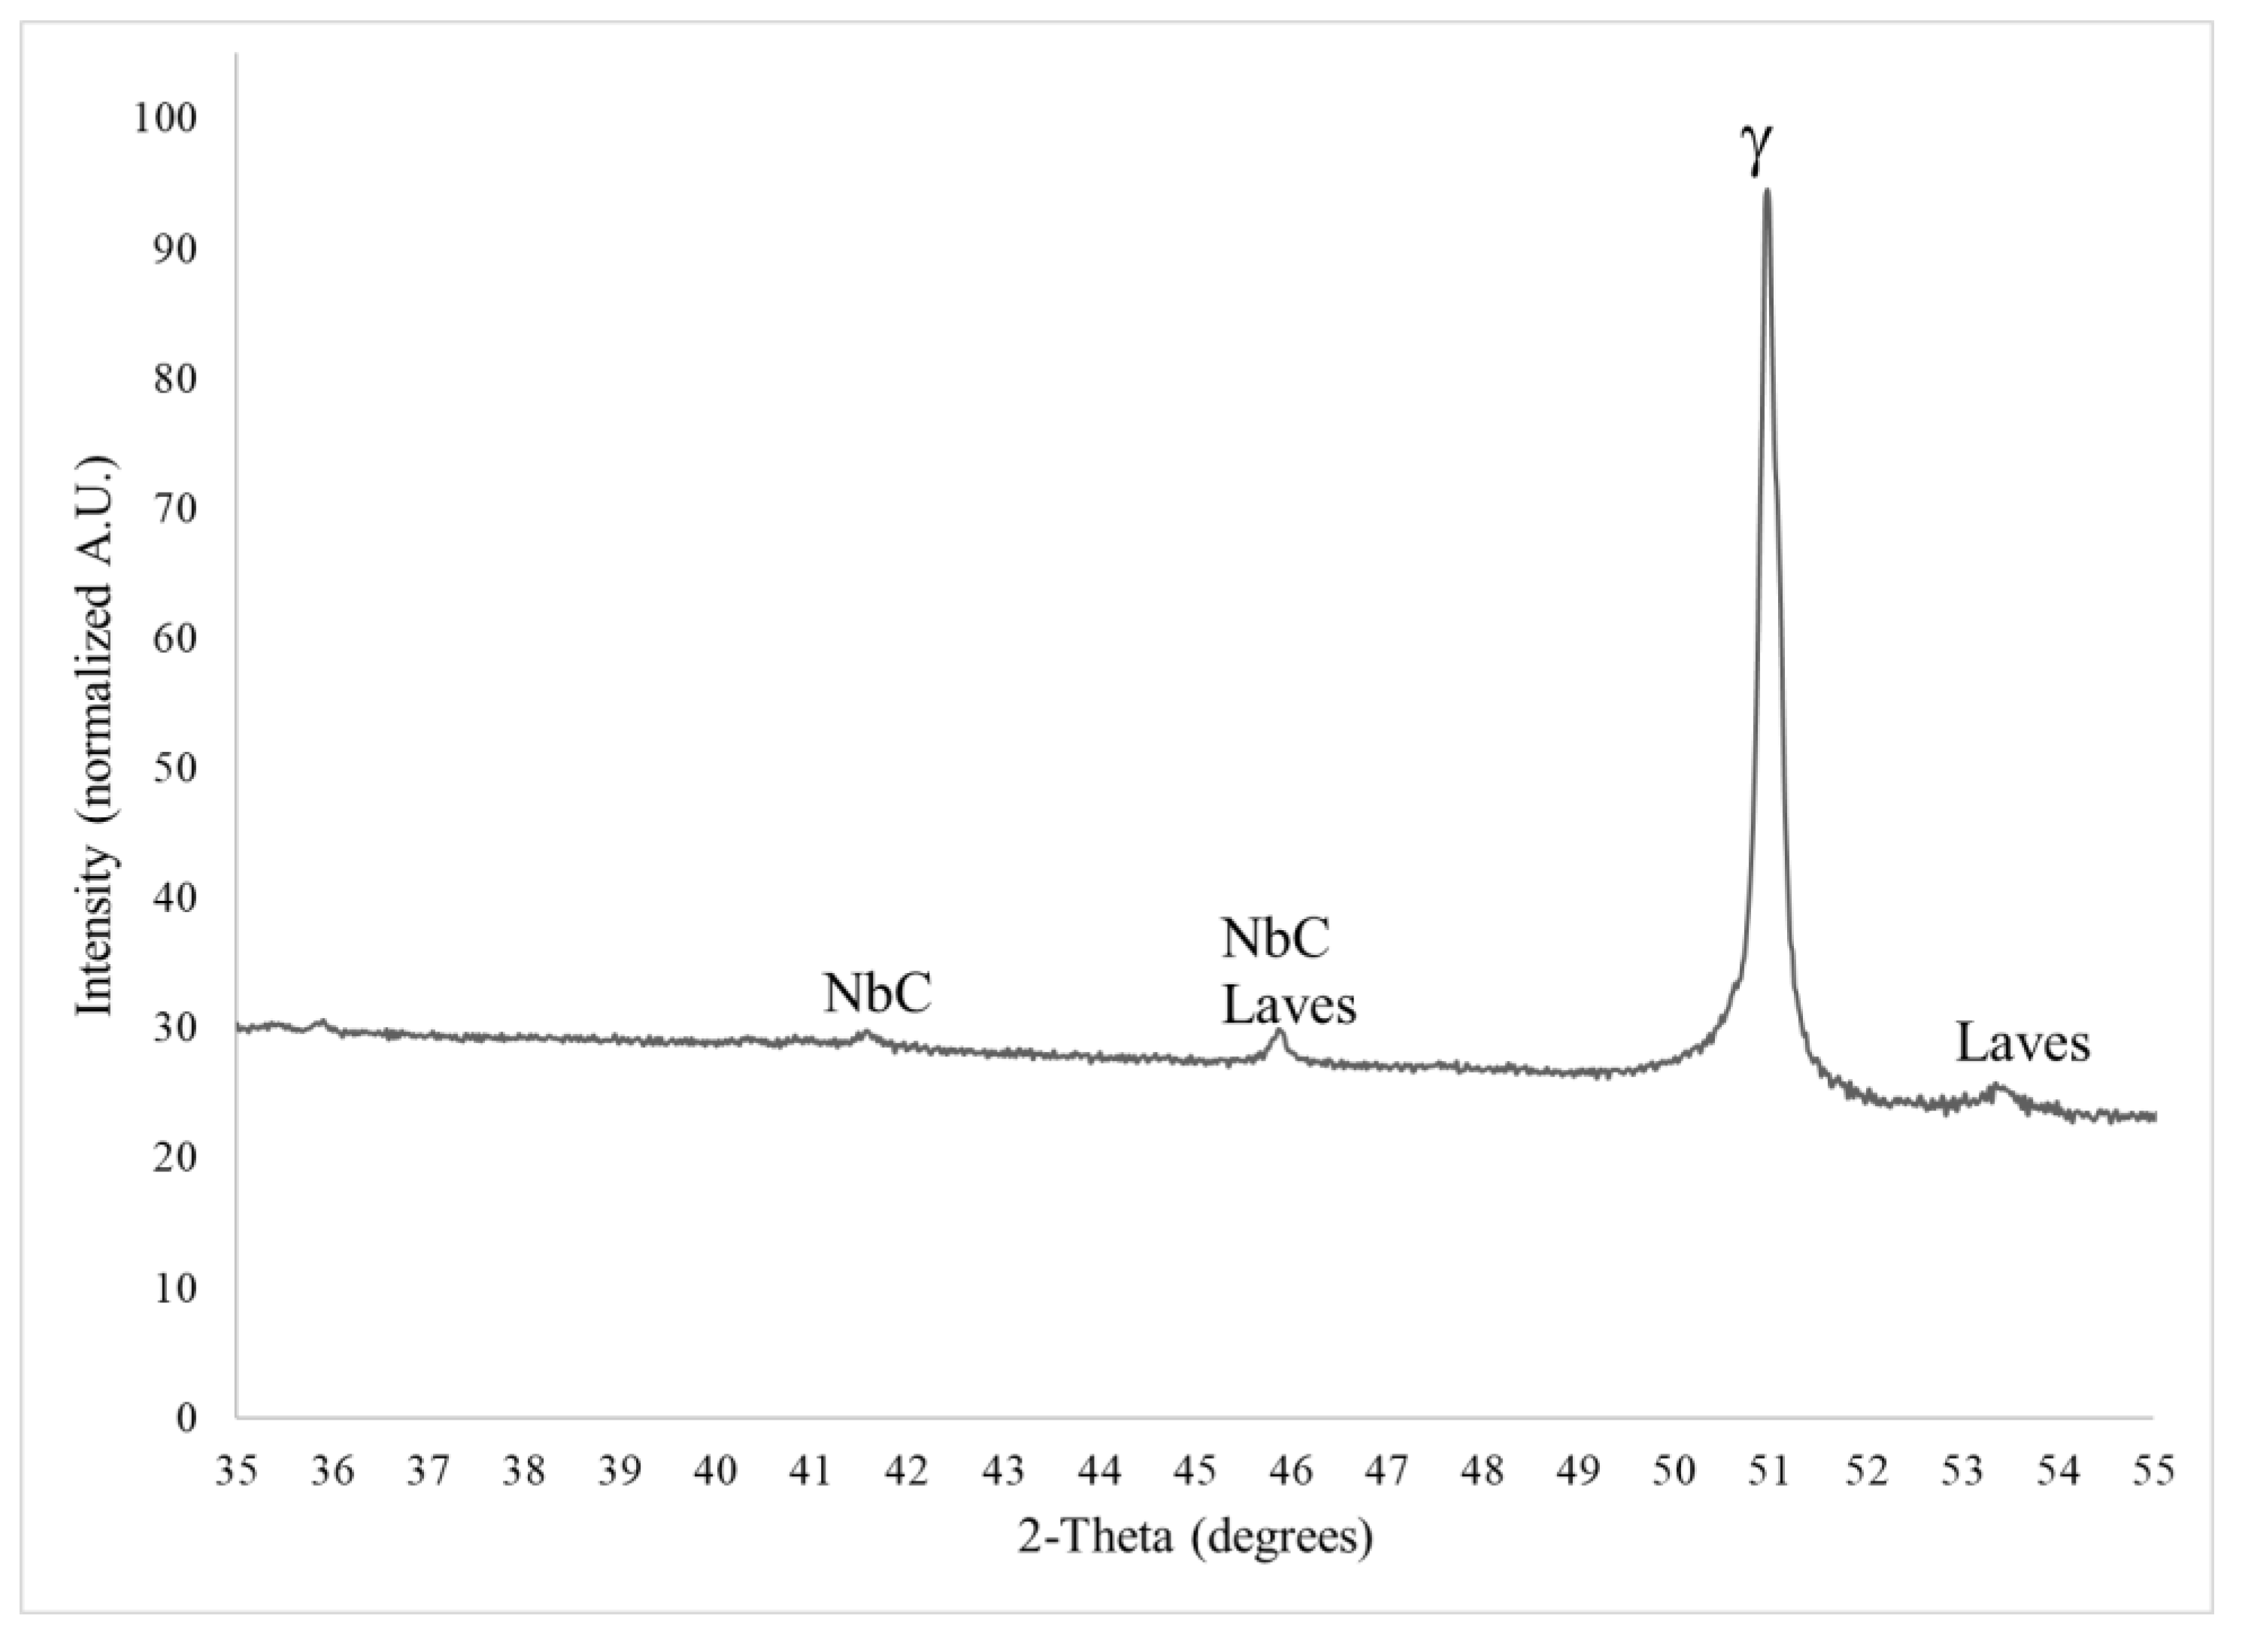
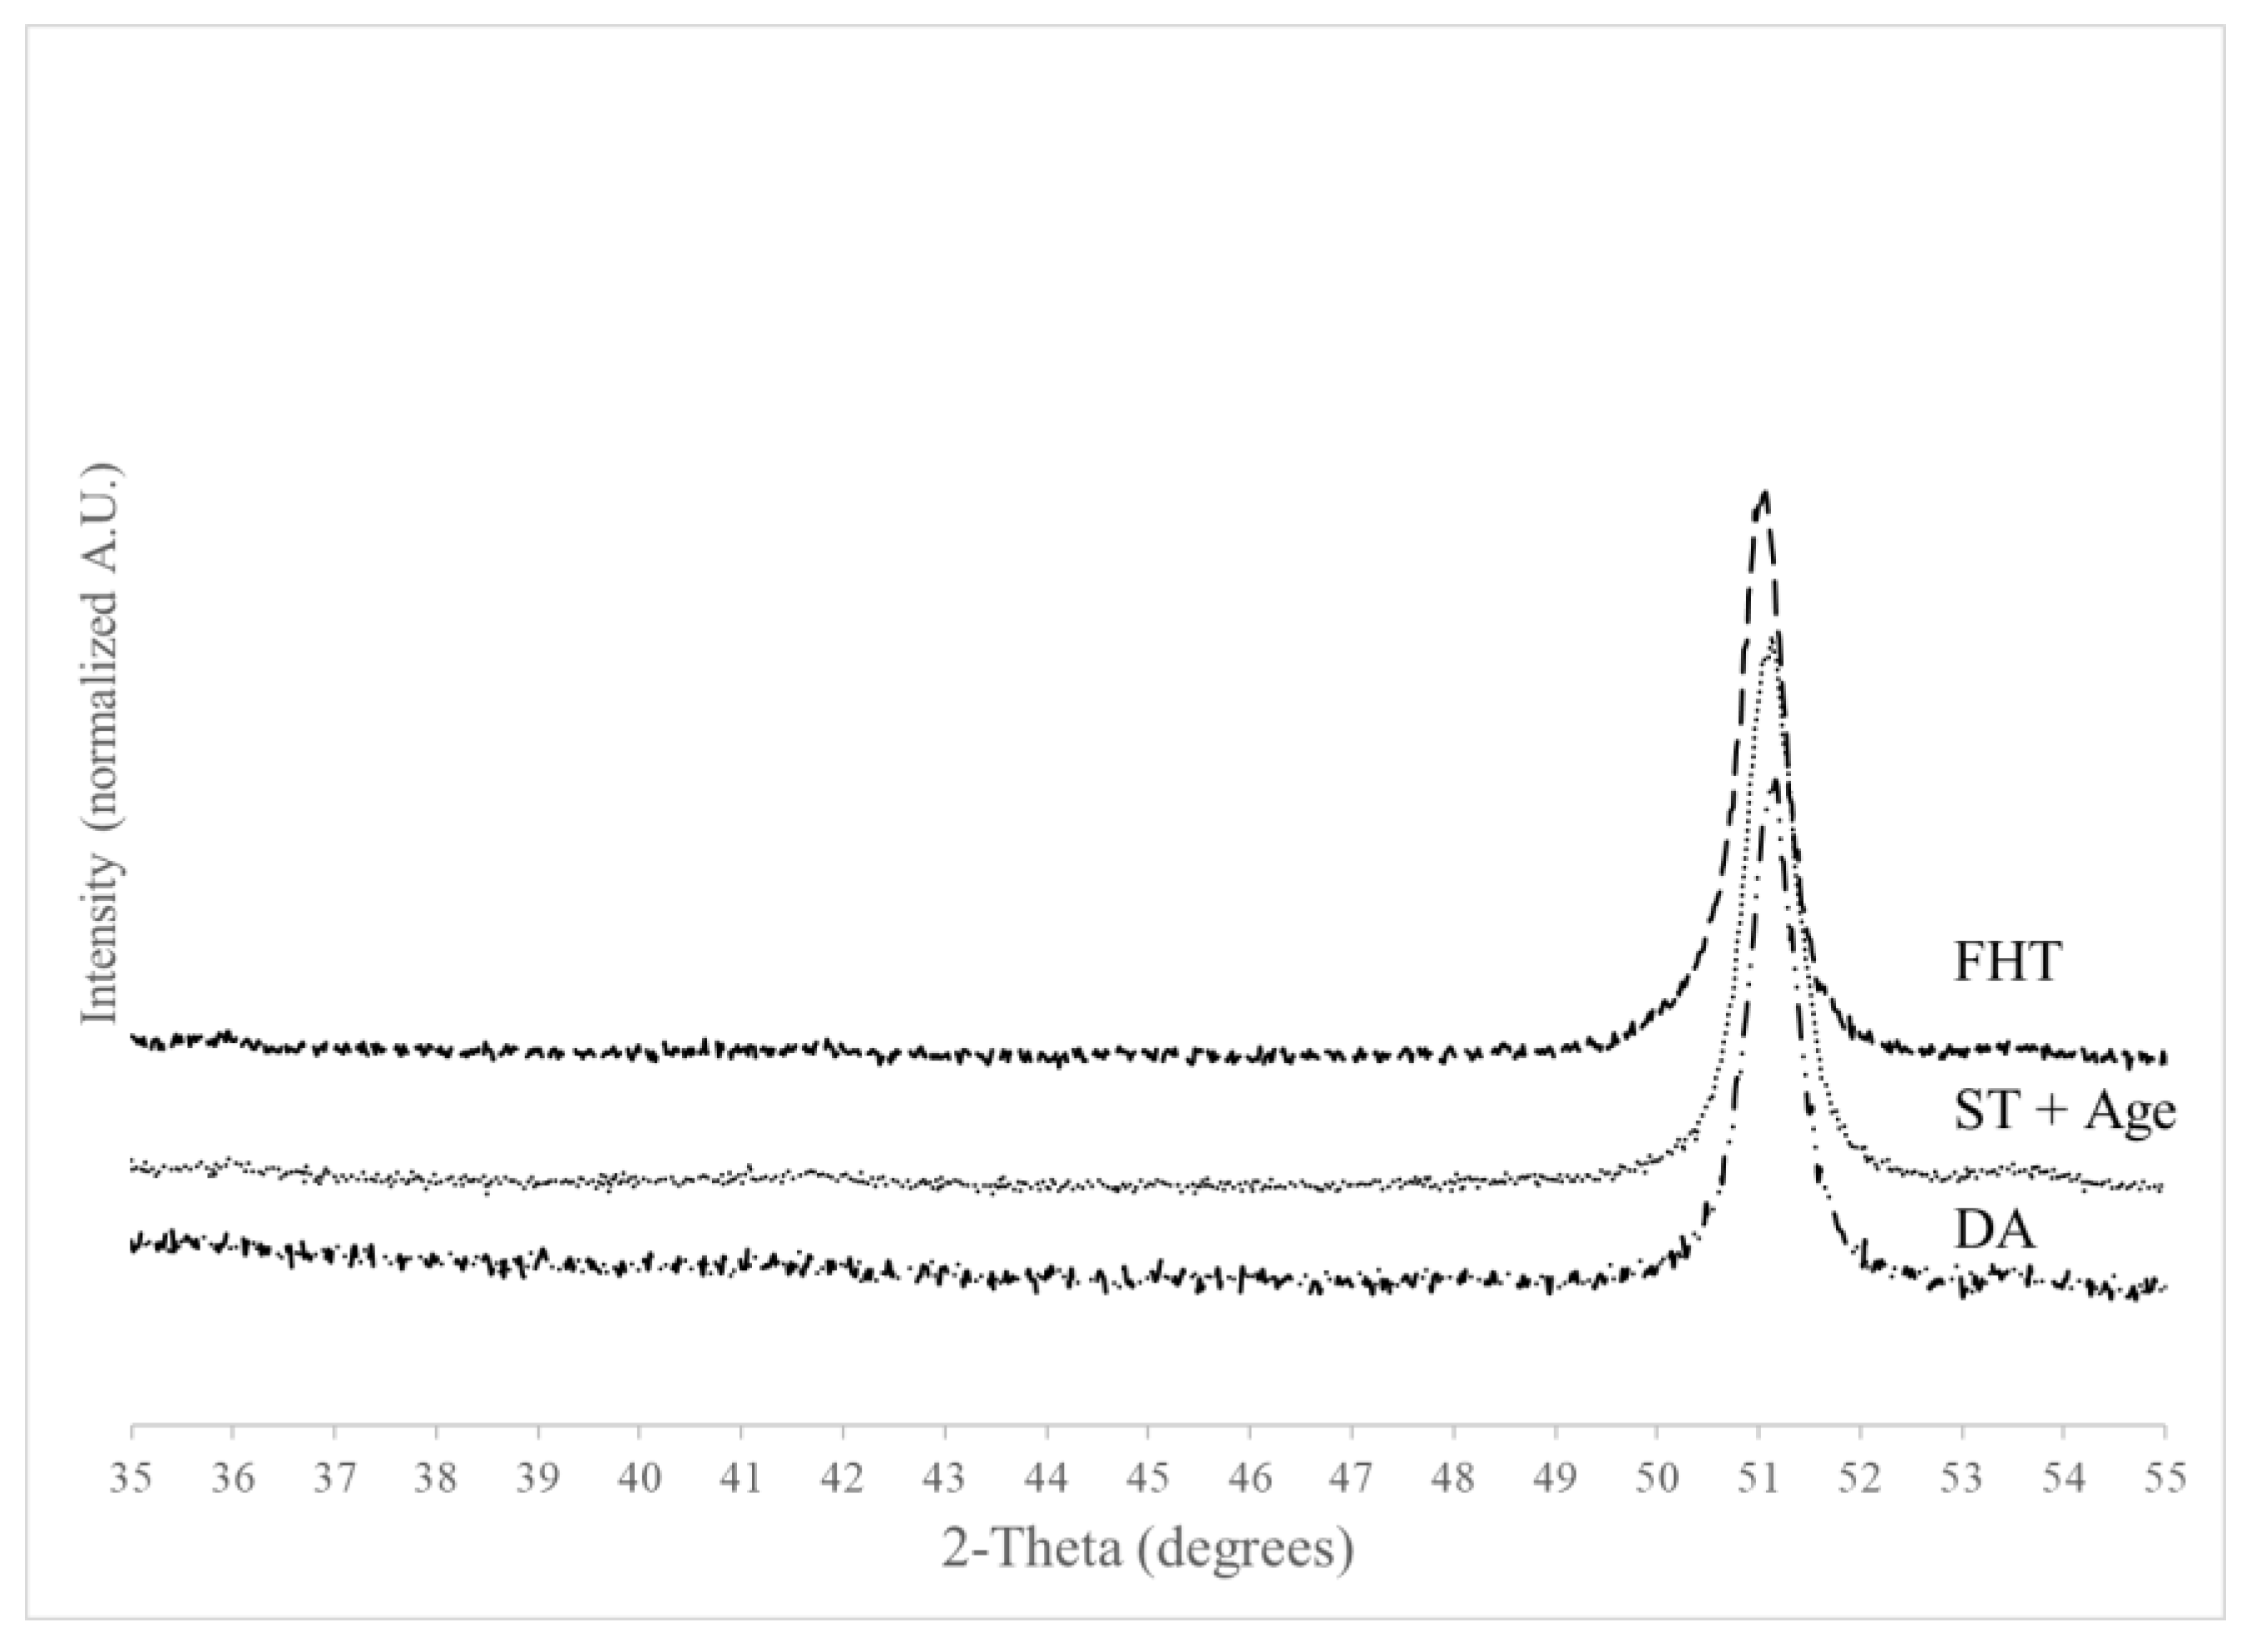
3.3. X-ray Diffraction Results

XRD results for the AB specimen are shown in Figure 3 which index to the solidification phases of Laves (ICDD PDF 04-004-7304) and NbC (ICDD PDF 00-038-1364), in addition to the γ matrix (ICDD PDF 01-004-0850). The low intensities of Laves and NbC are consistent with minor volume fractions.

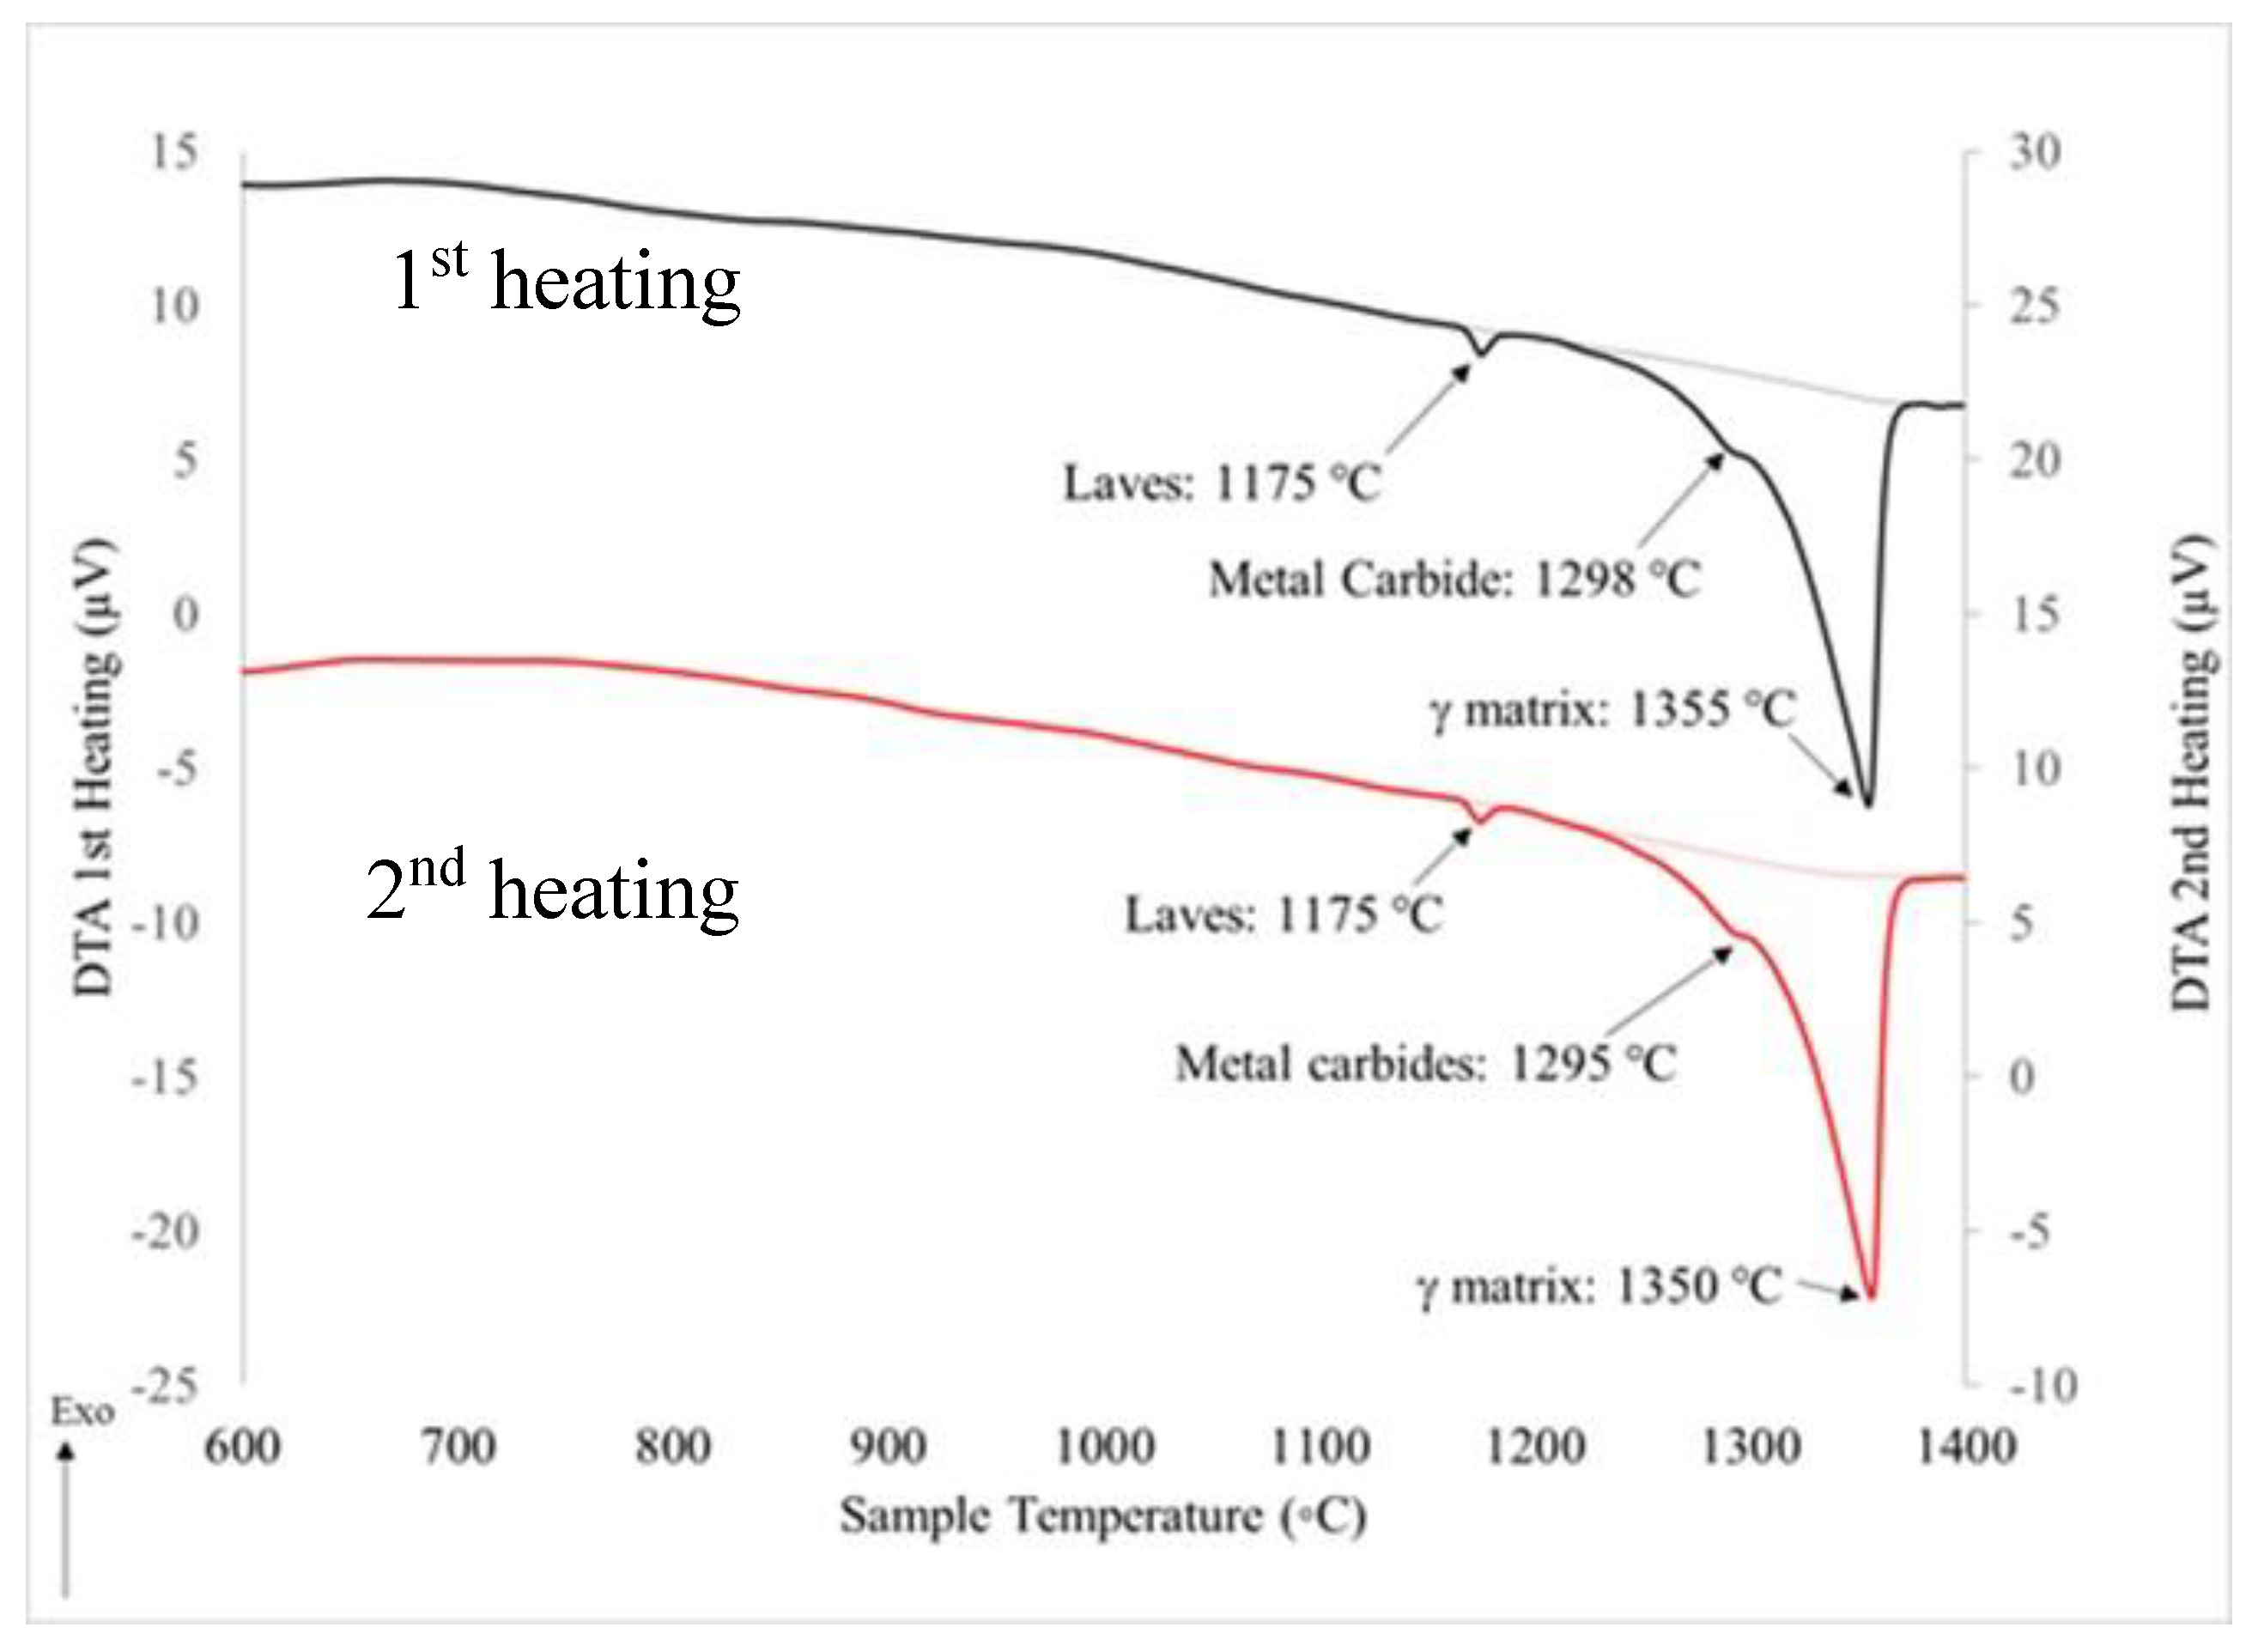
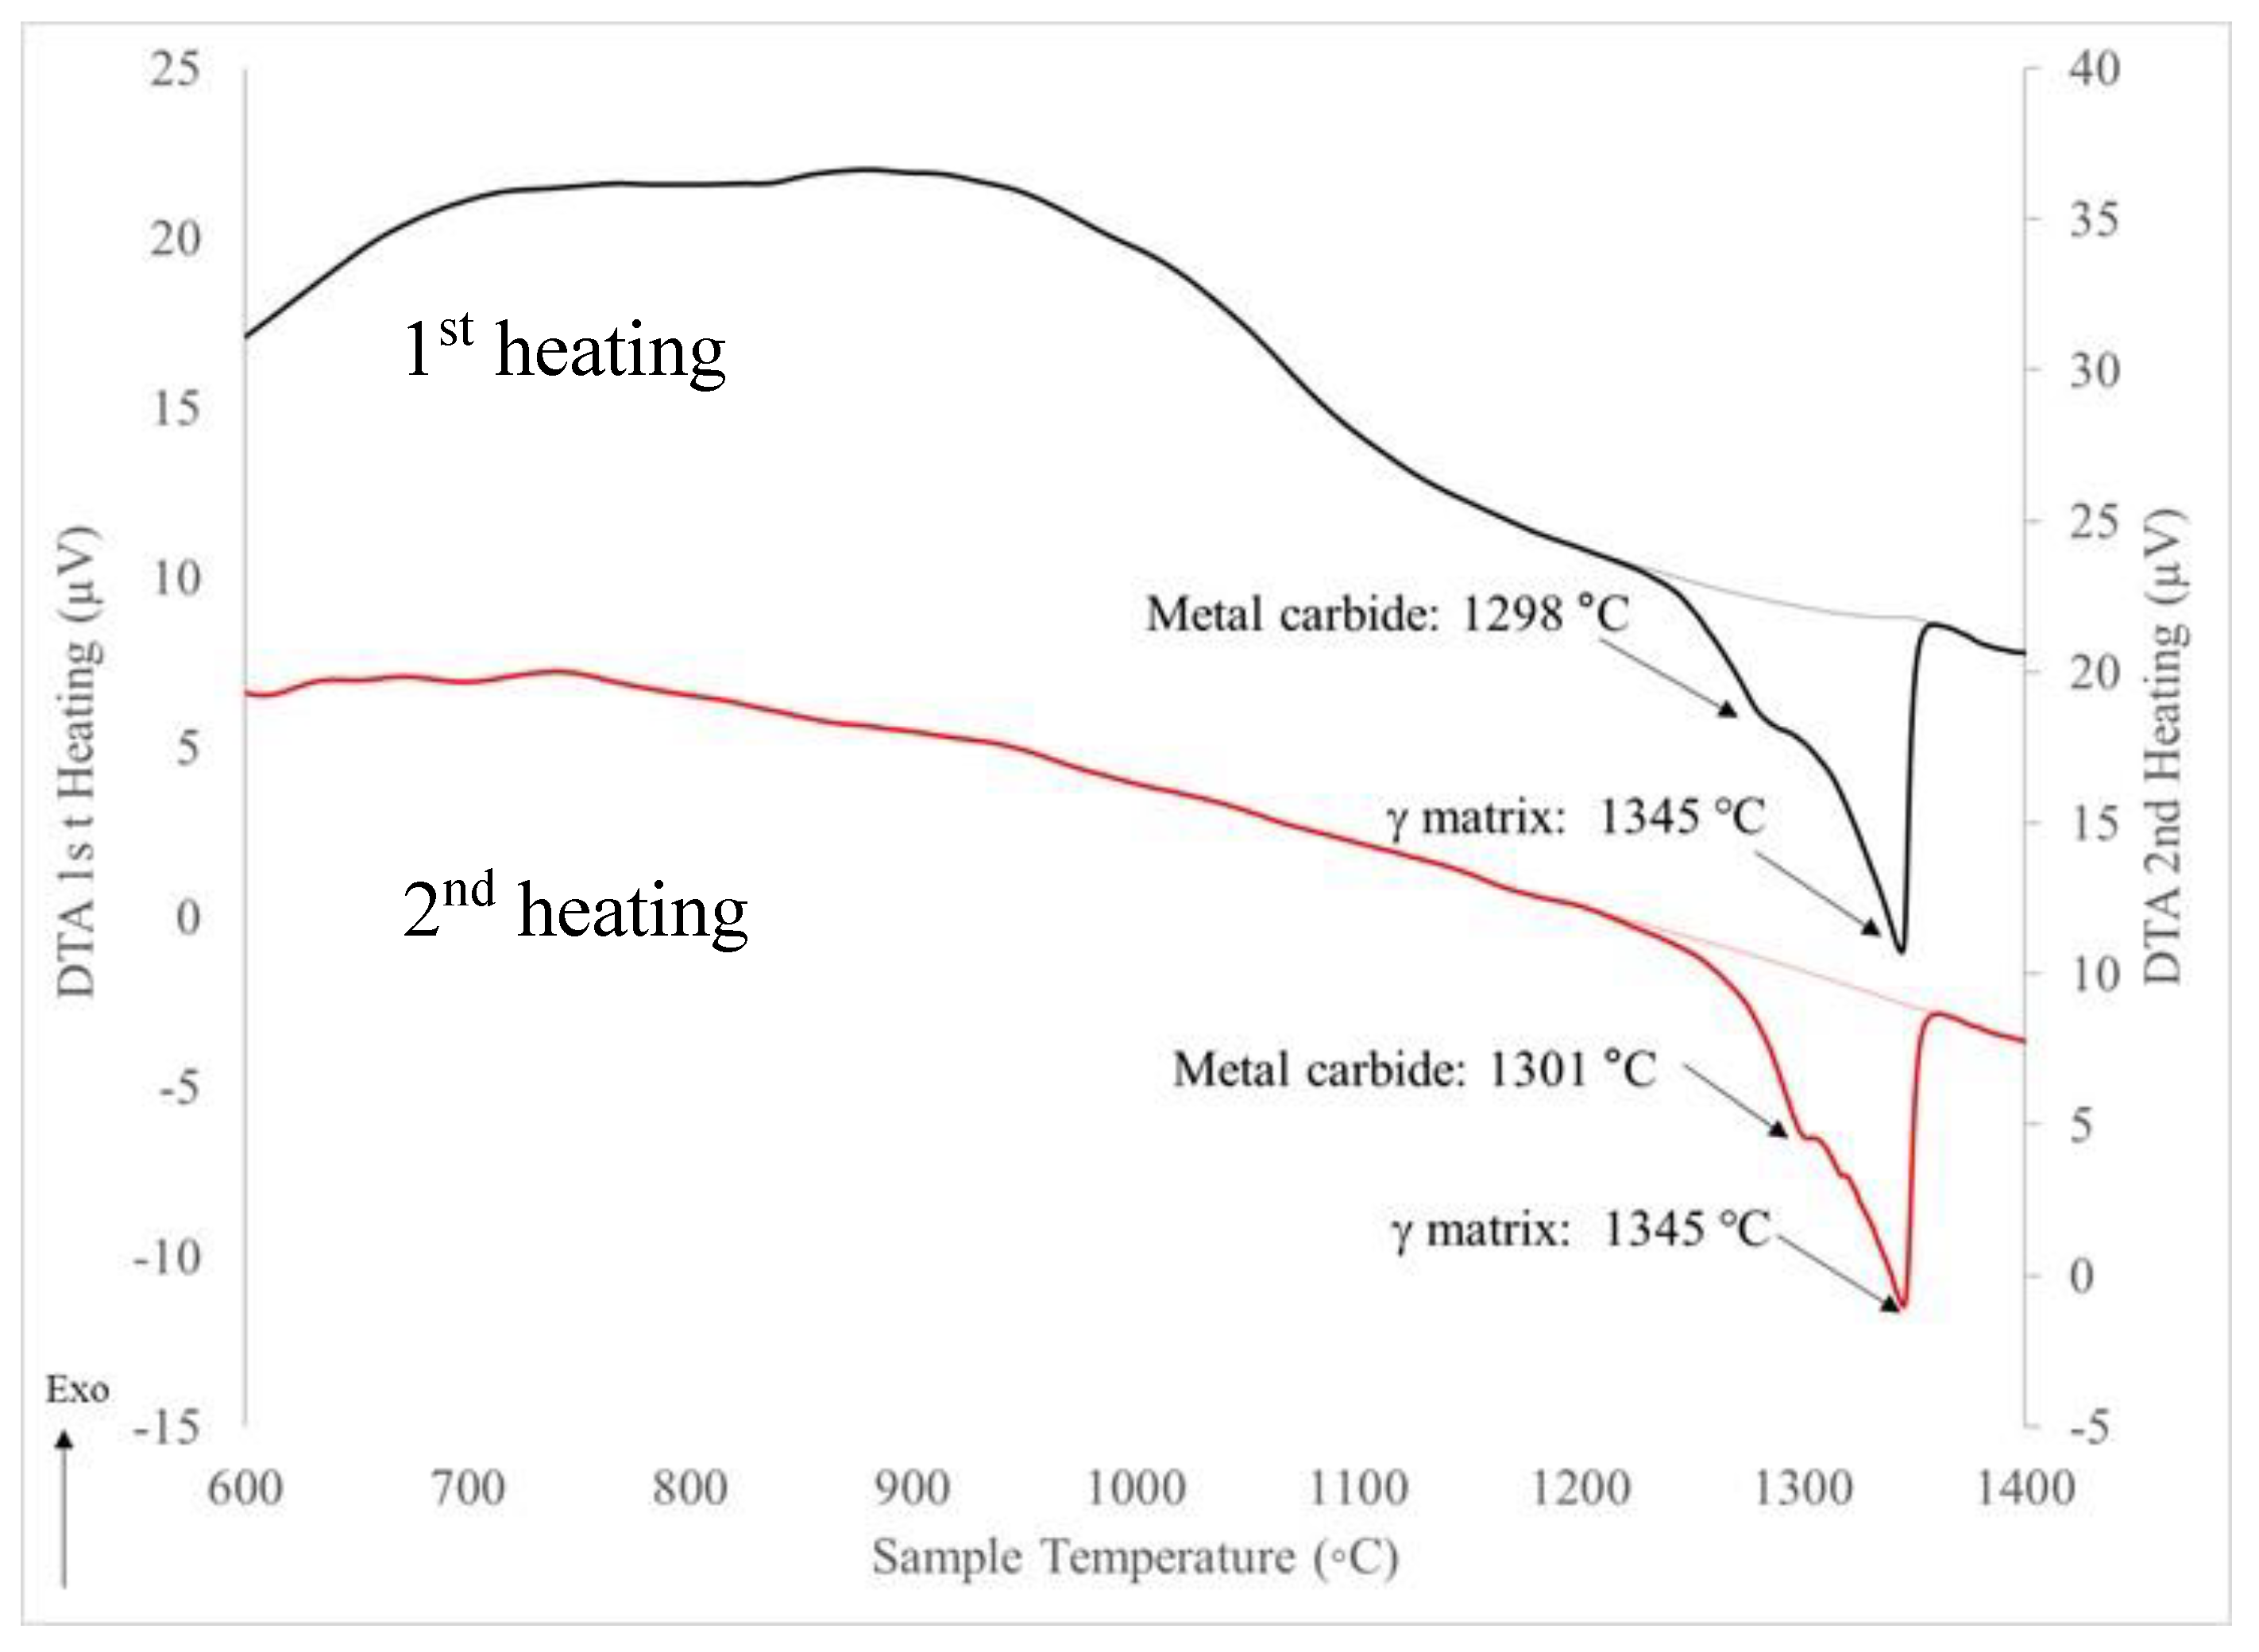
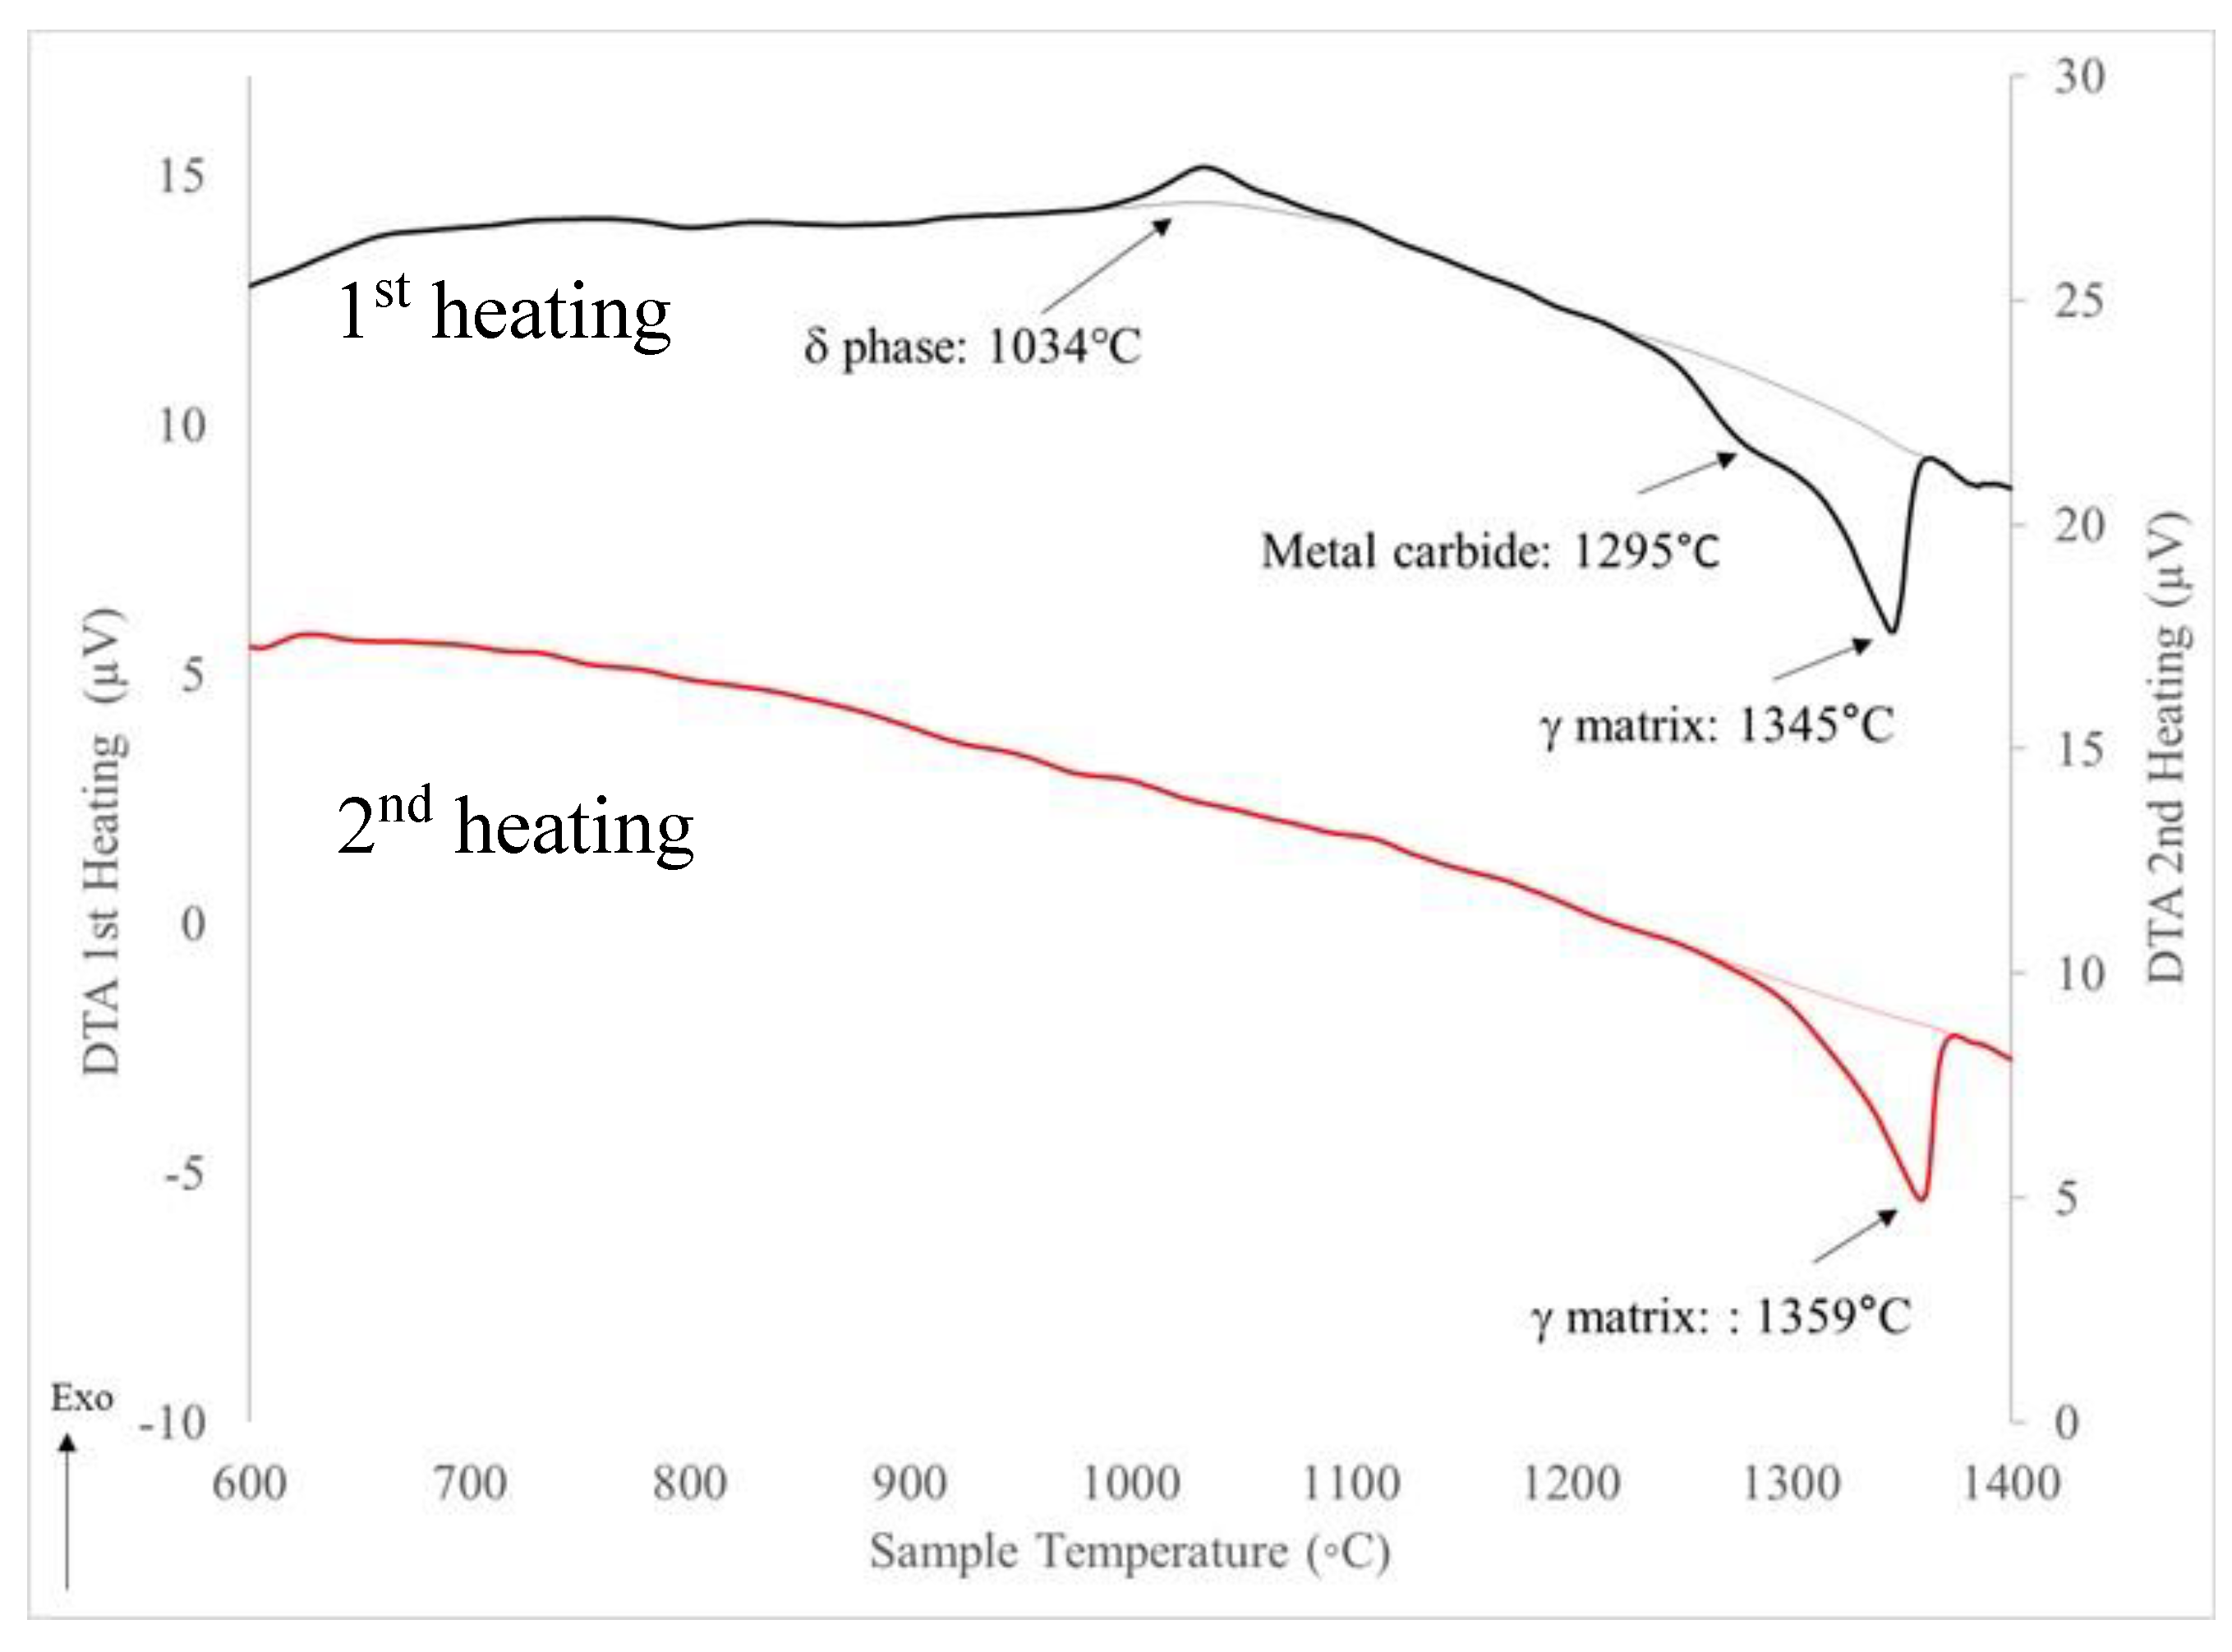
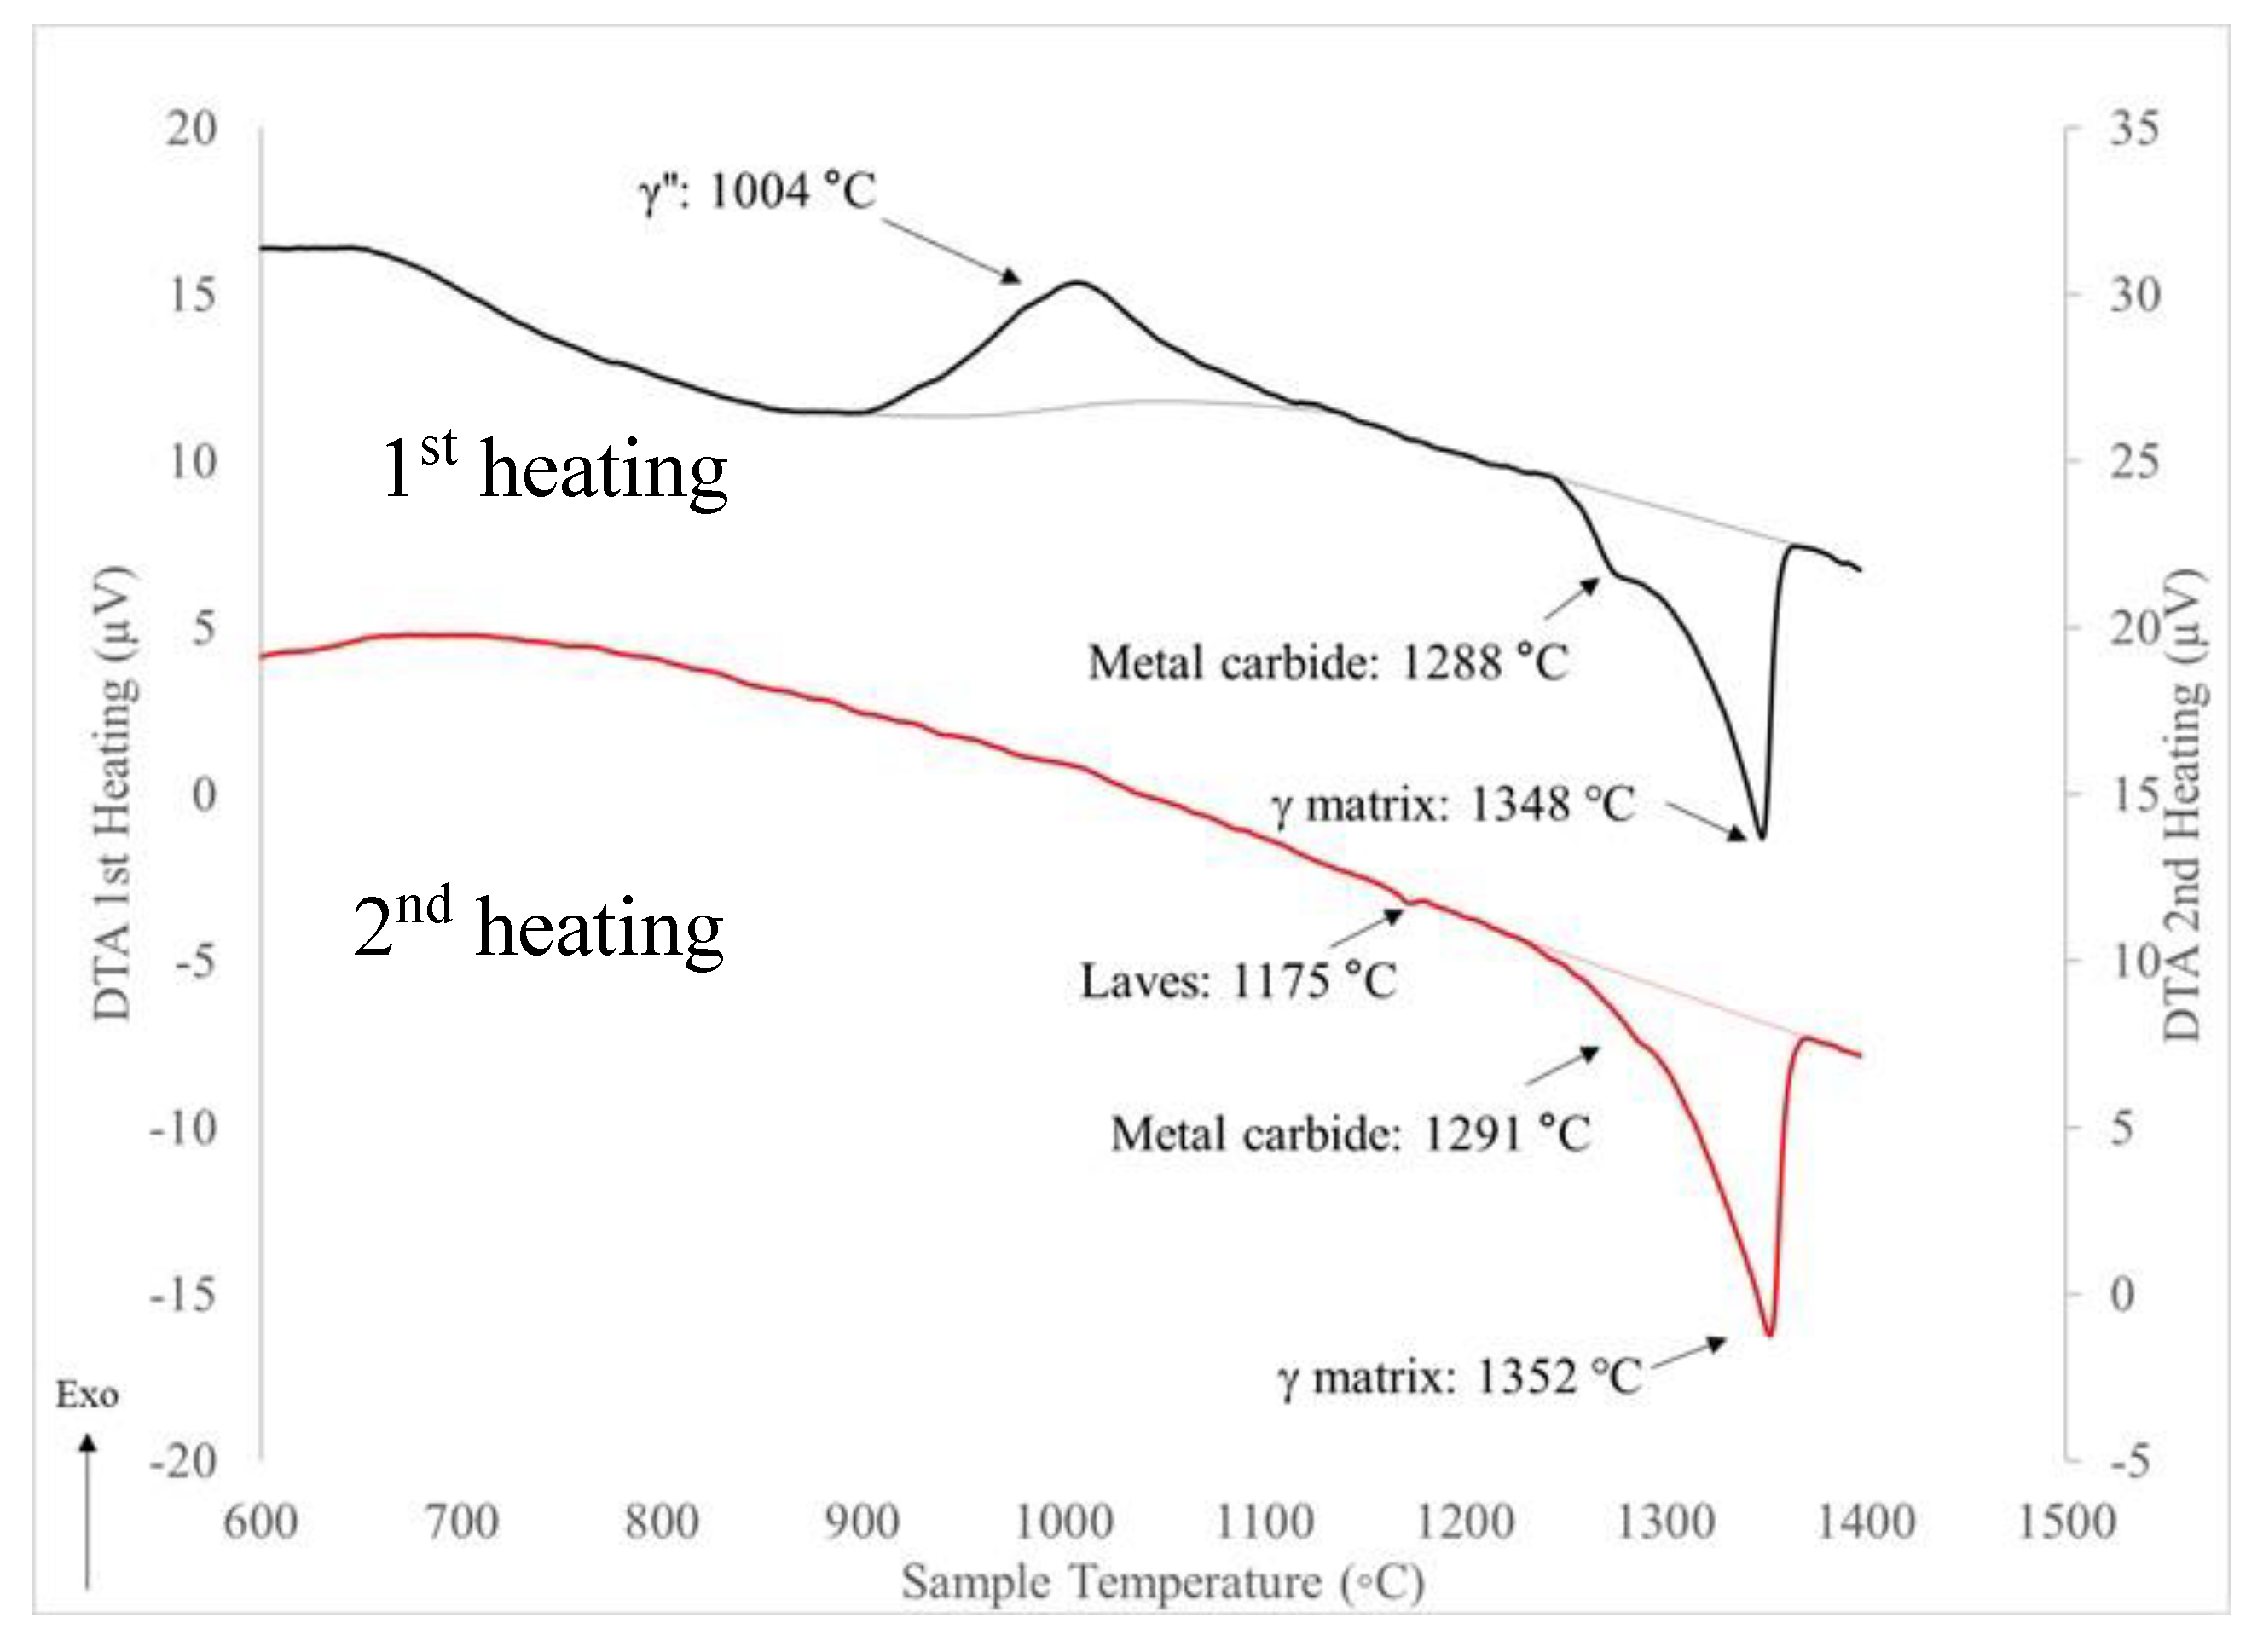
3.4. Differential Thermal Analysis

DTA results for the AB Inconel 718 are shown Figure 4a for two heating cycles to investigate peak reversibility, indicative of equilibrium solidification phases. The top curve is the first heating cycle and the bottom curve the second. In the first heating cycle, endothermic peak maximum values are observed at 1175 °C and 1298 °C, associated with the Laves and NbC phases, respectively [20,22,57,58,59,60]. The endothermic peak at 1355 °C is associated with the γ to liquid transformation of the austenitic matrix. Upon the second heating cycle, similar peaks are observed showing the reversibility of the liquation and solidification of the equilibrium solidification phases of Laves and NbC.
Results from both DTA heating scans were utilized to qualify the Laves phase content in the AB specimens. Since there was no overlap for the Laves phase, its phase fraction was obtained by integrating the area under the curve and multiplying by its density. Laves phase fraction from the DTA data was 0.6%.

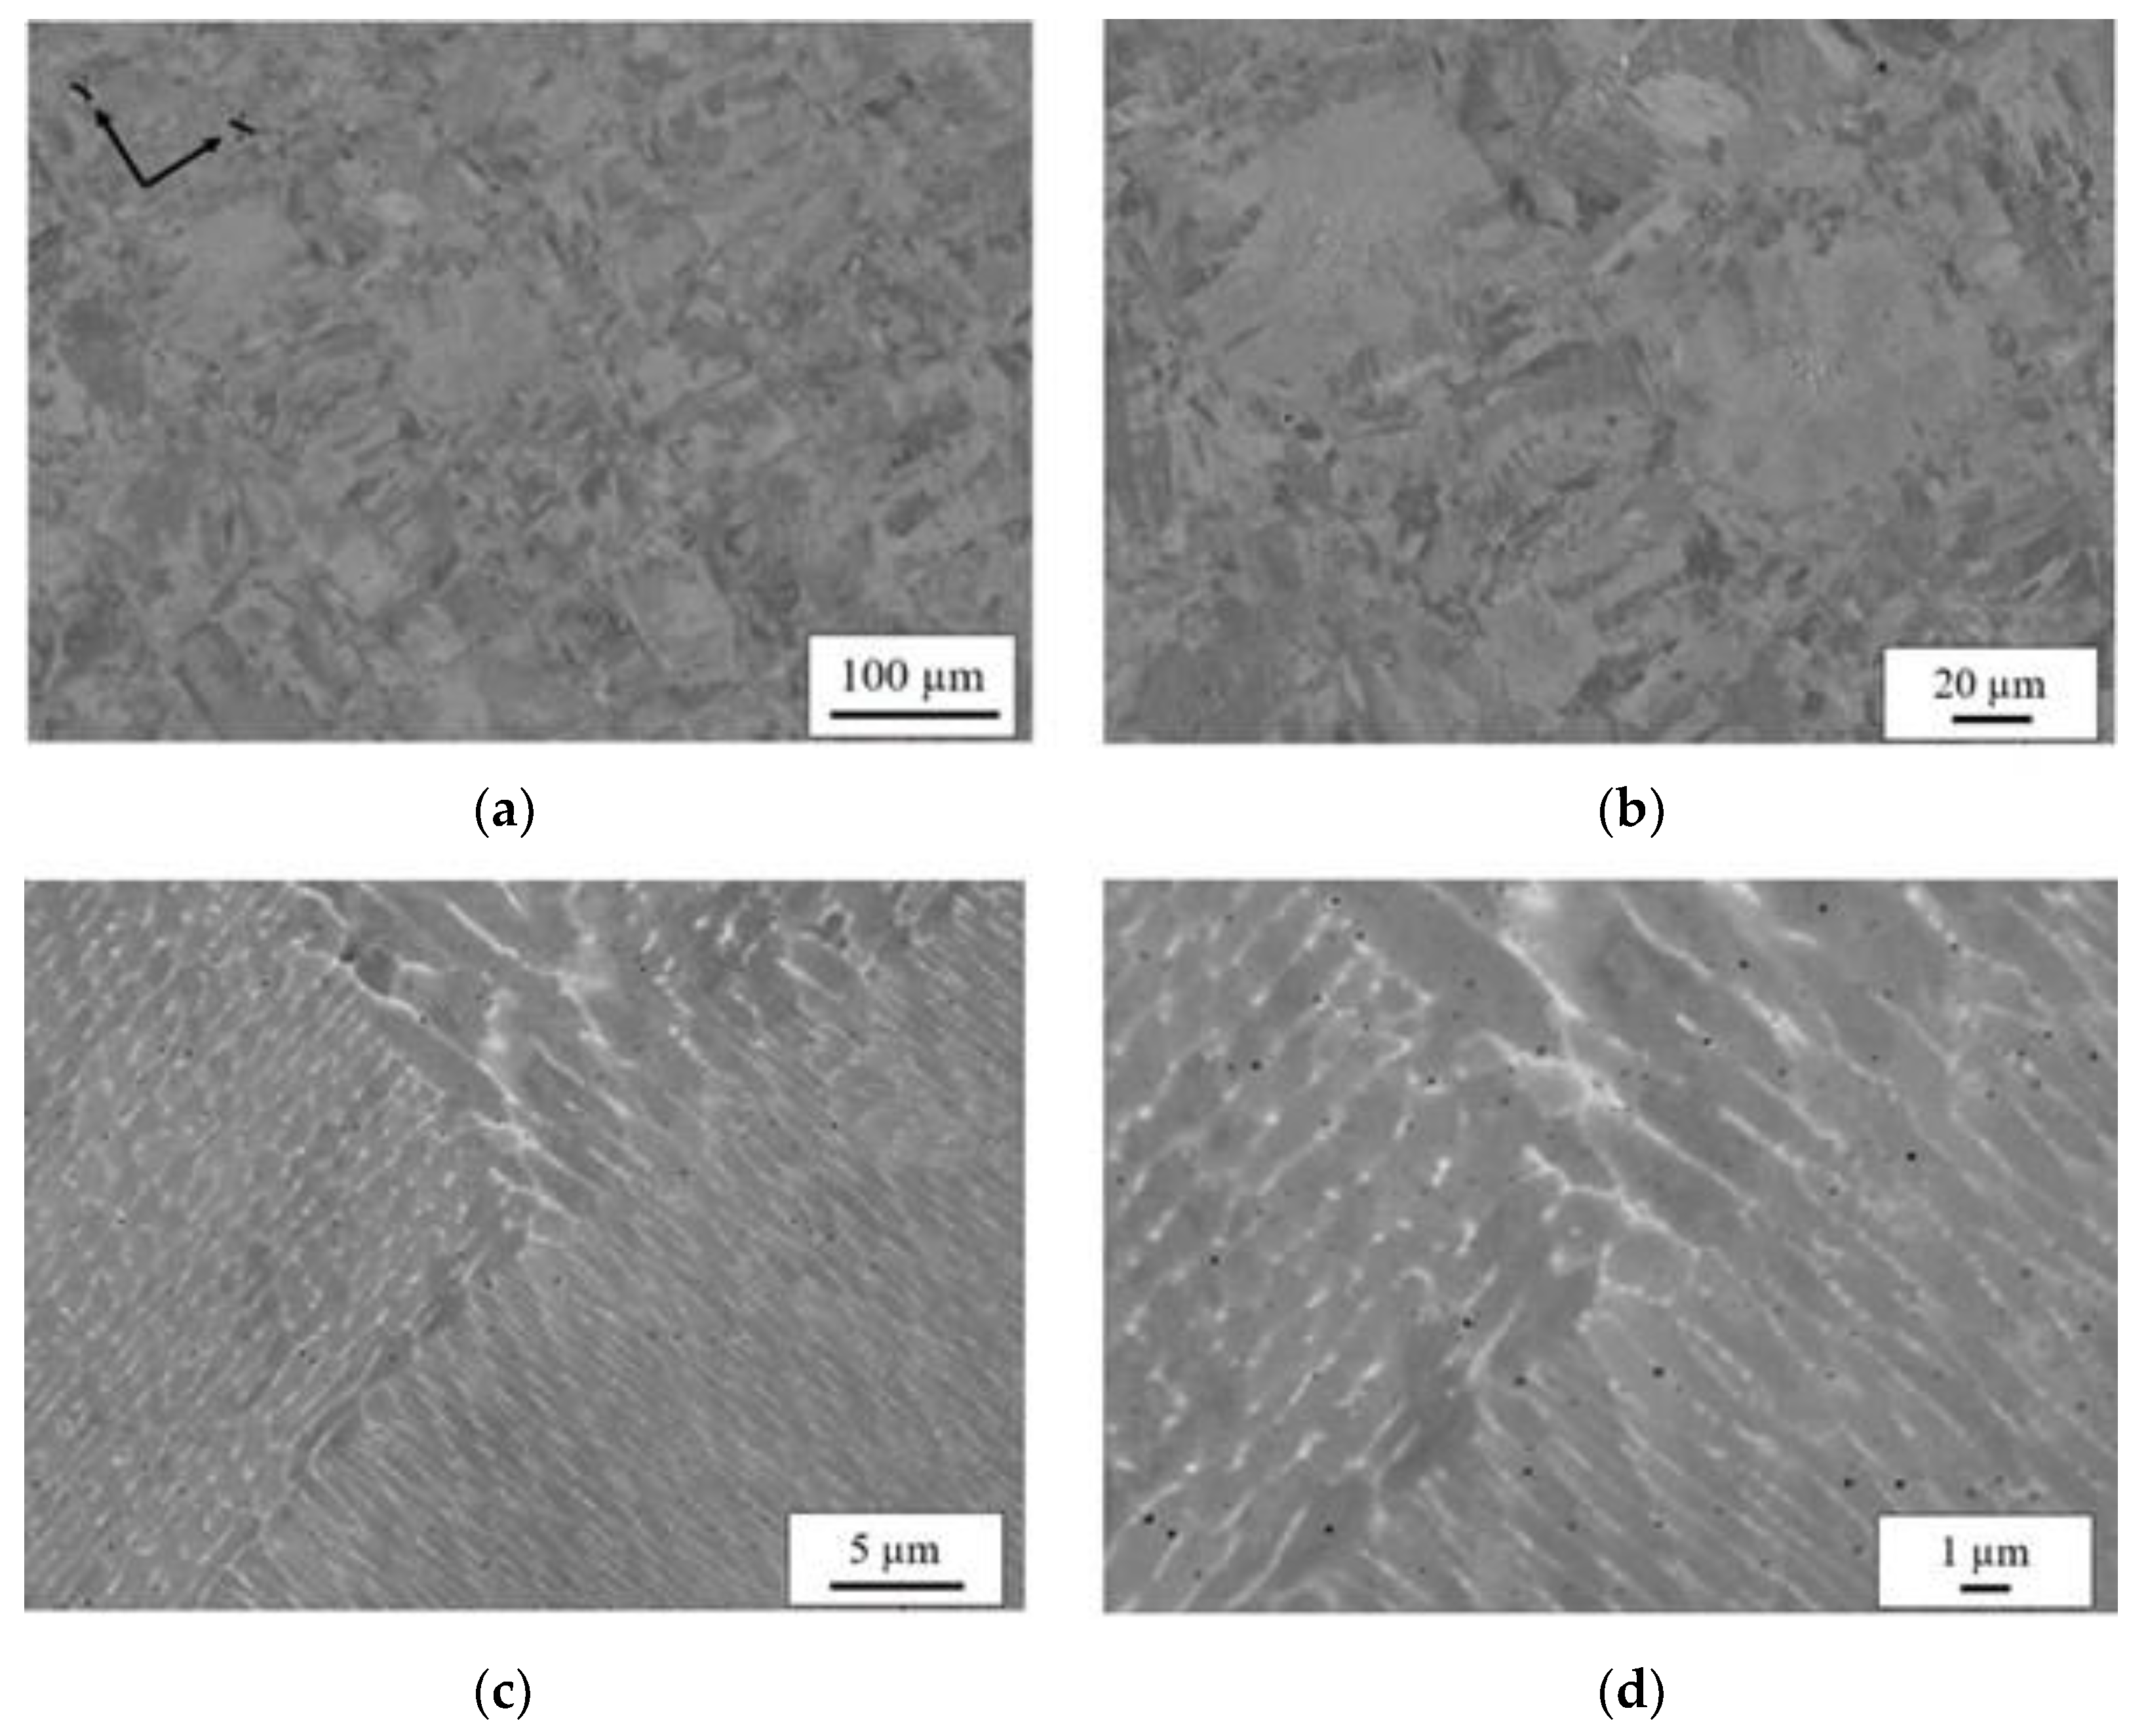
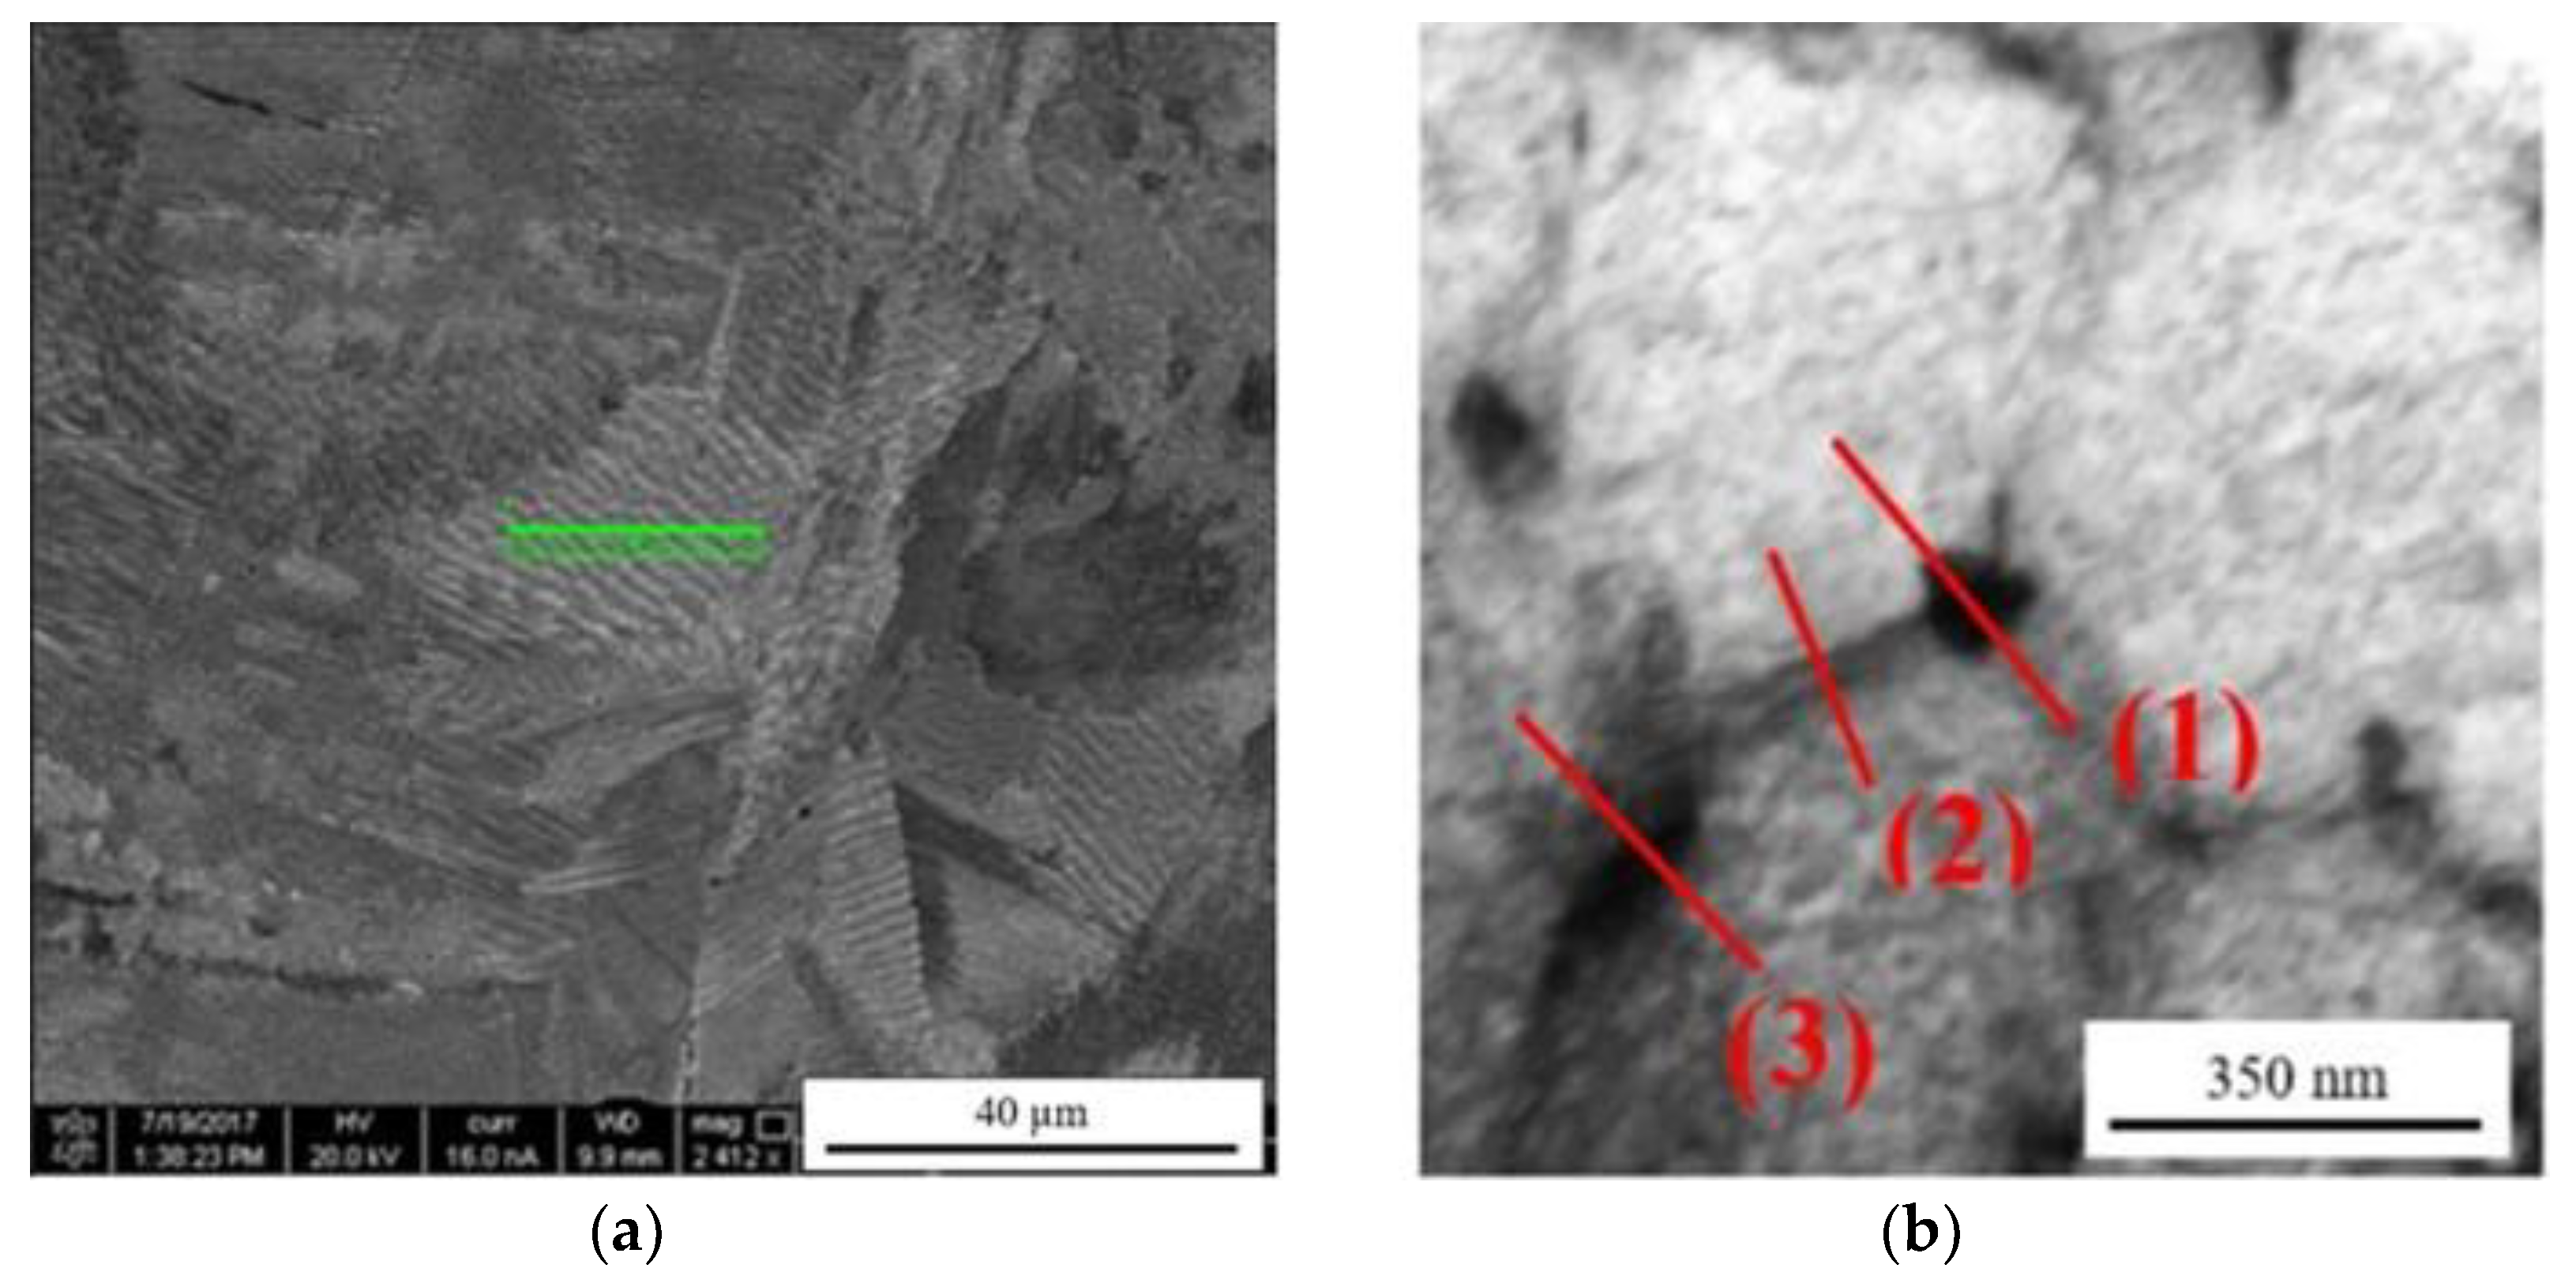
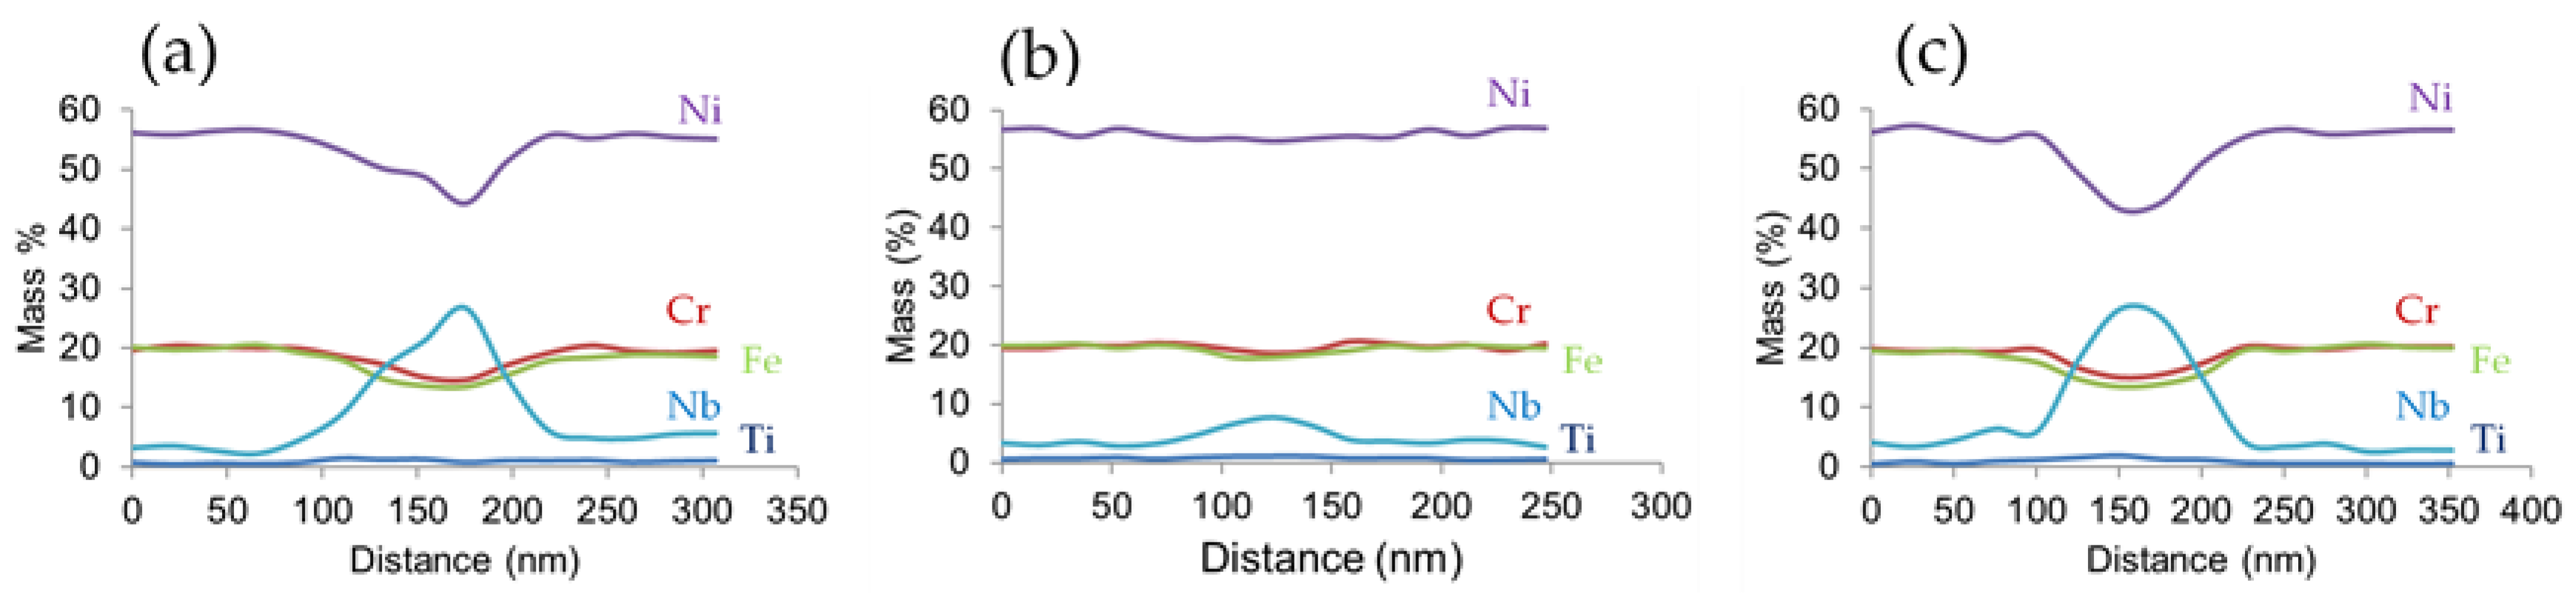
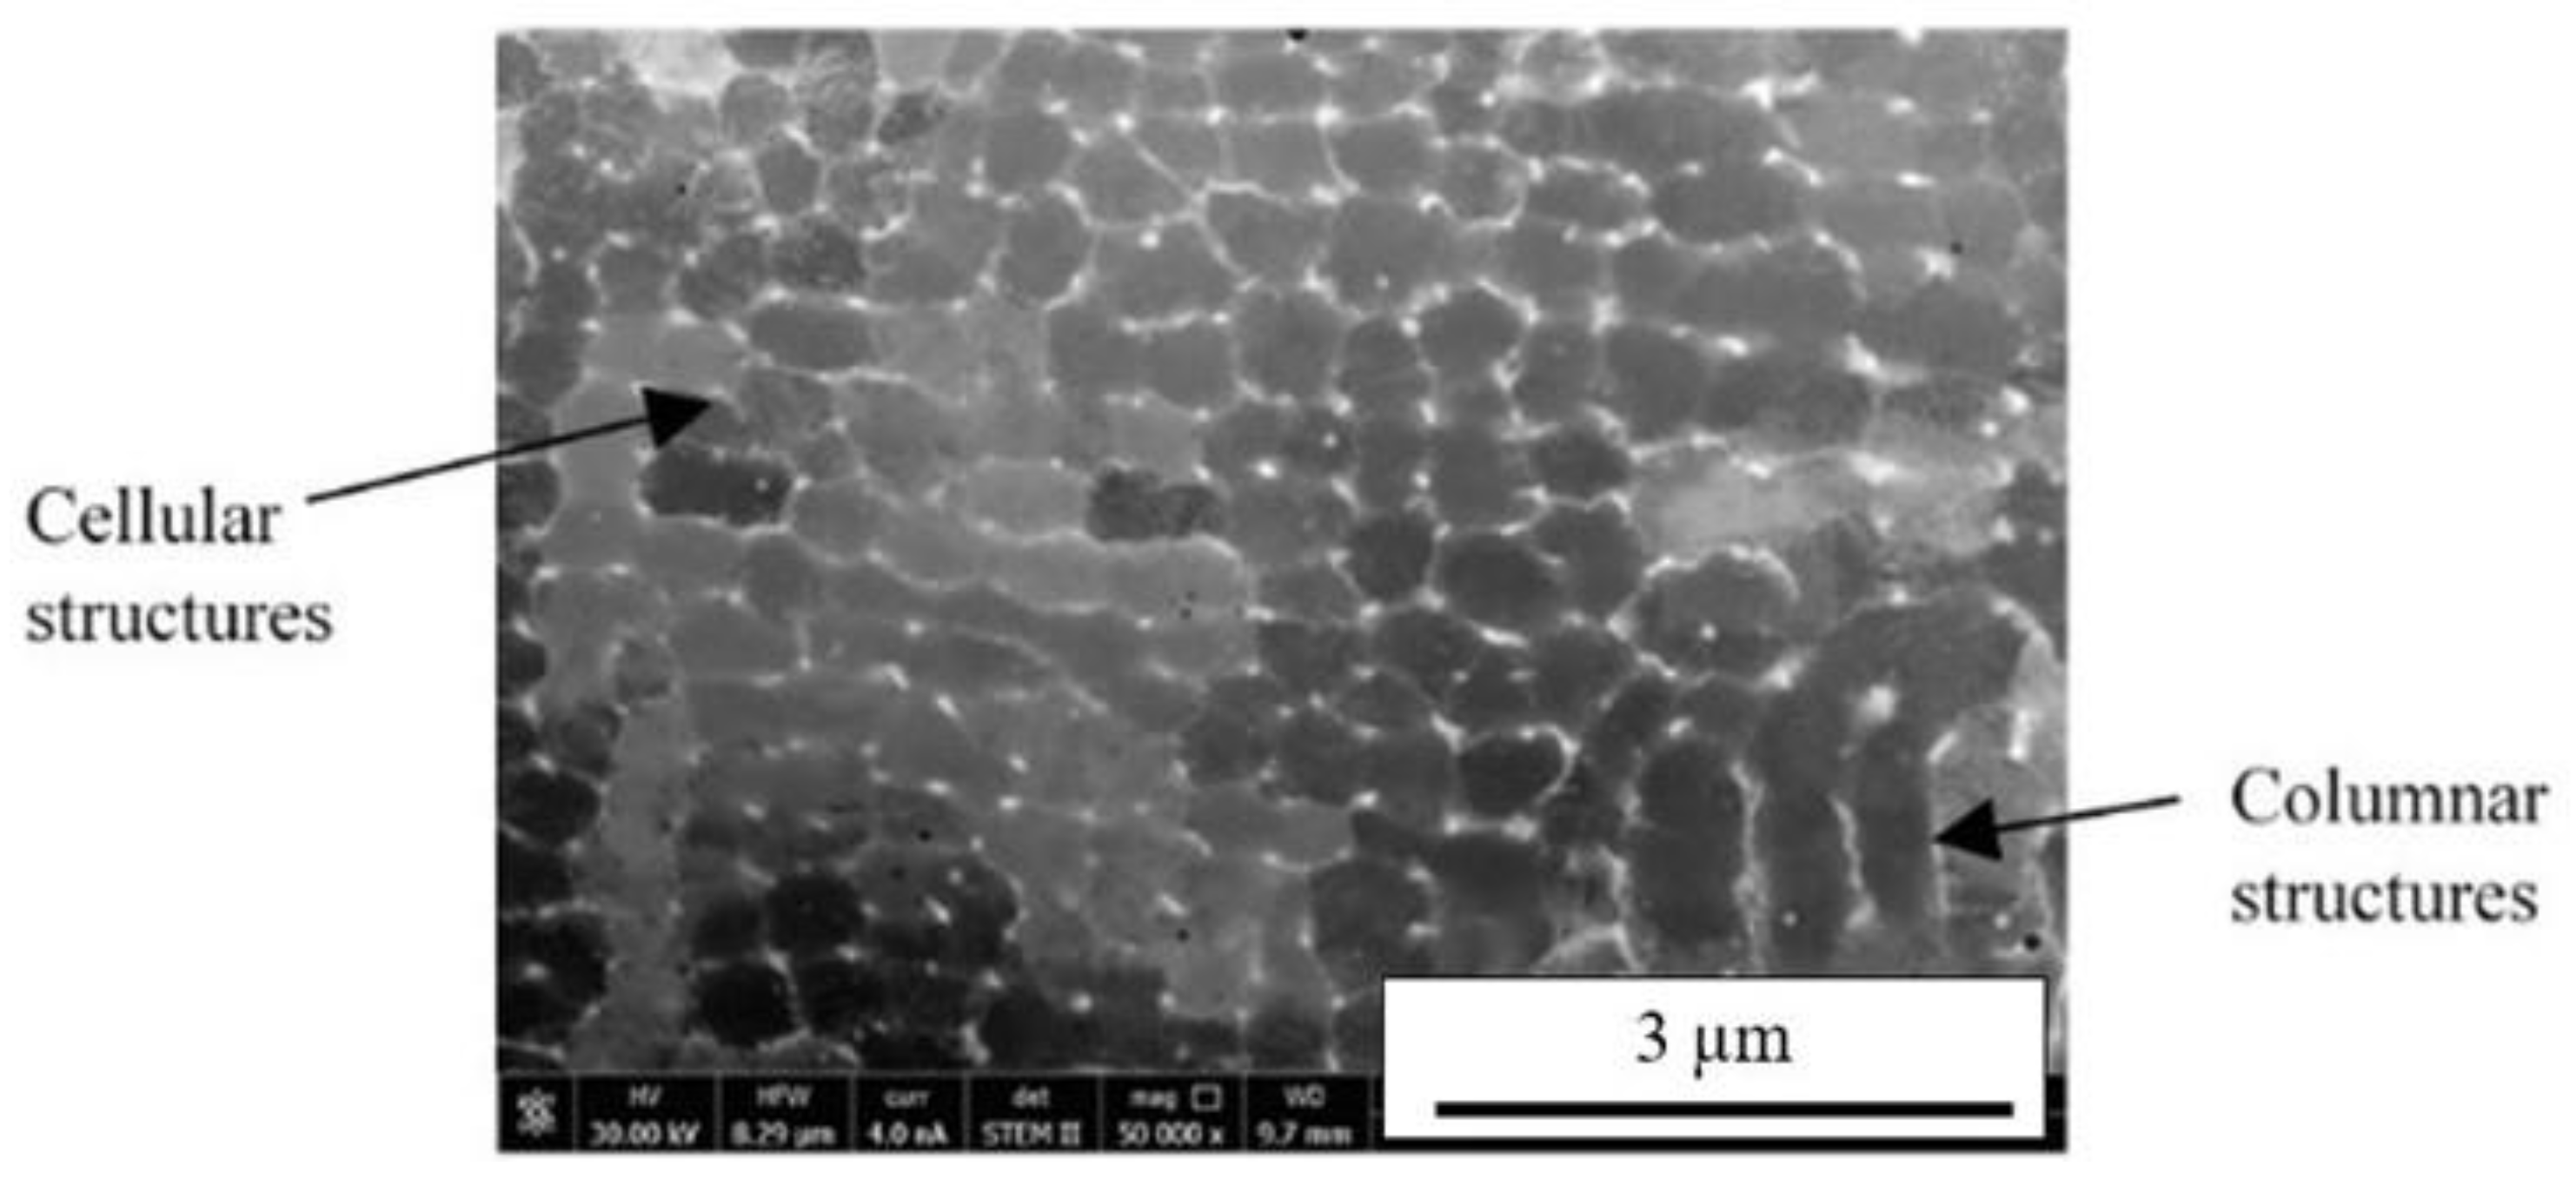
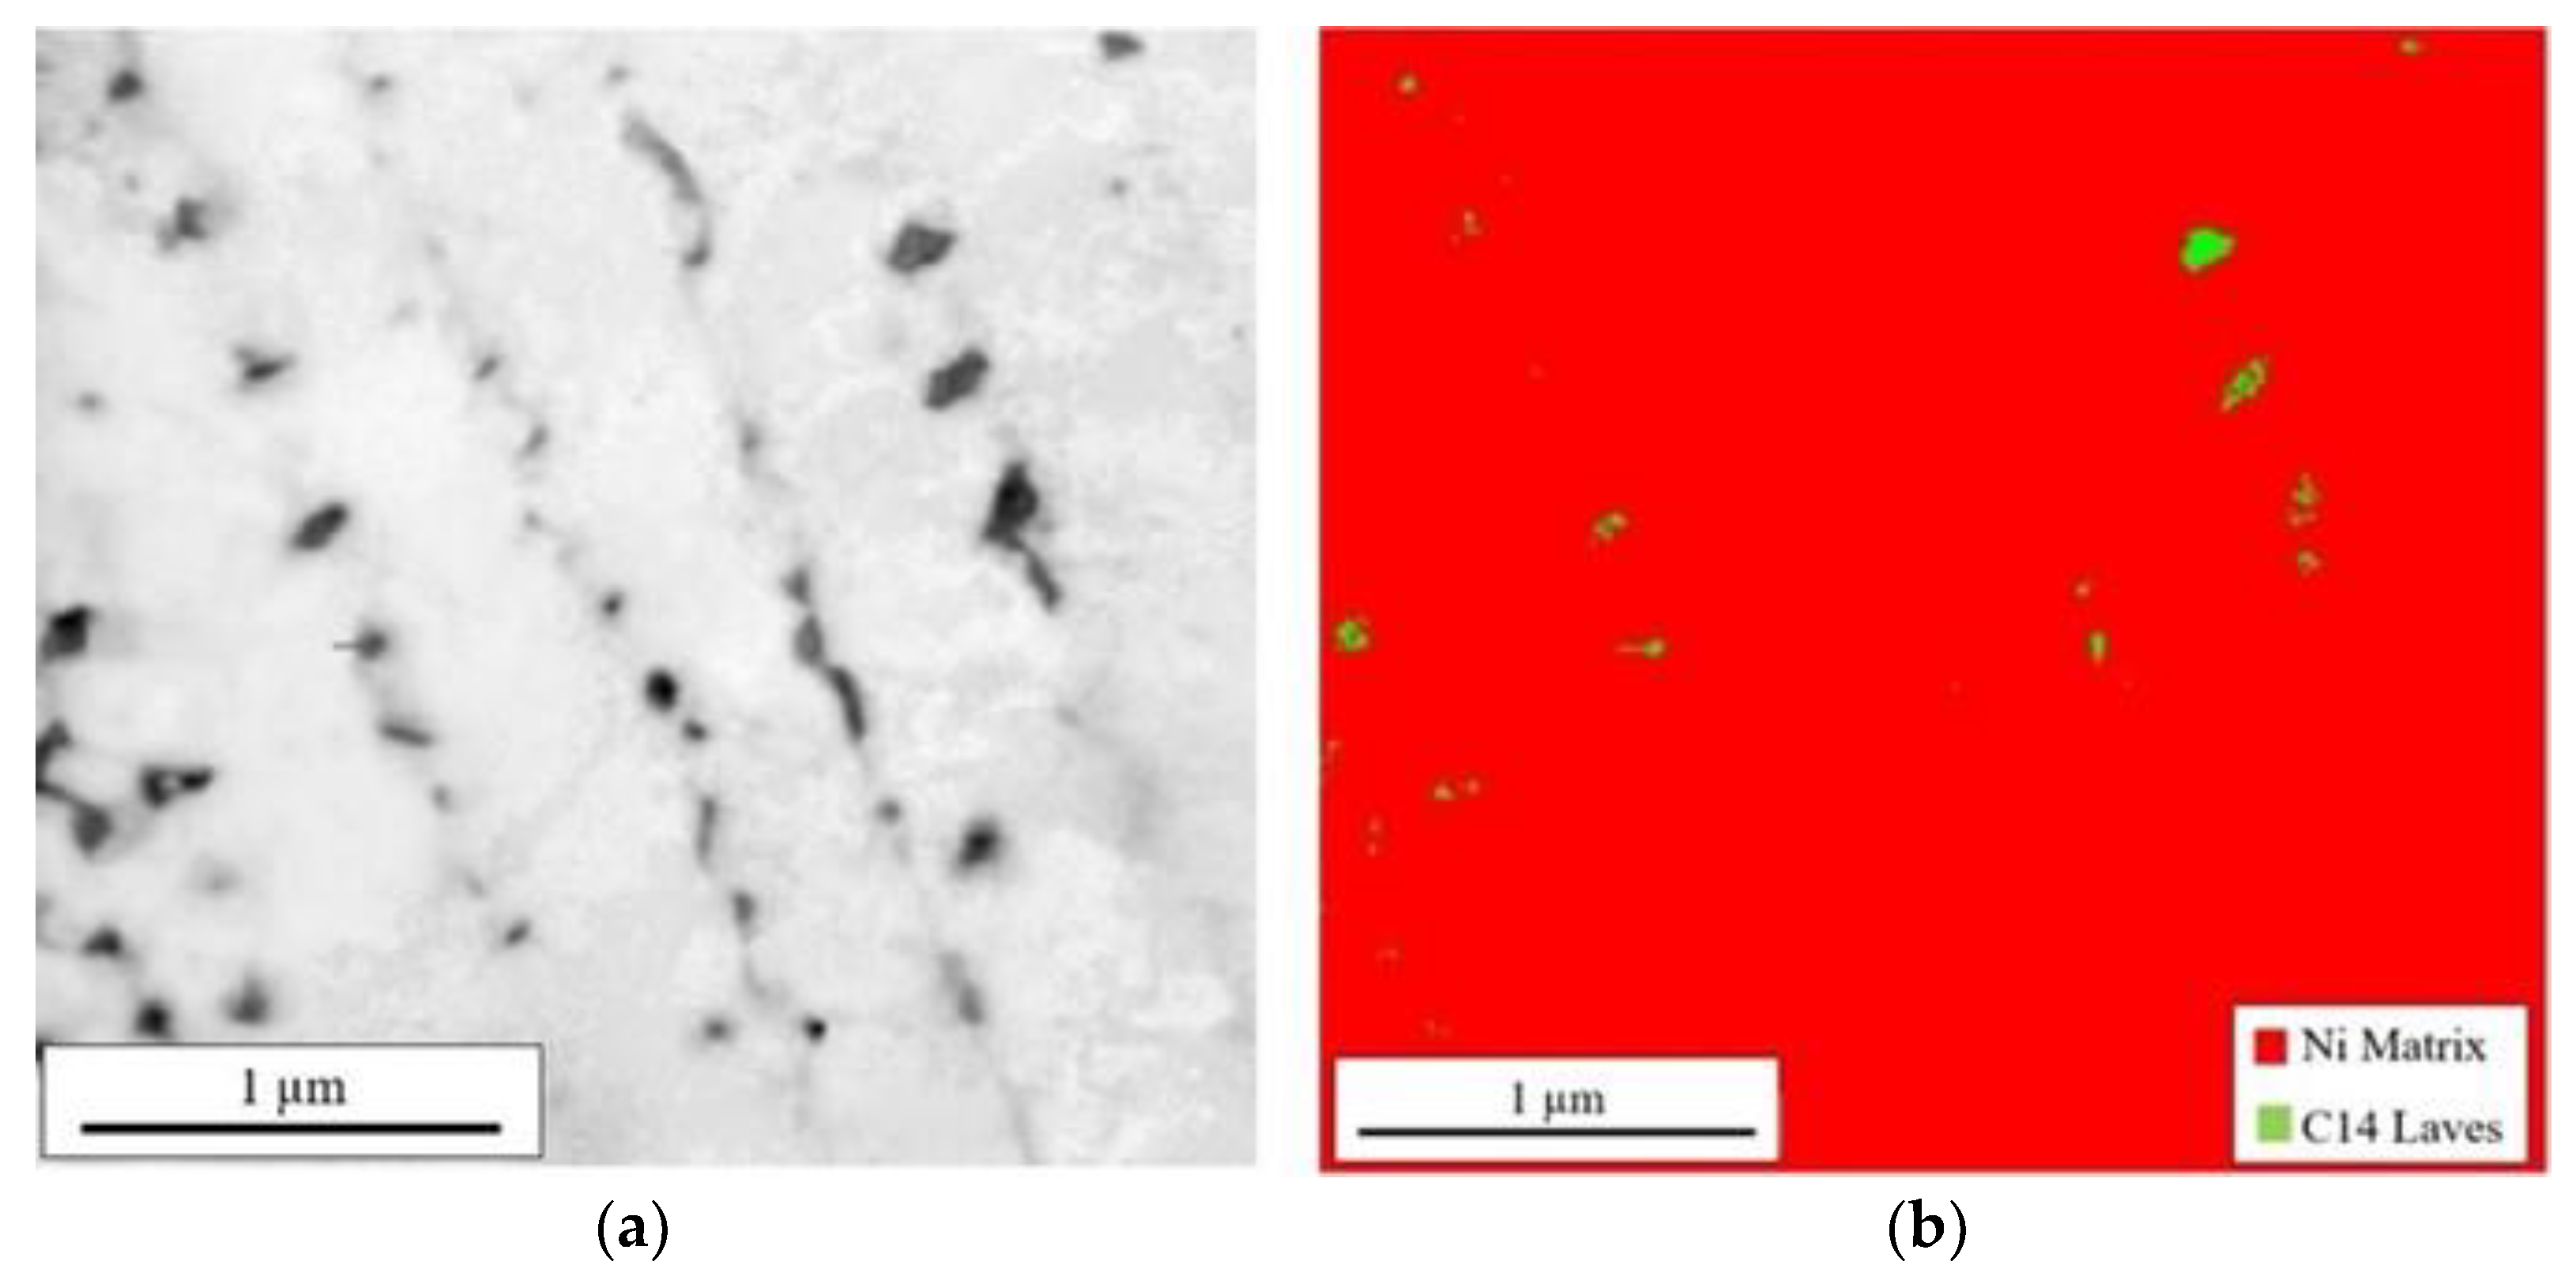
3.5. Transmission Electron Microscopy Imaging

To further explore the Nb enriched regions observed in Figure 2, a FIB sample was removed from the location shown in green in Figure 5a for TEM imaging. The TEM BFI is shown in Figure 5b where the dark regions highlight the Nb-rich regions at triple points and grain boundaries of the cellular structure. Using the STEM mode, EDS scans were made across triple points and cellular boundaries as indicated by the red lines on the TEM BFI shown in Figure 5b. The corresponding qualitative elemental data is presented in Figure 6. EDS line scans 1 and 3, taken across the triple point, showed an increased concentration of Nb in comparison to the line scan 2 taken across a cellular boundary. No diffraction data could be obtained to verify the crystal structure due to the small 40 to 60 nm size of these regions. Corresponding to the increased Nb content in the inter-dendritic regions, depletion is noted for Cr, Ni, and Fe in the corresponding dendritic core.

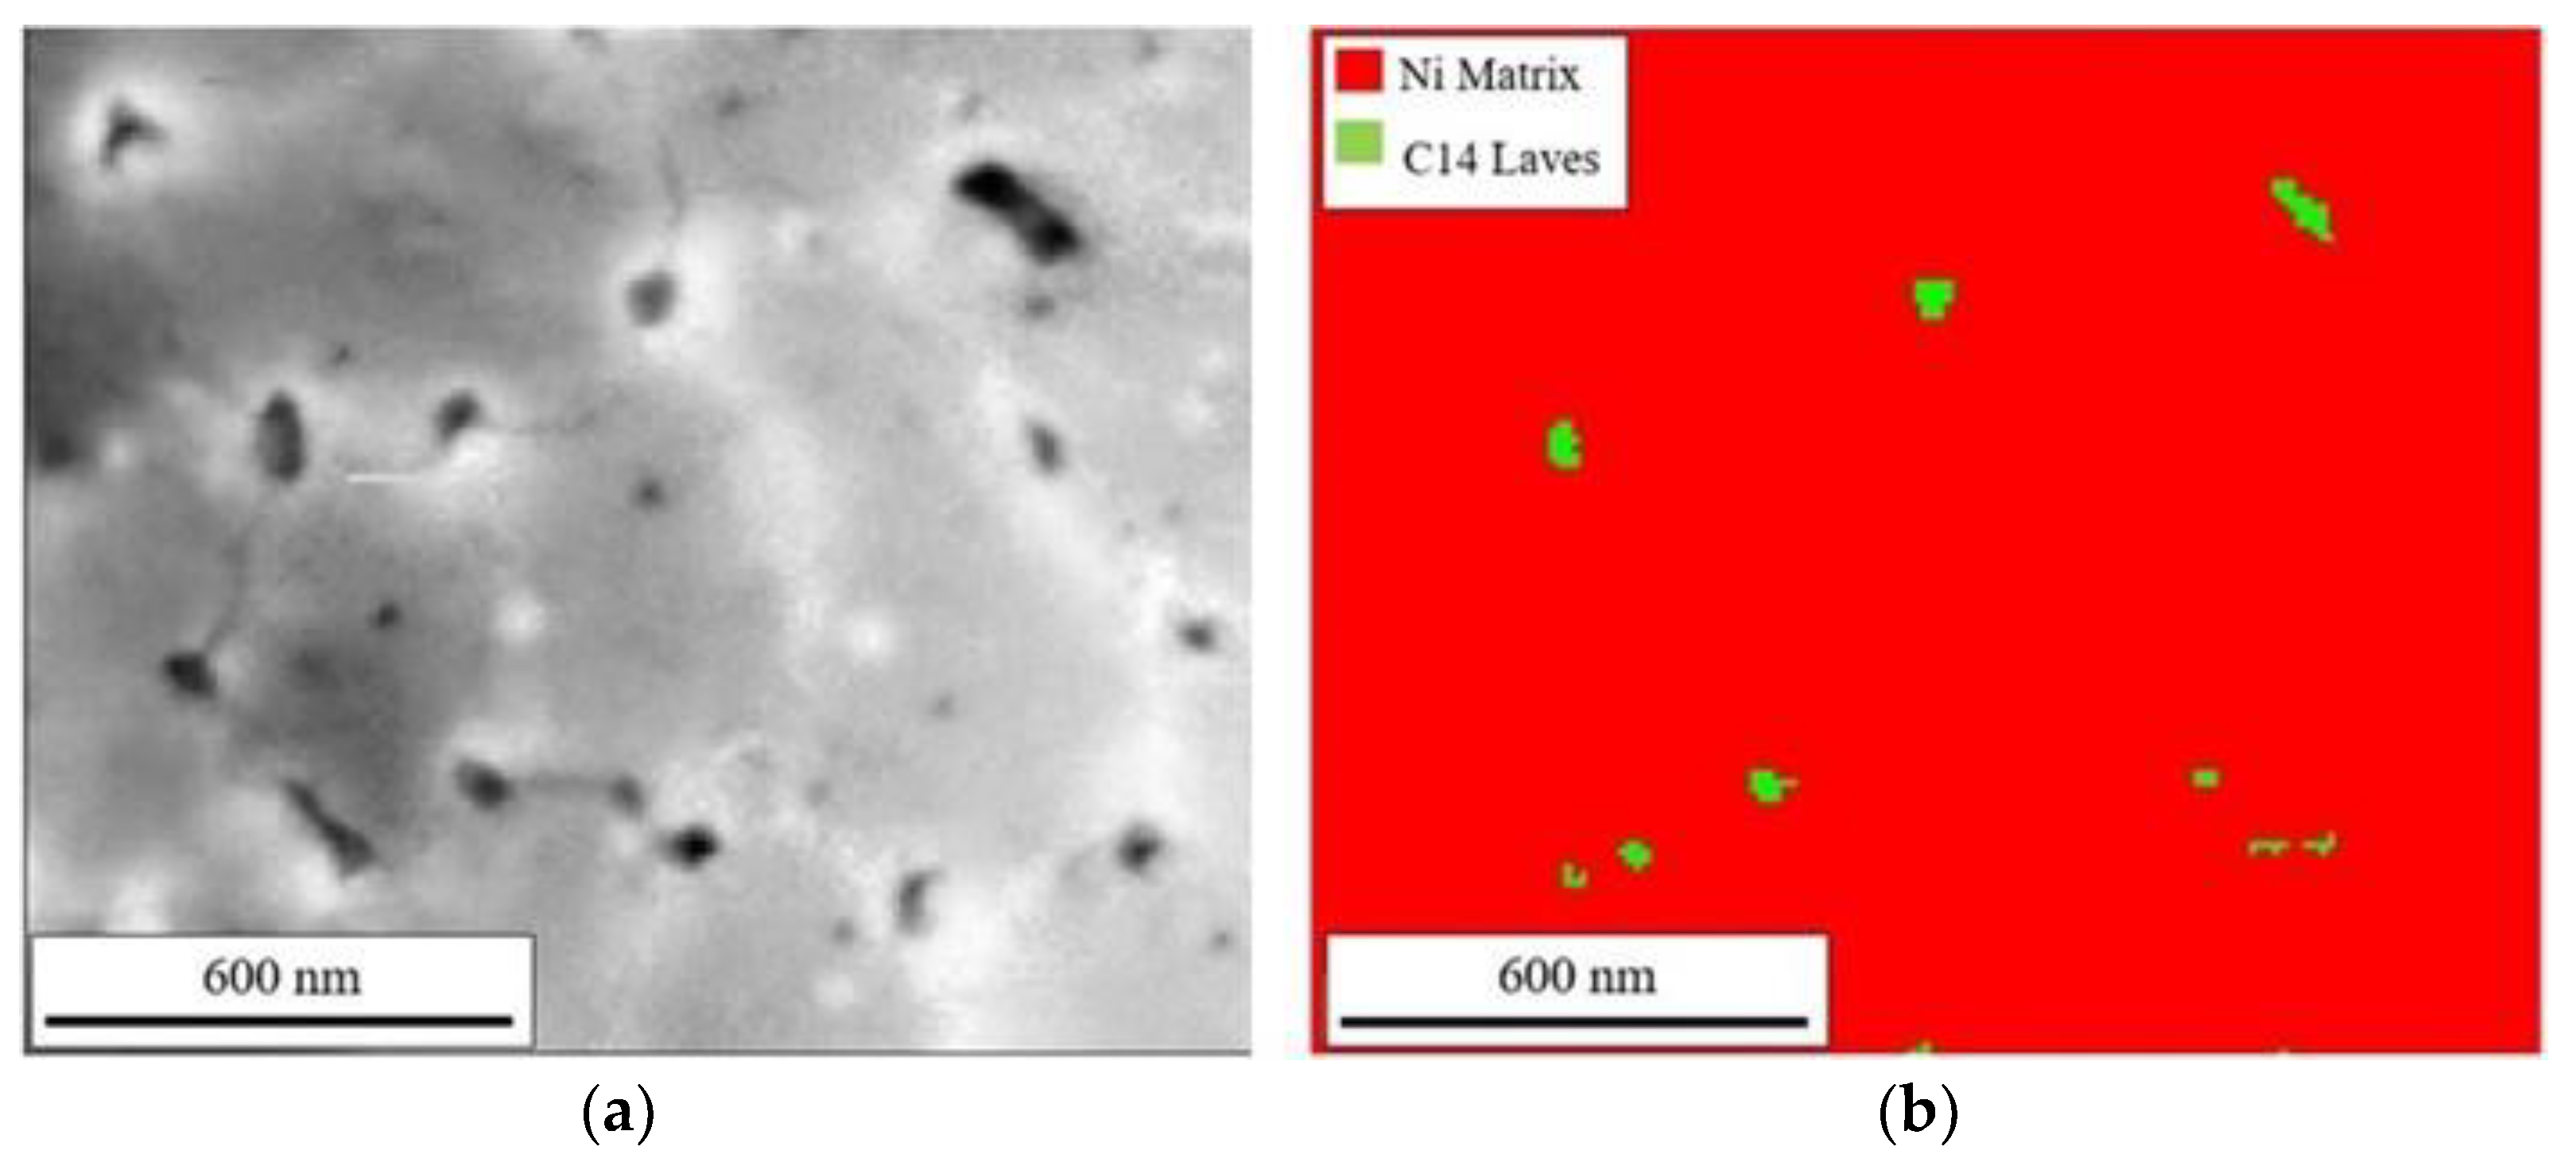
3.6. Transmission Kikuchi Diffraction Analysis

Further efforts to obtain diffraction patterns for phase identification of the Nb enriched regions utilized TKD analysis. Due to the surface sensitivity of this technique, additional TEM foils were prepared using conventional techniques to minimize surface damage. The STEM HAADF image of the conventionally prepared TEM foil shows an overview in Figure 7 with Nb-rich cellular dendritic structures observed. To visualize the reliability of the feature recognition used for indexing, image quality (IQ) maps are shown in Figure 8a and Figure 9a. Here, the contrast in the IQ maps arises from different phases shown as dark particles at triple points of the cellular structures. EDS analysis confirmed these regions to be enriched in Nb with a slight depletion of Fe and Ti in some of the larger particles, consistent with Figure 6. Only two phases were identified and indexed using simulations of the Kikuchi patterns from various crystal structure information. Figure 8a and Figure 9b display the phases present showing only the γ matrix and the C14 Laves phase. The γ, shown in red, was indexed to ICDD PDF 01-004-0850, and the Laves, shown in green, was indexed to ICDD PDF 04-004-7304. Other darker regions noted in the IQ maps were indistinguishable from the γ matrix with no orientation variations that would correspond to grain boundaries. Thus, they may be simply supersaturated regions of Nb or particles that are below the spatial resolution for TKD analysis. Using image analysis, the discontinuous distribution of the detected Laves phase comprises 0.6 to 0.8% of the total area with particle sizes ranging from 8 to 100 nm. The volume fraction determined from image analysis is similar to the fraction calculated from the bulk TGA and XRD analysis.

3.7. Analysis of Heat Treated Samples

To evaluate the response of the AB Inconel 718 to various heat treatments, the XRD and DTA analysis were repeated. XRD results for the specimens after various heat treatments are shown in Figure 10. After the FHT, the initial solidification phases of Laves and NbC are no longer resolved and are assumed to have been reduced below the limit of XRD resolution. Although very low in intensity, there is a slight indication around 53.3° that corresponds to the δ phase (ICDD PDF 00-015-0101). This becomes less pronounced in the FHT specimen, which indicates either a finer size or reduced volume fraction.
Figure 11 shows the two DSC heating cycles for the DA specimen. The temperature for the endothermic peak corresponding to the γ phase is slightly reduced to 1345 °C which indicates more solutionizing of the matrix. The NbC phase shows a similar endothermic peak of 1298 °C on first heating and 1301 °C on the second heating. The slight Laves peak earlier observed in Figure 4 is no longer detectable, indicating it has been reduced to below the limits of detection.
Figure 12 shows the DSC results for the ST + Age specimen which combined a solutionizing cycle prior to the two-step aging. Now, an exothermic peak is observed, at 1034 °C, which does not reform upon a second heating cycle. This corresponds to the upper temperature range for formation of δ phase with a globular morphology. As the ST temperature was below that of the δ solvus, it is possible that existing δ phase particles coarsen during the solutioning cycle. A slight endothermic peak is noted for the NbC phase and γ matrix, similar to the results in Figure 11. The reduced intensity of the NbC phase, which is not observed during the second heating, suggests the amount present is close to the limit detectable by DSC.
Figure 13 shows the results after a FHT which combined the 1163 °C temperature HIP/Homo cycles in addition to the solutionizing prior to the two-step age. Similar endothermic peaks are observed corresponding to the critical temperatures for liquation of the γ matrix, Laves and NbC phases. After the FHT at the higher temperatures, a broader exothermic peak with a maximum at 1004 °C is observed. This is at the lower end of the reported range for precipitation of the δ phase that favors formation of a finer, acicular morphology.
Table 5 summarizes the mechanical properties of the AB specimen compared to the heat treated specimens. The lowest strength and highest elongation to fracture corresponds to the AB sample. After DA, the strength is noted to dramatically increase due to the expected precipitation strengthening from the γ’/γ″ phases. Although the strengths are similar following aging heat treatments, the largest variation is in the increasing elongation to fracture as the number of heat treatment steps increases from DA to the FHT.
SEM SEI of the AB microstructure is shown in Figure 14a and compared with the heat treated samples in Figure 14b–d. The DA specimen in Figure 14b retains the cellular dendritic structure without clear definition of grain boundaries. After including a solutionizing treatment for ST + Age specimen, grain boundaries can be observed in Figure 14c which are decorated with coarse acicular and globular Nb-rich phases. The morphology of the acicular phase is in agreement with the δ phase, and the globular phase is in agreement with the NbC phase. The microstructure after the FHT in Figure 14d for the FHT specimen, which included the 1163 °C HIP/homo treatment prior to the solutionizing and two-step aging, shows a mixture of fine grains and coarser grains. At this magnification, the grain boundary phases are not resolved.
Higher magnification SEM SEI of the STA + Age and FHT specimens shown Figure 14c,d are shown in Figure 15a,b to resolve the grain boundary phases. Both heat treatments promoted the formation of acicular and globular phases. However, the acicular phases in Figure 15b appear to increase in number with a finer size.

4. Discussion

This study used a multi-length scale, multi modal approach to evaluate the initial phases in the AB L-PBF Inconel 718 AM samples and after the series of heat treatments summarized in Table 2. Although an ASTM standard has been accepted for heat treatment of L-PBF specimens [45], other published studies have suggested that reducing the heat treatment steps may further reduce costs and offer benefit to AM materials [41,61,62,63,64]. These studies mirror the development of direct aging for the wrought alloy Inconel 718 [5,43,44]. Reported mechanical properties in this study and others, show similar quasi-static strengths can be obtained with reduced heat treatment cycles in L-PBF AM. This may be due to retention of supersaturated regions resulting from the rapid solidification affecting the solidification phases and precipitation sequences. The primary difference in all reported studies is the resulting grain morphology and its correlation with the elongation to fracture.
The lowest strength and highest elongation in this study was observed in the AB specimen. This is attributed to the lack of strengthening mechanisms, allowing unimpeded dislocation motion. Figure 14a and b showed electron microscopy images of the AB and DA specimens that displayed a cellular dendritic structure. After incorporation of a solutionizing heat treatment, the grain structure becomes apparent in the ST + Age and FHT specimens in Figure 14c and d. Table 5 shows that even without defined grain boundaries, all specimens subjected to the aging treatment increased in strength with minor changes in elongation. This was independent of the solutionizing heat treatment, which suggests the strengthening precipitates were able to form in the as deposited, supersaturated regions.
Baseline XRD bulk analysis was able to identify the minor amounts of the solidification phases of Laves and NbC in the AB specimens. Although very slow XRD scans were conducted, the minor amounts of these phases determined were close to the detection level, which is also affected by the size of the particle. Conventional XRD detection limit of nanoparticles is reported to be in the range of 2–2.5 nm [65,66,67]. In terms of volume fractions, particles that have a concentration less than 1–4 wt% have also been reported to be difficult to detect during scans [68,69]. After the heat treatments, the initial solidification phases were no longer detectable in the bulk scans possibly due to some dissolution which would have reduced their size below the limit of detection.
DTA analysis of the AB specimen detected reversible endothermic reactions that correlated with the reported liquation temperature for the solidification phases of Laves, NbC and the γ matrix [20,22,57,58,59,60]. The low intensity of the peaks in the XRD and DTA are consistent with small amounts (<1%) of the solidification phases. The NbC phase is beneficial as it is reported to control grain size and morphology [5,6,7,8,9,10,11]. Although the presence of Laves phase is considered detrimental, most studies conclude that mechanical properties are only affected by either coarsened Laves particles or if the amount exceeds 1–2% [16,26,27,28,42]. There is some evidence that the presence of small amounts of the Laves phase is actually beneficial to the mechanical properties [16,36].
Electron microscopy imaging in Figure 14 and Figure 15 were used to obtain spatial data on the size and distribution of the Nb-rich regions. In lower magnification imaging, boundaries can be observed in the AB and DA between neighboring regions of the cellular dendritic structure. This orientation variation is assumed to correlate with individual grain orientation as influenced by the heat flow during metal solidification. If these misorientations are assumed to be grain boundaries, the Nb enriched regions are only within the intragranular cellular dendritic structure.
Since it is possible that the δ phase could also form within the Nb-rich regions [14], further investigation of the Nb-rich regions observed in the AB specimen utilized TEM imaging. A TEM foil was prepared using FIB from the intragranular cellular structure as shown in the STEM HAADF image in Figure 5b. Due to the small size of the Nb-rich particles, it was not possible to obtain diffraction data for identification. Thus, the use of TDK to index these regions was evaluated. Due to the surface sensitivity of the TKD technique, conventional TEM foils were prepared to minimize damage. The structures observed in Figure 7 are orientation dependent and consistent with Figure 2d and Figure 5. Indexing of various regions highlighted in the IQ maps in Figure 8, showed no orientation variations that would correspond to grain boundaries. This is in agreement with Figure 2 in which the Nb-rich regions were intragranular.
Within the intragranular region of the TEM foil of the AB specimen, only two phases were indexed using TDK, corresponding to the γ matrix and the Laves phase as shown in Figure 8b and Figure 9b. Although the TKD sample was thinned to within a range of approximately 100 to 80 nm, the visible TKD signal comes from a thinner layer approximated to be 10–20 nm. Laves particles indexed were approximately 7 nm in diameter. No other phases could be indexed in other Nb-rich regions suggesting either supersaturated regions or phases below the limits of detection. Using image analysis, the area fraction of the Laves phase in the AB specimen was 1–2%. Neither the δ nor the NbC phases were observed to form within these Nb-rich regions.
Within the literature, there are mixed reports of the presence of Laves in studies on L-PBF of Inconel 718, including some where Laves is not detected [70]. As noted, many of these studies identify the Laves phase on the basis of EDS analysis only and do not confirm the crystallographic structure [23,26,37,38,39,40,41,42]. Of the studies that include crystallographic characterization in TEM diffraction studies, the Laves phase is indexed as C14, similar to this study [71,72]. Laves is reported to form in inter-dendritic regions where the Nb concentration exceeds 20% and is enhanced by the presence of Mo and Si [6,18,22]. In [18], DTA was used in addition to microprobe analysis and noted that the critical Nb concentration for formation of Laves was not always obtained depending on the cooling rate. Since the Nb concentration varies as a function of the cooling rate, it is not surprising that there are variations in report of Laves phase present in L-PBF components as build parameters and geometry affect the localized cooling rate.
Using the XRD and DTA bulk detection methods from the AB specimen, the heat treated specimens were analyzed. In wrought materials, effective strengthening from the γ’/γ″ phases results from a solutionizing heat treatment followed by a rapid quench. Since the rapid, non-equilibrium L-PBF process results in regions of super-saturated Nb, directly subjecting the AB samples to a DA was evaluated. This improved the strength but with reduced elongation as noted in Table 5. The SEM SEI in Figure 14b shows the Nb segregation was still apparent in the DA sample with little recrystallization observed. Thus, the lower ductility after DA is attributed to lack of a recrystallized microstructure. The increase in strength after the aging heat treatment was attributed to the formation of γ’/γ″ phases. DTA results in Figure 11 showed little change in the critical temperatures of the NbC and γ matrix from the AB, although the Laves phase was no longer detected, assumed due to its low concentration.
After incorporating a solutionizing heat treatment in the ST-Age specimen, the strength in Table 5 is noted to be slightly reduced with a corresponding increase in ductility from the DA specimen. The SEM image in Figure 14c shows well defined grains with Figure 15a showing lath and globular Nb-rich phases along the grain boundaries. The lath morphology corresponds to the δ phase and the globular particles to the NbC phase [10,11,39,70,71,73]. Evidence of the solidification dendritic structures are no longer visible in the SEM images. During the first DTA heat cycle in Figure 12 for the ST-Age sample, an exothermic peak is observed that correlates with the upper range of the crystallization temperature for the δ phase [5,6,7,8,9,10,11]. As the δ phase formation is only observed during the first DTA heating and is not reversible on the second heating, this suggests dissolution of the δ phase. The observed exothermic peak could indicate further coarsening of the existing δ precipitates due to overaging of the γ’/γ″ strengthening precipitates during the DTA analysis. Although no segregation was detected in the SEM images, it is possible that some inhomogeneity remained within the microstructure that may have affected the δ co-formation with the γ’/γ″ phases [14] resulting in the coarser δ precipitates.
Heat treatment of the FHT specimen followed ASTM Standard F3055 and included a stress relief, higher temperature HIP/Homo cycles prior to the solutionizing and two-step aging. Figure 14d shows a mixed grain morphology. The higher magnification image in Figure 15b shows an increased distribution of finer lath particles along with smaller globular particles. The finer grain structure is attributed to the distribution of finer lath δ phase along the grain boundaries. Table 5 shows the yield strength decreases slightly as the elongation to fracture increases. Endothermic peaks in Figure 13 are still present for the NbC and γ matrix, with a slight indication of the Laves in the second heating. Its absence during the first heating is attributed to minor concentration close to the detection limit. The primary difference in the response of the DTA analysis of the FHT specimen is a non-reversible, wide exothermic peak observed at 1004 °C during the first heating cycle. This temperature corresponds to the lower range of crystallization of the δ phase where acicular morphology is favored. During the FHT, times at the higher temperature of 1163 °C are expected to have completely homogenized the γ matrix. Increased homogenization would be expected to alter the co-precipitation of the δ and γ’/γ″ phases, resulting in a finer formation and distribution of the δ phase. The lower aging temperature and reduced time used in this study, per AMS 5663 [30], is reported to favor lower strength as compared to AMS 5664 [31].
Many of the studies in the literature for wrought Inconel 718 have focused on the solutionizing and aging temperatures for the δ phase precipitation and distribution and its correlation with grain size and mechanical properties [10,11,15,16,33,40,63,64,74,75,76,77,78,79,80]. Complete homogenization of wrought material has historically been less of a concern due to the thermomechanical working prior to heat treatments to develop strength and microstructure. L-PBF processing lacks the thermomechanical working to assist in the microstructure development, thus it must rely on alternative mechanisms. Studies addressing the recrystallization of L-PBF Inconel 718, have concluded that exceeding a critical temperature, in excess of 1030 °C, correlates with the degree of recrystallization [64,77,78,79,80,81]. Although [81] attributed the recrystallization to residual stresses in the build, [77] has questioned that mechanism. In other studies (e.g., [76]), complete homogenization of L-PBF samples was found to require temperatures in excess of 1100 °C. Our findings correlate recrystallization with the resulting δ phase morphology, resulting in larger grains in the ST + Age specimen and finer grains in the FHT specimen. Thus, similarly to the development of wrought Inconel 718, the size, morphology and distribution of the δ phase is critical to recrystallization and subsequent grain size [5,7,8,9,10,11]. As higher temperatures correlated to formation of a finer grain structure, it is theorized that the degree of homogenization obtained in L-PBF specimens greatly affected the co-precipitation of the δ, γ’ and γ″ phases and their resulting morphology. This finding agrees with previous studies on the influence of the δ phase size and morphology on the resulting grain structure in Inconel 718.

5. Conclusions

Understanding the make-up of any starting material is necessary to optimize post-build treatments to obtain the desired mechanical properties. As studies in wrought Inconel 718 have linked mechanical properties with grain morphology, changes to heat treatments have been pursued to tailor the resulting microstructure. This study identified minor amounts of Laves and NbC phases present in the AB microstructure. Spatially resolved images showed the Laves formed in some Nb-rich inter-dendritic regions, dependent on a critical concentration of Nb. Grain boundaries were not apparent until after incorporation of heat treatments > 1010 °C consistent with the precipitation of the δ phase.
Incorporating a 1163 °C heat treatment in FHT sample had an effect on the degree of homogenization obtained and thus the competition between the co-precipitation of the δ, γ’ and γ″ phases. Differences were noted in the critical temperature of the crystallization of the δ phase in the DTA analysis. Thus, while the δ phase is thermodynamically stable, its resulting morphology is dependent on the degree of homogenization obtained related to the temperatures selected during heat treatment. The recrystallized microstructures in L-PBF specimens are dependent on a distribution of refined, acicular precipitated δ phase along grain boundaries. This is achieved with complete homogenization in accordance with the HIP/Homo process outlined in the standard for Inconel 718 produced by L-PBF [45].

Author Contributions

Conceptualization, J.S. and L.F.; methodology, J.S., G.N., S.R., G.C., T.T. and S.T.; formal analysis, J.S., L.F., G.N., S.R., G.C., T.T. and S.T.; investigation, G.N., S.R., G.C., T.T. and S.T.; resources, G.N., S.R., G.C., T.T. and S.T.; data curation, J.S. and L.F.; writing—original draft preparation, L.F.; writing—review and editing, J.S.; visualization, supervision, project administration, and funding acquisition, J.S. All authors have read and agreed to the published version of the manuscript.

Funding

The authors acknowledge the support of the National Science Foundation (NSF) EAGER CMMI Grant #1841220 under the direction of program managers, Steve Schmid and Brigid Ann Mullany.

Conflicts of Interest

On behalf of all authors, the corresponding author states that there is no conflict of interest. The funders had no role in the design of the study, in the collection, analyses, or interpretation of data, in the writing of the manuscript, or in the decision to publish the results.

References

  1. Schafrik, R.E.; Ward, D.D.; Groh, J.R. Application of Alloy 718 in GE Aircraft Engines: Past, Present, and the Next 5 Years. In Superalloys 718, 625, 706 and Various Derivatives; The Minerals, Metals and Materials Society: Pittsburgh, PA, USA, 2001; pp. 1–11. [Google Scholar]
  2. Paulonis, D.F.; Schirra, J.J. Alloy 718 at Pratt & Whitney—Historical Perspective and Future Challenge. In Superalloys 718, 625, 716 and Various Derivatives; The Minerals, Metals and Materials Society: Pittsburgh, PA, USA, 2001; pp. 13–23. [Google Scholar]
  3. Diltemiz, S.F.; Zhang, S. Aerospace Materials Handbook, 1st ed.; CRC Press: Boca Raton, FL, USA, 2012; pp. 1–76. [Google Scholar]
  4. Thompson, R.G.; Dobbs, J.R.; Mayo, D.E. The effect of heat treatment on microfissuring in alloy 718. Am. Weld. Soc. J. 1986, 25, 299–304. [Google Scholar]
  5. Radavich, F.; Couts, W.H., Jr. Factors Affecting Delta Phase Precipitation and Growth at Hot Work Temperatures for Direct Aged INCO 718. In Superalloys; The Minerals, Metals and Materials Society: Pittsburgh, PA, USA, 1984; pp. 497–507. [Google Scholar]
  6. Radavich, J.F. The Physical Metallurgy of Cast and Wrought Alloy 718. In Superalloys 718—Metallurgy and Applications; The Minerals, Metals and Materials Society: Pittsburgh, PA, USA, 1989; pp. 229–240. [Google Scholar]
  7. Ruiz, C.; Obabueki, A.; Gillespie, K. Evaluation of the Microstructure and Mechanical Properties of Delta Processed Alloy 718. In Superalloys; The Minerals, Metals and Materials Society: Pittsburgh, PA, USA, 1992; pp. 33–42. [Google Scholar]
  8. Dix, A.W.; Hyzak, J.M.; Singh, R.P. Application of Ultra Fine Grain Alloy 718 Forging Billet. In Superalloys; The Minerals, Metals and Materials Society: Pittsburgh, PA, USA, 1992; pp. 23–32. [Google Scholar]
  9. Mahadevan, S.; Nalawade, S.; Singh, J.B.; Verma, A.; Paul, B.; Ramaswamy, K. Evolution of Phase Microstructure in Inconel 718. In Superalloy 718 and Derivatives; The Minerals, Metals and Materials Society: Pittsburgh, PA, USA, 2010; pp. 737–750. [Google Scholar]
  10. Azadian, S.; Wei, L.-Y.; Warren, R. Delta phase precipitation in Inconel 718. Mater. Charact. 2004, 53, 7–16. [Google Scholar] [CrossRef]
  11. Anderson, M.; Thielin, A.-L.; Bridier, F.; Bocher, P.; Savoie, J. δ Phase precipitation in Inconel 718 and associated mechanical properties. J. Mater. Sci. Eng. A 2017, 679, 48–55. [Google Scholar] [CrossRef]
  12. Schirra, J.J.; Caless, R.H.; Hatala, R.W. The Effect of Laves Phase on the Mechanical Properties of Wrought and Cast + HIP Inconel 718. In Superalloys 718, 625, and Various Derivatives; The Minerals, Metals and Materials Society: Pittsburgh, PA, USA, 1991; pp. 375–388. [Google Scholar]
  13. Qi, H.; Azer, M.; Ritter, A. Studies of standard heat treatment effects on microstructure and mechanical properties of laser net shape manufactured INCONEL 718. Metall. Mater. Trans A 2009, 40, 2410–2422. [Google Scholar] [CrossRef]
  14. Lass, E.A.; Stoudt, M.R.; Katz, M.B.; Williams, M.E. Precipitation and dissolution of δ and γ″ during heat treatment of a laser powder-bed fusion produced Ni-based superalloy. Script Mater. 2018, 154, 83–86. [Google Scholar] [CrossRef]
  15. Strondl, A.; Fischer, R.; Frommeyer, G.; Schneider, A. Investigations of MX and ‘/’ precipitates in the nickel-based superalloy 718 produced by electron beam melting. Mater. Sci. Eng. A 2008, 480, 138–147. [Google Scholar] [CrossRef]
  16. Stein, F.; Leineweber, A. Laves phases: A review of their functional and structural applications and an improved fundamental understanding of stability and properties. J. Mater. Sci. Rev. 2021, 56, 5321–5427. [Google Scholar] [CrossRef]
  17. Knorovsky, G.A.; Cieslak, M.J.; Headley, T.J.; Romig, A.D., Jr.; Hammetter, W.F. Inconel 718, A solidification diagram. Metall. Mater. Trans. A 1989, 20, 1989–2149. [Google Scholar] [CrossRef]
  18. Antonsson, T.; Fredriksson, H. The effect of cooling rate on the solidification of INCONEL 718. Metall. Mater. Trans. B. 2005, 36, 85–96. [Google Scholar] [CrossRef]
  19. Carlson, R.G.; Radavich, J.F. Microstructural Characterization of Cast 718. In Superalloy 718—Metallurgy and Applications; The Minerals, Metals and Materials Society: Pittsburgh, PA, USA, 1989; pp. 79–95. [Google Scholar]
  20. Cieslak, M.J.; Knorovsky, G.A.; Headley, T.J.; Romig, A.D., Jr. The Solidification Metallurgy of Alloy 781 and Other Nb-Containing Superalloys. In Superalloy 718—Metallurgy and Applications; The Minerals, Metals and Materials Society: Pittsburgh, PA, USA, 1989; pp. 59–68. [Google Scholar]
  21. Cieslak, M.J. The Solidification Behavior of an Alloy 625/718 Variant. In Superalloys 718, 625, and Various Derivatives; Loria, E.A., Ed.; The Minerals, Metals and Materials Society: Pittsburgh, PA, USA, 1991; pp. 71–80. [Google Scholar]
  22. Sohrabi, M.J.; Mirzadeh, H.; Rafiei, M. Solidification behavior and Laves phase dissolution during homogenization heat treatment of Inconel 718 superalloy. Vacuum 2018, 154, 235–243. [Google Scholar] [CrossRef]
  23. Brenne, F.; Taube, A.; Pröbstle, M.; Neumeier, S.; Schwarze, D.; Schaper, M.; Niendorf, T. Microstructural design of Ni-base alloys for high-temperature applications: Impact of heat treatment on microstructure and mechanical properties after selective laser melting. Prog. Addit. Manuf. 2016, 1, 141–151. [Google Scholar] [CrossRef] [Green Version]
  24. Miao, Z.-J.; Shan, A.-D.; Wu, Y.-B.; Lu, J.; Xu, W.-L.; Song, H.-W. Quantitative analysis of homogenization treatment of Inconel 718 superalloy. Trans. Nonferrous Met. Soc. China 2011, 21, 1009–1017. [Google Scholar] [CrossRef]
  25. Wang, W.; Zhu, C.; Zeng, J.; Lu, C.; Qian, H.; Xu, H.; Lyu, P. Microstructures and Nb-rich precipitation behaviors of Inconel 718 superalloy under sub-rapid solidification process. Metall. Mater. Trans. A 2020, 51, 2306–2317. [Google Scholar] [CrossRef]
  26. Sui, S.; Tan, H.; Chen, J.S.; Zhong, C.; Li, Z.; Fan, W.; Gasser, A.; Huang, W. The influence of Laves phases on the room temperature tensile properties of Inconel 718 fabricated by powder feeding laser additive manufacturing. Acta Mater. 2019, 164, 413–427. [Google Scholar] [CrossRef]
  27. Guo, J.T. Materials Science and Engineering for Superalloys; Science Press: Beijing, China, 2008; pp. 353–360. [Google Scholar]
  28. Qu, F.S.; Lui, X.G.; Xing, F.; Zhang, K.F. High temperature tensile properties of laser butt welded plate of Inconel 718 superalloy with ultrafine grains. Trans. Nonferrous Met. Soc. China 2012, 22, 2379–2388. [Google Scholar] [CrossRef]
  29. Agnoli, A.; Bernacki, M.; Loge, R.; Franchet, J.-M.; Laigo, J.; Bozzolo, N. Selective Growth of Low Stored Energy Grains During Sub-solvus Annealing in the Inconel 718 Nickel-Based Superalloy. Metall. Mater. Trans. A 2015, 46, 4405–4421. [Google Scholar] [CrossRef] [Green Version]
  30. AMS 5663M; Nickel Alloy, Corrosion, and Heat Resistant, Bars, Forgings, and Rings 52.5Ni-19Cr-3.0Mo-5.1Cb(Nb)-0.9Ti-0.50Al-18Fe Consumable Electrode or Vacuum Inducted Melted 1775°F (968 °C) Solution and Precipitation Heat Treated. SAE International: Warrendale, PA, USA, 2009.
  31. AMS 5664E; Nickel Alloy, Corrosion and Heat Resistant, Bars, Forgings, and Rings 52.5Ni-19Cr-3.0Mo-5.1Cb-0.90Ti-0.50Al-18Fe Consumable Electrode or Vacuum Induction melted 1950 °F (1066 °C) Solution Heat Treated, Precipitation Hardenable. SAE International: Warrendale, PA, USA, 2006.
  32. Cozar, R.; Pineau, A. Morphology of y’ and y″ Precipitates and Thermal Stability of Inconel 718 Type Alloys. Metall. Mater. Trans. B 1973, 4, 47–59. [Google Scholar] [CrossRef]
  33. Devaux, A.; Naze, L.; Molins, R.; Pineau, A.; Organista, A.; Guedou, J.Y.; Uginet, J.F.; Heritier, P. Gamma double prime precipitation kinetic in Alloy 718. Mater. Sci. Eng. A 2008, 486, 117–122. [Google Scholar] [CrossRef]
  34. Oblak, J.M.; Paulonis, D.F.; Duvall, D.S. Coherency Strengthening in Ni Base Alloys Hardened by D022” Precipitates. Metall. Mater. Trans. 1974, 5, 143–153. [Google Scholar] [CrossRef]
  35. Chang, K.M.; Nahm, A.H. Rene 220: 100F Improvement Over Alloy 718. In Superalloy 718, Metallurgy and Applications; The Minerals, Metals and Materials Society: Pittsburgh, PA, USA, 1989; pp. 631–646. [Google Scholar]
  36. Chen, S.W.; Zhang, C.; Xia, Z.X.; Ishikawa, H.; Yang, Z.G. Precipitation behavior of Fe2Nb Laves phase on grain boundaries in austenitic heat resistance steels. Mater. Sci. Eng. A. 2014, 616, 183–188. [Google Scholar] [CrossRef]
  37. Wang, X.; Gong, X.; Chou, K. Review on powder-bed laser additive manufacturing of Inconel 718 parts. Proc. I Mech. E Part B J. Eng. Manuf. 2017, 231, 1890–1903. [Google Scholar] [CrossRef]
  38. Wang, X.; Keya, T.; Chou, K. Build Height Effect on the Inconel 718 Parts Fabricated by Selective Laser Melting. Procedia Manuf. 2016, 5, 1006–1017. [Google Scholar] [CrossRef] [Green Version]
  39. Popovich, V.A.; Borisov, E.V.; Popovich, A.A.; Sufiiarov, V.S.; Masaylo, D.V.; Alzina, L. Impact of heat treatment on mechanical behavior of Inconel 718 processed with tailored microstructure by selective laser melting. Mater. Des. 2017, 131, 12–22. [Google Scholar] [CrossRef]
  40. Deng, D.; Pewng, R.L.; Brodin, H.; Moverare, J. Microstructure and mechanical properties of Inconel 718 produced by selective laser melting. Mater. Sci. Eng. A 2018, 713, 294–306. [Google Scholar] [CrossRef]
  41. Zhao, Y.; Guo, Q.; Ma, Z.; Yu, L. Comparative study on the microstructure evolution of selective laser melted and wrought IN718 superalloy during subsequent heat treatment process and its effect on mechanical properties. Mater. Sci. Eng. A 2020, 791, 139735. [Google Scholar] [CrossRef]
  42. Popovich, V.A.; Borisov, E.V.; Popovich, A.A.; Sufiiarov, V.S.; Masaylo, D.V.; Alzina, L. Functional graded Inconel 718 processed by additive manufacturing: Crystallographic texture, anisotropy of microstructure and mechanical properties. Mater. Des. 2017, 114, 441–449. [Google Scholar] [CrossRef]
  43. Theska, F.; Stanojevic, A.; Oberwinkler, B.; Ringer, S.P.; Primig, S. On conventional versus direct aging of Alloy 718. Acta Mater 2018, 156, 116–124. [Google Scholar] [CrossRef]
  44. Krueger, D.D. The development of direct age 718 for gas turbine engine disk applications. In Superalloy 718; The Minerals, Metals and Materials Society: Pittsburgh, PA, USA, 1989; pp. 279–296. [Google Scholar]
  45. ASTM F3055-14a; Standard Specification for Additive Manufacturing Nickel Alloy (UNS N07718) with Powder Bed Fusion. ASTM International: West Conshohocken, PA, USA, 2014.
  46. Oradei-Basile, A.; Radavich, J.F. A current T-T-T diagram for wrought alloy 718. In Superalloys 718, 625, and Various Derivatives; The Minerals, Metals and Materials Society: Pittsburgh, PA, USA, 1991; pp. 325–335. [Google Scholar]
  47. Geng, L.; Na, Y.-S.; Park, N.-K. Continuous cooling transformation behavior of alloy 718. Mater. Lett. 1997, 30, 401–505. [Google Scholar] [CrossRef]
  48. ASTM E1479-16; Standard Practice for Describing and Specifying Inductively Coupled Plasma Atomic Emission Spectrometers. ASTM International: West Conshohocken, PA, USA, 2016.
  49. ASTM E1019-18; Standard Test Methods for Determination of Carbon, Sulfur, Nitrogen, and Oxygen in Steel, Iron, Nickel, and Cobalt Alloys by Various Combustion and Inert Gas Fusion Techniques. ASTM International: West Conshohocken, PA, USA, 2018.
  50. ASTM E8/E8M-16; Standard Test Methods for Tension Testing of Metallic Materials. ASTM International: West Conshohocken, PA, USA, 2016.
  51. ASTM B637-18; Standard Specification for Precipitation-Hardening and Cold Worked Nickel Alloy Bars, Forgings, and Forging Stock for Moderate or High Temperature Service. ASTM International: West Conshohocken, PA, USA, 2018.
  52. Mireles, O.R.; Tilson, W.; Rodiguez, O.; Jones, J.; Burkle, D. Characterizing Effects of Potential Build Induced Artifacts in L-PBF Components. In Proceedings of the AIAA Propulsion & Energy Conference 2020, #AIAA-2020-3507, Huntsville, AL, USA, 24–28 August 2020. [Google Scholar]
  53. DebRoy, T.; Wei, H.L.; Zuback, J.S.; Mukherjee, T.; Elmer, J.W.; Milewski, J.O.; Beese, A.M.; Wilson-Heid, A.; De, A.; Zhang, W. Additive manufacturing of metallic components—Process, structure and properties. Prog. Mater. Sci. 2018, 92, 112–224. [Google Scholar]
  54. Tillman, W.; Schaak, C.; Nellesen, J.; Schaper, M.; Aydinoz, M.; Hoyer, K. Hot isostatic pressing of IN718 components manufactured by selective laser melting. Addit. Manuf. 2017, 13, 93–102. [Google Scholar] [CrossRef]
  55. Zhang, B.; Meng, W.J.; Shao, S.; Phan, N.; Shamsaei, N. Effect of heat treatments on pore morphology and microstructure of laser additive manufactured parts. Mater. Des. Process. Commun. 2019, 1, e29. [Google Scholar] [CrossRef] [Green Version]
  56. Elambasseril, J.; Lu, S.L.; Ing, Y.P.; Liu, N.; Wang, J.; Brandt, M.; Tang, H.P.; Qian, M. 3D characterization of defects in deep-powder-bed manufactured Ti-6Al-4V and their influence on tensile properties. MSEA 2019, 761, 138031. [Google Scholar] [CrossRef]
  57. Raza, S. Superalloys: An introduction with thermal analysis. J. Fundam. Appl. Sci. 2015, 7, 364–374. [Google Scholar] [CrossRef] [Green Version]
  58. Cao, W.D.; Kennedy, R.L.; Willis, M.P. Differential Thermal Analysis (DTA) Study of the Homogenization Process in Alloy 718. In Superalloys 718, 625, and Various Derivatives; The Minerals, Metals and Materials Society: Pittsburgh, PA, USA, 1991; pp. 147–160. [Google Scholar]
  59. Murata, Y.; Morinaga, M.; Yukawa, N.; Ogawa, H.; Kato, M. Solidification Structures of Inconel 718 with Microalloying Elements. In Superalloys 718, 625, and Various Derivatives; The Minerals, Metals and Materials Society: Pittsburgh, PA, USA, 1994; pp. 81–88. [Google Scholar]
  60. Formenti, A.; Eliasson, A.; Mitchell, A.; Fredriksson, H. Solidification sequence and carbide precipitation in Ni-base superalloys IN718, IN625 and IN939. High Temp Mater Process 2005, 24, 239–258. [Google Scholar] [CrossRef] [Green Version]
  61. Li, Z.; He, B.; Guo, Q. Strengthening and hardening mechanisms of additively manufactured stainless steels: The role of cell sizes. Scripta Mater. 2020, 177, 17–21. [Google Scholar] [CrossRef]
  62. Liu, L.; Ding, Q.; Zhong, Y.; Zou, J.; Wu, J.; Chu, Y.-L.; Li, J.; Zhang, Z.; Yu, Q.; Shen, Z. Dislocation network in additive manufactured steel breaks strength–ductility trade-off. Mater. Today 2018, 21, 354–361. [Google Scholar] [CrossRef] [Green Version]
  63. Zhou, L.; Mehta, A.; McWilliams, B.; Cho, K.; Sohn, Y. Microstructure, precipitates and mechanical properties of powder bed fused Inconel 718 before and after heat treatment. J. Mater. Sci. Technol. 2019, 35, 1153–1164. [Google Scholar] [CrossRef]
  64. Schneider, J.; Lund, B.; Fullen, M.J. Effect of heat treatment variations on the mechanical properties of Inconel 718 selective laser melted specimens. Add. Mfg. 2018, 21, 248–254. [Google Scholar] [CrossRef]
  65. Warren, B.E. X-ray Diffraction; Addison Wesley Pub. Co.: Boston, MA, USA, 1969. [Google Scholar]
  66. Klug, H.; Alexander, L. X-ray Diffraction Procedures: For Polycrystalline and Amorphous Materials; Wiley: Hoboken, NJ, USA, 1974. [Google Scholar]
  67. Weibel, A.; Bouchet, R.; Boulc, F.; Knauth, P. The Big Problem of Small Particles: A Comparison of Methods for Determination of Particle Size in Nanocrystalline Anatase Powders. Chem. Mater. 2005, 17, 2378–2385. [Google Scholar] [CrossRef]
  68. Vyverberg, K.; Jaeger, J.; Dutton, A.J. Quantifying Detection Limits and Uncertainty in X-ray Diffraction Mineralogical Assessments of Biogenic Carbonates. Sediment. Res. 2018, 88, 1261–1275. [Google Scholar] [CrossRef]
  69. Bunaciu, A.; Gabriela, E.; Aboul-Enein, H. X-ray Diffraction: Instrumentation and applications. Crit. Rev. Anal. Chem. 2015, 45, 289–299. [Google Scholar] [CrossRef] [PubMed]
  70. Mostafa, A.; Rubio, I.P.; Brailovski, V.; Jahaze, M.; Medraj, M. Structure, texture and phases in 3D printed IN718 alloy subjected to homogenization and HIP treatments. Metals 2017, 7, 196. [Google Scholar] [CrossRef] [Green Version]
  71. Krakow, R.; Johnstone, D.N.; Eggeman, A.S.; Huenert, D.; Hardy, M.C.; Rae, C.M.F.; Midgley, P.A. On the crystallography and composition of topologically close-packed phases in ATI 718Plus. Acta Mater. 2017, 130, 271–280. [Google Scholar] [CrossRef]
  72. Calandri, M.; Yin, S.; Aldwell, B.; Calignano, F.; Lupoi, R.; Ugues, D. Texture and Microstructural Features at Different Length Scales in Inconel 718 Produced by Selective Laser Melting. Materials 2019, 12, 1293. [Google Scholar] [CrossRef] [Green Version]
  73. Schröder, J.; Mishurova, T.; Fritsch, T.; Serrano-Munoz, I.; Evans, A.; Sprengel, M.; Klaus, M.; Genzel, C.; Schneider, J.; Bruno, G. On the influence of heat treatment on microstructure and mechanical behavior of Laser Powder Bed Fused Inconel 718. Mater. Sci. Eng. A 2021, 805, 140555. [Google Scholar] [CrossRef]
  74. Zhang, D.; Niu, W.; Cao, X.; Liu, Z. Effect of standard heat treatment on the microstructure and mechanical properties of selective laser melting manufactured Inconel 718 superalloy. Mater. Sci. Eng. A. 2015, 644, 32–40. [Google Scholar] [CrossRef]
  75. Tucho, W.M.; Cuvillier, P.; Sjolyst-Kverneland, A.; Hansen, V. Microstructure and hardness studies of Inconel 718 manufactured by selective laser melting before and after solution heat treatment. Mater. Sci. Eng. A 2017, 689, 220–232. [Google Scholar] [CrossRef]
  76. Huang, W.; Yang, J.; Yang, H.; Jing, G.; Wang, Z.; Zeng, X. Heat treatment of Inconel 718 produced by selective laser melting: Microstructure and mechanical properties. Mater. Sci. Eng. A 2019, 750, 98–107. [Google Scholar] [CrossRef]
  77. Chlebus, E.; Gruber, K.; Kuznikca, B.; Kurzax, J.; Kurzynowski, T. Effect of heat treatment on the microstructure and mechanical properties of Inconel 718 processed by selective laser melting. Mater. Sci. Eng. A 2015, 639, 647–655. [Google Scholar] [CrossRef]
  78. Tucho, W.M.; Hansen, V. Characterization of SLM-fabricated Inconel 718 after solid solution and precipitation hardening heat treatments. Metals 2019, 54, 823–839. [Google Scholar] [CrossRef]
  79. Amato, K.N.; Gaytan, S.M.; Murr, L.E.; Martinez, E.; Shindo, P.W.; Hernandez, J.; Collins, S.; Medina, F. Microstructures and mechanical behavior of Inconel 178 fabricated by selective laser melting. Acta Mater. 2012, 60, 2229–2239. [Google Scholar] [CrossRef]
  80. Kantzos, C.; Pauza, J.; Cunningham, R.; Narra, S.P.; Beuth, J.; Rollett, A. An investigation of process parameter modifications on additively manufactured Inconel 718 parts. J. Mater. Eng. Perform. 2018, 28, 620–626. [Google Scholar] [CrossRef]
  81. Yan, F.; Xiong, W.; Faierson, E.J. Grain structure control of additively manufactured metallic materials. Materials 2017, 10, 1260. [Google Scholar] [CrossRef] [Green Version]
Figure 1. OM of AB specimen in the (a) XY build plane, and (b) Z build direction.
Jmmp 06 00020 g001
Figure 2. SEM BSE imaging of the XY build plane microstructure of the as-build specimen at increasing magnifications in a through d. Images in (a,b) display orientation contrasts due to electron channeling. The bright regions in the higher resolved images in (c,d) correspond to Nb enrichment, as indicated by periodic number contrast.
Jmmp 06 00020 g002
Figure 3. XRD analysis of AB Inconel 718 specimen.
Jmmp 06 00020 g003
Figure 4. DTA heating cycles for AB Inconel 718.
Jmmp 06 00020 g004
Figure 5. SEM BSE image showing rectangular region of interest in green that was extracted using FIB (a) and the corresponding TEM BFI image showing location of EDS scans in red in the STEM mode (b).
Jmmp 06 00020 g005
Figure 6. EDS results of (a) line 1, (b) line 2, and (c) line 3 scans shown in Figure 5b.
Jmmp 06 00020 g006
Figure 7. STEM HAADF image showing overview of TEM foil.
Jmmp 06 00020 g007
Figure 8. IQ map of cellular structure (a) and the corresponding TKD phase distribution map showing the γ (or FCC) matrix in red and the Laves phase in green (b).
Jmmp 06 00020 g008
Figure 9. IQ map of columnar structures (a) and the corresponding TKD phase distribution map showing the γ (or FCC) matrix in red and the Laves phase in green (b).
Jmmp 06 00020 g009
Figure 10. XRD analysis of Inconel 718 specimens after various heat treatments.
Jmmp 06 00020 g010
Figure 11. DTA heating cycles for DA Inconel 718.
Jmmp 06 00020 g011
Figure 12. DTA heating cycles for ST + Age Inconel 718.
Jmmp 06 00020 g012
Figure 13. DTA heating cycles for FHT Inconel 718.
Jmmp 06 00020 g013
Figure 14. SEI of L-PBF Inconel 718 specimens in (a) AB, (b) DA, (c) ST + Age, and (d) FHT conditions.
Jmmp 06 00020 g014
Figure 15. Higher magnification images of Figure 14c,d showing distribution of grain boundary phases for the (a) ST + Age and (b) FHT specimens.
Jmmp 06 00020 g015
Table 1. Inconel 718 Phase Summary [6,15,16].
PhaseCrystal StructureChemical FormulaVolume FractionNb Content wt.%
γFCCNiBal
γ’FCC (LI2)Ni3(Al,Ti,Nb)4%<4%
γ″BCT (DO22)Ni3Nb16%4%
δOrthorhombic (DOa)Ni3(Nb,Ti)5%6–8%
CarbideCubic(Nb,Ti)C
LavesHCP (TCP)(Ni,Cr,Fe)2(Nb,Mo,Ti) 10–12%
Table 2. Heat treatment conditions: temperature (°C) per time (h).
Heat Treat ConditionIDSR/SCHIP/SCHomo/QST/QAge 1Age 2
As-built (554)AB------------
Direct 2 step age
(527)
DA--------720/8620/10
Solutionize + 2 step age per 5663
(522)
ST+Age------1010/1720/8620/10
Full heat treatment per ASTM F3301
(506)
FHT1066/1.51163/31163/1954/1720/8620/10
Table 3. Elemental composition (wt%) with Fe as the remainder.
NiCrNb+TaMoTiCoAlMnSiCuCO
ASTM Standard B637 [51]Min
Max
50.0
55.0
17.0
21.0
4.75
5.50
2.80
3.30
0.65
1.15
1.000.20
0.80
0.350.350.300.08
Powder 50.718.25.083.150.840.070.470.020.040.010.040.02
AM specimen 51.6716.605.863.751.060.110.680.020.070.010.050.02
Table 4. Summary of void analysis.
Sample IDArea FractionAverage Void Size
(%)(μm)
AB (XY)0.2912.3 ± 13.9
AB (Z)0.1711.7 ± 12.5
ST+Age (XY)0.3014.0 ± 16.1
ST+Age (Z)0.2114.6 ± 14.7
FHT (XY)0.155.3 ± 4.5
FHT (Z)0.155.4 ± 5.4
Table 5. Mechanical properties of heat treated samples as compared to the AB.
SpecimenIDUTS (MPa)YS (MPa)%Elongation to Fracture
554AB995.2 ± 12.8698.2 ± 15.233.21 ± 1.10
527DA1439.5 ± 17.71268.5 ± 27.015.44 ± 2.00
522ST+Age1379.3 ± 10.41237.8 ± 13.419.49 ± 0.54
506FHT1395.7 ± 4.21110.9 ± 7.423.61 ± 0.36
Publisher’s Note: MDPI stays neutral with regard to jurisdictional claims in published maps and institutional affiliations.

