1. Introduction
Integrating unmanned aerial systems (UASs) into the National Airspace System (NAS) is a crucial challenge of our time. This integration will enable the execution of numerous applications that are beneficial to society. These include patrolling [
1], search and rescue [
2], package delivery [
3], mapping hazardous areas [
4,
5], and surveillance [
6]. However, before we can confidently introduce a large number of UASs into the airspace, there need to be guarantees that the UAS can operate safely. Safety is enhanced when vehicles receive vital information about their peer UAS through a reliable messaging system. One such messaging protocol is the Automatic Dependent Surveillance-Broadcast (ADS-B), which is the focus of our analysis in this paper.
This paper explores the collision avoidance capabilities of large numbers of UASs when they are integrated into the NAS using the ADS-B message system. UASs equipped with a Universal Access Transceiver (UAT) ADS-B transponder will transmit their GPS position data over the 978 MHz frequency to both ground stations and other vehicles, facilitating air traffic control and promoting collision avoidance [
7]. We combine the UAT ADS-B messages with a detect and avoid (DAA) algorithm that anticipates a high percentage of message transmission failures caused by congestion inherent in large numbers of UASs simultaneously transmitting on the same frequency. With the UAT, messages are broadcast to all vehicles within their communication range every second. Accurate positional data are provided, which is essential for the DAA algorithm’s ability to ensure safety among various autonomous aircraft [
7,
8].
Current FAA regulations, specifically FAA 107.53, generally prohibit the transmitting of ADS-B out messages on UASs. Despite this restriction, there are paths for which a similar protocol may be used in integrating a UAS into the NAS (e.g., by moving to a UAS-only messaging channel). The focus of this study is to understand whether this existing UAT ADS-B message protocol, or a modified version thereof, can support concurrent operations of large quantities—potentially thousands—of UASs. Such an assessment offers vital insights to determine the limitations and feasibility of integrating similar messaging protocols for the safe inclusion of up to thousands of UASs into the NAS.
Previous research has shown that collision avoidance objectives can be improved using ADS-B. However, there is uncertainty about the capabilities of the UAT ADS-B performance among environments with a high concentration of aircraft. The UAT system allows for 3200 message start opportunities (MSOs) each second, enabling one UAS to send ADS-B messages to another. Messages contain important information such as the vehicle’s position and velocity. Each MSO is calculated by the UAS’s UAT every second, using a pseudo-random algorithm based on the current and previous latitudes and longitudes of the UAS, as well as the UAT’s current frame number. The use of MSOs aims to minimize the likelihood of simultaneous broadcasts by two UASs that are within transmission distance, which would cause overlapping transmissions and reduce the probability of successful decoding. However, in high-density scenarios in which the UASs are using high-power transmissions, co-channel interference can occur, leading to missed messages and a reduced ability to detect other nearby UASs [
9]. The question remains unanswered regarding how many UASs can safely operate in the same airspace before co-channel interference becomes a limiting factor for DAA algorithm performance.
Several potential solutions exist to reduce the number of missed ADS-B messages inherent in high-density airspace, including (a) allocating additional channels for ADS-B messages [
10]; (b) limiting the number of vehicles that can be in the airspace simultaneously [
11]; (c) reducing the power of UAT ADS-B communications for slow-flying vehicles, such as UASs [
12]; (d) offloading UAS message communication to Long-Term Evolution (LTE) or 5G networks [
10,
13]; and (e) implementing a central message coordination system for UAT ADS-B messages [
14].
While each approach has potential benefits, they likewise come with their own drawbacks. For instance, allocating new communication channels would require collaboration with the international community [
10] and creating/installing new equipment to match different frequency specifications [
13]. Limiting aircraft operations would reduce the application benefits of using UASs [
11]. Offloading message communication comes with risks in delays in receiving time-critical information [
15]. Centralized systems require coordination from all UASs [
14].
A different protocol, Remote ID is currently required for UASs that are operating in the NAS in the United States. Its specifications require a UAS to broadcast its position, flight plan, speed, and aircraft type. Remote ID can use a few different technologies in broadcasting information, including LoRaWAN, infrared beacons, dedicated short-range communication radios, and Bluetooth 5 low energy [
16]. These technologies can provide communication from 15 to 30 km. However, despite the possible range that Remote ID is capable of, Remote ID is unproven in providing consistent and reliable messages for device-to-device communication and, currently, there are no guarantees that it will have this functionality.
This paper provides an improved UAT model to demonstrate the effectiveness of vehicle-to-vehicle UAT ADS-B communication using MSOs in high-density UAS airspace. Our approach includes (a) analyzing the communication channel to understand the impact of a large number of vehicles on the existing UAT, (b) proposing adjustments to the UAT ADS-B protocols to increase its capacity to operate with a large number of UASs, and (c) implementing a probabilistic DAA system fed by ADS-B messages to evaluate the model’s effectiveness creating a safe environment in UAS-dense airspace. Although no single approach can completely solve the issue, our methodology, combined with others, can enable safe operations of both manned and unmanned aircraft in high-density regions.
This work builds upon publication [
12] by providing specific reasons for all instances of co-channel interference. This inspires straightforward enhancements to the UAT ADS-B protocols, which if made, will improve the collision avoidance performance in airspaces with large numbers of simultaneously operating UASs. We identify the reasons for co-channel interference and, using our simulated UAT ADS-B model, demonstrate the improvements that result when minor enhancements are made to the UAT protocols.
This paper is an extension of a prior conference publication [
17], which presented a preliminary UAT ADS-B model and some analysis of dense airspaces. In this work, we provide additional simulation results, complete hardware experiments, and incorporate a DAA algorithm into the UAT ADS-B model.
In summary, this work presents an analysis of the effectiveness of UAT ADS-B transceivers in allowing high numbers of UASs to operate in a common region. The significant contributions of this paper are:
A UAT ADS-B model that identifies detailed causes for MSO collisions and suggests modifications that would improve its performance in high-density air spaces.
An analysis of how changing air space densities affect a UAS’s ability to decode ADS-B messages.
A DAA algorithm that is resilient to missed ADS-B messages and an evaluation of its effectiveness in UAS-dense airspace.
We provide results showing ADS-B transceivers’ transmitting powers up to 10 W. Given that existing small-footprint ADS-B transceivers designed for small UASs exceed 10 W transmit powers [
18], we presume that these powers will not negatively interfere with other components on the UAS.
In the following sections, we will first provide background information (
Section 2) and describe the methods used in the simulation of the UAT ADS-B messages with the UVO DAA algorithms (
Section 3). We will then present both simulation and hardware results (
Section 4) and discuss these results (
Section 4.2). Finally, we present a summary and provide potential items for future work (
Section 5).
2. Background: Uncertainty Velocity Obstacles (UVOs)
In this section, we review the prior literature and methods relevant to the detect and avoid algorithm that was chosen for this research. The Uncertainty Velocity Obstacle (UVO) method is introduced, which is the algorithm used for vehicle-to-vehicle collision avoidance in the results of our simulation.
DAA algorithms have been developed for UASs to avoid collisions with other UASs and obstacles in dynamic airspace. Many options for DAA systems have been developed to cope with the expected increase in UASs. Some of the DAA systems developed include (a) centralized methods where each UAS has a pre-planned path computed simultaneously [
19,
20], (b) queue methods where UAS paths are planned based on priority [
19,
21], (c) linear geometric methods where changes in the UAS “alert boundary” cause a trajectory change [
7], and (d) probabilistic methods where each UAS has an estimate of its chance of collision based on flight dynamics [
22,
23,
24].
However, existing DAA systems have drawbacks when applied to high-density UAS traffic. Centralized and queue systems require additional infrastructure and compliance with legal regulations for successful implementation. Linear geometric methods suffer a decrease in performance in situations with limited communication between vehicles. Moreover, probabilistic methods incur high computational costs that must be considered. For our DAA system, we use a variant of the Velocity Obstacle (VO) method, which provides a low-cost probabilistic approach that allows for collision avoidance even in the absence of consistent communication from peer vehicles.
The VO method was originally proposed by Fiorini and Shiller [
25] as a way to perform obstacle avoidance quickly and reliably. This algorithm requires knowledge of the positions and velocities of both the vehicles and obstacles in order to determine an avoidance maneuver that will place the vehicle on a collision-free path. The algorithm was later refined in [
26], where a collision cone was defined as a set of velocities that would result in a collision. The problem then became choosing a velocity outside of this collision cone to maintain a collision-free path.
One major shortcoming of the original VO method is the occurrence of significant oscillations between two vehicles trying to avoid each other using this method. In such situations, both vehicles initially choose a collision-free path away from each other. On the next iteration, they choose a new path toward their goal destination, but both vehicles move in the same direction, putting them again on a collision path. This behavior can continue indefinitely, resulting in oscillations. To address this issue, the RVO approach was introduced [
27,
28]. RVO redefines the collision cone by assuming that each agent will choose an average of its current velocity and a velocity outside the other agent’s collision cone. This method is cooperative and assumes that both vehicles in the situation use DAA. Another approach to reducing oscillations was shown in [
27], where right-of-way or visual-flight rules are given for UASs. These rules mandate that only the aircraft not in the right-of-way move, thus resolving most of the oscillation issues. Both the RVO and right-of-way methods consider uncertainty in the UAS’ position, velocity, size, and dynamics.
Our study implements a DAA system using the UVO algorithm [
29], which handles cases where ADS-B messages may be missing or outdated. UVO is a variant of the reciprocal velocity obstacle (RVO) technique [
25] and uses the collision cone method to calculate acceptable trajectories to avoid collisions. However, traditional VO methods assume that there is perfect and instantaneous knowledge of other UAS’ positions and velocities, and, when accounting for unsuccessful message transmissions, this assumption is no longer valid. UVO selects collision-free velocities based on a probabilistic understanding of the UAS’ position and velocity and therefore can better adapt to situations with limited communication.
To provide context, we now summarize the UVO algorithm but refer the readers to [
29] for an in-depth explanation and results on how well the algorithm performs compared with other methods. All VO methods, including UVO, rely on collision cones to provide a spatial region where a vehicle’s velocity would lead to an imminent collision. When the UAS is on a collision course, indicating that its desired velocity falls within the collision cone, the UVO algorithm is triggered to compute a set of admissible velocities (
). These admissible velocities represent the range of velocities accessible to the vehicle while adhering to the maximum acceleration limit. Mathematically, the admissible velocities are defined as follows [
29],
where
encompasses the velocities reachable by vehicle
A within the next time step
. In this expression,
denotes the velocity vector,
indicates the maximum achievable velocity for the sUAS,
represents the highest feasible acceleration, and
encompasses all velocities that satisfy the constraints of
and
.
A penalty function is employed to select a velocity from the set that not only minimizes the time to collision but also favors velocities aligning closely with the vehicle’s intended trajectory. This becomes particularly crucial in scenarios with uncertain obstacle positions, such as when ADS-B messages fail to decode. In the UVO method, a Kalman filter is employed to gauge the uncertainties in the obstacle’s position and velocity. These uncertainties are integrated into the collision cone, delineating a region where collision velocities fall within a desired probability of avoidance. The penalty function is then augmented with velocity and position penalties that are based on the standard deviations the admissible velocity point deviates from the estimated mean.
3. Materials and Methods
In our research, we explore the utilization of UAT ADS-B messages as a means to integrate a large fleet of UASs into the NAS. The timing of a UAT transmission is directly determined by its current MSO value. Each UAT maintains a frame number, which is set to zero during UAT initialization and incremented by an integer every second. By leveraging the current frame number and the GPS position of the UAS, the UAT calculates a new MSO through a pseudo-random number generator algorithm. While the adoption of MSOs theoretically reduces the likelihood of simultaneous message broadcasts from nearby UAS, the presence of overlapping transmissions still exists, lowering the probability of successful message decoding.
Our UAT ADS-B model adheres to the guidelines outlined in the Radio Technical Commission for Aeronautics (RTCA) document DO-282B [
30]. This document sets standards for the proper behavior of a UAT. Developed in C++, our simulation model of the UAT follows the standards set forth in [
30]. The modular design of the model enables us to make incremental updates to specific components, ensuring adaptability for continual improvements and heightened accuracy as needed.
Our simulation aims to provide insight into the behavior of collision avoidance methods in UAS-dense environments, where the successful transmission of UAT ADS-B messages is crucial. To replicate this scenario, we create a simulated environment by generating random flight paths for a set quantity of UASs within a circular region of a specified radius. Each UAS is initialized with a frame number randomly assigned within the range from 0 to 3600 and is guided along a flight trajectory delineated by randomly selected waypoints. Choosing to assign a random value between 0 and 3600 as the frame number specifies that the UAT be in operation for under an hour.
Our simulation model, shown in (
Figure 1), is comprised four major components: the environment generation, the UAS propagation system, the UAT ADS-B transmission system, and the collision avoidance algorithm. The environment generation component runs at the start of the simulation and generates a waypoint flight plan for each simulated UAS. Within this plan, each UAS is directed to a randomly selected waypoint within our designated area. The UAS propagator, which runs every hundredth of a second, is the system that moves each UAS to its predefined waypoint. Upon reaching a waypoint, the UAS is assigned a new random waypoint by the environment generator, for its continued travel. The UAS propagator system replicates the physical attributes of UASs, encompassing mass, moment of inertia, maximum speed, and maximum acceleration, thus ensuring that all trajectory changes are realistically achievable. During the propagation process, each UAS advances towards its predetermined destination based on its speed and the overall time step.
The UAT ADS-B message system runs once per second and calculates and determines message successes and failures. To accomplish this, position and velocity information is retrieved from the propagation system so that the MSOs for each of the vehicles can be generated. Each transmission success is based on the generated MSO and transmission power. If a message is deemed unsuccessful, the receiving vehicle effectively loses the visibility of the transmitting vehicle, leading to the DAA algorithm using an estimate of the position between those vehicles during the second in which the message fails.
The collision avoidance module runs every hundredth of a second and manages the DAA algorithm for each vehicle. Simultaneously, the collision avoidance system calculates collision cones and adjusts UAS trajectories to prevent potential collisions. These calculations are based on the best-estimated positions of each vehicle. If a vehicle’s ADS-B message is not successfully received by its peer vehicles, as calculated by the UAT ADS-B model, then the estimated position of that vehicle will be more uncertain. When a UAS must deviate from its chosen path to avoid a collision, the UVO algorithm chooses paths that are safe but most closely follow the vehicle’s desired trajectory. Once the obstacle has been avoided, then the UAS returns to a path to achieve its original goal.
The UAT ADS-B transmission system requires the MSO values for each vehicle to determine if the transmissions are successful. MSO values are calculated using a pseudo-random algorithm that considers the UAS’ latitude and longitude along with the MSO value that was chosen during the prior second [
30]. Each successive calculation of a pseudo-random number after the first one relies on the previous pseudo-random number and current frame number. The generation of MSO values is derived from the 12 least significant bits of the latitude and longitude of the vehicles, along with the frame number. The determination of whether the least significant bits correspond to longitude or latitude depends on the parity of the frame number. If the frame number is even, the least significant bits are from the latitude, and if it is odd, they are from the longitude. When a UAT is powered on, the first pseudo-random number it calculates assumes a frame number of zero. However, it is unrealistic to assume that all UATs are powered on at the same time. Therefore, in our simulations when we wish to initialize a UAT in the model with a frame number other than zero, we first initialize the previous pseudo-random number with a frame number of zero then use that number with a random frame number to start the simulation.
Several conditions must be met for a transmission to be successful. These conditions include that the transmitted message must: (1) meet a minimum trigger level (MTL), (2) pass a random draw, (3) arrive at its peer UAS while they are in receiving mode, and (4) not overlap with other messages being transmitted (either partially or completely). Messages that fail any one of these conditions are considered unsuccessful.
Figure 2 shows the evaluation order of these conditions. In the text below, we elaborate on these conditions in the same order. We opt for this order to emphasize failures stemming from UAT ADS-B processing rather than those that might be attributed to environmental factors, such as weak signal strengths. Conditions 3 and 4 are the causes of message failures that most closely align with the UAT standards. By counting these failures last, we identify which decodes were unsuccessful due to the UAT ADS-B protocol limitations.
We first check that the MTL requirement is met. Any transmission registering a received signal power below −93 dBm is categorized as beyond the range of decodable messages for the UAT, leading to the marking of the message as unsuccessful. The evaluation of the MTL condition takes precedence, given that transmission power is influenced by environmental factors such as the distance between UASs or terrain conditions, distinguishing it from UAT-specific conditions.
Following each condition assessment, if the decode is marked as being unsuccessful, it is not subjected to further processing. This approach ensures that each failure is attributed to a single discernible condition. Furthermore, messages failing due to falling below the MTL are excluded when computing the overall probability that messages are unsuccessful decoded. This exclusion is justified by recognizing that messages with weak signal strength are likely a consequence of the substantial distance between the two UASs. In this situation, we presume that the communication or mutual awareness of positions among the UASs is neither crucial nor desirable. This circumstance is better characterized as an outcome indicating substantial distances between the UASs rather than a transmission failure.
The results in
Section 4 include the probability that messages fail to meet the MTL. However, this probability is not incorporated into the overall success metric.
We calculate the received signal power of a message by assuming the UAT operates with an isotropic radiator antenna. The ideal isotropic radiator formula provides the incident power density as
where
R is the distance between the transmitter and receiver and
is the UAT’s transmit power. With isotropic radiators, the Friis formula for the received signal power
is
where
is the signal’s wavelength.
After meeting the MTL condition, the second condition for a message to be decoded successfully is that it must pass a random draw. Messages with a received signal strength between −90 and −93 dBm receive a 90% probability of successfully passing this condition, while those that meet or exceed −90 dBm have a 99% probability.
The third condition the message must pass is to arrive at the receiving UAT when it is in receiving mode. The UAT is unable to both transmit and receive messages at the same time. Nor can it instantaneously switch between receiving and transmitting modes. In our simulation model, we adhere to the UAT standard, which stipulates a 2 ms duration for a system to transition between transmitting and receiving modes. Consequently, whenever a UAT initiates the transmission of an ADS-B message, it enters a period during which it cannot receive incoming transmissions—lasting for the 2 ms before and after its message is transmitted. An MSO time slot spans 250 s, implying that a UAT is unable to receive messages during the 8 MSOs preceding its transmission and the 9 MSOs following its completion. This extended period after transmission results due to both types of ADS-B messages (long messages and basic messages) exceeding the 250 s duration, causing the 2 ms transition span to partially overlap into the 9th MSO slot.
Subsequently, the message must satisfy the fourth condition, which specifies that a message’s synchronization sequence (comprising the initial 36 bits) must not be received simultaneously while decoding another message. This provision prevents the successful decoding of messages transmitted on successive MSOs because the ADS-B message, irrespective of being long-form or basic-form, will overlap with the synchronization sequence if it is transmitted on the subsequent MSO.
In scenarios where multiple ADS-B messages are transmitted consecutively, only alternating messages will be successfully decoded, provided they meet all preceding conditions. Illustratively, consider four messages that are transmitted on successive MSOs. In this scenario, the first ADS-B message will be decoded correctly, but the synchronization sequence sent on the second MSO will overlap with the end of the first message, rendering the second message undecodable. The third message, however, will be successfully decoded since there is no message being decoded following the failure of the second message. Subsequently, the fourth message will fail to decode, establishing a recurring pattern for all messages transmitted on consecutive MSOs.
The fifth condition precludes complete overlaps of MSO transmissions. This total overlap of ADS-B messages is designated as an MSO collision. When this occurs, none of the simultaneous transmissions are decoded. However, in the results section of this paper, we present an improved UAT ADS-B model that permits the transmission of a specific message if its signal strength surpasses that of all others by at least 4 dB. This straightforward modification to the conventional UAT ADS-B model yields performance enhancements and aligns with the permissible implementations within the established guidelines for the proper operations of the UAT ADS-B [
30].
The success rate is determined by calculating the percentage of transmissions meeting the MTL and successfully decoded. Conversely, the failure rate is computed as the percentage of messages failing conditions 2–5 divided by the messages that passed condition 1. The success rate is then derived by subtracting the failure rate from one. For instance, consider a scenario with 50 message transmissions. If 25 messages fail condition 1, with 1 failure for condition 2, 1 for condition 3, 2 for condition 4, and 5 for condition 5, the success rate is calculated as .
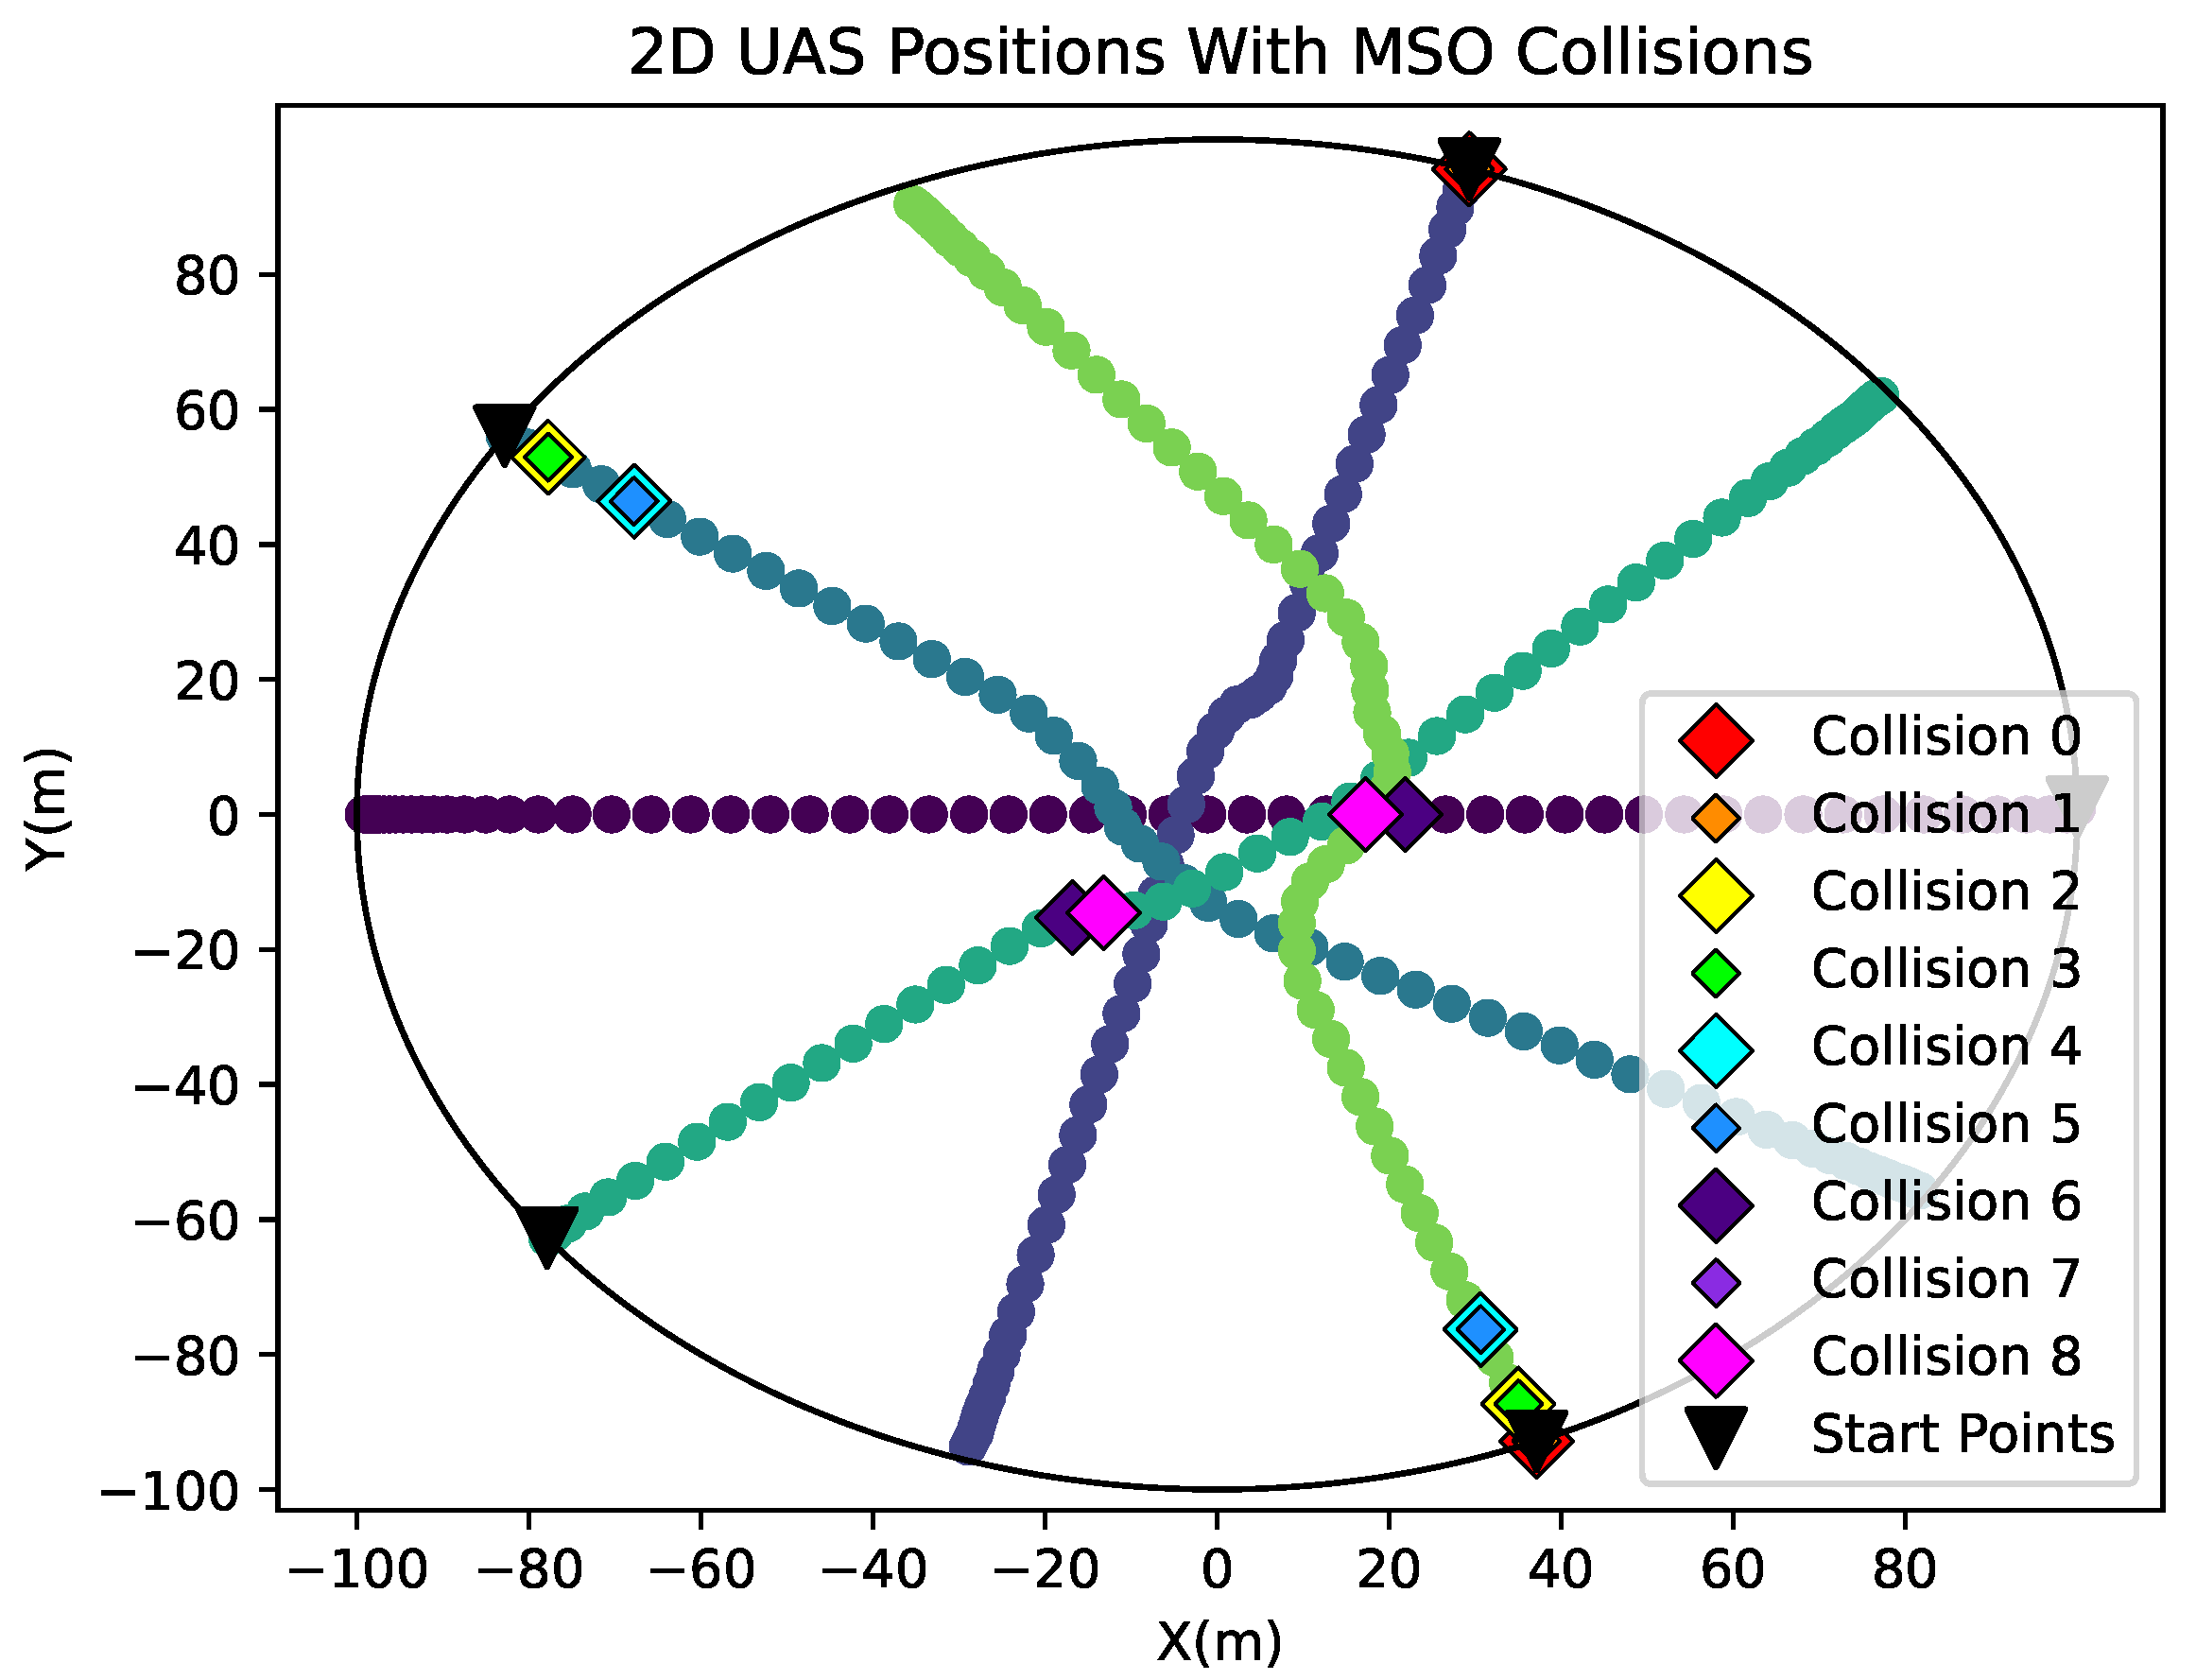
Figure 3 provides an illustrative scenario showing how common it is for a small set of UASs to have message collisions. This scenario simulates 5 UASs with flight paths and message collisions. The simulation ran both the UAT ADS-B model and the collision avoidance algorithm. To better show the UAS paths, the UASs are spaced around a circle that has a radius of 100 m. In this specific scenario, the UASs are directed to navigate toward a waypoint situated on the diametrically opposite side of the circle. All UASs are on a 2D plane and fly at a fixed altitude; this creates the hardest possible situation for collision avoidance. Each UAS flies at a maximum velocity of 5 m/s, for 60 s using time steps of 0.01 s. During the 60-s explanatory simulation, the UAS had eight two-way ADS-B message failures, i.e., eight times that two UASs failed to receive messages. The diamonds show the locations of the two UASs at the time the messages failed to be decoded. Notice that in the figure some positions in time have multiple message failures, and the markers for message collisions are located underneath other similar markers.
We can analyze the way the UAT algorithm calculates MSOs to gain a better understanding of the occurrences of MSO decode failures. The UAT employs a pseudo-random algorithm that utilizes the 12 least significant bits derived from the binary representation of the UAS’s GPS location [
30]. This constraint inherently limits the potential range of outcomes when calculating an MSO. By applying the Haversine formula in conjunction with a binary-to-degree conversion, we can estimate the distance for one MSO increment. For instance, to transition from the 10th to the 11th MSO, a vehicle must move approximately 1.82 m longitudinally or 2.39 m latitudinally, depending on the frame number. The great-arc distance
d between two coordinates in meters, as given by the Haversine formula is [
31]
where
R is the earth’s radius in meters, the latitude is represented by
, and the longitude is
. The change in latitude coordinate values is denoted as
, while the change in longitude coordinate values is represented by
.
The MSO increment distance will be different for the lateral and longitudinal directions. To find these distances, we use the coordinate of Provo, UT, as the reference origin, which is located at N and W. Defining two latitudinal positions and at exactly one degree apart, the difference is radians. Inserting this value into the Haversine algorithm yields an approximate distance of one latitudinal degree to be 111,317 m.
The conversion from degrees to bits, as defined by
[
30], serves as a tool for determining the increment of a single MSO slot. To ascertain the quantity of MSO increments per degree, the inverse of
is computed, revealing an approximate count of 46,603 MSO increments per degree. Further calculations provide the distance represented by an individual MSO increment. This is achieved by dividing
to yield approximately 2.3886 m per MSO. Replicating these computations for coordinates with
and
radians, the outcome indicates that one MSO increment in the longitudinal direction corresponds to around 1.8235 m.
The collision avoidance part of the system utilizes the UVO method to determine the potential trajectories that would lead to a crash and selects a point outside of those computed paths. However, it is important to note that this system is not foolproof, and collisions can still occur even when messages are received successfully. For instance, a UAS moving at high velocity may not have enough acceleration capacity or time to avoid a collision when an obstacle enters its collision cone. Therefore, selecting an appropriate speed for the UAS and carefully determining the length of the collision cones is essential in providing the best possible outcome for collision avoidance.
Combined, the four components of our simulation—the environment generation, the UAS propagation system, the UAT ADS-B transmission model, and the collision avoidance algorithm—provide a robust simulation environment capable of modeling realistic behaviors for thousands of UASs.
4. Results
In this section, we show the capabilities of the UAT ADS-B transponders when operating in UAS-dense environments. We show this both through extensive simulation experiments and provide a comparison between the hardware and simulation systems. The hardware results are small in scope and used to provide validation to the simulation model. The simulation results are extensive, providing a range of Monte Carlo tests for large numbers of UASs and various parameters.
4.1. UAT ADS-B Model Simulation Results
In this subsection, we evaluate the efficacy of a UAT ADS-B unit when operating in environments marked by increased concentrations of UASs. To accomplish this, we conducted simulations exploring different scenarios that encompass a range of UAS densities and transmission powers. In each scenario, the UAS navigates to randomly selected waypoints within a circular region of varying radii. This setup provides a comprehensive exploration of performance across different spatial configurations. Each UAS flies at a set altitude of 100 m and can only maneuver in a 2D plane, providing the worst-case scenario for stressing the DAA algorithm. They fly at a maximum speed of 40 m/s but can modify their speed below this value to maneuver around other UASs. Each scenario simulates 100 s with a time step of 0.01 s, where each UAS will travel to its random endpoint, and, if it reaches its endpoint before the 100 s have elapsed, it will then be assigned a new endpoint.
Realistic aerodynamics of quad rotors are implemented, with each vehicle having a mass of 5 kg, a mass moment of inertia of 0.6271 kg/m2, 0.6271 kg/m2, and 1.25 kg/m2, in the x, y, and z orientations, respectively. Linear drag coefficients of 0.1, 0.1, and 0.001, and angular drag coefficients of 0.001, 0.001, and 0.001 both in the x, y, and z orientations, are also used in the simulation. Settings tailored for a small UAS are employed in the experiments. Nevertheless, any settings for the physical constants of the UAS can be utilized, as long as they remain within the bounds of physical possibility.
Transmit powers of 10 W, 1 W, 0.1 W, and 0.01 W were simulated, where each vehicle in the simulation has the same transmission power. The UAS concentrations in UAS/km2 were 0.23, 0.5, 1, 2, and 5. The densities of UASs in the simulation refer to the total number of UASs compared to the total area of the simulation. Therefore, there are smaller zones inside of the simulation where larger or smaller densities may be observed. This is especially true of the center of the circular region where most UASs have paths going through that area and higher densities result.
Monte Carlo simulations were conducted using a transmission power of 20 W, but the findings mirrored those obtained with a 10 W transmit power. Consequently, these results have been excluded from the analysis. The similarity in results arises from the high transmit powers, ensuring that each transmission for both the 10 W and 20 W simulations consistently exceeds the −90 dBm signal strength threshold. This uniformity in signal strength results in comparable simulation dynamics and outcomes.
Table 1 presents the outcomes derived from the UAT ADS-B model, systematically detailing six distinct measures across each of the 25 scenarios. The initial value in each result denotes the probability of successfully decoding a message, considering the specified number of UAS (columns) and transmission powers (rows). The next value provides the likelihood of a decode failure due to not meeting the MTL. Note that while we include this value as a reference, we do not factor it in when computing the overall probability of success. The third metric represents the probability of a random draw causing the message to fail. The fourth metric measures the message failure probability arising from the UAS being in either a transmitting or transitioning state at the time the message was received. The fifth metric indicates the probability that the message partially overlapped with another ADS-B message. Lastly, the sixth metric reflects the likelihood that an MSO collision occurs.
When examining the probabilities of failure resulting from random draws, it is crucial to bear in mind that only those messages with enough signal strength to meet the MTL are eligible to encounter random draw failures. Given that the UAT ADS-B protocols indicate that 1% of messages with signal strengths surpassing −90 dBm should fail due to random draws, it logically follows that, for the 10 W simulations, 1% of the total number of messages should experience a random draw failure since the signal powers of all messages in the simulated region all exceed the required −90 dBm.
As shown in
Table 1, there is a decrease in the probability of successfully decoding messages as the density of a UAS increases, as expected. Additionally, the table shows that a higher transmission power correlates with a diminished likelihood of successfully decoding messages. It is noteworthy that, for context, small UASs typically employ a transmit power of at least 7 W, surpassing some of the transmit powers tested in our study [
30]. Across all scenarios, having partially overlapping messages and direct MSO collisions are the two predominant factors that contribute to the failure to decode transmitted messages. Understanding these two factors inspired us to create and test an enhanced model aimed at reducing the number of messages that fail to be decoded.
Our enhanced model introduces two key modifications to the original UAT ADS-B protocol. First, we make the assumption that every ADS-B message is of a length that fits the time window of a single MSO. This removes all the occurrences where messages fail to decode because they partially overlap each other. Second, we permit signals that are 4 dB or stronger to be decoded even when they arrive simultaneously with other signals. Consequently, when multiple messages, all meeting the MTL, converge at the same UAT simultaneously, decoding occurs only for the signal with at least a 4 dB advantage over the others. The remaining messages will then all fail to be decoded. If there are no signals that exhibit a 4 dB or greater advantage, all signals fail to be decoded. In contrast, the standard model fails to decode any messages arriving simultaneously at the same UAT. This enhancement, as outlined in [
30], presents a practical and implementable solution within the current UAT ADS-B framework.
The enhanced model incorporates both modifications: a reduction in the message length, which will eliminate all partially overlapping messages, and the capacity to prioritize and decode a message when an MSO collision occurs provided that its signal power exceeds that of all the other messages by at least 4 dB. In
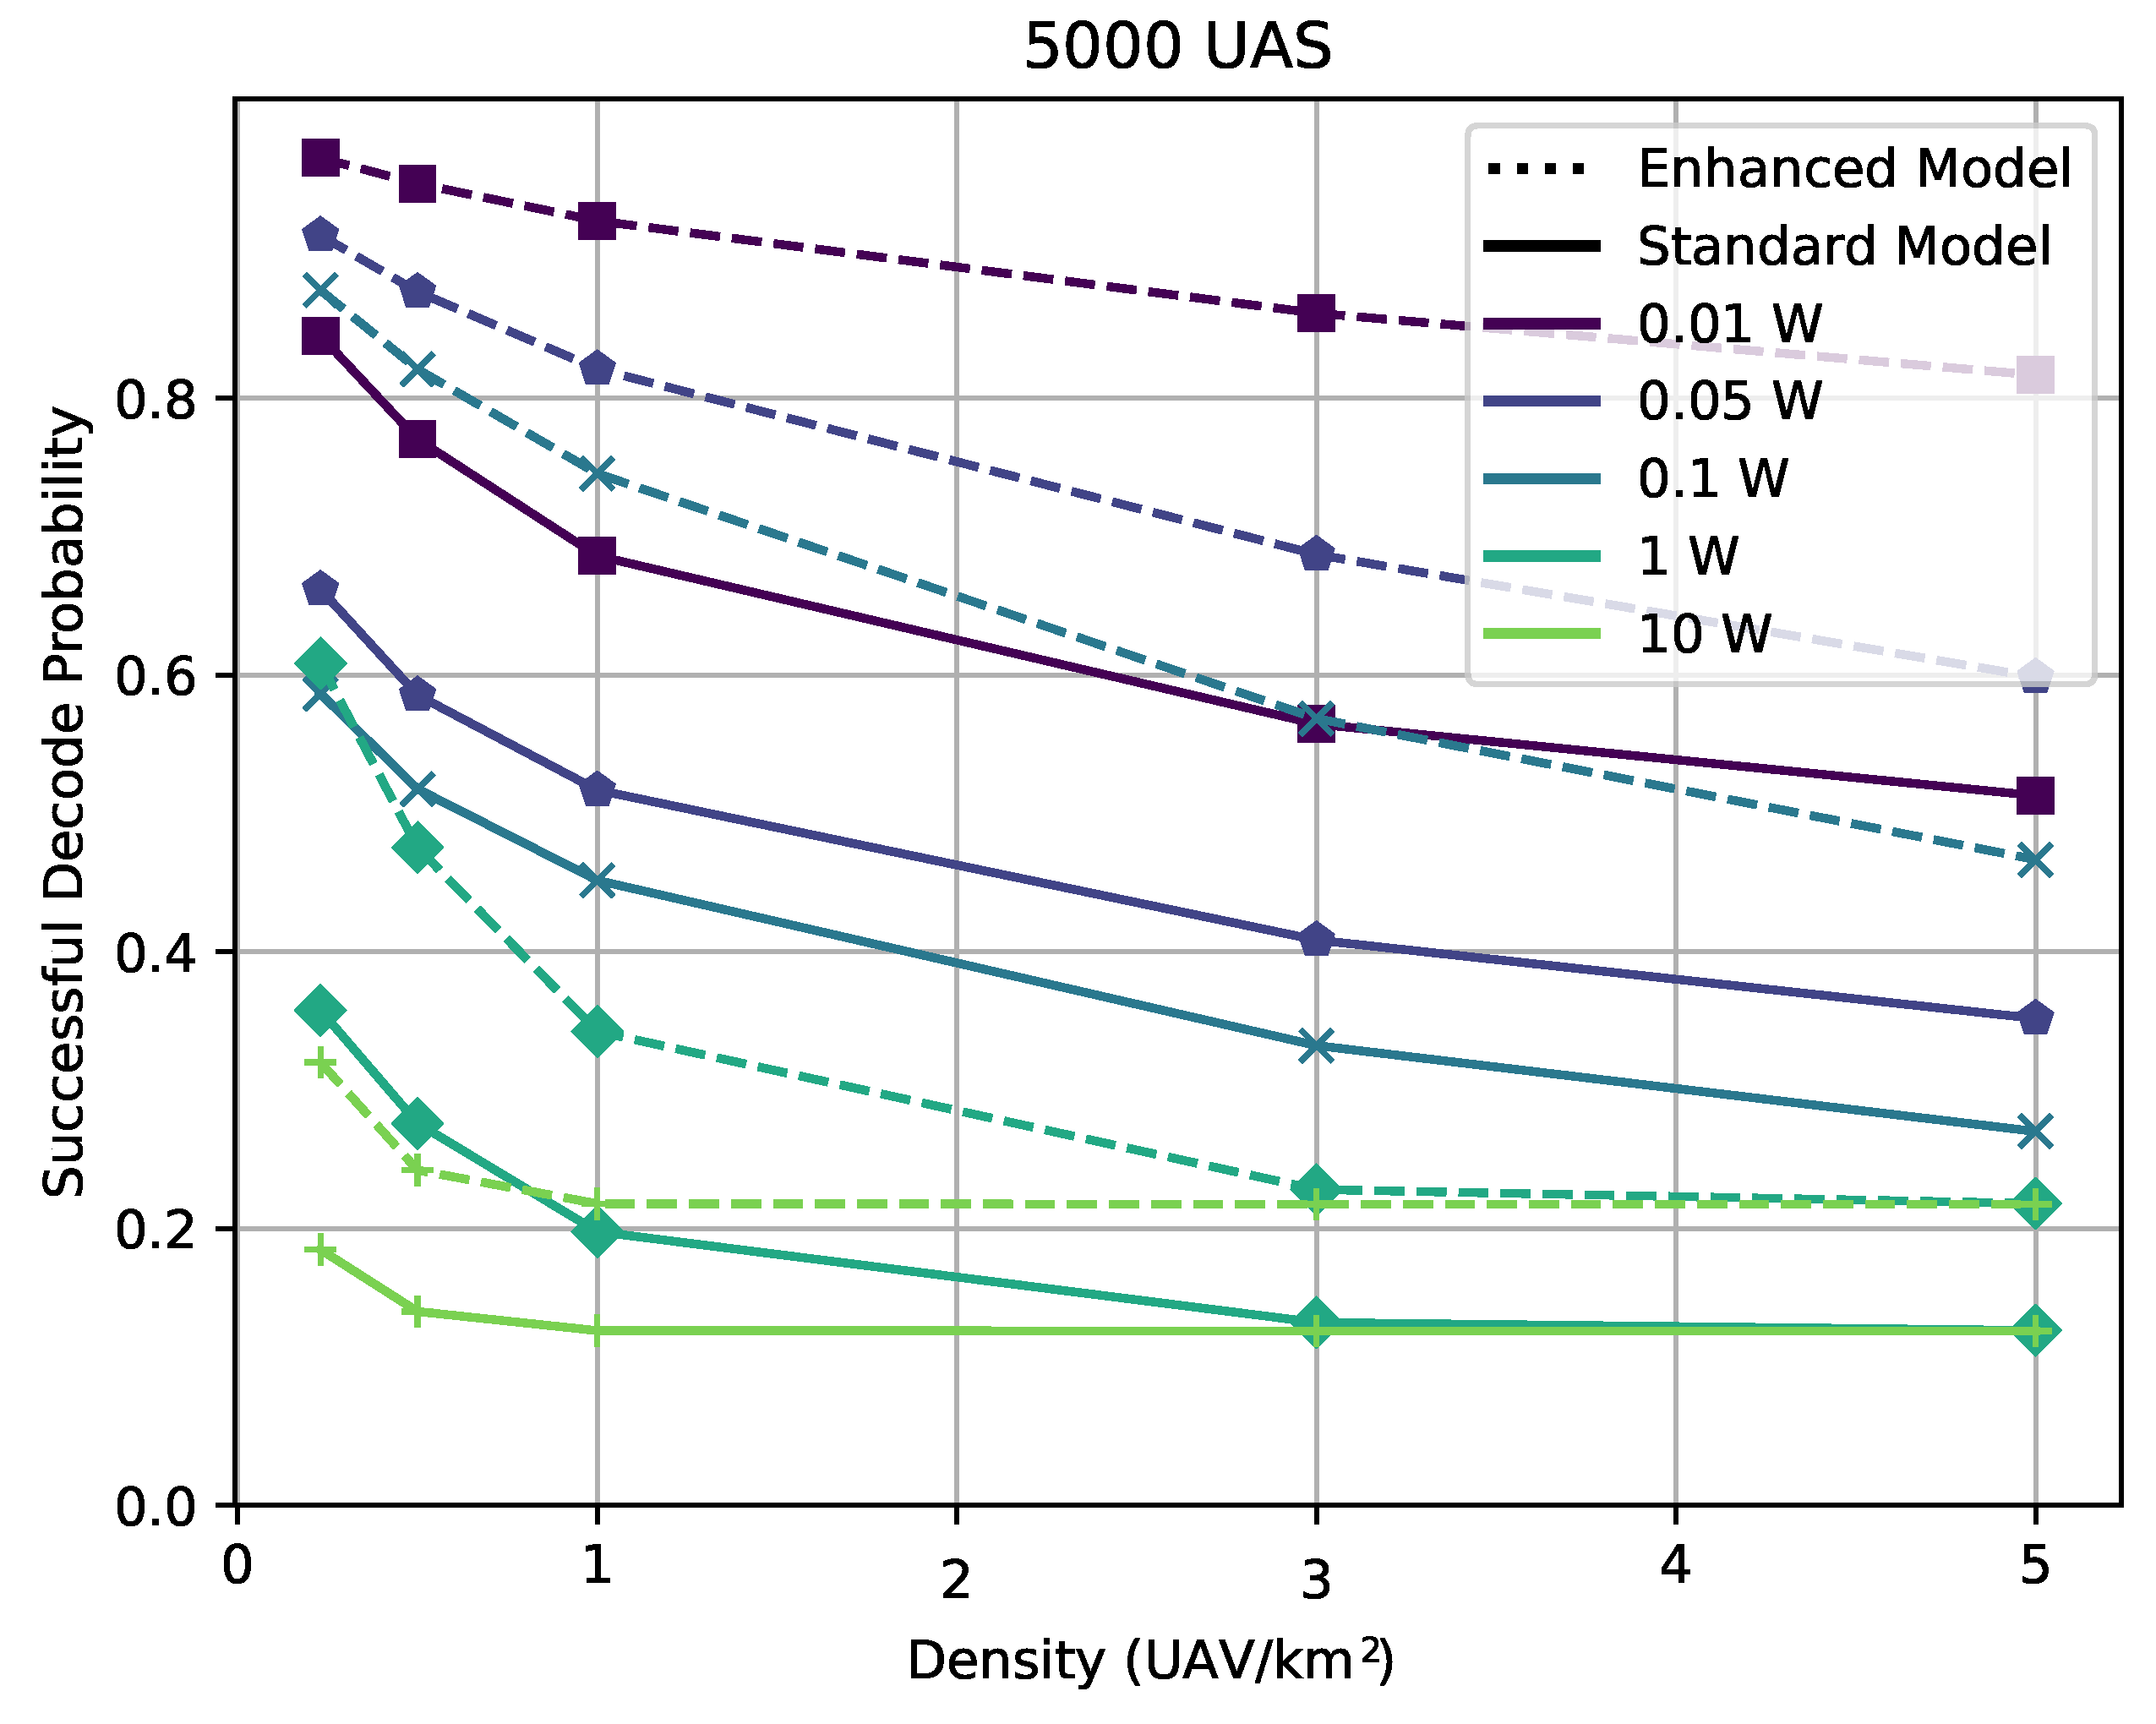
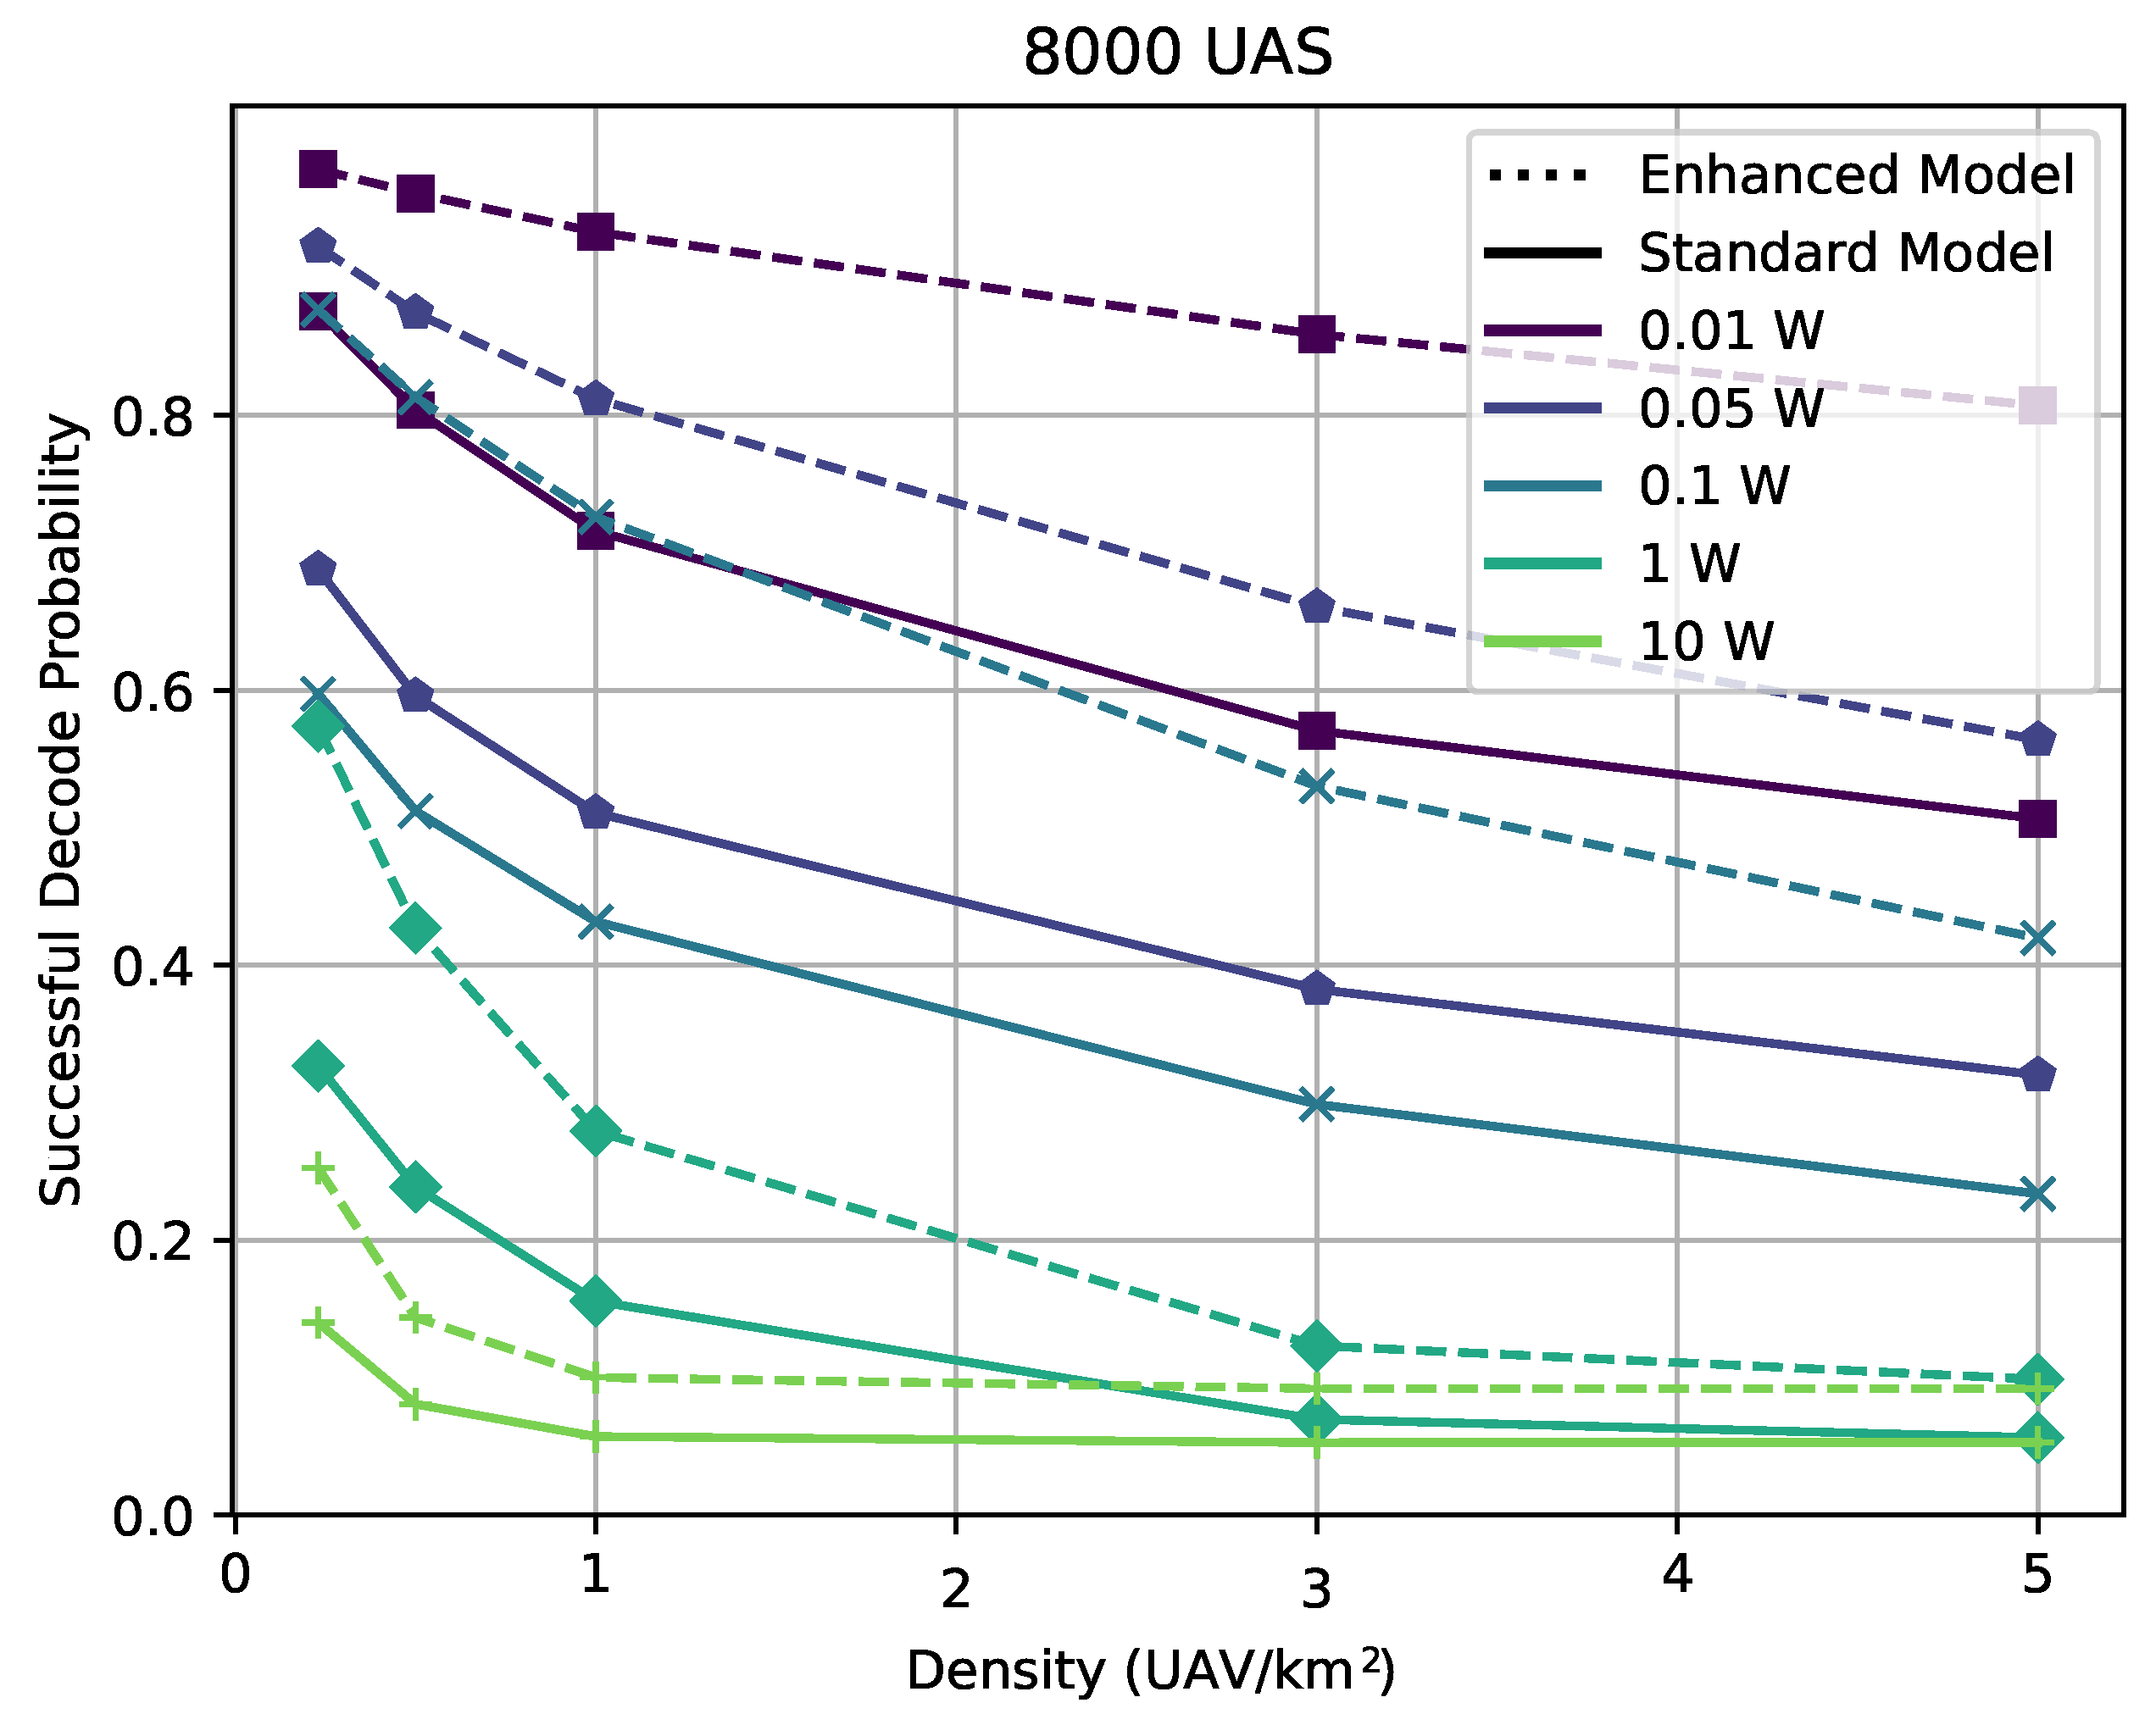
Figure 4, the standard and enhanced models are compared for different areas/densities with simulations of 3000 UASs. As can be seen, the simple changes in the enhanced model provide a significant increase in the probability that messages will be successfully decoded. As before, when the density increases there is a downward trend of successful messages. This trend increases in
Figure 5 where there are 5000 UASs present per simulation and even more so in
Figure 6 with 8000 UASs per simulation. The enhancements provided increase the robustness of the ADS-B messages; in the case of 8000 vehicles, the enhanced model maintains greater than 80% successful decode probabilities across all densities when using a transmission power of 0.01 W. By comparison, the standard model quickly falls below an 80% success rate and eventually falls to a less than 60% successful decode rate.
UAS collisions are when two vehicles experience a loss of separation or come closer than a pre-defined separation distance. In these simulations, we set the minimum separation distance to a 10m radius. This distance is a user-defined parameter in our simulation that will depend on the class and speed of the UAS being operated. Regulated separation distances for UAS have not been specified as they have for manned aircraft systems.
UAS collisions are influenced by the successful reception of the ADS-B messages. If more messages are received then the DAA algorithm has a higher chance of avoiding a collision. The density of the simulation is determined by the number of UAS in the total area. However, there are smaller zones within the larger area where the UAS density may be higher or lower. The hardest situation for our DAA algorithm is when the vehicles are traveling at high speeds and the collision cones are short.
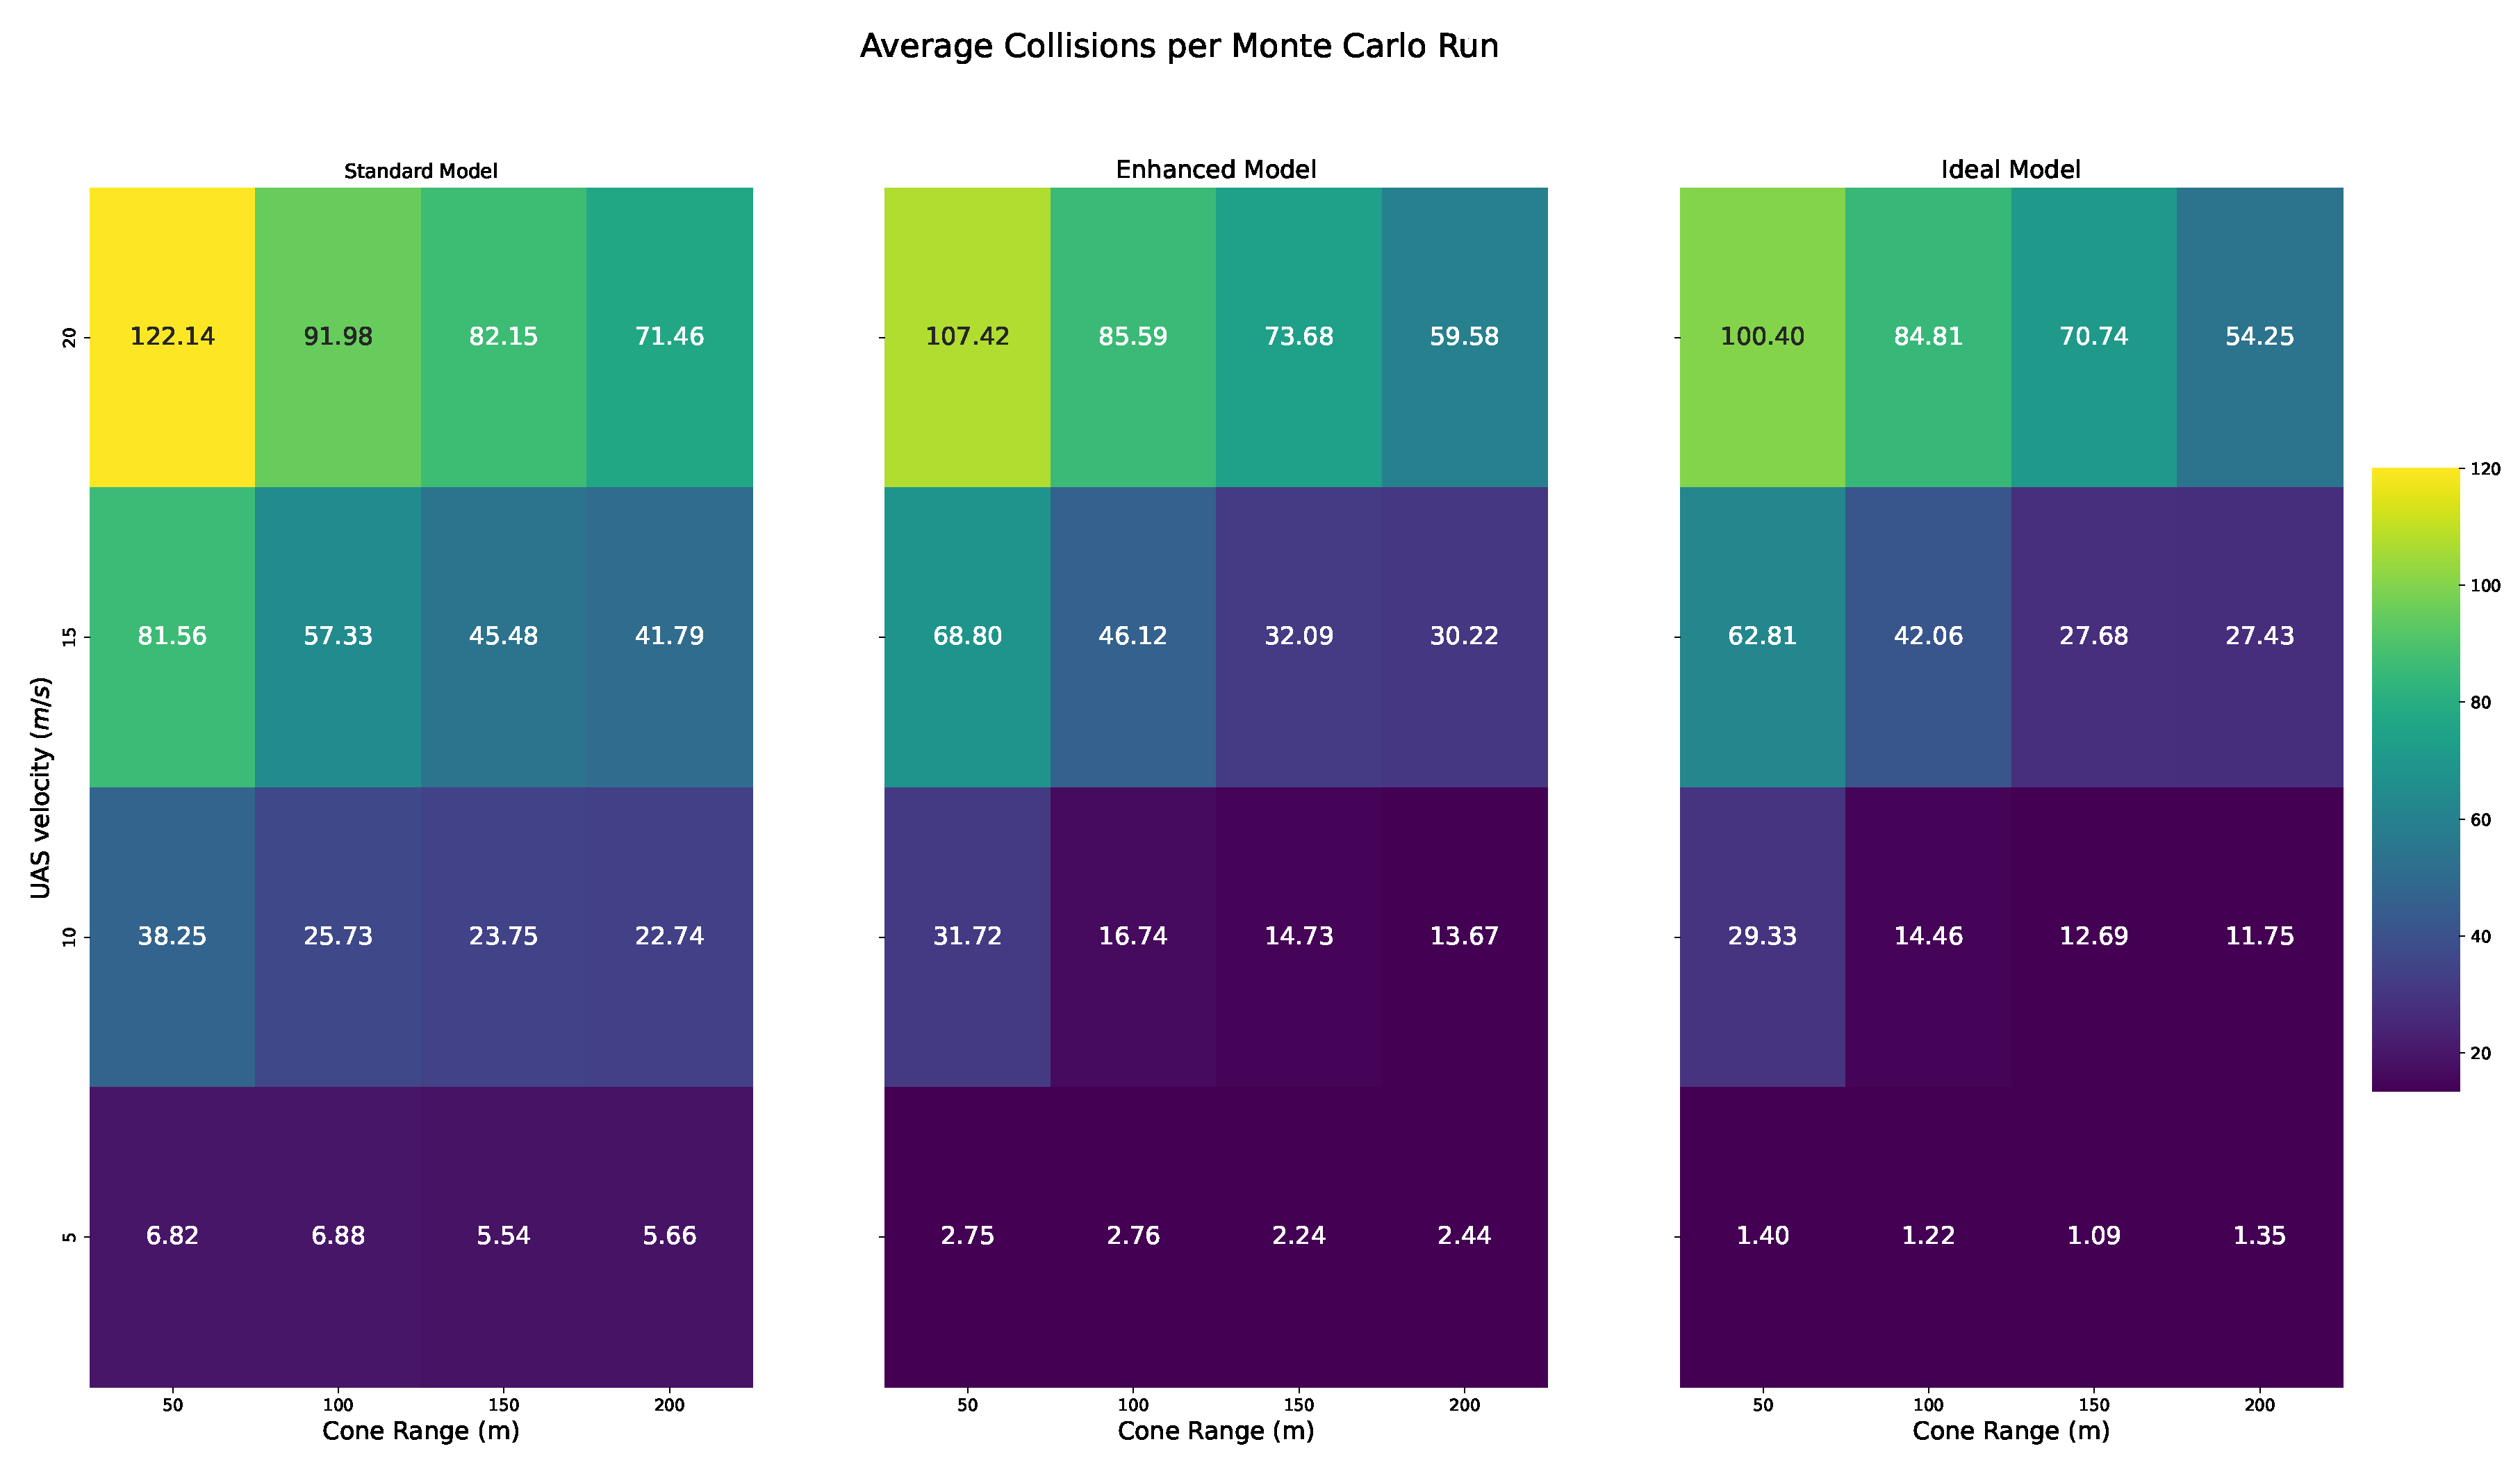
Figure 7 shows a heatmap of the total averaged number of collisions for sets of 100 Monte Carlo runs with varying UAS speeds and collision cone distances. This figure shows that physical collisions are reduced when using the enhanced model, as compared to the standard model. Each simulation set shows the results of 5000 vehicles running for 100 s. The ideal model shows the UAS collision results assuming perfect transmissions. This provides an upper bound on the performance of the collision avoidance algorithm. The results emphasize the dependence on receiving timely messages to avoid UAS collisions.
4.2. Hardware Results
To validate the similarity of the UAT ADS-B simulator’s performance to real-world units, we conduct a comparative analysis of message collision occurrences between the simulation and the hardware. The hardware testing setup comprises two commercial UAT units (as shown in
Figure 8), each equipped to transmit and receive manipulated ADS-B messages. Developed by R Cubed Engineering, each unit is constructed around a Raspberry Pi interfaced with a Uavionix PING2020i UAT, an external GPS unit, and a power source. Wireless connectivity is enabled for each Raspberry Pi. The PING2020i unit is configured to exclusively employ GPS coordinates provided by the Raspberry Pi. Communication with the hardware units takes place via a laptop running Windows 10 over a wireless network. However, access to the software internals of these hardware units is unavailable, precluding knowledge of internally used parameters within the system.
We use the ability to spoof GPS coordinates of the UAT so that they can follow specific pre-generated paths, notably the racetrack path (
Figure 9). In hardware tests that used the racetrack path, transceivers spoofed messages as if they were spaced at slightly different latitudes but moving from west to east at the same longitude. After a distance, the UAS turns around in a counter-clockwise fashion to align its trajectory on the origin point. When it arrives at the point of origin, it makes another counter-clockwise turn, then continues on for a time, and finally the path ends when it is midway through a third turn that overlaps with the first turn. This test was completed in 32 min and 7 s, with one message spoofed each second, yielding 1927 messages.
Table 2 contains an example run with the number of decode failures of different types that were observed in a racetrack flight path for both the hardware and the UAT ADS-B model simulation. Before running the flight paths through the simulation model, we have to set the starting frame numbers in the UATs. In simulations, we tested starting frame numbers of zero and nonzero even or odd integers. Running the racetrack path in simulation, while initializing the frame numbers to zero, the model predicted 46 “random draw” failures and 21 failures due to receiving UATs not being in receiving mode. Different initial starting frames yielded similar results.
Analyzing each failure type provides understanding as to why the differences occur between our UAT ADS-B model and the hardware tests. In
Table 2, we see that the hardware test and the UAT ADS-B model both have zero MTL decode failures. This is expected with the hardware tests because the units were physically in close proximity to each other. Zero MTL failures are also expected in the simulation model due to the close proximity (tens of meters in separation) of the two UAT paths. The hardware test had zero “random draw” failures, while the model predicted 46 failures of the same kind. The “random draw” failures are meant to highlight that even in ideal conditions there is a chance that messages will fail to be decoded for environmental or hardware reasons. These tests imply that the 10% random draw failure specified by the UAT documentation is a conservative bound of the true number of failures.
The difference seen between the hardware and simulation failures from transceivers not being in receiving mode may occur for several reasons. The first possibility is that the MSO calculations that the hardware units are performing use a slightly different value for the latitude or longitude, resulting in a different MSO value. Another possibility is that the behavior of the model is based on the switching period of 2 ms before and after transmission. We suspect that the hardware units are switching between receiving and transmitting in a shorter amount of time.
For the partial overlap and MSO collision decode failure types, both the hardware tests and the model predict zero failures. These predictions make sense because, in a scenario with only two UATs, it is unlikely for partial overlap or MSO collision decode failures to occur. Additionally, the difference between the UAT ADS-B model and the UAT hardware may be due to uncontrollable differences between the simulation initialization, which starts at a zero frame number at the correct start location, and the hardware initialization. We suspect that the hardware may initialize to a zero latitude and longitude position before it starts reading the spoofed data file. The difference in a start-up with the hardware means that we do not know the prior random number or the current frame number when the hardware begins its racetrack path.
Overall, our hardware testing reveals that our UAT ADS-B simulation model is conservative in comparison to the actual behavior of UAT ADS-B transceivers and any discrepancies have a logical reason for occurring. Further insight into the internal variables of the UAT ADS-B hardware would have enabled a detailed comparison between the MSOs selected between the model and hardware. However, this is not possible, since it requires a commercial UAT system with the ability to record and control frame numbers and MSO values. To the best of our knowledge, there is not a commercially available UAT system with this capability.


 and
and 


