Article

The Sound of Surveillance: Enhancing Machine Learning-Driven Drone Detection with Advanced Acoustic Augmentation

by
Sebastian Kümmritz
H2 Think gGmbH, 12489 Berlin, Germany
Drones 2024, 8(3), 105; https://doi.org/10.3390/drones8030105
Submission received: 30 January 2024 / Revised: 14 March 2024 / Accepted: 16 March 2024 / Published: 19 March 2024
(This article belongs to the Special Issue Advances in Detection, Security, and Communication for UAV)

Abstract

:
In response to the growing challenges in drone security and airspace management, this study introduces an advanced drone classifier, capable of detecting and categorizing Unmanned Aerial Vehicles (UAVs) based on acoustic signatures. Utilizing a comprehensive database of drone sounds across EU-defined classes (C0 to C3), this research leverages machine learning (ML) techniques for effective UAV identification. The study primarily focuses on the impact of data augmentation methods—pitch shifting, time delays, harmonic distortion, and ambient noise integration—on classifier performance. These techniques aim to mimic real-world acoustic variations, thus enhancing the classifier’s robustness and practical applicability. Results indicate that moderate levels of augmentation significantly improve classification accuracy. However, excessive application of these methods can negatively affect performance. The study concludes that sophisticated acoustic data augmentation can substantially enhance ML-driven drone detection, providing a versatile and efficient tool for managing drone-related security risks. This research contributes to UAV detection technology, presenting a model that not only identifies but also categorizes drones, underscoring its potential for diverse operational environments.

1. Introduction

The widespread use of UAVs, or drones, has led to a range of applications from aerial photography to logistics, alongside challenges in airspace security, exemplified by the 2018 London Gatwick Airport incident [1]. These issues underscore the importance of developing effective drone detection and classification systems.
Traditional detection methods, including radar [2], RF-based techniques [3], and visual systems [4], face limitations in cost, range, and environmental sensitivity. Consequently, there is an increased interest in acoustic-based detection, recognized for its cost-effectiveness and flexibility. Acoustic signatures have been extensively studied for UAV detection, highlighting their viability [5,6,7,8].
However, it is crucial to acknowledge that each detection technique, including acoustic-based methods, has its inherent advantages and disadvantages. No single technique suffices in creating a comprehensive and effective drone detection system. As Park et al. aptly noted, relying solely on one method of detection inevitably leads to gaps in drone detection capabilities, posing challenges in successfully neutralizing illegal drones [9]. This paper focuses primarily on acoustic detection due to its cost efficiency. The use of small, cost-effective detection devices equipped with MEMS microphones could be widely deployed in sensor networks, potentially compensating for some of the limitations inherent in acoustic-based detection. By integrating these devices into extensive networks, a more thorough and efficient detection framework can be established, leveraging the scalability and economic feasibility of acoustic technology.
Building on prior work, ’Comprehensive Database of Drone Sounds for Machine Learning’ [10], a substantial open-access database of drone audio data has been developed. This database, meticulously compiled and categorized, covers a range of UAV classes from C0 to C3. An extensive collection of 40 different drone models is included, encompassing a significant total duration of 23.42 h of recordings. This comprehensive assembly of data forms a robust foundation for the development and training of ML algorithms for drone detection.
This study aims to develop drone classifiers that not only detect but also categorize drones into EU-regulated classes (C0 to C3), considering UAV weight, capabilities, and usage [11]. For detailed EU drone category descriptions, see Table 1, essential for understanding the range of UAVs identifiable by these classifiers.
This study investigates the impact of data augmentation on classifier performance, initially training classifiers with high-quality drone sound recordings from an anechoic chamber and later applying various augmentation techniques to mimic real-world conditions, improving classifier robustness. Despite data augmentation’s potential in addressing the deep learning challenge of requiring extensive training data, as discussed by [12,13], no single method consistently outperforms others across all tests [13]. The need for dataset-specific augmentation strategies is critical; for example, ref. [14] found certain spectrogram augmentations ineffective in enhancing marmoset audio signal classification.
This research emphasizes the effectiveness of audio-based ML systems in UAV detection, offering an economical, scalable, and flexible solution to drone-related challenges. The methodology discusses the neural network architecture, training processes, and augmentation techniques, along with details on significant data collection campaigns vital for training and validation.
The results delve into the impact of various augmentation techniques on classifier performance and assess their real-world utility through an experimental deployment in a varied acoustic landscape, aiming to validate the classifiers’ adaptability and efficiency.
The paper methodically outlines the refinement and assessment of different classifiers, focusing on their unique attributes and performance metrics. This detailed evaluation in real-world scenarios aims to improve UAV detection and classification understanding and applications, providing insights into these systems’ practicality.

2. Materials and Methods

The research methodology emphasizes transparency and reproducibility, making the study’s source code publicly available on GitHub [15]. By sharing both the code and the audio data from the database (refer to Section 2.1), the study provides the tools necessary for replication, fostering an open and collaborative scientific community. This move towards openness ensures methods and results can be independently verified, encouraging a deeper understanding and further development within the academic field.

2.1. Data

The drone classifier’s training data chiefly comes from two major measurement campaigns and a compilation of drone sounds from previous work [10]. Initially, recordings were made in an anechoic chamber to capture high-quality, reflection-free audio from various drones, establishing a baseline for the ML model’s early training phase.
Later, an outdoor experiment conducted at the Fraunhofer IVI test oval in Dresden provided further data. Figure 1, illustrated with an OpenStreetMap graphic, details the drone’s flight path during a session. Microphones, represented by green dots, were placed to collect drone sounds, with the drone’s red trajectory indicating constant altitude flight, appearing continuous due to frequent GPS logging.
The trajectory was intentionally designed to challenge the classifier’s detection capabilities by having the drone initially move to a minimally audible distance and then return. This tested the classifier’s range and its proficiency in discerning drone sounds amidst varying real-world background noises, thus enhancing the system’s robustness and practical deployment readiness.
Finally, the data collection contains drone sounds from other scholars, either by taking them from open repositories like from [6], by reaching out to scholars directly, or by taking them from Youtube. The whole dataset contains sounds from 40 different drones. Table 2 shows the drone models of the audio recordings in the database sorted by origin (free-field measurement, outdoor measurement, and collection) and drone class.
For a comprehensive understanding of the measurement methods and outcomes, we direct readers to [10]. The complete dataset is principally available at https://mobilithek.info/ (accessed on 14 March 2024) by searching for H2 Think [16], but the platform does have certain data management constraints. The data must be downloaded and converted from the platform, with guidance provided in the linked material. After the conversion process, the data can be locally hosted as an SQL database. Alternatively, readers can request a download link from the author where the data has been readily formatted for an SQL database.
For targeted data preparation for training and validation, we employed an SQL query to categorize and retrieve the data from our database (the exact query can be found in [15]). The ’Training’ folder comprised all drone classes from anechoic chamber measurements, organized into subfolders C0, C1, C2, and C3, corresponding to different drone classifications. A ’Validation’ folder contained the remaining drone data. Additionally, a ’no drone’ folder was created with audio files from the database where drones were inaudible. The limited ’no drone’ samples in the database necessitated supplementing the dataset with external sources like YouTube (accessed between February 2023 and April 2023) and https://www.salamisound.de/ (accessed in November 2023), incorporating diverse environmental sounds, such as the following:
  • traffic noise from single vehicles like trains, cars, helicopters, as well as multiple vehicles from streets and crossings;
  • weather sounds like rain and thunder;
  • talking people, from single persons to crowds;
  • animal sounds, especially from birds.
These sounds were used to refine the model’s distinguishing capabilities.
In the training phase, the dataset exclusively comprised data from free-field measurements. Each drone audio file was categorized into one of the drone classes and segmented into 1-second intervals. Initially, the data was randomly assigned to either the training or validation sets in a 50:50 ratio. This specific partitioning was consistently used in all subsequent analyses. In total, the dataset yielded 3279 segments for ‘C0’, 5233 segments for ‘C1’, 6634 segments for ‘C2’, 7301 segments for ‘C3’, and 14,452 segments for ‘no drone’, for both training and validation purposes. This balanced distribution of data segments across classes ensures a comprehensive learning process for the classifier.

2.2. Network and Training

The development of the audio-based drone detection model utilized the VGGish network, a neural architecture tailored for acoustic applications, inspired by the VGGNet design for image classification [17]. This model, adapted for audio, uses 2D convolutional and max-pooling layers to generate a 128-dimensional feature vector, mirroring VGG11’s structure with eight convolutional, five pooling, and three fully connected layers, each employing a 3 × 3 convolution kernel [18]. Pre-trained on the YouTube-8M dataset, VGGish effectively captures diverse audio characteristics, proving valuable for complex audio data analysis and drone sound classification [19,20,21]. It processes Mel-Frequency Cepstral Coefficients (MFCCs) matrices, a format chosen for its efficiency in encapsulating sound characteristics crucial for identifying and classifying drone sounds across varied acoustic environments [18].
The VGGish network’s input layer is designed to process Mel-Frequency Cepstral Coefficients (MFCCs) matrices in a format of 96 × 64 × n, where ‘n’ represents consecutive MFCCs. This format effectively captures essential sound characteristics, aiding in identifying and classifying drone acoustic signatures. MFCCs, widely used in audio signal processing for their compact representation of sound’s spectral envelope, form a significant, manageable dataset for the VGGish network. This facilitates the accurate identification and classification of drone sounds across various settings [22].
In the study, two classifiers were developed to enhance the drone detection system’s efficiency and accuracy. The first classifier differentiates ‘drone’ from ‘no drone’ sounds, while the second categorizes drone sounds into one of four classes (C0, C1, C2, and C3). This dual-classifier strategy improves robustness by focusing on the subtle differences between drone classes after excluding ‘no drone’ sounds. It also increases operational efficiency by using a cascaded approach where the presence of drones is first detected, and then their category is determined. This is especially effective for energy-efficient deployment, potentially incorporating neuromorphic technology like for SynSense’s Xylo [23] low-power binary classification. Detecting a drone could then activate a more power-intensive unit for detailed classification and communication.
To enhance the model, consistent training parameters were upheld across all studies, utilizing Stochastic Gradient Descent with Momentum (sgdm) for optimization. This method effectively balanced convergence rate and model accuracy, with a learning rate starting at 0.001 and reducing by a factor of 0.1 every three epochs to prevent overfitting and refine learning. Training involved batches of 256 samples, limited to 12 epochs to ensure efficient, comprehensive learning without overburdening computational resources. All augmentations were applied to the original data before training and saved separately to reuse this exact augmented dataset for training if needed. Conducted on a Lenovo ThinkPad with an 11th Gen Intel(R) Core(TM) i7 CPU, 32 GB RAM, and NVIDIA T500 graphics (4 GB RAM), the process aimed not to exceed 2 h, achieving consistent accuracy after 4 to 5 epochs. Classification tasks utilized the same setup, optimized for speed and accuracy within computational limits, ensuring a balance between performance and efficiency.

2.3. Augmentation Techniques and Data Preparation

To enhance the drone sound classification model’s robustness, several audio augmentation techniques were investigated, including pitch shifting, adding delay, introducing harmonic distortions, and mixing in background noise. The following methods simulate real-world acoustic variations, preparing the model for effective operation under diverse conditions:
1.
Harmonic Distortion. Adding harmonic distortions simulates the effect of sound traveling through different media. This technique challenges the model to maintain accuracy in complex acoustic landscapes.
2.
Environmental Noise. Integrating ambient noises from various environments with drone sounds trains the model to effectively differentiate drone sounds from background noise in real-world situations.
3.
Pitch Shifting. Altering the pitch of drone sounds without changing the playback speed simulates variations in drone motor speeds.
4.
Delay. Adding a time delay, varied in length and amplitude, to original sound, mimics echo effects in various environments, enhancing the model’s adaptability to different acoustic settings.
The augmentation techniques were applied solely to the training data, not the validation data, adhering to the principle that augmented data might not reflect realistic scenarios accurately or might introduce alteration artifacts [24]. This strategy ensures the model is trained on a diverse dataset but evaluated on unaltered, real-world data for a realistic performance assessment.
During the data preparation phase for drone detection, audio data was initially segmented into one-second chunks based on recommendations from [6], suggesting that one-second clips are ideal for drone detection. To ensure only relevant data was used, a pre-classification step removed segments without drone sounds, using the harmonic-to-noise ratio for effective isolation of drone noises from minimal background sounds. Additionally, audio chunks were normalized to 90% amplitude to reduce volume variation effects, and a bandpass filter was applied to limit the frequency range to 100–20,000 Hz, improving signal quality and enhancing the model’s identification and categorization capabilities.

3. Results

3.1. ‘Drone’ vs. ‘No Drone’ Classification

First, a classifier for distinguishing between ‘Drone’ and ‘no Drone’ was trained. Augmentation techniques such as pitching, delay, and harmonic distortions were applied to the training data, aiming to enhance the classifier’s adaptability while preserving sound integrity. The ‘Drone’ vs. ‘no Drone’ classifier achieved a drone detection accuracy of 99.1% and a non-drone detection accuracy of 97.2%, indicating a reliable ability to distinguish between drone and non-drone acoustic signatures. Despite this success, the augmentation parameters were considered preliminary, with room for further optimization to improve classifier performance, especially in challenging acoustic environments. This phase of the study highlighted the classifier’s robust performance and established a foundation for future enhancements.

3.2. Drone Class Classification without Augmentation

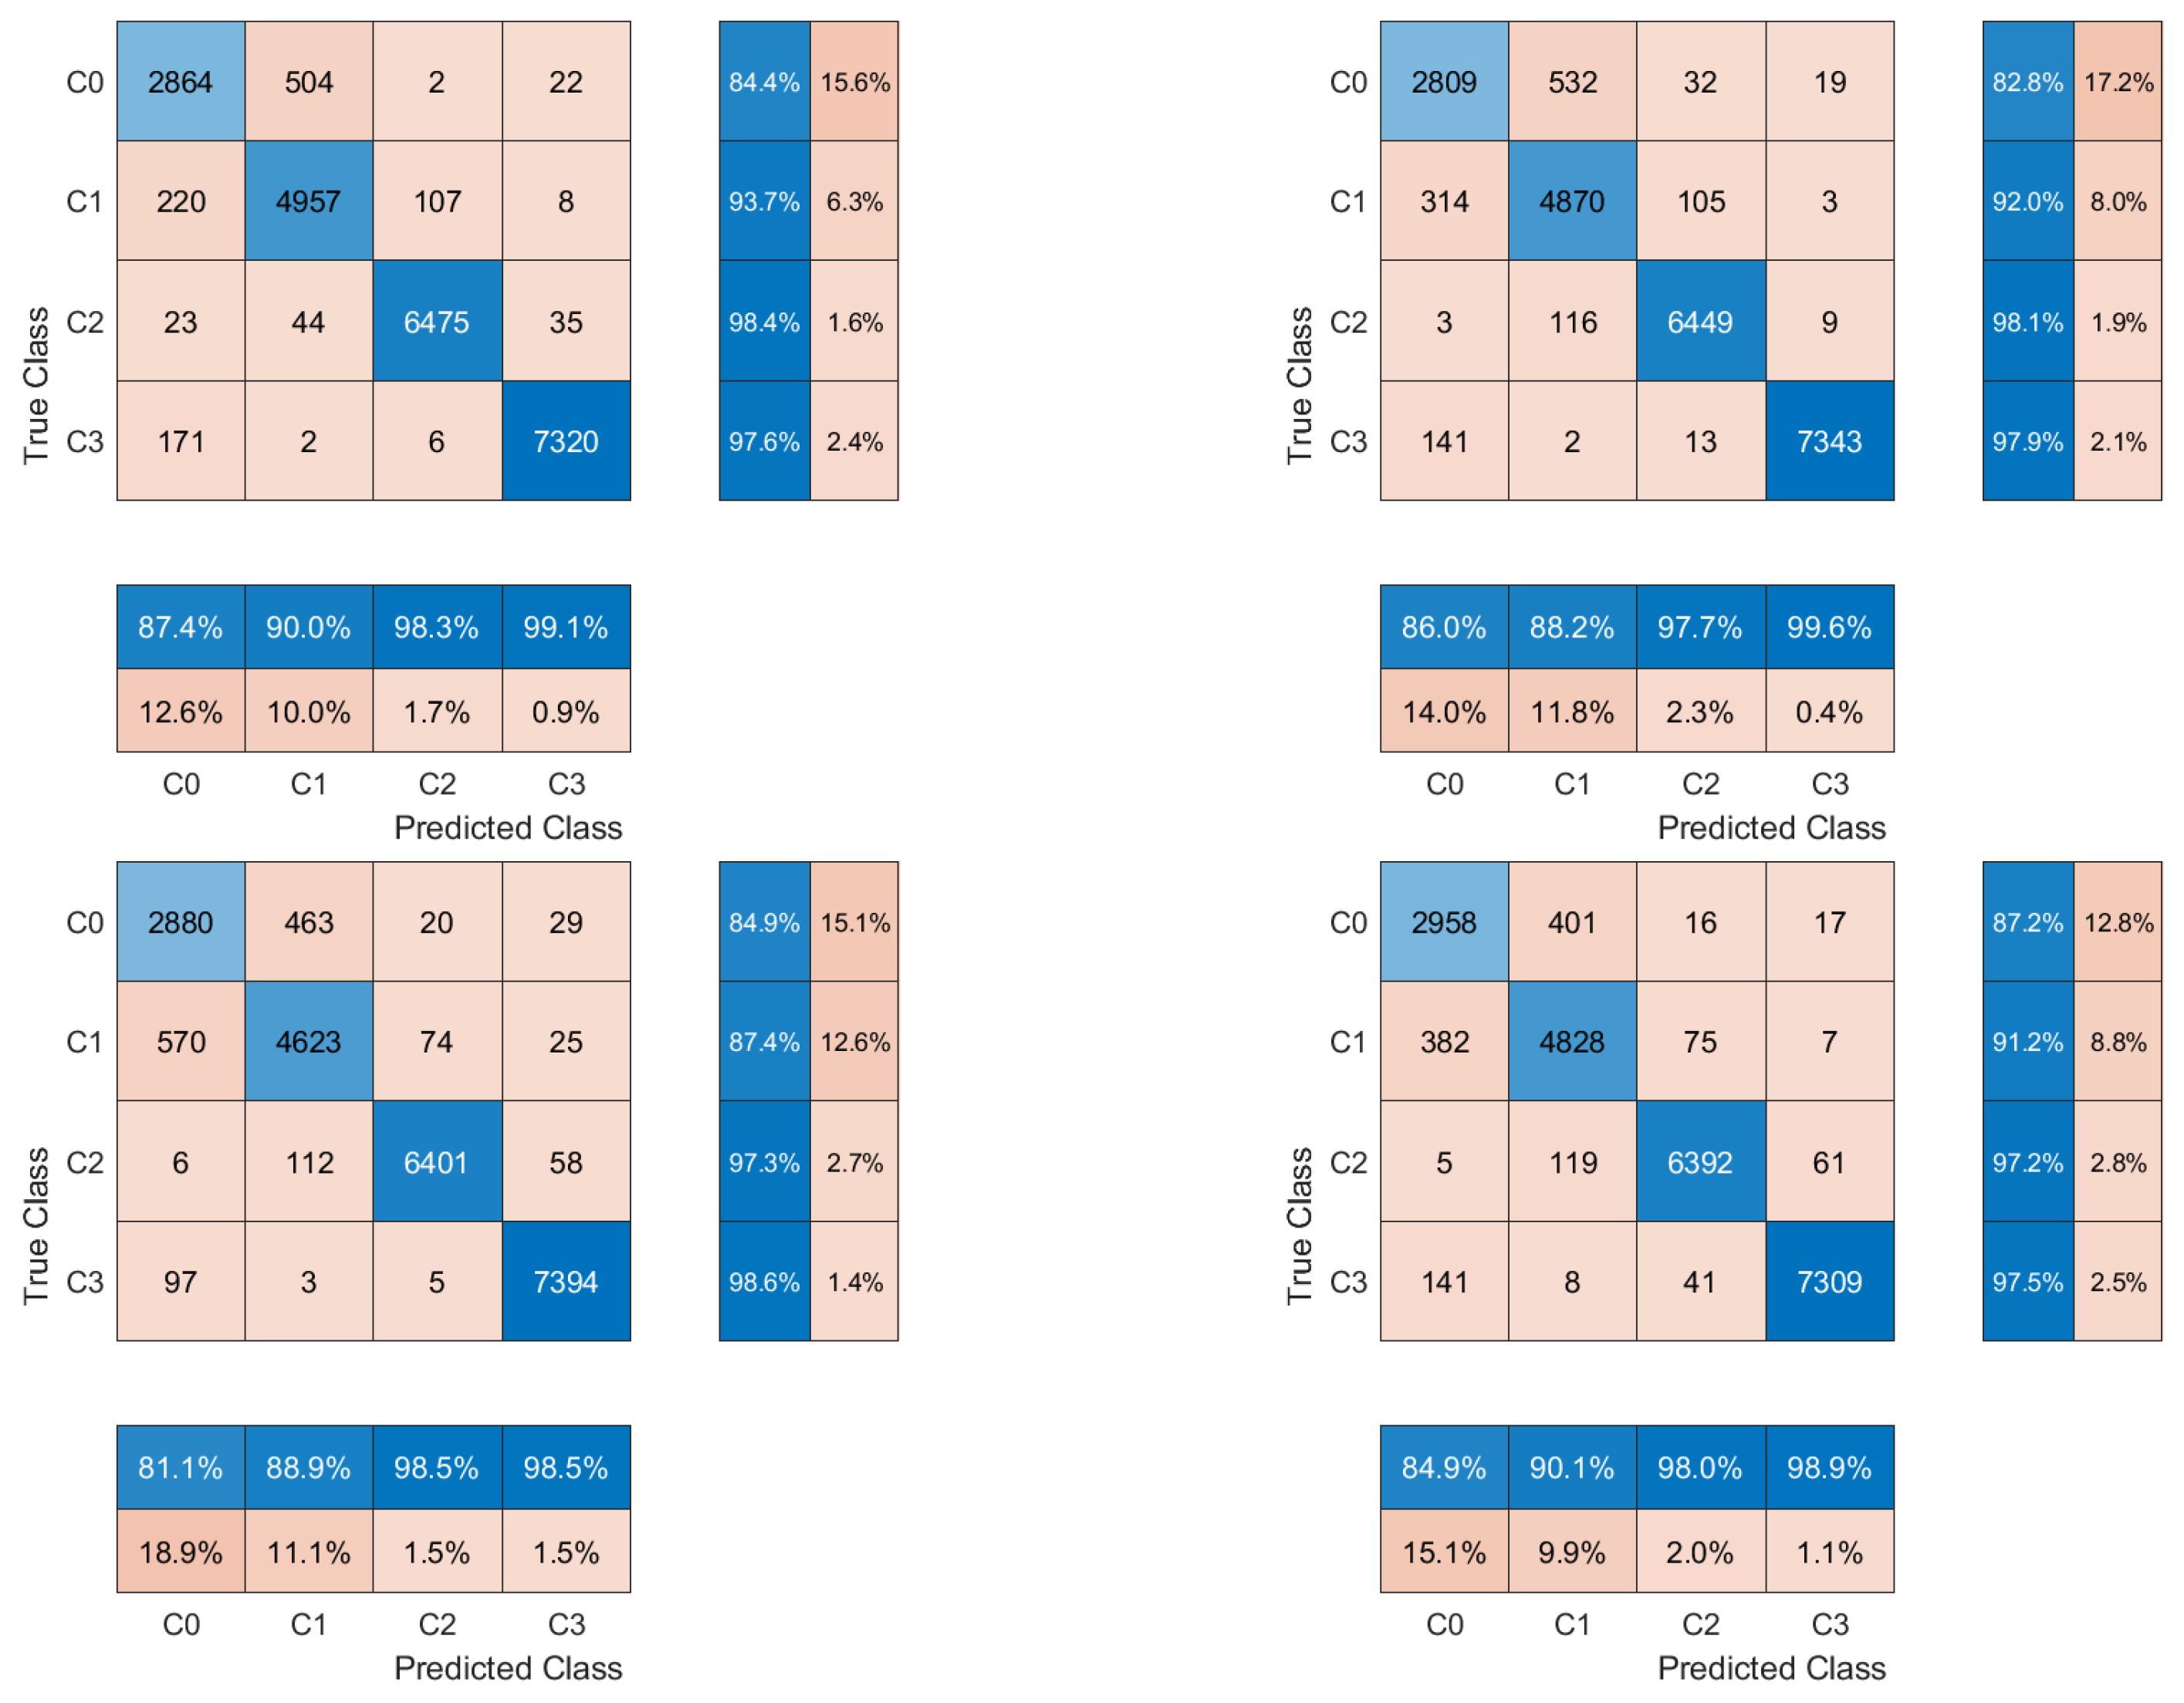
To establish a baseline for drone sound classification, four distinct classifiers were trained without data augmentation techniques under seemingly identical conditions. Despite using the same script for each run, significant outcome variations were observed across classifiers. Confusion matrices in Figure 2 illustrate these differences, with the accuracy for correctly classifying C0 drones fluctuating between 82.8% and 87.2% and C1 drones between 87.4% and 93.7%. Variations were also notable in the more nuanced classifications of C2 and C3 categories.
The observed inconsistencies in classifier outcomes are attributed to the stochastic nature of ML model training processes, including random weight initialization and inherent probabilistic elements in learning algorithms. These variabilities significantly impact ML models’ performance and generalization capabilities. The baseline experiment without data augmentation highlights the importance of considering these stochastic processes during model training, which can cause notable performance variability, even with identical setups. This underscores the necessity for meticulous experimental design, such as using fixed seeds for random number generators, to ensure reproducibility and reliability in ML research.
Table 3 summarizes the performance of sixteen classifiers, divided into four groups with four classifiers each, trained under identical conditions without data augmentation. These groups are differentiated by the random seed initialization used: no seed, seed initialized to 1, seed initialized to 2, and seed initialized to 3. The classifiers within each seed group were trained to assess the impact of controlled initial conditions on the consistency of performance metrics.
The group without seed initialization showed significant variability in performance, with the standard deviation of accuracy across classes (C0 to C3), averaging 1.2% for prediction and 1.0% for recall. This reflects the stochastic influence on classifiers when random processes are not controlled. In contrast, the seeded groups exhibited more consistency, with standard deviations in accuracy reduced to around 1.0% maximum and 0.5% minimum.
Although only four classifiers were trained per seed, which may be considered a limited sample for statistical robustness, the results demonstrate a clear trend. Classifiers with controlled seed initialization yielded more consistent accuracies, suggesting that non-random weight initialization can lead to more reliable classification results. The observed trend, despite the small sample size, underscores the potential influence of controlled initial conditions on model performance. Further research with a larger number of classifiers per seed could provide additional insights into the effects of weight initialization on classifier performance.
The analysis of these outcomes highlights the necessity for careful consideration of initialization processes in ML classifiers, acknowledging the balance between random variability and the quest for replicable results. It is generally important to use randomness in ML to provide the best stability and robustness for the most of neural networks. For the purpose of investigating the influence of several adjustments like augmentations on general performance, however, fixed seed augmentation could reduce noise and increase the comparability.
The performance of the first drone classifier, with seed 1, as detailed in Table 3, was evaluated by classifying a C3 drone (HP-X4 2020) from an outdoor experiment. The outcomes of this real-world application are depicted in Figure 3.
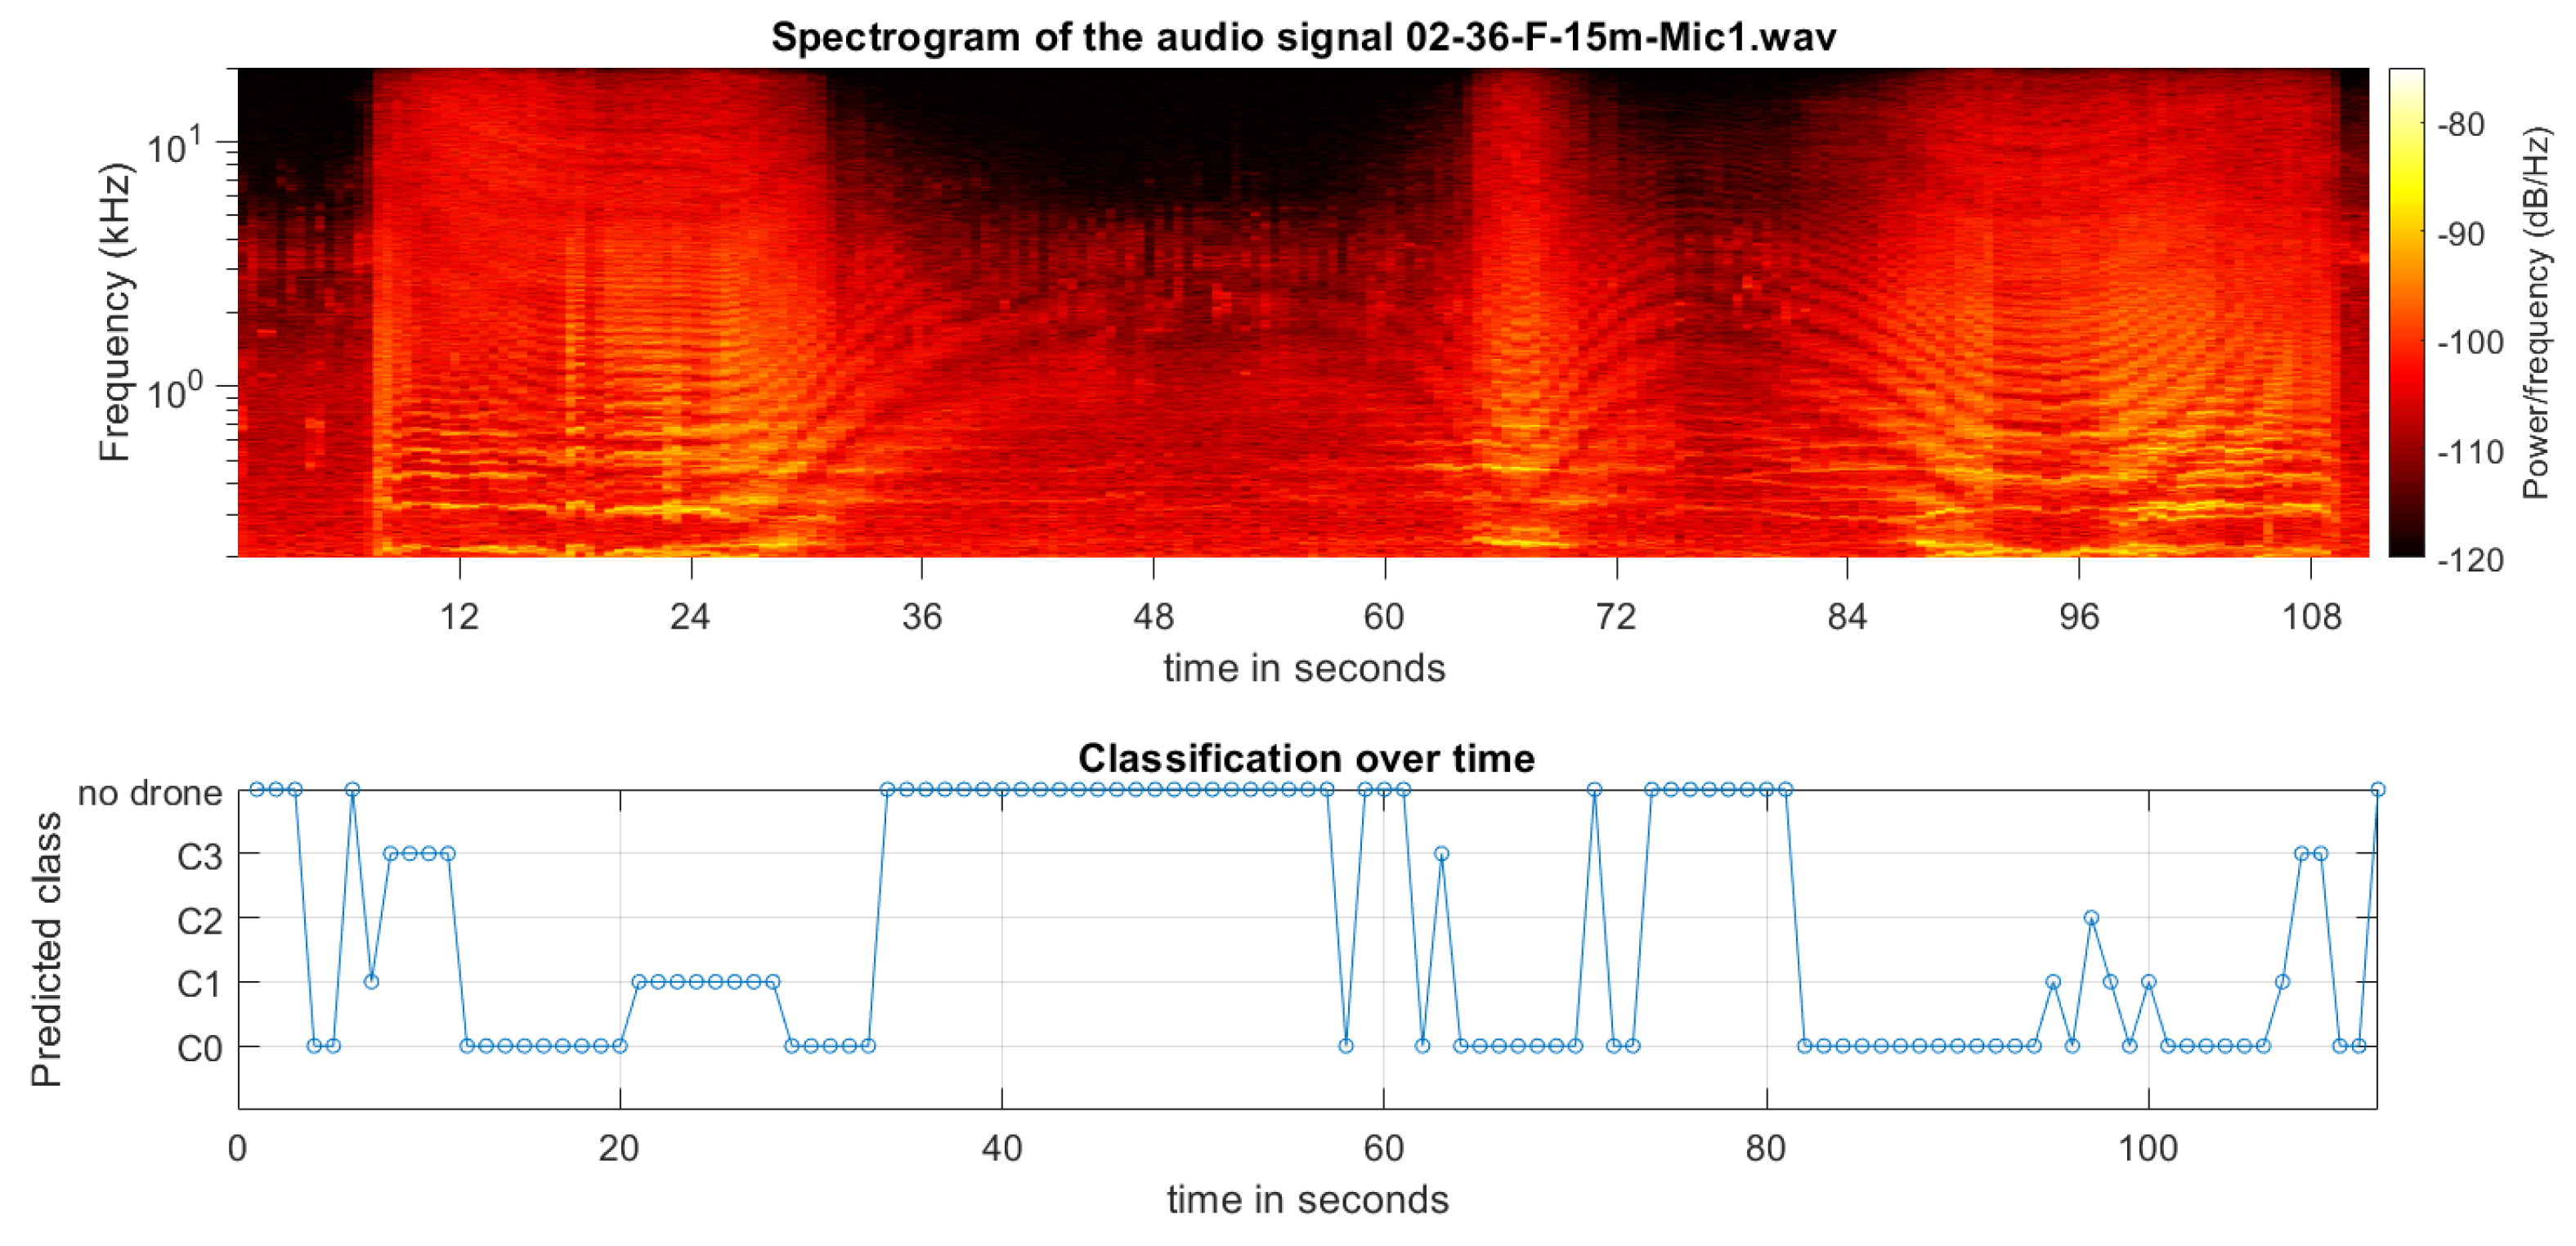
The spectrogram in the upper section of Figure 3 clearly illustrates a typical acoustic footprint of the drone’s activity. The typical acoustic spectrum of a drone is characterized by a distinctive pattern of harmonics across mid to high frequencies, often with peaks in lower frequencies generated by the rotors and motors. The drone initiated movement at around 7.5 s, with a stationary phase until approximately 25.5 s, and subsequently moved away from the microphone. Its farthest distance from the microphone, where the acoustic signature is weakest, was reached at around 52 s before it began its return journey. The drone passed directly overhead at 66.5 s and finally landed at 109 s.
The classifier’s temporal predictions, depicted in the bottom panel, segmented the audio signal into one-second intervals for classification. Although the classifier consistently identified drone presence, it erroneously classified them as C0 drones in 72.1% of detections, accurately recognizing them as C3 drones in only 9.9% of instances. Detection did not occur before the drone’s takeoff when distant, or after landing, highlighting significant misclassification likely influenced by environmental factors. The classifier, trained with noise from an anechoic chamber, struggled against real-world environmental variations like reflections and ambient sounds, underscoring the necessity for appropriate augmentation for generalization.
It is noteworthy that the ‘Drone’ vs. ‘No Drone’ classifier’s performance was not particularly impressive, for instance in the time frame of 74 to 81 s where the drone’s presence can unmistakably seen in the spectrogram. However, given the study’s focus on augmentation techniques, this initial classifier was continuously used to ensure comparability across different augmentation methods.

3.3. Augmentations

3.3.1. Harmonic Distortions

The study investigated the impact of harmonic distortions on drone classification accuracy by varying distortion levels from 0% (no augmentation) to 63%, with 7% increments, based on preliminary findings that showed a decline in performance beyond 50% distortion. This approach allowed for a detailed exploration within a manageable framework, training approximately 10 classifiers for each augmentation level. The findings, summarized in Table 4, indicated that slight to moderate distortions, particularly between 7% and 14%, could enhance accuracy. Such levels of distortion may mimic the variety of sound qualities UAVs produce under different operational conditions, thereby potentially increasing the model’s adaptability to real-world situations.
The study discovered that increasing harmonic distortion levels initially boosted drone classification accuracy, peaking between 7% and 14%. This suggests that moderate levels of distortion more closely mimic the real-world acoustic conditions drones encounter, thus improving the model’s generalization from the augmented training data. Importantly, augmentation was applied solely to the training data, not the validation set, to ensure the model was evaluated against unaltered, real-world data for an accurate capability assessment. Beyond the optimal distortion range, accuracy decreased, indicating that excessive distortion introduces noise, hindering correct classification. This finding emphasizes the necessity for a balanced harmonic distortion application to preserve classification integrity.
However, the investigation into the optimal distortion range’s impact on outdoor experiments did not yield a significant performance improvement. This outcome, while not presented due to the lack of substantial enhancement, underscores the challenge of applying controlled environment improvements to outdoor scenarios. It emphasizes the complexities involved in acoustic drone classification under real-world conditions and underscores the critical importance of comprehensive model validation strategies.

3.3.2. Environmental Noise

A rigorous investigation of the effects of environmental noise augmentation on training data was conducted, with the aim of determining the impact of different noise intensities on the classifier’s accuracy. The levels of noise introduced varied from 0% to 72%. This specific range and increment step were informed by preliminary studies, which demonstrated a clear degradation in classifier performance with noise augmentations exceeding 50%. To cover the critical range effectively, we employed incremental steps of 8%, allowing us to train 10 classifiers for each augmentation technique, and explore the impact of different noise intensities on classification accuracy comprehensively. The results summarized in Table 5 indicate that the incorporation of noise generally results in a decrease in classification accuracy. This finding is consistent with the discussion in the methods section, which focused on the selective application of augmentation to training data. It is based on the understanding that augmented data may not always accurately replicate real-world conditions [24].
The classifier performance remained stable up to 32% noise, suggesting that controlled noise might enhance real-world robustness. Beyond this, accuracy dropped significantly, especially above 40%. Figure 4 shows that applying 24% noise (blue circles) improved the C3 drone classification of the above-mentioned example to 29.7%, a significant increase over the non-augmented scenario (black dots) in Section 3.2. With 32% noise (red crosses), correct classifications still occurred in 25.1% of instances.
The increase in classification accuracy observed at higher noise levels is intuitive, reflecting the outdoor measurement conditions layered with background noises. This contrasts with the anechoic chamber’s measurements, which lack such ambient sounds and served as the basis for training data. The incorporation of environmental noise through augmentation closely mirrors actual conditions, emphasizing the relevance of the validation methodology described in the methods section. Augmentation was applied exclusively to the training data to keep the validation set realistic and free from potential bias-inducing artifacts [24]. This cautious approach ensured the evaluation of classifier performance using unaltered, real-world data, leading to a more accurate determination of their effectiveness.

3.3.3. Pitch Shifting

The assessment of how pitch augmentation affects classifier performance was done by altering the maxPitch parameter, which defines the pitch change limits for each audio segment from −maxPitch to +maxPitch semitones, with 0 indicating no change. This parameter ranged from 0 to 2.5 semitones. The results, detailed in Table 6, revealed varied impacts on performance. An analysis was conducted on how pitch affects accuracy for different drone categories.
The investigation into pitch augmentation’s effect on classifier accuracy revealed complex outcomes. The analysis, as shown in Table 6, indicates that minor pitch adjustments, up to +/−0.4 semitones, have minimal impact on precision. In contrast, larger alterations lead to reduced accuracies, while the choice of augmentation level, specifically the augmentation by +/−1.4 semitones for the outdoor drone model ‘HP-X4 2020’, might appear contradictory given its performance in Table 6; this decision was grounded in a comprehensive examination of the augmentation effects across all classifiers on real-world examples. It was observed that, despite the seemingly counterintuitive selection based on Table 6’s data, augmenting the pitch by +/−1.4 semitones significantly improved classification accuracy by up to 40%, as depicted in Figure 5. This substantial improvement, illustrated with blue circles, contrasts sharply with the 9.9% accuracy (represented by black dots) observed without augmentation, as previously noted in Section 3.2. Augmentations beyond +/−1.4 semitones further demonstrated substantial accuracy enhancements compared to scenarios without augmentation. This strategic selection, thus, was based on detailed assessments of augmentations’ impacts, identifying +/−1.4 semitones as the most effective for enhancing classifier performance in real-world settings (for this particular example), underscoring the broader applicability and importance of pitch augmentation.
Acknowledging the reliance on accuracy metrics from training, where augmented values were compared with non-augmented ones from identical measurements, reveals a methodological limitation in evaluating the augmentation technique’s efficacy. This shortfall highlights the need for broader assessments of augmentation strategies, particularly pitch adjustments, to accurately gauge their benefits and constraints in enhancing drone sound classification under diverse real-world scenarios.

3.3.4. Delays

The study’s investigation into the effects of introducing audio delays of 15 ms to 27 ms, with amplitudes varying from 30% to 90%, aimed to mimic real-world acoustic phenomena like echoes and ground reflections. However, no specific trend was observed in classification accuracy across different delay levels, suggesting minimal impact, possibly due to noise rather than a systematic influence on performance.
The analysis of delay augmentation is uniquely dependent on the specific measurement context, including the microphone–drone relative positions and surface reflectivity. Real-world conditions can produce time differences between the direct signal and its reflection of up to 30 ms, with amplitude variations based on the reflection coefficient of surfaces. This highlights the importance of incorporating a broad spectrum of delay variability to accurately reflect real-world scenarios.
Figure 6 presents the classification performance over time for the ’HP-X4 2020’ drone, comparing non-augmented (black dots) and random delay-augmented (blue dots) scenarios. This augmentation significantly improved accuracy from 9.9% without augmentation to 27.3% with random delay augmentation. Such an enhancement underscores the critical need to simulate a wide array of delay variations, closely resembling the acoustic reflection conditions found in real-world environments. This finding advocates for random delay augmentation as an effective strategy to increase the robustness of classification systems in settings with prevalent echoes and reflections.

4. Discussion

4.1. Interpretation of Findings

This section distills the study’s insights into developing an advanced drone classification system leveraging acoustic signatures and data augmentation techniques:
  • Influence of Random Processes in Model Training. Highlighting the significant impact of random processes, such as weight initialization, on training results. Utilizing a fixed seed for random number generation is shown to reduce variability in ML model outcomes, leading to more reliable and reproducible results. This underscores the importance of controlling random initialization effects in ML experiments, with the use of fixed seeds recommended for consistent ML model performance. It is noteworthy, that this is a worthful approch for comparison purposes, but it should not be a general approach in ML, since random weight initialization is important to avoid of reaching the worst position of weights (local minima or plateau).
  • Impact of Data Augmentation. The results demonstrate how various data augmentation techniques, including pitch shifting, time delay, harmonic distortion, and ambient noise, enhance classifier performance. Each method affects drone detection differently and should be tailored to the dataset.
  • Harmonic Distortion. Though intended to simulate sound travel through different mediums for improved complex environment accuracy, introducing harmonic distortions yielded only minimal classification accuracy improvements.
  • Inclusion of Ambient Noise. Introducing ambient noise is critical for improving model performance in distinguishing drone sounds among daily noises, up to an optimal level, beyond which performance decreases.
  • Pitch Shifting. Pitch adjustment within a specific range significantly improved the system’s adaptability to drone motor sound variations, while training accuracies offered limited insights, an outdoor drone case study revealed notable accuracy improvements at higher pitch levels.
  • Time Delay and Echo Effects. Implementing time delays to replicate echo effects in diverse environments improved the model’s adaptability to different acoustic conditions. Experiments showed the complexity of simulating real-world echo conditions, with a broad range of delay parameters essential for capturing the variety of real-world echo scenarios.
Overall, this study illustrates the effectiveness of acoustic data augmentation in improving ML systems for drone detection. It offers key insights for creating efficient UAV detection systems applicable in multiple security and management scenarios. Specifically, investigating random delay and amplitude variation highlights the importance of accommodating a broad range of real acoustic conditions to enhance drone classification accuracy.

4.2. Theoretical and Practical Implications

This research significantly advances UAV detection technology. Incorporating 40 drone models into a comprehensive database lays a solid groundwork for ML algorithm development and training in drone detection. The classifier’s ability to identify and classify drones into EU-defined classes C0 to C3 showcases its practical utility. Moreover, the study emphasizes the classifier’s potential adaptability across diverse operational environments, highlighting its broad applicability.
Training with outdoor audio data inherently includes scene-specific elements like reflections, ambient noise, and environmental factors. Even recordings in still conditions on open, flat areas capture ground reflections, varying with the ground’s properties and drone–microphone positions. In contrast, free-field data from anechoic chambers, augmented to simulate various scenarios, enable a controlled, diverse training dataset. This prepares the model for real-world acoustic unpredictability.
The theoretical and practical flexibility in augmentation bears substantial implications. Theoretically, it refines our understanding of environmental factors’ effects on acoustic signal processing and classification in ML models. Practically, it offers a methodology to boost detection systems’ adaptability, ensuring efficacy across diverse real-world conditions. Systematically augmenting clean, free-field data to simulate different scenarios broadens the classifier’s exposure to potential real-world acoustic signatures, enhancing its operational readiness.

4.3. Limitations and Challenges

The work on UAV detection using ML presented in this paper is characterized by specific limitations and challenges, evident both in the experimental results and within the context of the cited literature. A principal limitation, as highlighted in [12], is the inherent variability of ML model performances, even with the use of identical parameter settings. This variability is attributed to random processes in initialization and learning algorithms, emphasizing the necessity for meticulous validation and robust design in model development to achieve consistent and reliable classification results.
A significant limitation and the biggest weakness of this study is presented by the close relationship between the validation and training data sets. Despite the decision, based on guidance from [24], not to apply augmentation techniques to the validation data, the fact that these data are derived from the same set of measurements as the training data introduces a risk of overfitting. This strategy aligns with the understanding that augmented data may not accurately represent realistic scenarios or could introduce alteration artifacts [24]. However, it could result in classifiers being unduly tuned to the characteristics of the training environment. This may lead to an overestimation of their efficacy in real-world applications due to their familiarity with the data. This aspect is crucial, as it could compromise the classifiers’ ability to generalize to new, unseen data, which is a vital criterion for real-world applications.
Moreover, this study’s exclusivity in employing the VGGish model as the sole network for investigation marks a significant limitation. The dependence of acoustic augmentation methods on the algorithm suggests that the model choice likely influences robustness in drone sound classification. Future research should encompass comparisons across various models to comprehensively understand model-dependent performance variations and enhance classifier adaptability to diverse acoustic scenarios.
Furthermore, the adaptability of the classifier to real-world scenarios, characterized by acoustic diversity, remains a challenge. Despite the extensive database [10] and sophisticated augmentation techniques, the accurate classification of drone sounds in dynamic environments proves difficult. Studies such as [5,6,7,8] confirm the complexity of distinguishing drones against various background noises and conditions.
An additional aspect that must be contemplated is the possibility that classification into distinct drone classes based solely on acoustic signatures may not be entirely feasible. Drone noises primarily originate from rotors, with rotor type changes significantly altering the drone’s acoustic footprint. For instance, FFT analyses pre and post rotor change in a Phantom 4 RTK showed similar patterns but noticeable differences with Rotor 2, including harmonics shifting to lower frequencies and a decrease at higher frequencies (see Figure 7). Comparatively, a different C2 drone (DJI Mavic 3e) exhibited a more distinct acoustic fingerprint change, while different drone types can be distinguished irrespective of rotor changes, generalizing acoustic fingerprints by drone classes poses challenges and warrants further investigation.

4.4. Future Research

Future research in UAV detection using ML should prioritize refining the dataset for enhanced real-world applicability, particularly by incorporating outdoor data as validation data in the training process. This approach addresses the challenge of preparing recordings to serve as representative validation data, utilizing the ‘Drone’ vs. ‘No Drone’ classifier for preprocessing to identify relevant validation segments effectively. The benefits of this strategy include more realistic validation, improved data quality, efficiency in data preparation, and insights for model improvements against environmental noises and variable factors.
Simultaneously, a systematic examination of drone-specific features remains crucial. Investigating a wide range of time-domain, frequency-domain, Cepstral-domain, and image-based features may reveal distinctive acoustic signatures of different drone classes, significantly advancing the precision and reliability of drone classification systems. A comprehensive overview of various features can be found in [25].
Moreover, future work should continue exploring the impact of multiple reflections on drone sound classification, addressing the complexity of simulating real-world echo conditions. This research could involve simulating various reflective conditions, from simple two-surface reflections to complex hall-like reverberations, to assess their impact on classifier accuracy.
The methodological revision to use augnemnted free-field data for training and pure outdoor data as validation in the training process underscores the necessity of a nuanced approach that enhances the generalizability and reliability of models in complex environments. This foundational shift, coupled with ongoing explorations in feature analysis, presents a comprehensive strategy for advancing the accuracy and reliability of drone detection systems in diverse operational environments.
Furthermore, future evaluations should consider the relationship between classification results and the drone’s distance from the microphones, exploring the operational limits of classifiers in terms of detection range and the impact of loudness levels on classification accuracy. This multi-faceted approach to future research will pave the way for developing more advanced models, capable of operating effectively across a variety of environmental conditions and meeting the challenges of drone detection with robust, adaptable solutions.

5. Conclusions

In the study “Sound of Surveillance: Enhancing ML-Driven Drone Detection with Advanced Acoustic Augmentation,” a comprehensive exploration is presented into the application of advanced acoustic data augmentation techniques for improving the performance of ML systems in drone detection. The key conclusions drawn from the research are as follows:
  • Effectiveness of Data Augmentation. Various data augmentation techniques, such as pitch shifting, time delay, harmonic distortion, and ambient noise incorporation, have been demonstrated to significantly enhance the classifier’s accuracy. These techniques have been shown to enable the system to adapt to diverse acoustic environments, effectively identifying and categorizing drone sounds amidst a variety of background noises.
  • Optimization of Augmentation Techniques. The study’s findings indicate varied effects of different augmentation techniques on drone sound detection. Specifically, pitch adjustments demonstrated ambivalent outcomes, with significant improvements in classification accuracy for a C3 drone in outdoor measurements at +/−1.4 semitones, underscoring the importance of pitch shifting in augmentation. However, harmonic distortions did not show notable enhancements, and training process accuracies did not provide clear conclusions. Introducing time delays and ambient noises at controlled levels, on the other hand, contributed to the model’s robustness and adaptability.
  • Classifier Performance and Reproducibility. The research highlighted the critical role of random processes in ML model training. Variability in the performance of classifiers, even under identical parameter settings, underscores the importance of ensuring consistent initialization of initial weights and the selection of mini-batches. Future research should prioritize standardizing these aspects to achieve more reliable and reproducible outcomes.
  • Practical Applicability and Future Directions. While the current ML-based classifier demonstrates significant potential in security and airspace management, complying with EU drone categorization regulations, further refinement is required for optimal performance in classifying drone categories. General drone detection using ML has proven effective, yet precise categorization of drones into specific classes as per EU standards demands additional research. Future studies should focus on exploring advanced optimization algorithms and experimenting with diverse parameter combinations. This exploration will be critical for enhancing the accuracy of drone noise classification systems, particularly in accurately identifying and classifying drones into distinct regulatory categories. Continued research in this direction will not only improve the reliability of drone detection systems but also ensure their compliance with evolving regulatory frameworks, thereby bolstering their practical applicability in various real-world scenarios.
  • Contribution to UAV Detection Technology. Significant contributions have been made to the field of UAV detection technology through this research. The establishment of a comprehensive database encompassing 40 different drone models provides a solid foundation for the continued development and training of ML algorithms in this domain. The demonstrated capability to classify drones into distinct categories (C0 to C3) in accordance with EU regulations underlines the practical applicability and relevance of the system in meeting both current and emerging requirements in drone security.
In summary, this study offers valuable insights into the development of effective UAV detection and classification systems, leveraging sophisticated acoustic data augmentation techniques. It lays a foundation for future research and advancements in this field, aimed at enhancing security and management capabilities in response to the growing use of drones.

Funding

This research, part of the project “AuDroK” with grant number 19F1131A, was funded by the Federal Ministry of Digital and Transport of the Federal Republic of Germany under the mFund mechanism from 1 January 2023 to 31 December 2023 (https://bmdv.bund.de/DE/Themen/Digitales/mFund/Ueberblick/ueberblick.html (accessed on 14 March 2024)), covering 80% of the project costs. The remainder was financed from internal resources.

Data Availability Statement

This study has developed a comprehensive database of classified acoustic drone recordings, in alignment with EU drone regulations [11], accessible at [10] https://mobilithek.info/offers/605778370199691264 (accessed on 14 March 2024). Additionally, the source code for the algorithms used in this research is available and can be referenced at [10].

Acknowledgments

Special acknowledgment is given to Ernst Swanepoel (swanepoel@h2think.org) for creating Figure 1 and their significant role in conducting the measurement campaigns. Furthermore, gratitude is extended to Lothar Paul from H2 Think for their essential work in establishing the drone sound database, as referenced in [10], while their contributions were invaluable to the project, it was decided that they would not be included in the authorship of this paper, in line with the authorship guidelines that limit inclusion to those who have contributed substantially to the work reported (as per https://www.mdpi.com/data/contributor-role-instruction.pdf, CRediT taxonomy).

Conflicts of Interest

The author declares no conflicts of interest. The funders had no role in the design of the study; in the collection, analyses, or interpretation of data; in the writing of the manuscript; or in the decision to publish the results. The auther was employed by the non-profit organisation H2 Think gGmbH.

Abbreviations

The following abbreviations are used in this manuscript:
EUEuropean Union
FFTFast Fourier Transform
MFCCMel-Frequency Cepstral Coefficients
MLMachine Learning
UAVUnmanned Aerial Vehicles

References

  1. Gatwick Airport Drone Attack: Police Have ‘No Lines of Inquiry’. BBC News, 27 September 2019. Available online: https://www.bbc.com/news/uk-england-sussex-49846450(accessed on 2 January 2024).
  2. Knoedler, B.; Zemmari, R.; Koch, W. On the detection of small UAV using a GSM passive coherent location system. In Proceedings of the 17th International Radar Symposium (IRS), Krakow, Poland, 10–12 May 2016. [Google Scholar]
  3. Nguyen, P.; Ravindranatha, M.; Nguyen, A.; Han, R.; Vu, T. Investigating Cost-effective RF-based Detection of Drones. In Proceedings of the 2nd Workshop on Micro Aerial Vehicle Networks, Systems, and Applications for Civilian Use, Singapore, 26 June 2016. [Google Scholar]
  4. Shi, X.; Yang, C.; Xie, W.; Liang, C.; Shi, Z.; Chen, J. Anti-Drone System with Multiple Surveillance Technologies: Architecture, Implementation, and Challenges. IEEE Commun. Mag. 2018, 56, 68–74. [Google Scholar] [CrossRef]
  5. Utebayeva, D.; Ilipbayeva, L.; Matson, E.T. Practical Study of Recurrent Neural Networks for Efficient Real-Time Drone Sound Detection: A Review. Drones 2022, 7, 26. [Google Scholar] [CrossRef]
  6. Al-Emadi, S.; Al-Ali, A.; Al-Ali, A. Audio-Based Drone Detection and Identification Using Deep Learning Techniques with Dataset Enhancement through Generative Adversarial Networks. Sensors 2021, 21, 4953. [Google Scholar] [CrossRef] [PubMed]
  7. Dumitrescu, C.; Minea, M.; Costea, I.M.; Cosmin Chiva, I.; Semenescu, A. Development of an Acoustic System for UAV Detection. Sensors 2020, 20, 4953. [Google Scholar] [CrossRef] [PubMed]
  8. Jeon, S.; Shin, J.-W.; Lee, Y.-J.; Kim, W.-H.; Kwon, Y.-H.; Yang, H.-Y. Empirical Study of Drone Sound Detection in Real-Life Environment with Deep Neural Networks. arXiv 2017, arXiv:1701.05779. [Google Scholar]
  9. Park, S.; Kim, H.-T.; Lee, S.; Joo, H.; Kim, H. Survey on Anti-Drone Systems: Components, Designs, and Challenges. IEEE Access 2021, 9, 42635–42659. [Google Scholar] [CrossRef]
  10. Kümmritz, S.; Paul, L. Comprehensive Database of Drone Sounds for Machine Learning. In Proceedings of the 10th Convention of the European Acoustics Association Forum Acusticum, Turino, Italy, 11–15 September 2023; pp. 667–674. [Google Scholar]
  11. Easy Access Rules for Unmanned Aircraft Systems (Regulations (EU) 2019/947 and 2019/945). Available online: https://www.easa.europa.eu/en/document-library/easy-access-rules/easy-access-rules-unmanned-aircraft-systems-regulations-eu (accessed on 5 January 2024).
  12. Marcus, G. Deep Learning: A Critical Appraisal. arXiv 2018, arXiv:1801.00631. [Google Scholar]
  13. Nanni, L.; Maguolo, G.; Paci, M. Data augmentation approaches for improving animal audio classification. Ecol. Inform. 2020, 57, 101084. [Google Scholar] [CrossRef]
  14. Oikarinen, T.; Srinivasan, K.; Meisner, O.; Hyman, J.B.; Parmar, S.; Fanucci-Kiss, A.; Desimone, R.; Landman, R.; Feng, G. Deep convolutional network for animal sound classification and source attribution using dual audio recordings. J. Acoust. Soc. Am. 2019, 145, 654–662. [Google Scholar] [CrossRef] [PubMed]
  15. GitHub Repository, H2 Think gGmbH, DroneClassifier. Available online: https://github.com/H2ThinkResearchInstitute/DroneClassifier (accessed on 5 January 2024).
  16. Dron Data Base on Mobilithek.de. Available online: https://mobilithek.info/offers?searchString=%22H2%20Think%22&providers=%5B%22H2Think%20gGmbH%22%5D (accessed on 3 March 2024).
  17. GitHub Repository, Tensorflow, Models, Vggish. Available online: https://github.com/tensorflow/models/tree/master/research/audioset/vggish (accessed on 3 January 2024).
  18. Di, N.; Sharif, M.Z.; Hu, Z.; Xue, R.; Yu, B. Empirical Study of Drone Sound Detection in Real-Life Environment with Deep Neural Networks. PeerJ Zool. Sci. 2023, 11, e14696. [Google Scholar] [CrossRef] [PubMed]
  19. Torky, M.; Dahy, G.; Hassanien, A.E. Recognizing sounds of Red Palm Weevils (RPW) based on the VGGish model: Transfer learning methodology. Comput. Electron. Agric. 2023, 212, 108079. [Google Scholar] [CrossRef]
  20. Qiu, Z.; Wang, H.; Liao, C.; Lu, Z.; Kuang, Y. Sound Recognition of Harmful Bird Species Related to Power Grid Faults Based on VGGish Transfer Learning. J. Electr. Eng. Technol. 2023, 18, 2447–2456. [Google Scholar] [CrossRef]
  21. Salamea-Palacios, C.R.; Sanchez-Almeida, T.; Calderon-Hinojosa, X.; Guana-Moya, J.; Castaneda-Romero, P.; Reina-Travez, J. On the use of VGGish as feature extractor for COVID-19 cough classification. In Proceedings of the 2023 8th International Conference on Machine Learning Technologies (ICMLT ’23), Stockholm, Sweden, 10–12 March 2023; ACM: New York, NY, USA, 2023; pp. 89–94. [Google Scholar]
  22. Shi, L.; Ahmad, I.; He, Y.-J.; Chang, K.-H. Hidden Markov model based drone sound recognition using MFCC technique in practical noisy environments. J. Commun. Netw. 2018, 20, 509–518. [Google Scholar] [CrossRef]
  23. Xylo: Ultra-Low Power Neuromorphic Chip | SynSense. Available online: https://www.synsense.ai/products/xylo/ (accessed on 5 January 2024).
  24. Branding, J.; Von Hörsten, D.; Wegener, J.K.; Böckmann, E.; Hartung, E. Towards noise robust acoustic insect detection: From the lab to the greenhouse. KI-Künstliche Intell. 2023. [Google Scholar] [CrossRef]
  25. Sharma, G.; Umapathy, K.; Krishnan, S. Trends in audio signal feature extraction methods. Appl. Acoust. 2020, 158, 107020. [Google Scholar] [CrossRef]
Figure 1. Visualization of a drone’s flight path over the Fraunhofer IVI test oval, with color-coded altitude indicators and microphone positions.
Drones 08 00105 g001
Figure 2. Confusion matrices for four different classifiers (without augmentation), trained under identical conditions.
Drones 08 00105 g002
Figure 3. Top: Spectrogram of the audio signal capturing a drone’s acoustic signature (drone model: ‘HP-X4 2020’; drone class: C3) during the outdoor experiment. Bottom: Classification results over time, showing the classifier’s predictions (based on the 2nd classifier with seed 1 in Table 3).
Drones 08 00105 g003
Figure 4. Classification results over time for a C3 (‘HP-X4 2020’) drone showing the classifiers predictions, trained with different degrees of noise amplitude.
Drones 08 00105 g004
Figure 5. Classification results over time, showing the classifier’s predictions with an augmentation with a pitching of about +/−1.4 semitones (blue circles) and no augmentation (black dots).
Drones 08 00105 g005
Figure 6. Classification results over time, showing the classifier’s predictions with a random delay augmentation (blue circles) and no augmentation (black dots).
Drones 08 00105 g006
Figure 7. FFT analysis of drone acoustic signatures: effects of rotor change and comparison between different drone models.
Drones 08 00105 g007
Table 1. Overview of EU drone categories.
CategoryDescription
C0Drones weighing less than 250 g, typically for leisure and recreational use.
C1Small drones weighing less than 900 g, used for both recreational and commercial purposes, with more features than C0 drones.
C2Drones weighing less than 4 kg, used for complex commercial operations, requiring advanced operational skills.
C3Larger drones weighing less than 25 kg, generally used for specialized commercial tasks demanding specific capabilities.
Table 2. Summary of drone models in database categorized by measurement campaigns (anechoic chamber, ‘free field’, and outdoors) and data collection, with custom-built drones indicated by asterisks.
TypeFree FieldOutdoorsCollection
C0
  • Cartonic Toy drone
  • DJI Mini 3 Pro
  • Eachine E58 (Emotion)
  • Potensic Firefly
-
  • Mambo (Parrot Drone SAS)
  • DJI Mini 3 Pro
  • IDEA 16 (le-idea)
  • Wipkviey T25 Mini
  • Hubsan H107D
C1
  • DJI Mavic Air 2
  • DJI Phantom 4 Pro
  • DJI Avatar
-
  • DJI F450 Flame Wheel
  • DJI FPV
  • S 500 (Holybro)
  • Parrot Bebop Drone
  • Parrot Bebop 2
  • Parrot AR.Drone
  • DJI Mavic Pro
  • DJI Mavic Air
C2
  • DJI Mavic e3
  • DJI Phantom 4 RTK
  • DJI M30T
  • DJI Phantom 4 RTK
  • DJI Phantom 3
  • Yuneec Typhon H
  • DJI Matrice 100
  • Tricopter (Uni Saarland) *
  • 3DR Solo (3D Robotics)
  • DJI Inspire
C3
  • HP-X4 *
  • DJI Inspire 2
  • DJIMatrice 300
  • HP-X4 *
  • HP-E616P-1 *
  • DJI Matrice 300
  • DJI Inspire 2
  • Yuneec H850
  • Yuneec H850 RTK
  • DJI Agras T30
  • DJI Matrice 300
  • DJI Matrice 300 RTK
  • DJI S1000
  • DJI Inspire 1
  • Evo X8 (Premium Modellbau) *
  • DexHawk (DLR) *
  • WintrgaOne Gen II (Wingtra AG)
Table 3. Classifier performance comparison without augmentation: accuracy metrics and resulting variance with and without seed initialization.
SeedPredictionRecall
C0C1C2C3MeanC0C1C2C3Mean
no87.3%92.5%98.3%97.9% 86.6%92.0%97.8%99.1%
no82.8%92.0%98.1%97.9% 86.0%88.2%97.7%99.6%
no84.9%87.4%97.3%98.6% 81.1%88.9%98.5%98.5%
no87.2%91.2%97.2%97.5% 84.9%90.1%98.0%98.9%
std 1.6%2.3%0.5%0.4%1.2%2.3%0.8%0.3%0.4%1.0%
187.3%92.5%98.3%97.9% 86.6%92.0%97.8%99.1%
185.8%94.0%97.9%98.0% 88.5%90.5%98.1%99.1%
185.1%92.8%98.3%98.0% 86.8%91.3%97.9%98.7%
189.4%91.9%86.6%97.4% 86.8%92.8%97.5%99.2%
std 1.6%0.8%0.2%0.2%0.7%0.8%0.8%0.2%0.2%0.5%
286.7%91.5%97.8%98.3% 85.6%90.6%98.8%98.7%
286.7%92.3%96.9%98.4% 87.0%90.0%98.2%98.9%
281.4%91.2%98.6%98.1% 84.3%88.7%98.3%98.7%
287.7%92.5%97.3%98.0% 86.0%90.8%98.9%98.7%
std 2.5%0.5%0.6%0.2%1.0%1.0%0.8%0.3%0.1%0.5%
384.7%92.8%97.8%98.0% 89.5%89.4%97.5%98.5%
387.7%89.9%98.3%98.1% 84.4%91.2%98.1%99.1%
386.1%90.1%97.8%98.0% 84.8%90.0%97.4%99.1%
388.0%92.6%97.5%98.1% 87.7%90.7%98.0%99.3%
std 1.3%1.4%0.3%0.0%0.8%2.1%0.7%0.3%0.3%0.8%
Table 4. Classification accuracy for individual drone categories C0 to C3 across different levels of augmentation with harmonic distortion, with the last two columns displaying the average (Mean) and standard deviation (Std) of the accuracies for all categories. Results that meet or exceed the 75th percentile threshold for their category are highlighted in green, indicating higher accuracy, while results at or below the 25th percentile are highlighted in orange, indicating lower accuracy. For the standard deviation (Std), this color scheme is reversed: lower values (indicating more consistent accuracy) are marked in green and higher values (indicating less consistency) in orange.
Distortion LevelC0C1C2C3MeanStd
0%85.4%93.1%98.7%97.9%93.8%6.1%
7%85.3%92.6%98.7%98.5%93.8%6.3%
14%85.5%93.6%98.2%98.2%93.9%6.0%
21%84.0%88.0%98.2%97.2%91.9%7.0%
28%84.3%90.3%97.7%95.3%91.9%5.9%
35%80.0%93.3%98.0%98.1%92.4%8.5%
42%88.4%68.4%96.4%94.7%87.0%12.9%
49%88.0%75.9%98.2%95.4%89.4%10.0%
56%91.8%66.7%96.8%95.4%87.7%14.1%
63%74.9%88.2%95.1%94.1%88.1%9.3%
Table 5. Classification accuracy for individual drone categories C0 to C3 across different levels of environmental noise augmentation, with the last two columns displaying the average (Mean) and standard deviation (Std) of the accuracies for all categories. Results that meet or exceed the 75th percentile threshold for their category are highlighted in green, indicating higher accuracy, while results at or below the 25th percentile are highlighted in orange, indicating lower accuracy. For the standard deviation (Std), the color scheme is reversed: lower values are marked in green to indicate consistency, and higher values in orange to indicate less consistency.
maxNoiseC0C1C2C3MeanStd
0%87.3%90.5%98.4%98.0%93.6%5.5%
8%84.3%89.8%98.4%97.9%92.6%6.8%
16%83.4%92.8%97.9%98.0%93.0%6.9%
24%81.1%93.1%98.6%98.0%92.7%8.1%
32%81.5%89.7%98.8%97.6%91.9%8.0%
40%66.2%95.1%97.1%97.7%89.0%15.3%
48%52.7%93.2%95.5%95.1%84.1%21.0%
56%69.1%92.0%95.2%98.1%88.6%13.2%
64%66.5%86.5%96.9%91.8%85.4%13.3%
72%48.0%91.4%95.7%94.2%82.3%23.0%
Table 6. Classification accuracy for individual drone categories C0 to C3 across different levels of pitch augmentation, with the last two columns displaying the mean (Mean) and standard deviation (Std) of the accuracies for all categories. Results that meet or exceed the 75th percentile threshold for their category are highlighted in green, indicating higher accuracy, while results at or below the 25th percentile are highlighted in orange, indicating lower accuracy. For the standard deviation (Std), this color scheme is reversed: lower values (indicating more consistent accuracy) are marked in green and higher values (indicating less consistency) in orange.
maxPitchC0C1C2C3MeanStd
087.6%94.8%98.4%98.0%94.7%5.0%
0.286.3%92.8%98.3%97.9%93.8%5.6%
0.484.8%91.8%97.6%98.4%93.2%6.3%
0.681.5%90.9%98.2%97.6%92.1%7.8%
0.878.9%86.7%97.5%97.2%90.1%9.0%
1.185.3%90.7%96.2%98.0%92.6%5.7%
1.478.7%86.2%96.5%97.6%89.8%9.0%
1.784.1%80.9%95.0%97.7%89.4%8.2%
2.180.6%86.1%93.3%97.4%89.4%7.5%
2.586.7%74.5%96.3%97.6%88.8%10.7%
Disclaimer/Publisher’s Note: The statements, opinions and data contained in all publications are solely those of the individual author(s) and contributor(s) and not of MDPI and/or the editor(s). MDPI and/or the editor(s) disclaim responsibility for any injury to people or property resulting from any ideas, methods, instructions or products referred to in the content.

