Article

Development and Field Testing of a Wireless Data Relay System for Amphibious Drones

1
Faculty of Bioresource Sciences, Akita Prefectural University, Akita 010-0195, Japan
2
Faculty of Software and Information Science, Iwate Prefectural University, Takizawa 020-0693, Japan
3
Graduate School of Bioresource Sciences, Akita Prefectural University, Akita 010-0195, Japan
4
Akita Prefectural Center of Analytical Chemistry Ltd., Akita 010-8728, Japan
*
Author to whom correspondence should be addressed.
Drones 2024, 8(2), 38; https://doi.org/10.3390/drones8020038
Submission received: 21 December 2023 / Revised: 18 January 2024 / Accepted: 23 January 2024 / Published: 25 January 2024
(This article belongs to the Special Issue Wireless Networks and UAV)

Abstract

:
Amphibious (air and water) drones, capable of both aerial and aquatic operations, have the potential to provide valuable drone applications in aquatic environments. However, the limited range of wireless data transmission caused by the low antenna height on water and reflection from the water surface (e.g., 45 m for vertical half-wave dipole antennas with the XBee S2CTM, estimated using the two-ray ground reflection model) persists as a formidable challenge for amphibious systems. To overcome this difficulty, we developed a wireless data relay system for amphibious drones using the mesh-type networking functions of the XBeeTM. We then conducted field tests of the developed system in a large marsh pond to provide experimental evidence of the efficiency of the multiple-drone network in amphibious settings. In these tests, hovering relaying over water was attempted for extension and bypassing obstacles using the XBee S2CTM (6.3 mW, 2.4 GHz). During testing, the hovering drone (<10 m height from the drone controller) successfully relayed water quality data from the transmitter to the receiver located approximately 757 m away, but shoreline vegetation decreased the reachable distance. A bypassing relay test for vegetation indicated the need to confirm a connected path formed by pair(s) of mutually observable drones.

1. Introduction

Amphibious drones with capabilities of both aerial and aquatic operations have the potential to provide valuable drone applications in aquatic environments. Typical amphibious multirotor drones are classified as amphibious unmanned aerial vehicles [1], whereas other unmanned vehicles dedicated to aquatic environments are also conventionally designated as drones. For water quality monitoring, some specialized systems using amphibious drones have already been proposed [2,3,4,5,6,7,8].
Earlier studies of advanced water quality monitoring have demonstrated the necessity for real-time wireless data acquisition [9,10,11,12,13,14]. For drone applications, without the validation of data from continuously monitored trends, some water quality sensors might record unstable data within rapid measurements or emergency surveys with drones. However, continuous data reception from amphibious drones is not always expected when target sites include obstacles to wireless communication (e.g., vegetation, buildings) [15]. In actuality, the water body itself is an obstacle. Therefore, some valuable modules have been developed for wireless communication in deep water [16]. As a cost-effective approach to surface water monitoring, conventional communication devices (e.g., LoRaTM, XBeeTM, LTETM) are also available if the amphibious drone can be used with an antenna protruding above the amphibious drone’s draft line. An earlier study used an amphibious drone system with a LoRaTM wireless communication module on the upper side of the amphibious drone [5]. The XBeeTM is an alternative for cheaper and more convenient applications using a higher data transmission rate (<250 kb s−1 [17]).
The maximum distance of wireless communication for water quality data in an amphibious drone system might be as short as the maximum controllable distance of the drone on water (e.g., 500 m [18]) for safe flight. However, an extremely short communicable distance achieved by convenient low-power tools (e.g., Zigbee products) on water could pose an important limitation for real-time monitoring applications (e.g., 45 m for vertically floating half-wave dipole antennas with the XBee S2CTM [17], as estimated using the two-ray ground reflection model [19,20]). Even in small-scale applications, wireless signals can be shielded by surrounding objects (e.g., vegetation [21]) at the monitoring site. If a real-time monitoring system is necessary for complex target sites with obstacles, then we can choose from several methods including (a) high-power wireless communication systems after obtaining legal permission/licenses and anti-crosstalk validation, (b) the LoRaTM communication systems by compromising the data rate, and (c) the XBeeTM mesh network by introducing a rescue drone or the parallel use of multiple drones. We specifically examined (c) for this study because legal permissions for the use of high-power wireless communication systems and anti-crosstalk validation can be important issues in some areas and countries, even though a drone-based water quality survey can be completed within a short time. A rescue drone could be made available by repurposing old drones or by purchasing a small drone (e.g., DJI MiniTM) capable of carrying a lightweight (<100 g) data relay system (e.g., ArduinoTM Nano, XBeeTM, XBeeTM shield, antenna, a 9V-006P battery and cables). For a greater-scale drone survey, the concept of a wireless data relay among a swarm of drones has been proposed [22,23]. It has been examined with multi-hop wireless communication systems for aerial operations [24,25]. In [25], multi-hop wireless telemetry with a low-frequency (169 MHz, reallocated for telemetry and UAV control from analog TV broadcasting in Japan) band was examined, and it succeeded in Beyond-Line-Of-Sight (BLOS) flight by relaying the telemetry data. The result also provides a hint for the extended conceptualization for an amphibious drone system (Figure 1). Despite these intensive efforts for aerial operations, the lack of experimental evidence regarding the networking capability of multiple amphibious drones on sites may contribute to the hesitancy in adopting large-scale aquatic environmental monitoring with drones.
To overcome the limited availability of wireless communication tools and knowledge on water, we developed a wireless data relay system for multiple amphibious drones in a reproducible way using commercially available products and an affordable off-the-shelf 3D printer. The system was validated through field tests of data relaying and established basic theories, particularly emphasizing extension of the communicable distance through easily reproducible routines for environmental scientists and engineers.

2. Materials and Methods

For testing the wireless data relay system in the field, we selected basic water quality indicators for routine water quality monitoring, including pH, electrical conductivity (EC), dissolved oxygen (DO), and water temperature.

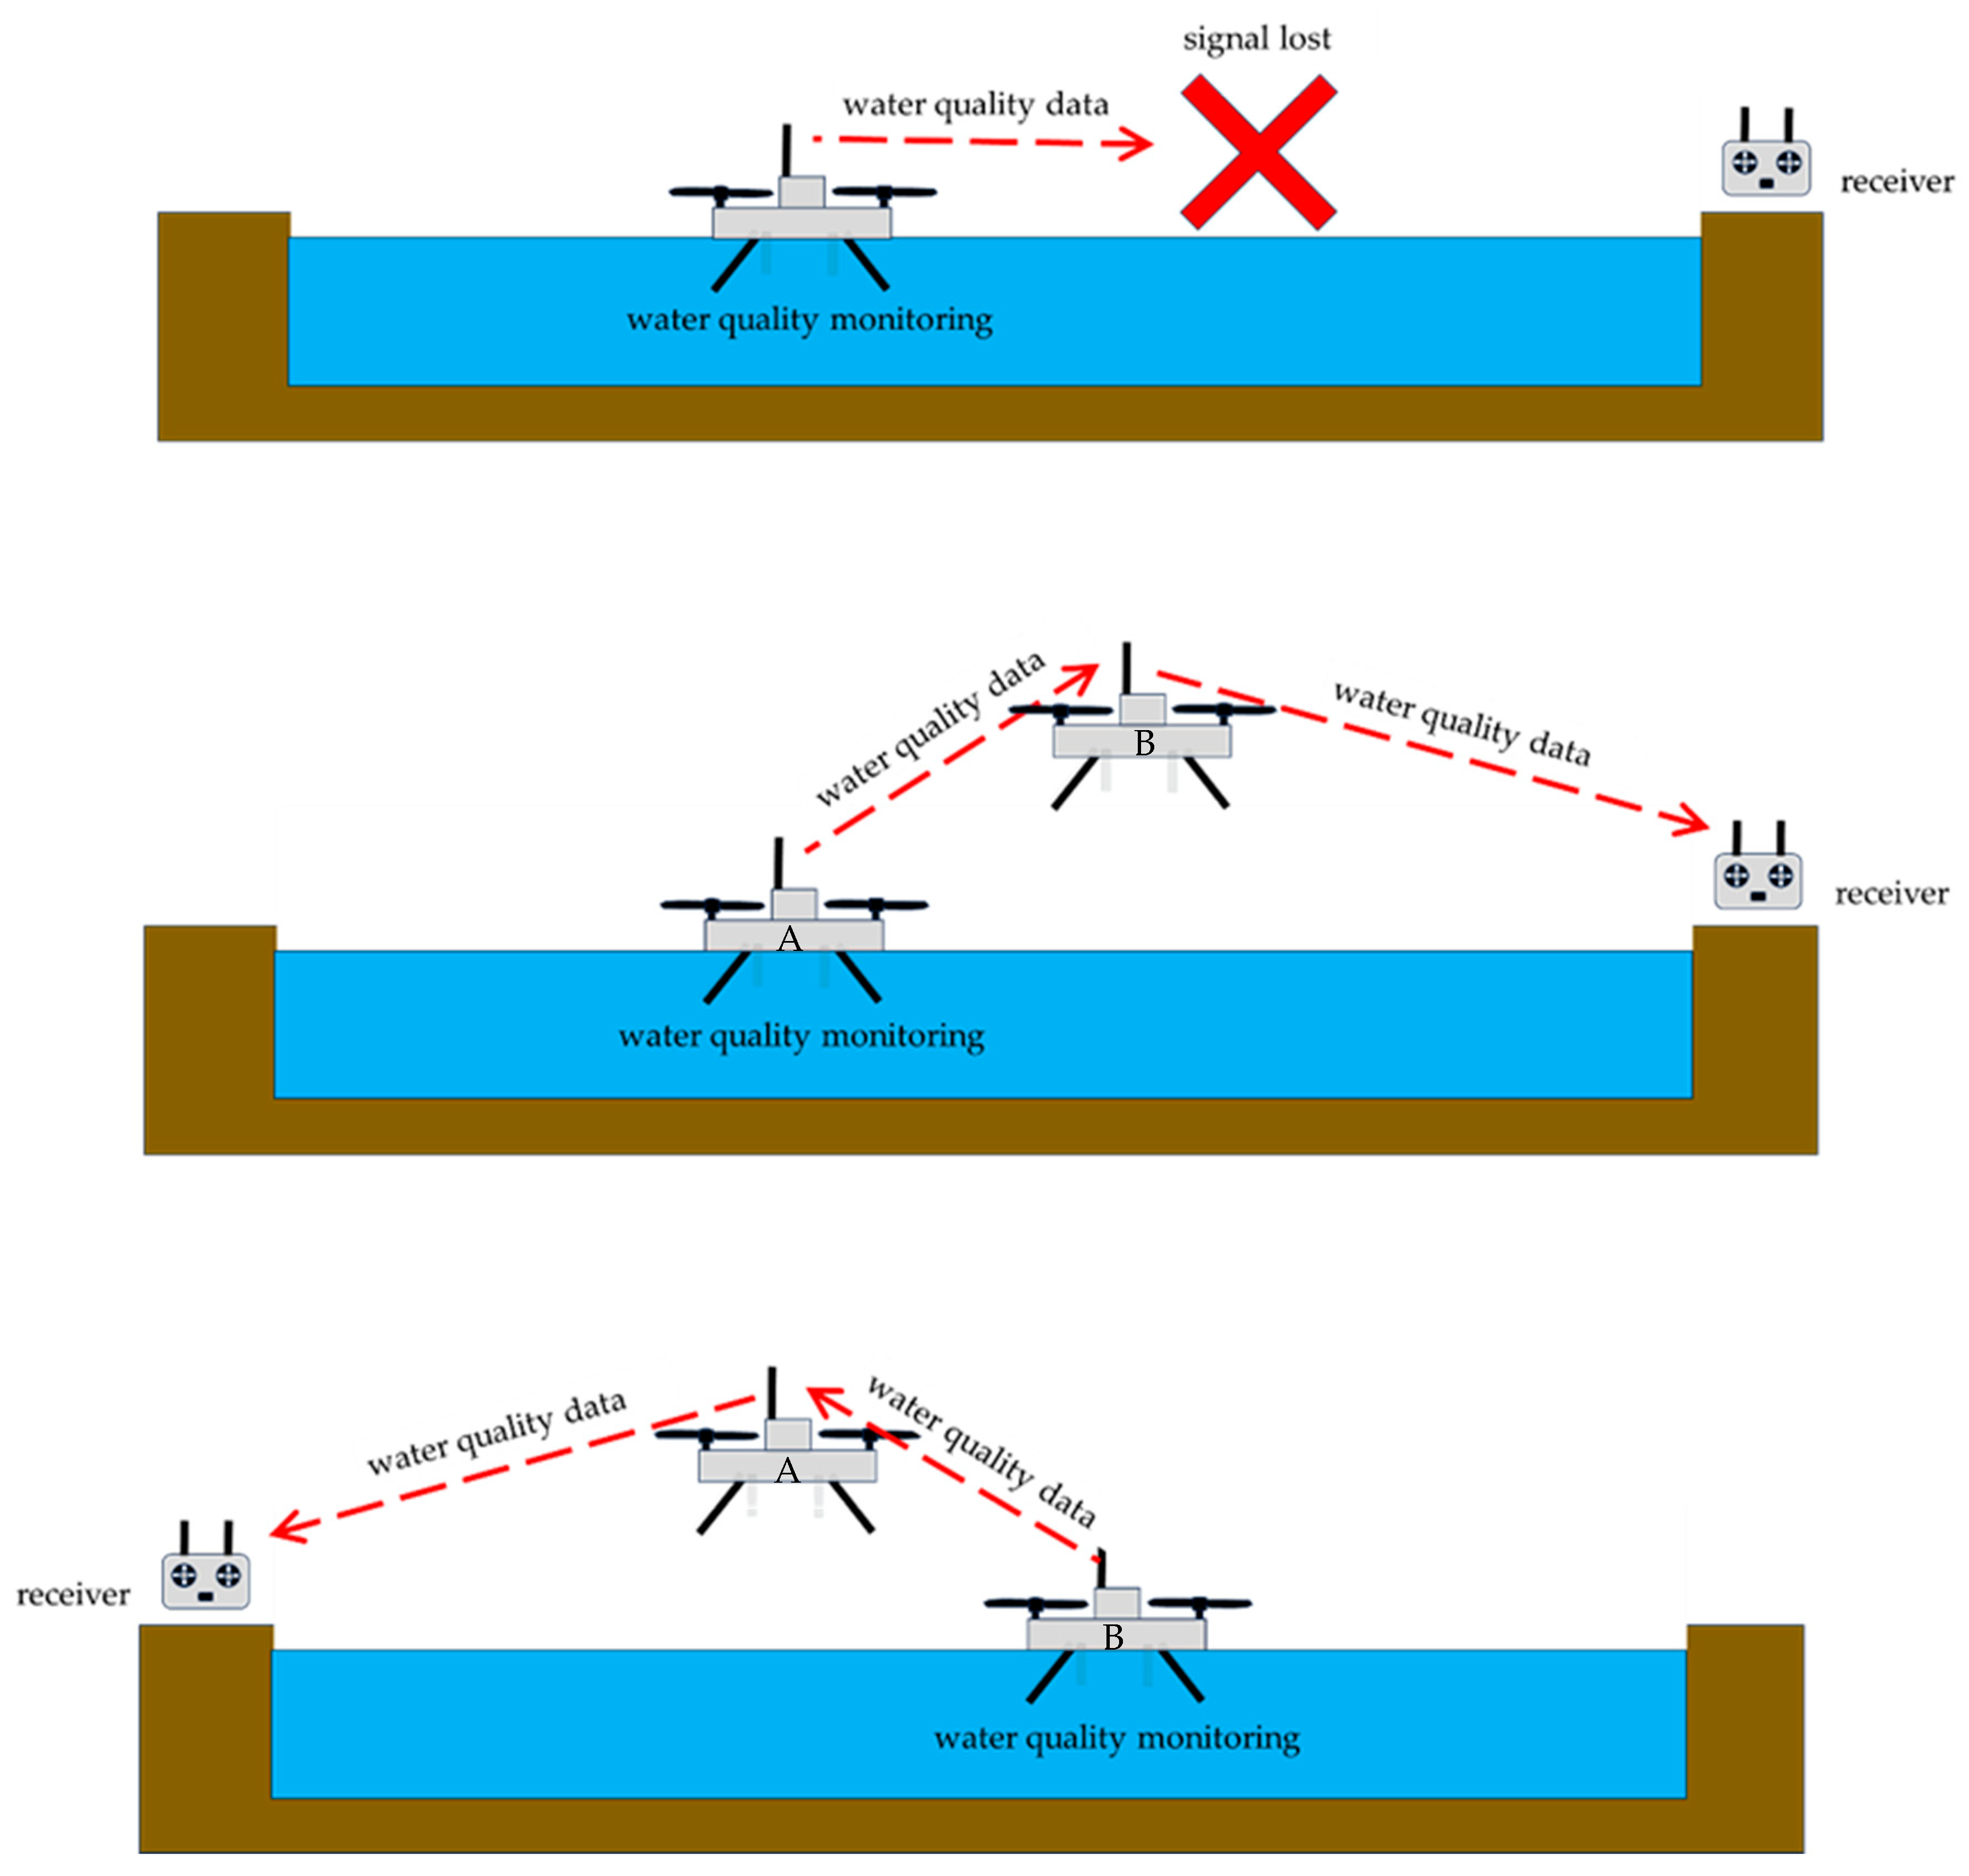
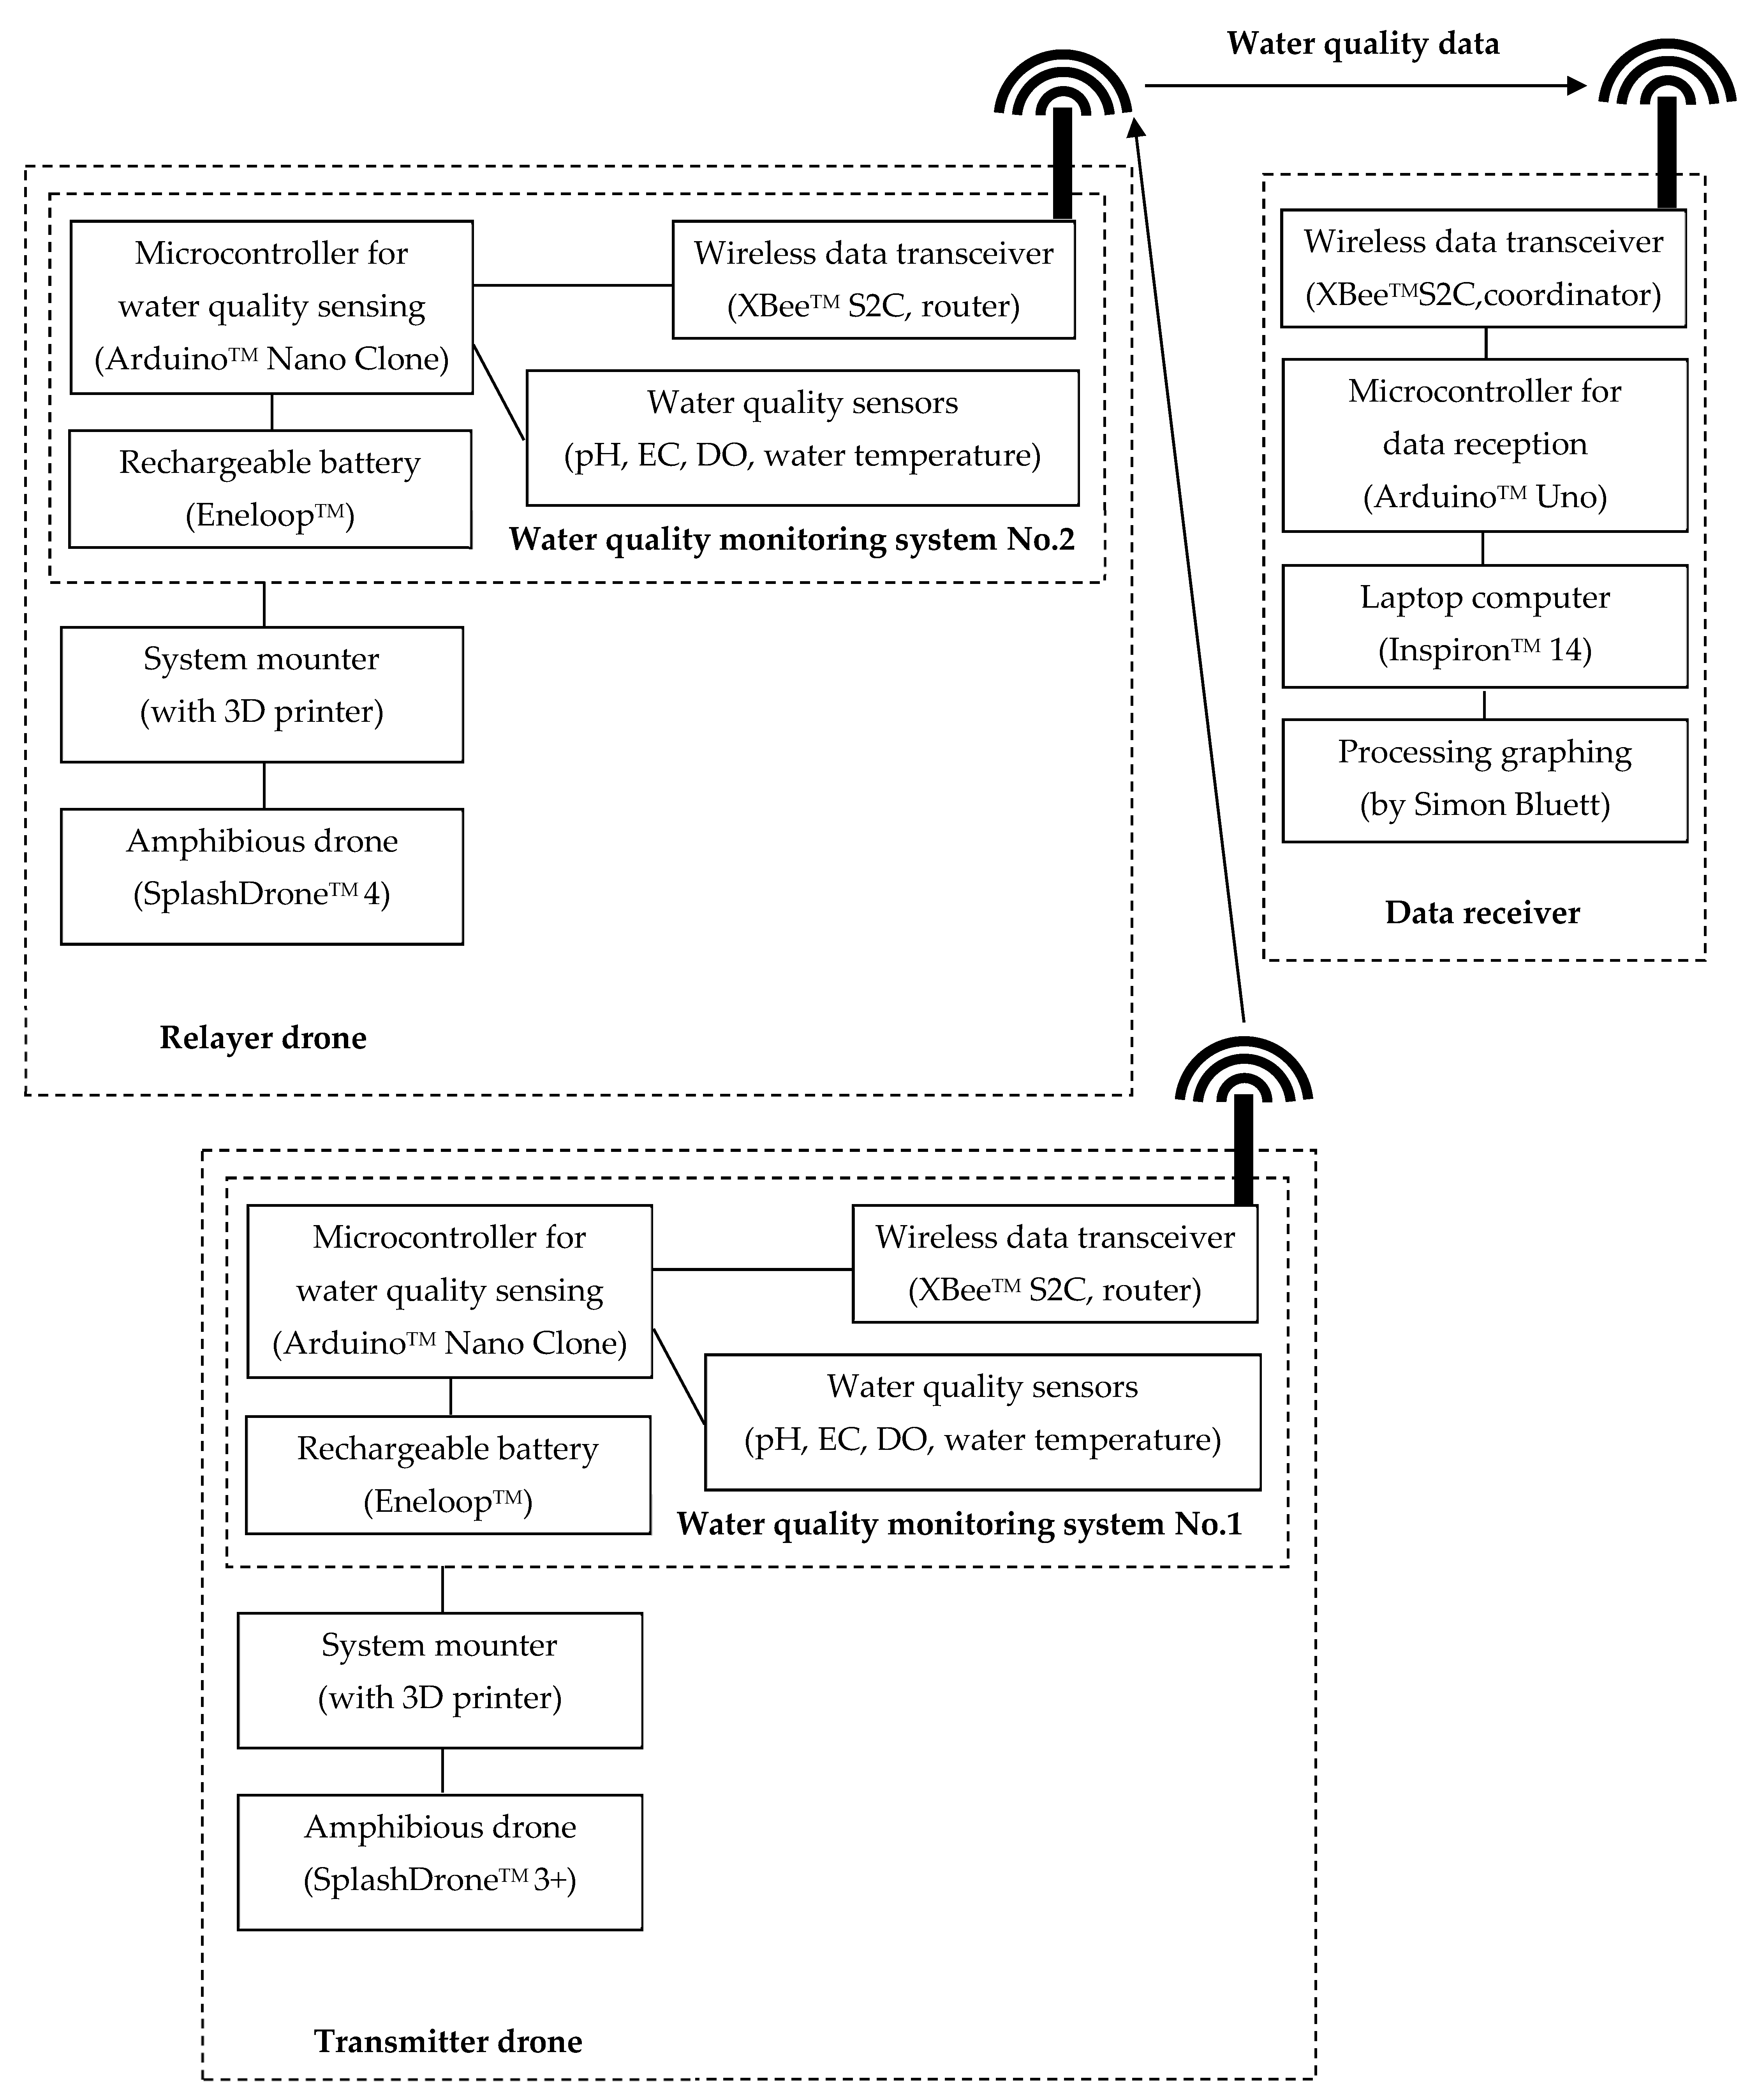
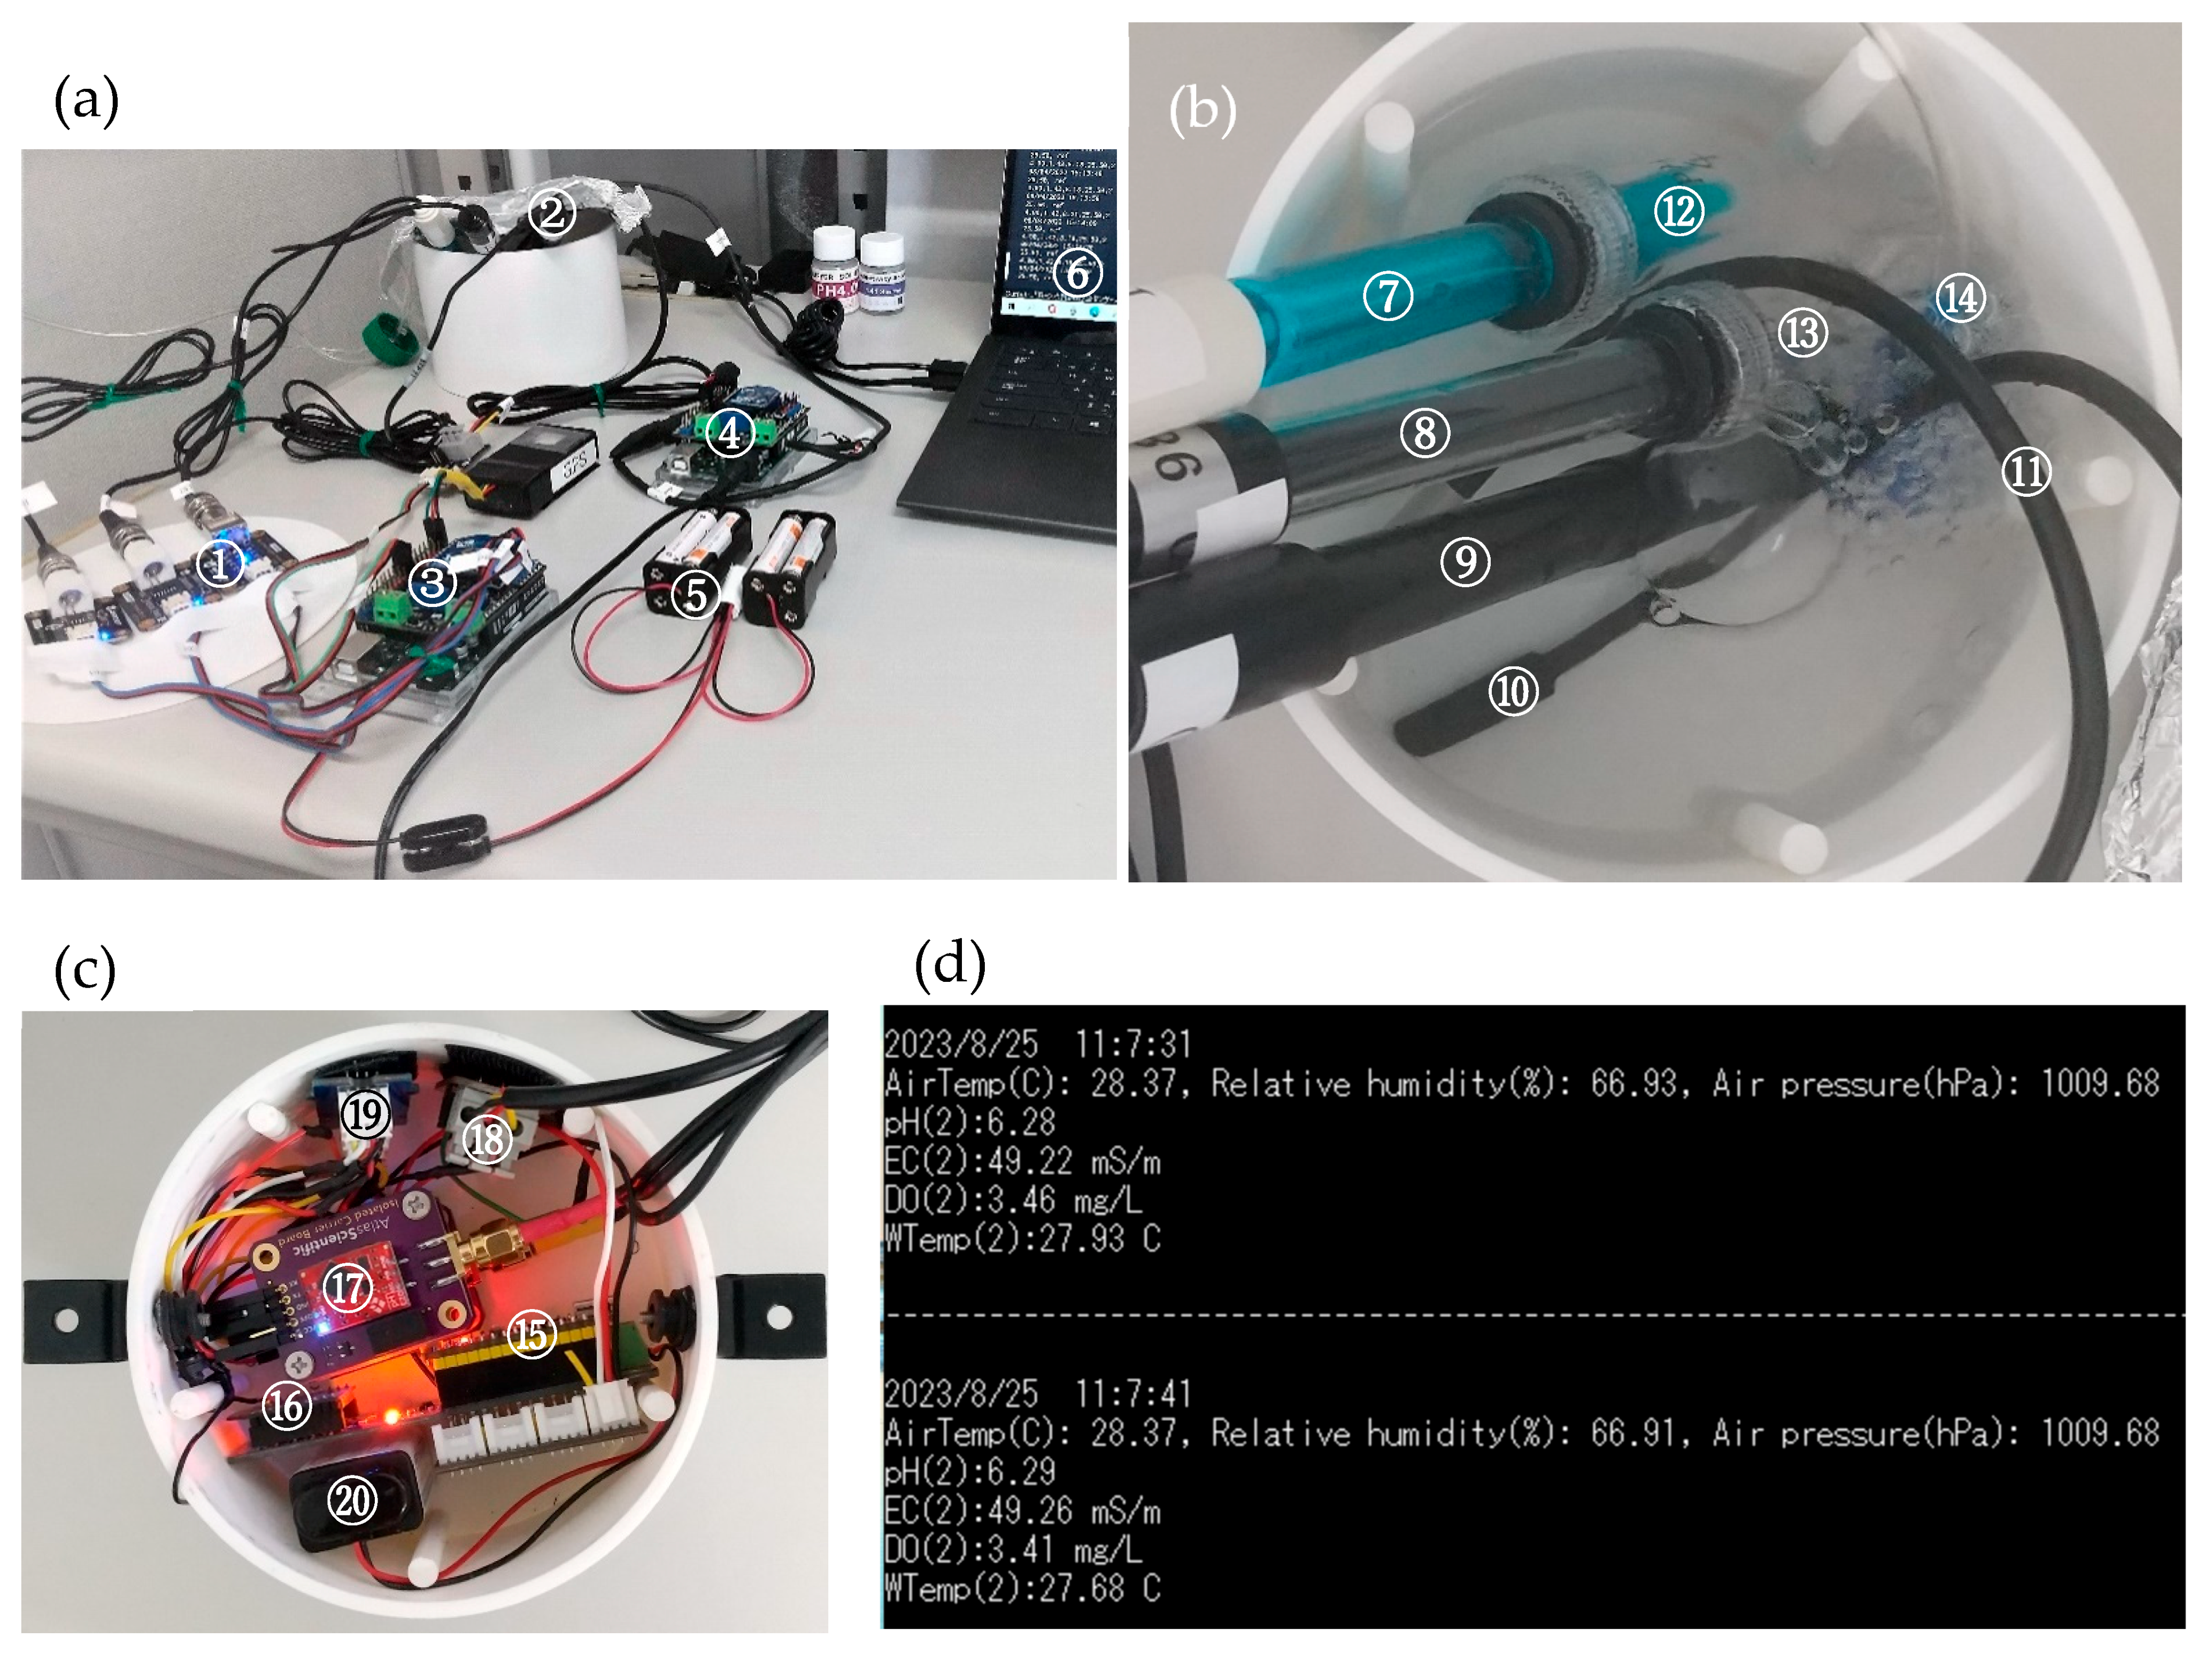
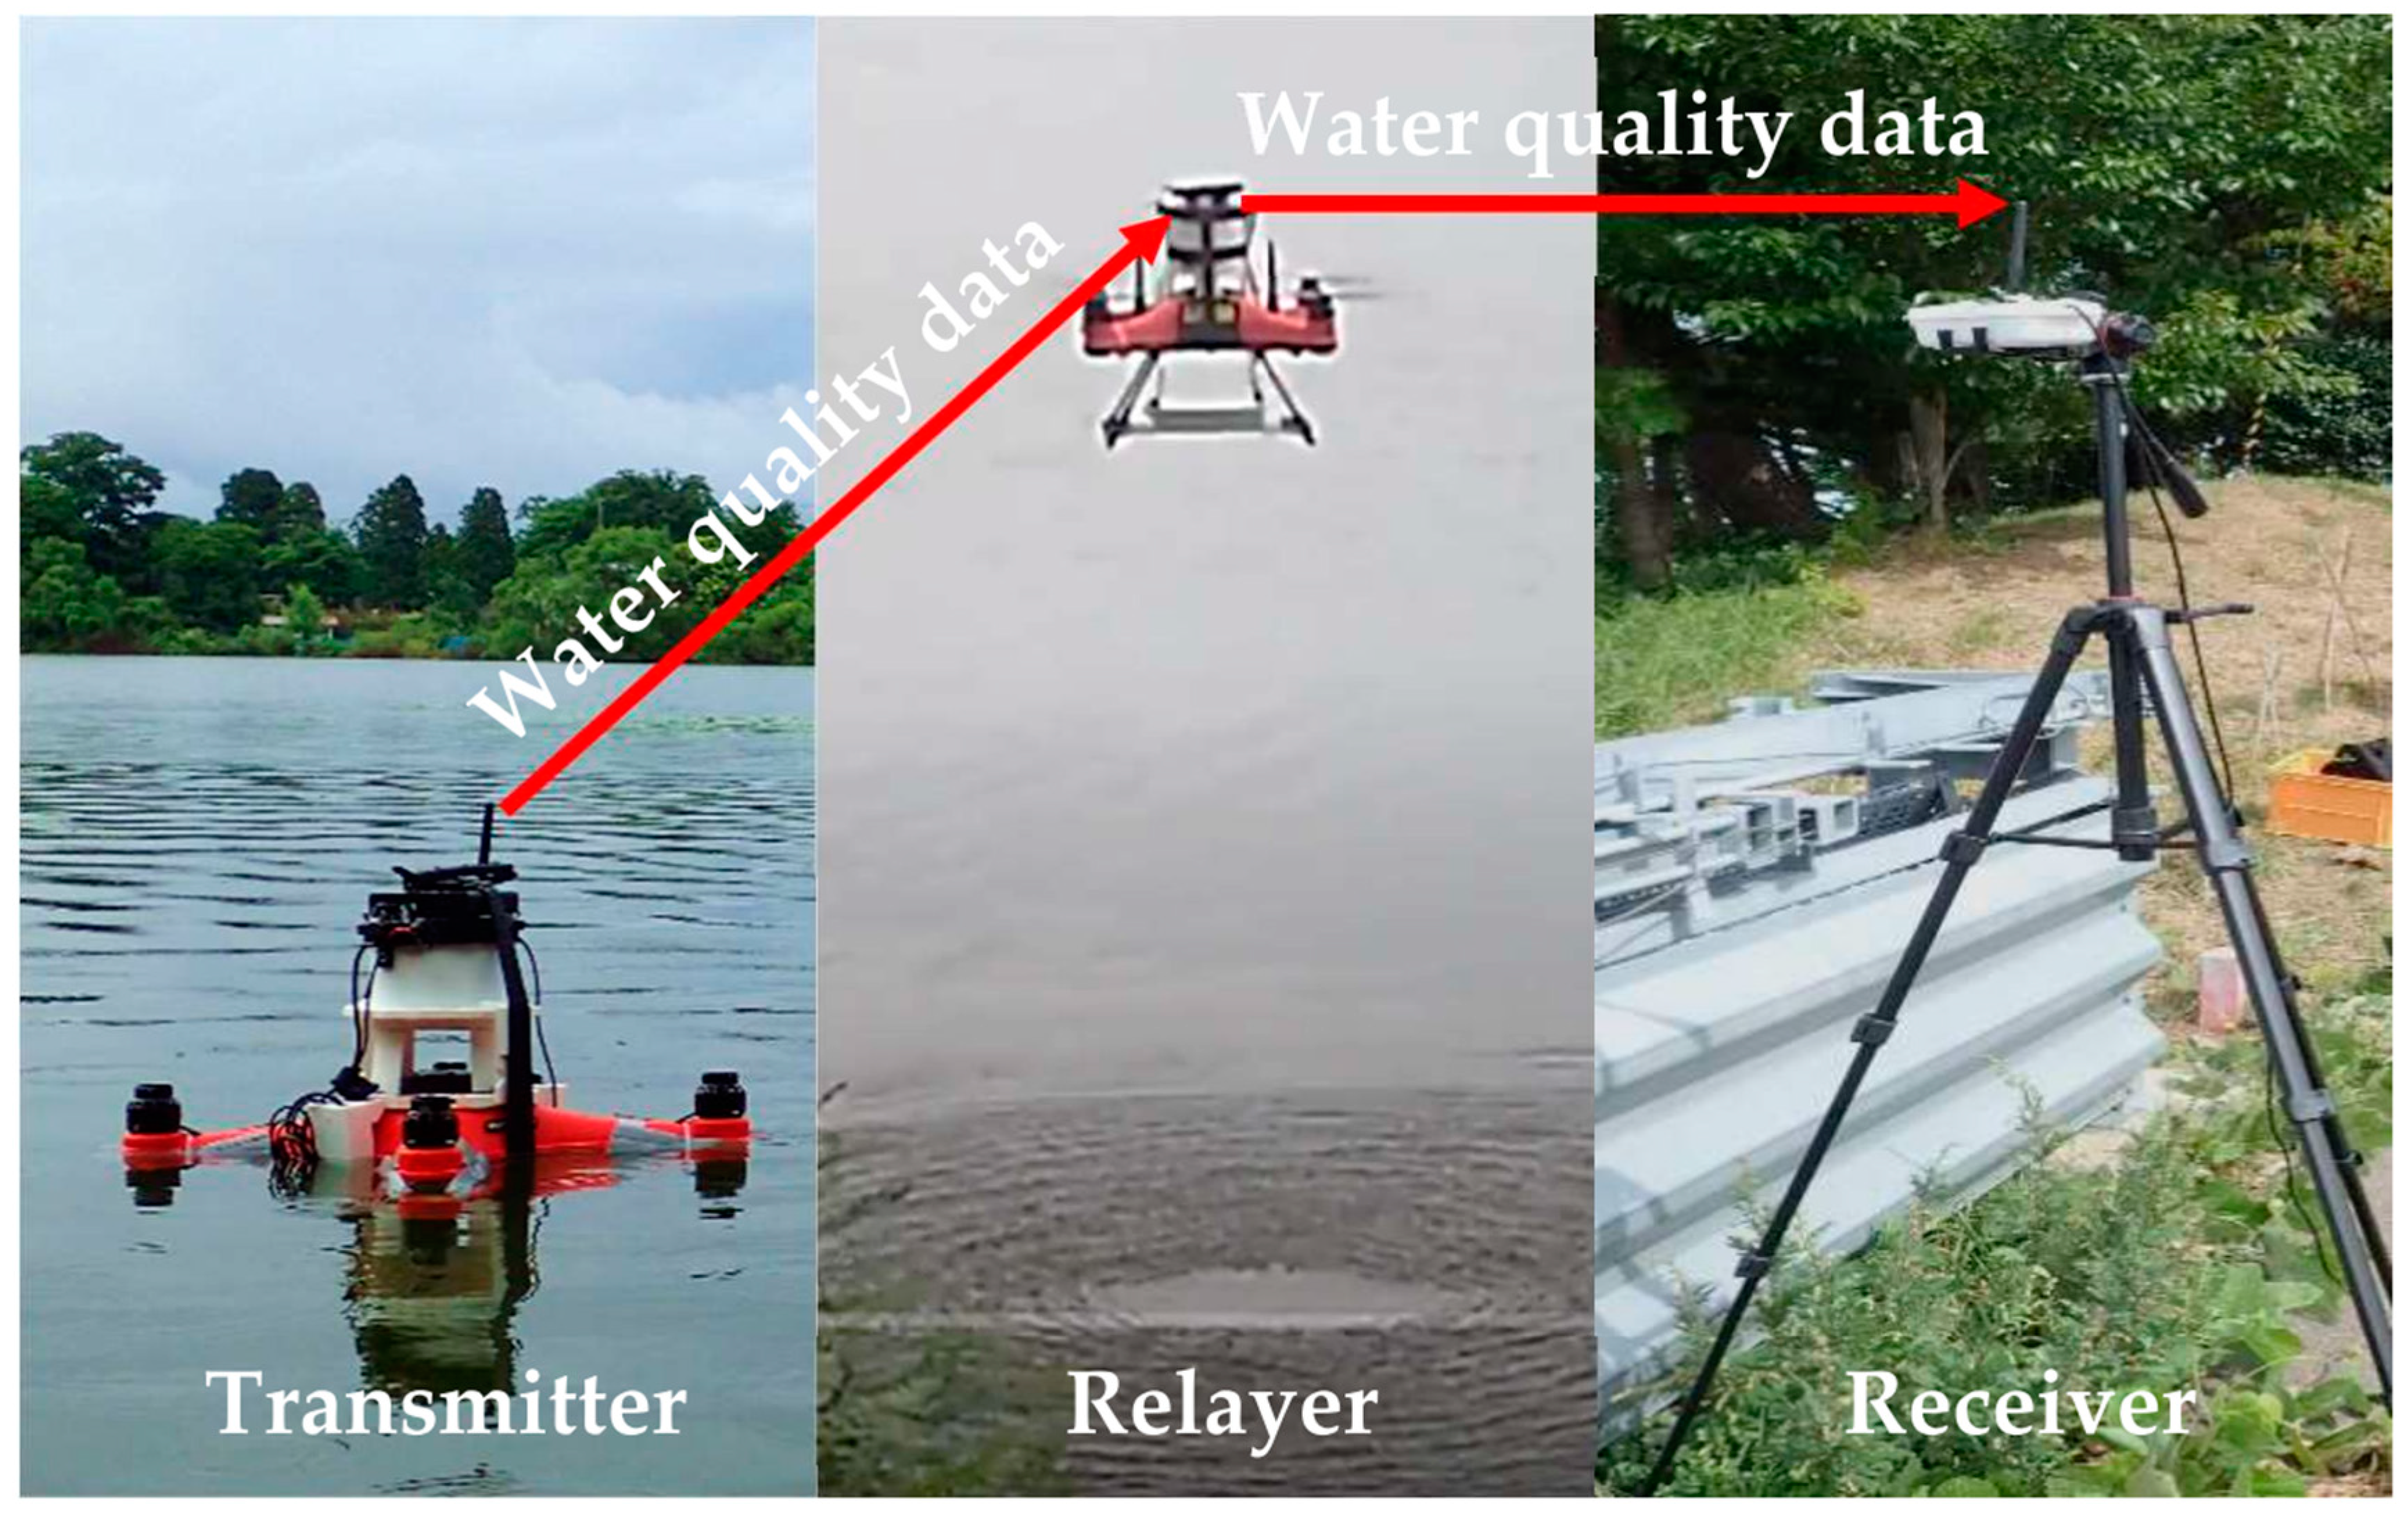
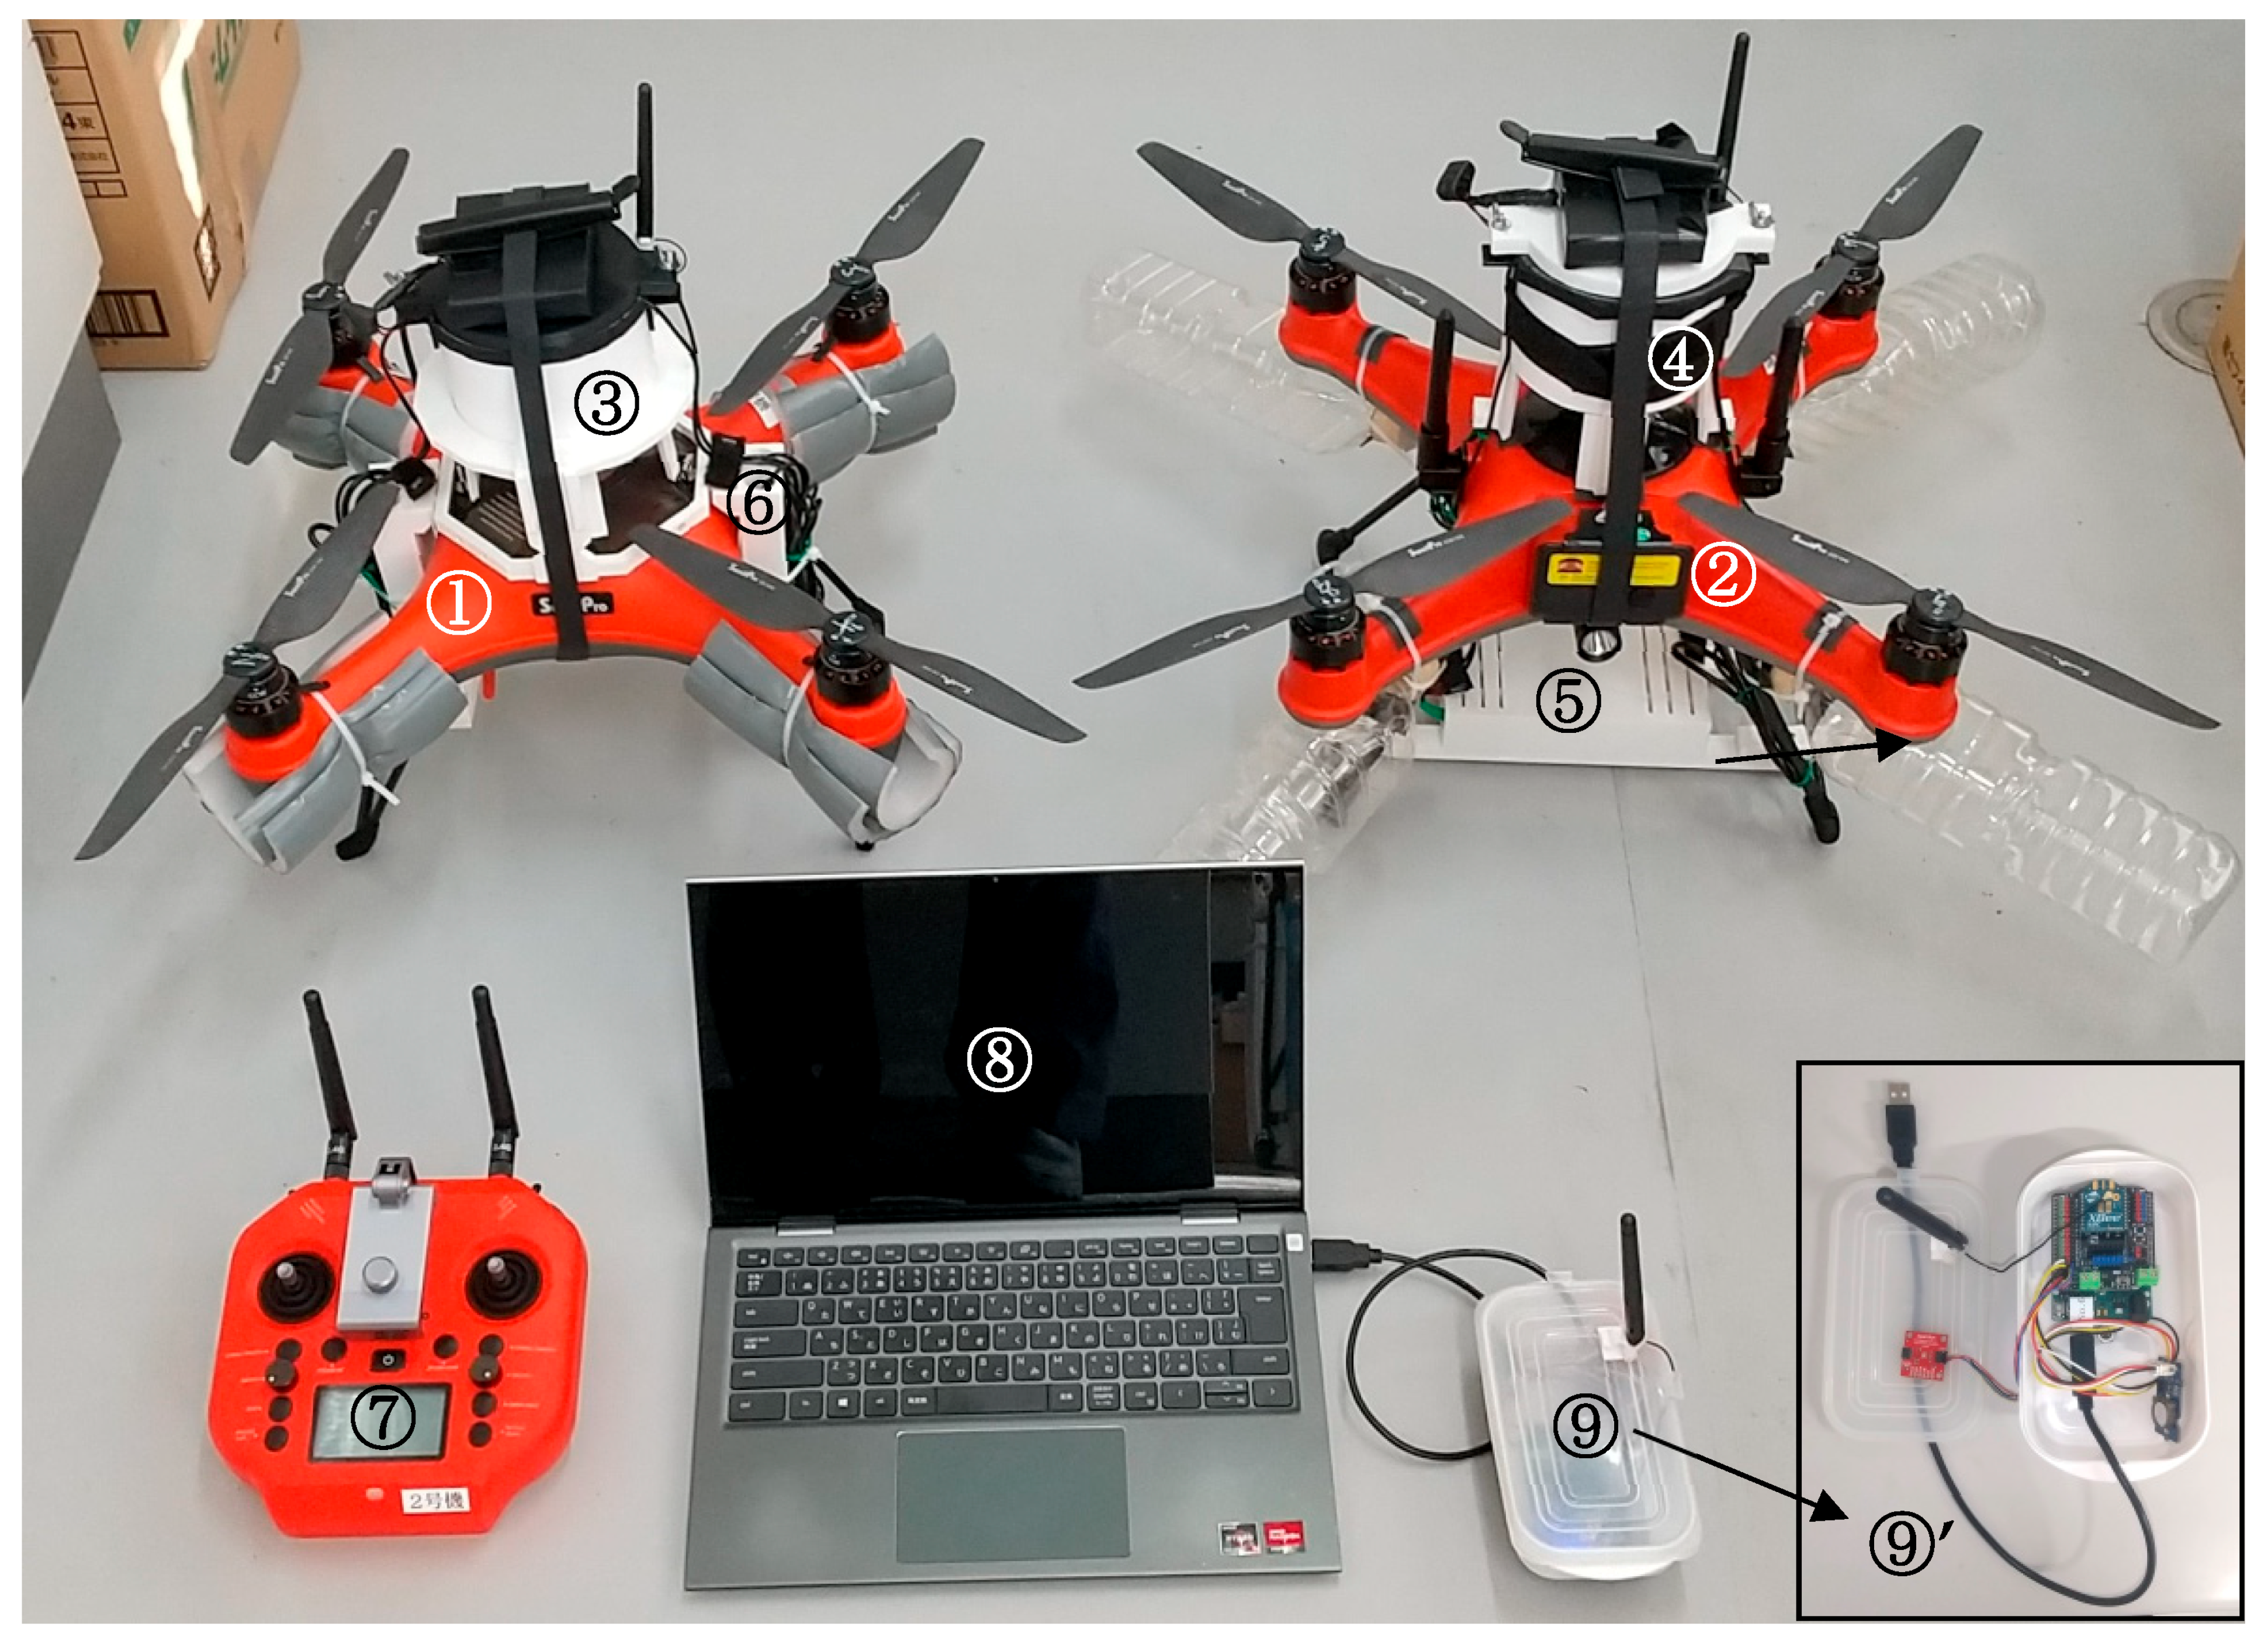
2.1. Water Quality Monitoring System with Amphibious Drones

Amphibious drones used for developing the water quality monitoring system were the SplashDroneTM 3+ and SplashDroneTM 4 (Swellpro, China, localized and sold by GSM Co., Ltd., Tokyo, Japan). Each drone has been rated as an Ingress Protection (IP) 67 product (dust- tight and waterproof to one meter of depth for 30 min) in China. The maximum payload capacity for the SplashDroneTM 3+ was 1 kg, whereas that for the SplashDroneTM 4 was 2 kg [18,26]. The maximum controllable distance between the flight body of the SplashDroneTM 4 (ISM 2.4 GHz, compliant with Japanese regulations) and the controller was 500 m on water, whereas that on the free (air) space could be as long as 5 km [18]. A system schematic is shown in Figure 2. Water quality sensors (pH, EC, DO, and temperature) and their outputs are presented in Figure 3. These water quality sensors were laboratory-grade low-cost models for application with protecting mounters on drones. For a SplashDroneTM 3+ system, the water quality sensors were the DFRobotTM-brand analog output sensors with signal isolators (pH, SEN0161; EC, DFR0300; DO, SEN0237-A; isolator, DFR0504; Zhiwei Robotics Corp., Shanghai, China). For the SplashDroneTM 4 system, water quality sensors were mounted on the landing gear because of the advanced wireless flight control systems of the SplashDroneTM 4 with two large antennas. The pH sensor was a gel-filled immersive electrode sensor (pH Kit; Atlas Scientific, Pasadena, CA, USA). The EC sensor was also replaced with a wide-range (10 to 200,000 μS cm−1) sensor (Conductivity K 1.0 Kit; Atlas Scientific, United States) for freshwater monitoring. The DO sensor with an Ag-Zn electrode (Dissolved Oxygen Kit; Atlas Scientific, United States) was also used for unified control of water quality sensors in the I2C communication mode. These sensors were calibrated with the standard solutions with a 9 V source to the sensor controller (a 5 V source was insufficient for the sensors). The water temperature sensor was an SEN-18367 (SparkFun Electronics Inc., Boulder, CO, USA) with a 4.7 kΩ pull-up resistor or a KIT0021 (Zhiwei Robotics Corp., China) configured to read the temperature at 9-bit resolution over the 1-Wire interface (a one-wire device communication bus system with a ground wire). The temperature compensation coefficient for EC data was 2.0% K−1. The coefficient for DO data was obtained to minimize the standard deviation of the data of oxygen-saturated water. These sensors were controlled by an ArduinoTM (open-source microcomputer brand) nano-compatible board (Shenzhen Keyes Diy Robot Co., Ltd., Shenzhen, China), a GroveTM (connecter) shield for the ArduinoTM Nano (Seeed Technology Co., Ltd., Shenzhen, China) (’shield’ means stackable electronics board on ArduinoTM series computers), and a six-port GroveTM hub (Seeed Technology Co., Ltd., China) for multiplying the I2C port. The resolution of the analog–digital converter for the analog-output sensor was 10-bit. An XBeeTM add-on for ArduinoTM Nano (Gravitech LLC, Minden, NV, USA) was also stacked for XBeeTM wireless communication in the industrial, scientific, and medical (ISM, 2.4 GHz) band. An atmospheric sensor (air temperature/humidity/air pressure sensor; SEN-15440, SparkFun Electronics Inc., United States) was also used for evaluating the dissolved oxygen concentration. The external (third-party) header files used in the ArduinoTM sketches (programs) were SparkFunBME280.h (SparkFun Electronics Inc., United States) for the atmospheric sensor, OneWire.h (Paul Stoffregen) and DallasTemperature.h (Miles Burton) for the water temperature sensor, and XBee.h (Andrew Rapp) for the XBeeTM (Zigbee, Chaska, MN, USA) wireless communication chips.

2.2. Wireless Communication Modules and Configurations

The measured water quality data were transmitted from a wireless communication chip (XBeeTM S2C; Digi International Inc., United States) to other XBeeTM S2C chips. The XBeeTM platform was selected for its capabilities of mesh-type networking [17] and continuous wireless communication with the water quality sensing modules within the range of the controllable distance of the drones on water (500 m [18]). The primary modulation method was the Offset-Quadrature Phase Shift Keying (O-QPSK). The spectrum spreading method was the Direct Sequence Spread Spectrum (DSSS). These XBeeTM S2C chips have routing functions in the Application Programming Interface (API) mode, which provide a multiple drone system with wireless communication. All the XBeeTM chips were configured using software (XCTU ver. 6.5.6; Digi International Inc., Eden Prairie, MN, USA) and an XBeeTM Universal Serial Bus (USB) dongle (SparkFun Electronics Inc., Niwot, CO, USA). Each of the XBeeTM S2C chips with a U.FL connector was connected to a half-wave dipole antenna (A24-HABUF-P5I, 2.1 dBi (1.62) gain and 10 cm overall height; Digi International Inc., United States). These antennas were used vertically. All the XBeeTM S2C chips were operated at the maximum transmission power (6.3 mW, localized for Japanese regulations), −102 dBm receiver sensitivity and 9600 baud rate. Each XBeeTM S2C chip for the drone system was configured to work in the router mode, whereas the chip for the receiver was used in the coordinator mode. The default values for other parameters in the XCTU were retained. To avoid interference with signals from the drone controller (2.4 GHz Wi-Fi transceiver for Japanese regulations), the channel for the wireless communication between the XBeeTM S2C chips was not fixed. The scan duration of the selectable channels (15, channel 26 was not used) was set as approximately 2.4 s (the SD value in the XCTU was set at 3). The corresponding central frequency range was 2.405–2.475 GHz. The bandwidth for each channel was 0.002 GHz. The node joining time was set as infinite. The node discovery backoff time was set as 6.0 s. The interval of water quality measurement and data transmission was set as approximately 7.0 s by adjusting the delay time in the ArduinoTM sketches (programs), but the interval was extended later (experiments in 2023) to 10 s for stable communication. Each of the measured water quality data points (multiplied to make a 16-bit integer value) was divided into two 8-bit payloads by bit-shifting for the communication with XBeeTM S2C. A unique identifier number for each sensor (no duplication throughout all nodes) was also sent before each data transmission.

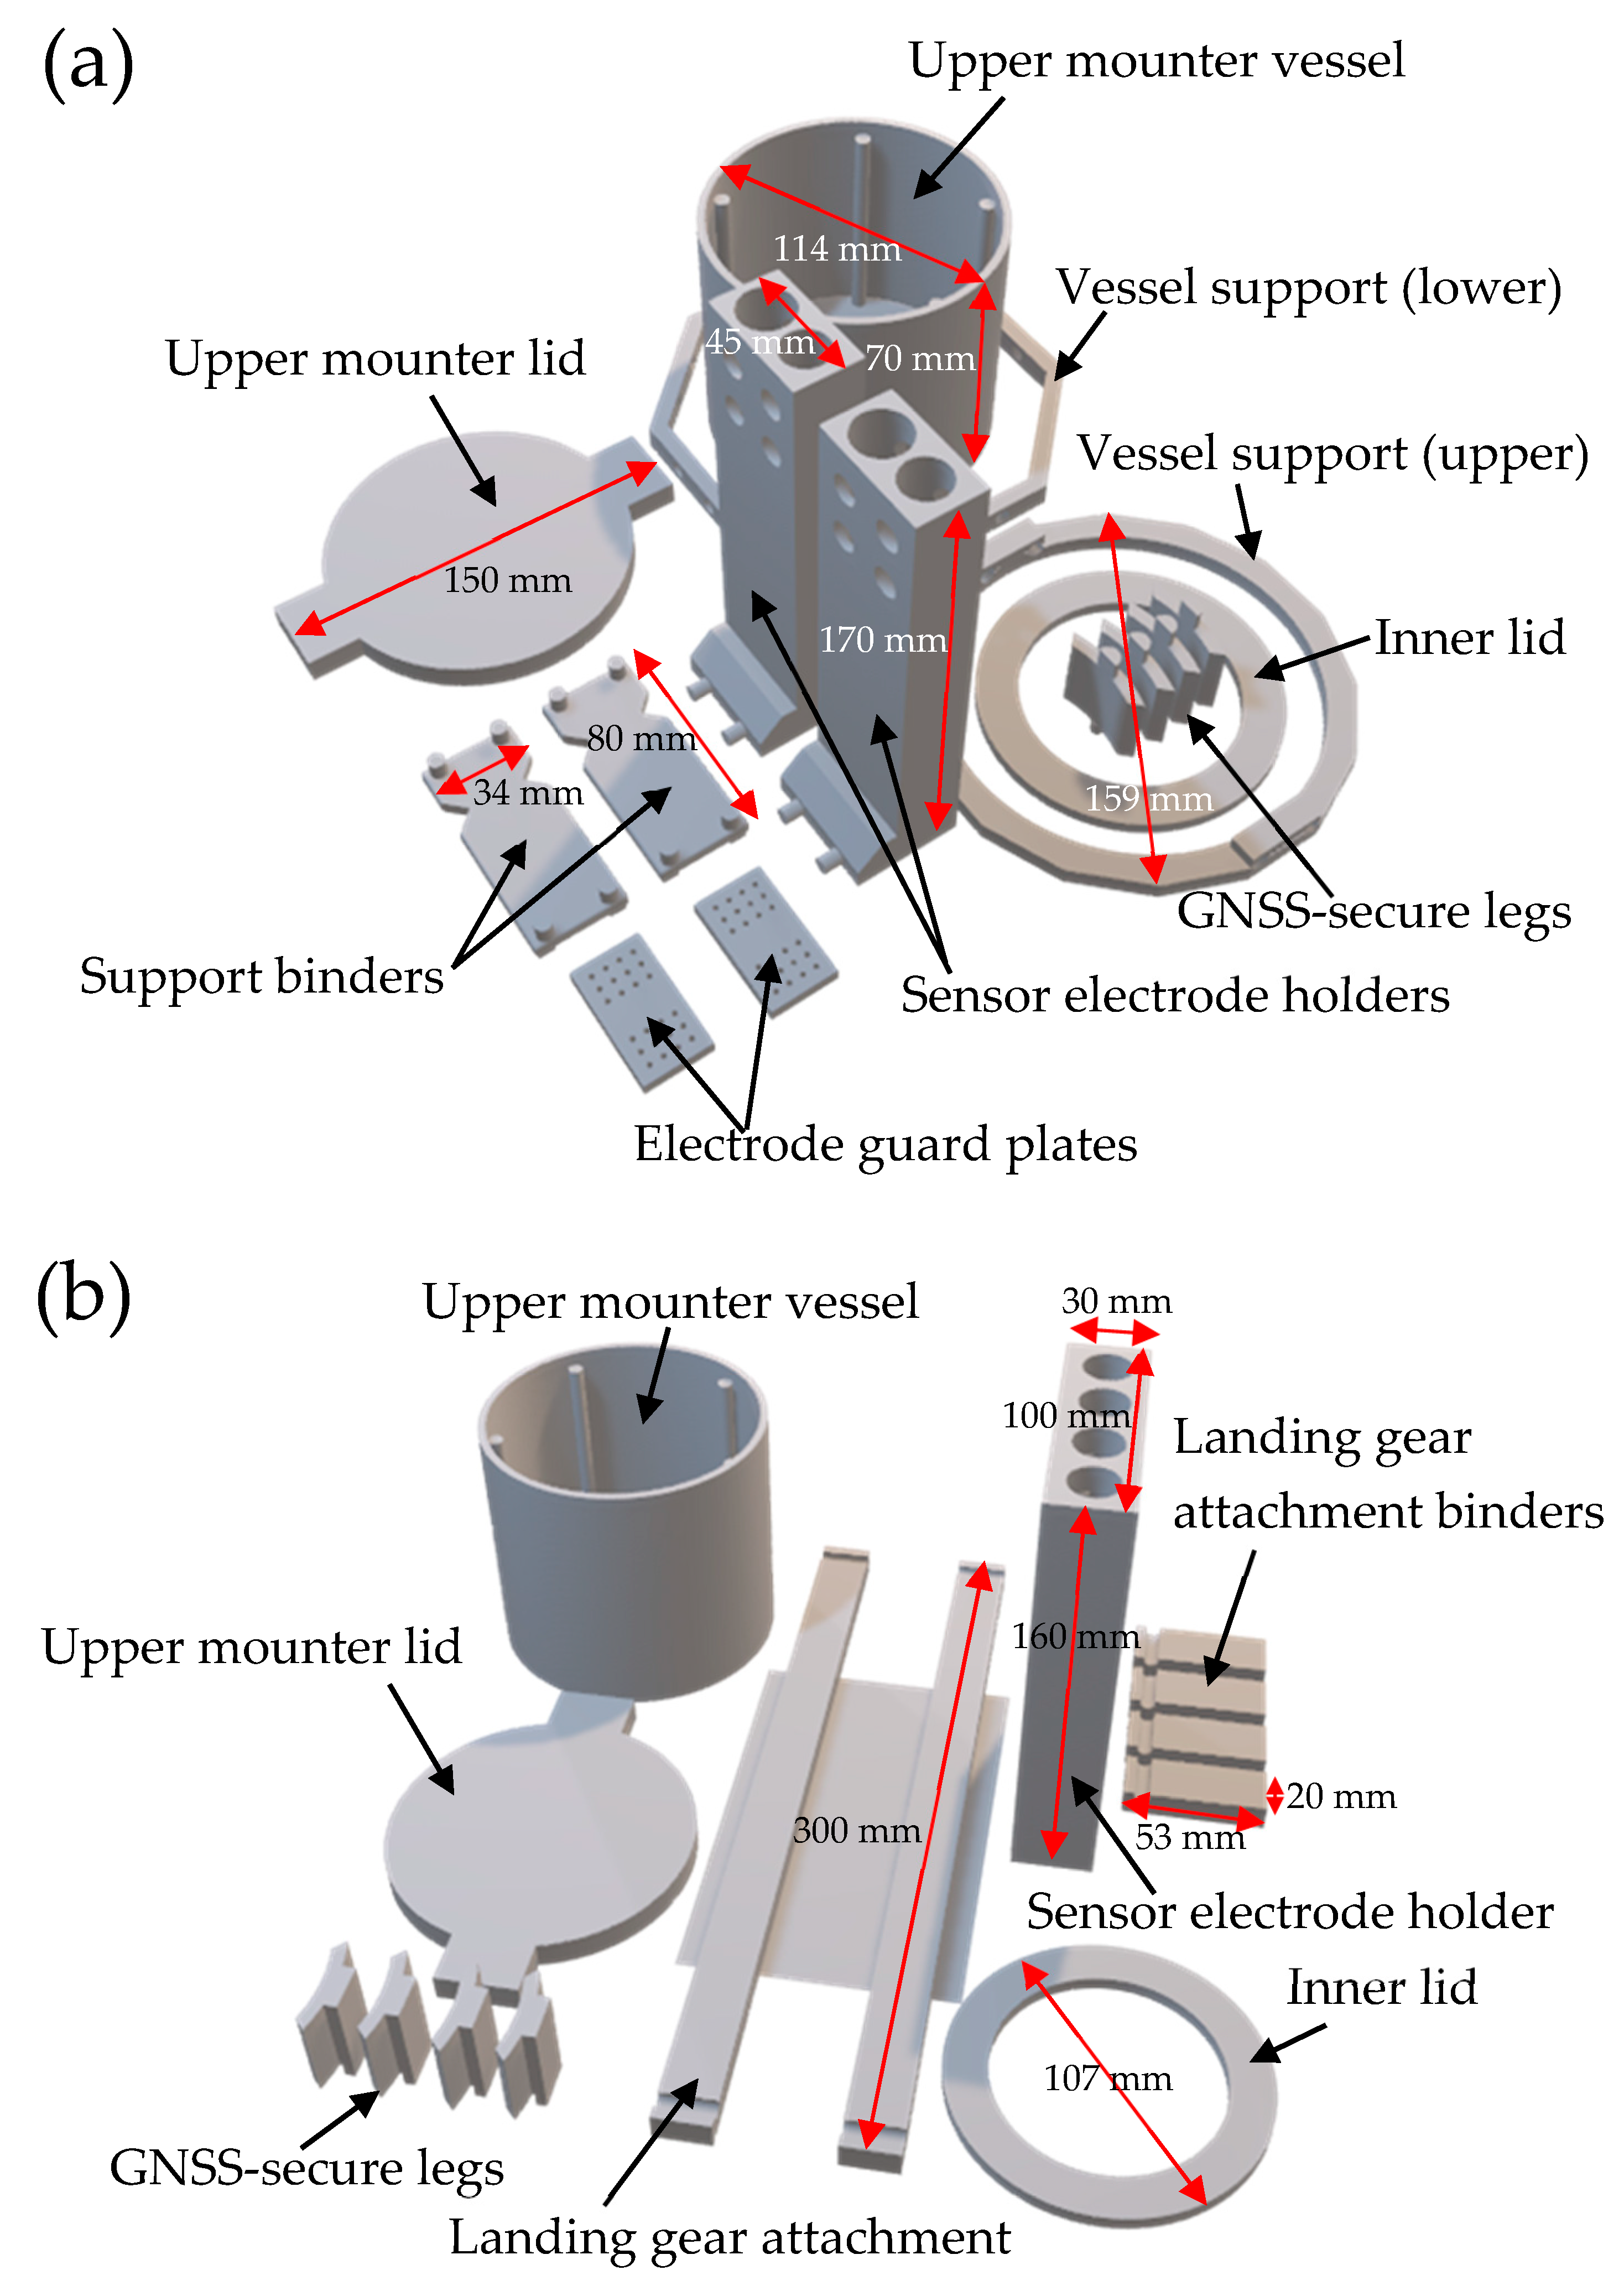
2.3. Drone Mounters for the Water Quality Monitoring System

The mounter for the developed water quality sensors (Figure 4) was produced using a fused deposition modeling (FDM) 3D printer (EnderTM-5 plus; Shenzhen Creality 3D Technology Co., Ltd., Shenzhen, China) with a reinforced polylactic acid (PLA) filament (PolymaxTM PLA; Polymaker LLC, Shanghai, China). The reinforced PLA filament was selected for reproducible output without sensitive care for the desiccation of filament, thermal equilibration during printing, etc. The 3D-computer-aided design (CAD) data files for the 3D printer were made using software (FreeCAD version 0.19; the FreeCAD team, 2021). The STL format 3D-CAD files were processed using slicer software (Creality Slicer ver. 4.8.2; Shenzhen Creality 3D Technology Co., Ltd., China) for the 3D printer. The wall thickness was set as 2 mm (10 lamination layers accumulated at 0.2 mm intervals) for water-tight vessels. Support material and raft-type bottom adhesion were used in the printing. For stable adhesion of the bottom of printing materials to the printing stage, stick glue was used on the surface of the printing stage. The respective temperatures of the printing nozzle and the printing stage were set as 230 °C (503 K) and 60 °C (333 K). The printing speed was set as 60 mm s−1. The infill ratio of the support material was 5%. The ratio of most of the mounter parts was 20%. The ratio was increased to 100% for parts used under mechanical stress (e.g., the lid and legs of the mounter). Each part of the mounter was printed separately and was fitted together after printing by a (formerly patented) LegoTM block-like joint structure (6 mm diameter). After removing the support/adhesion materials, the exposed wall of each vessel was coated with a silicone resin sealer (Bath BondTM Q; Konishi Co., Ltd., Osaka, Japan) for waterproofing. Nitrile butadiene foam rubber (10 mm thickness, approximately 30 in the Asker-C hardness) with closed cells was used as the gasket for sealing spaces around sensor cables in the lid of the water-tight vessels. A wedge for each cable was made on the gasket surface using a triangular bar file. After fitting the cables in the wedge of the gasket, a thin (1 mm thickness) spongy stick tape was placed on the cables. Then, the gasket was pressed with the lid of the water-tight vessel by screwing. These simplified procedures of sealing were chosen for vessels above the draft line of amphibious drones on water, in order to avoid exposing high-impedance sensors to additional noise (e.g., pH glass electrode sensor; susceptible to cable splicing (cutting and reconnection) for installing waterproof connectors) and to widen choices of external sensors. Variation in the connectors of sensors to the sensor regulators is expected to necessitate numerous waterproof sockets if the sockets are to be installed on the vessels.
To estimate the effects of the external system on the availability of the Global Navigation Satellite System (GNSS)-assisted flight control system, the Global Positioning System (GPS) accuracy indicator [18] of the drone was used. The indicator was associated with restricted flight in GPS mode [18]. For example, in the SplashDroneTM 4, <1 m of location error in the GNSS corresponds to the maximum value (10) of the indicator [18], which allows flight in GPS mode. The upper mounter was placed on the GNSS antenna of each drone. Legs for the upper mounter were used to maintain the GNSS accuracy as <1 m. The maximum elevation angle for the GNSS with the upper mounter was approximately 40°.

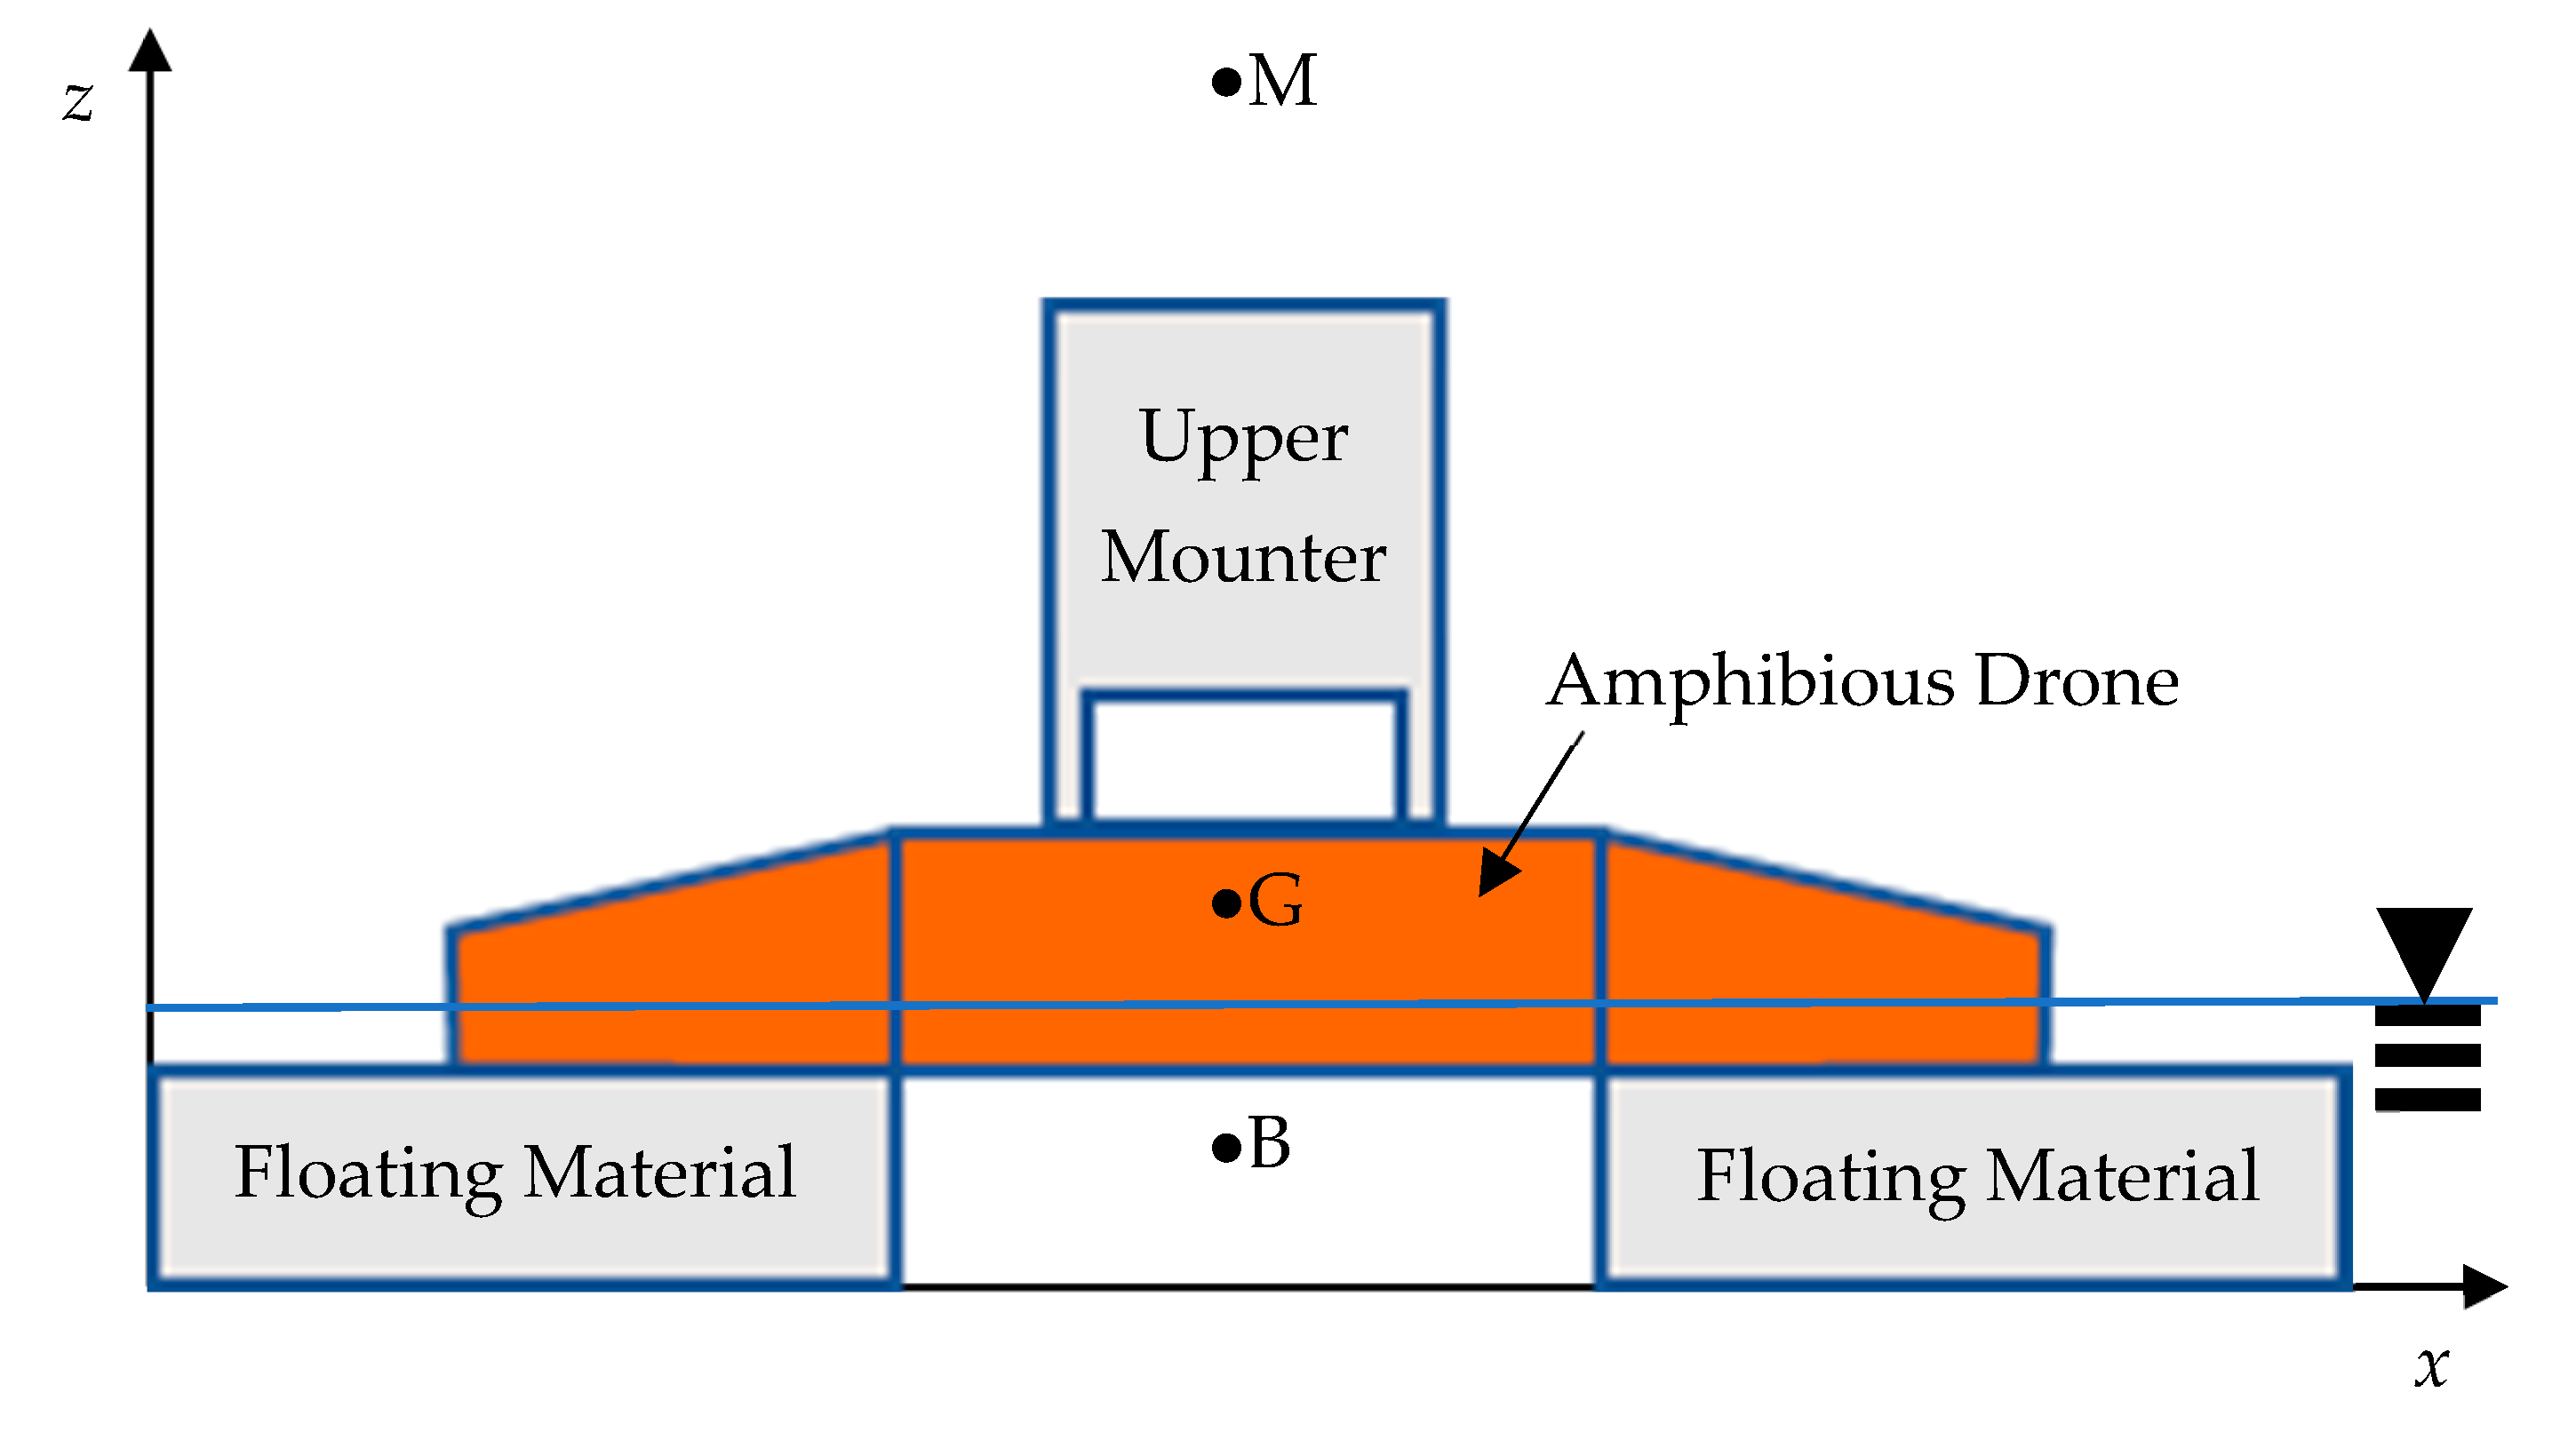
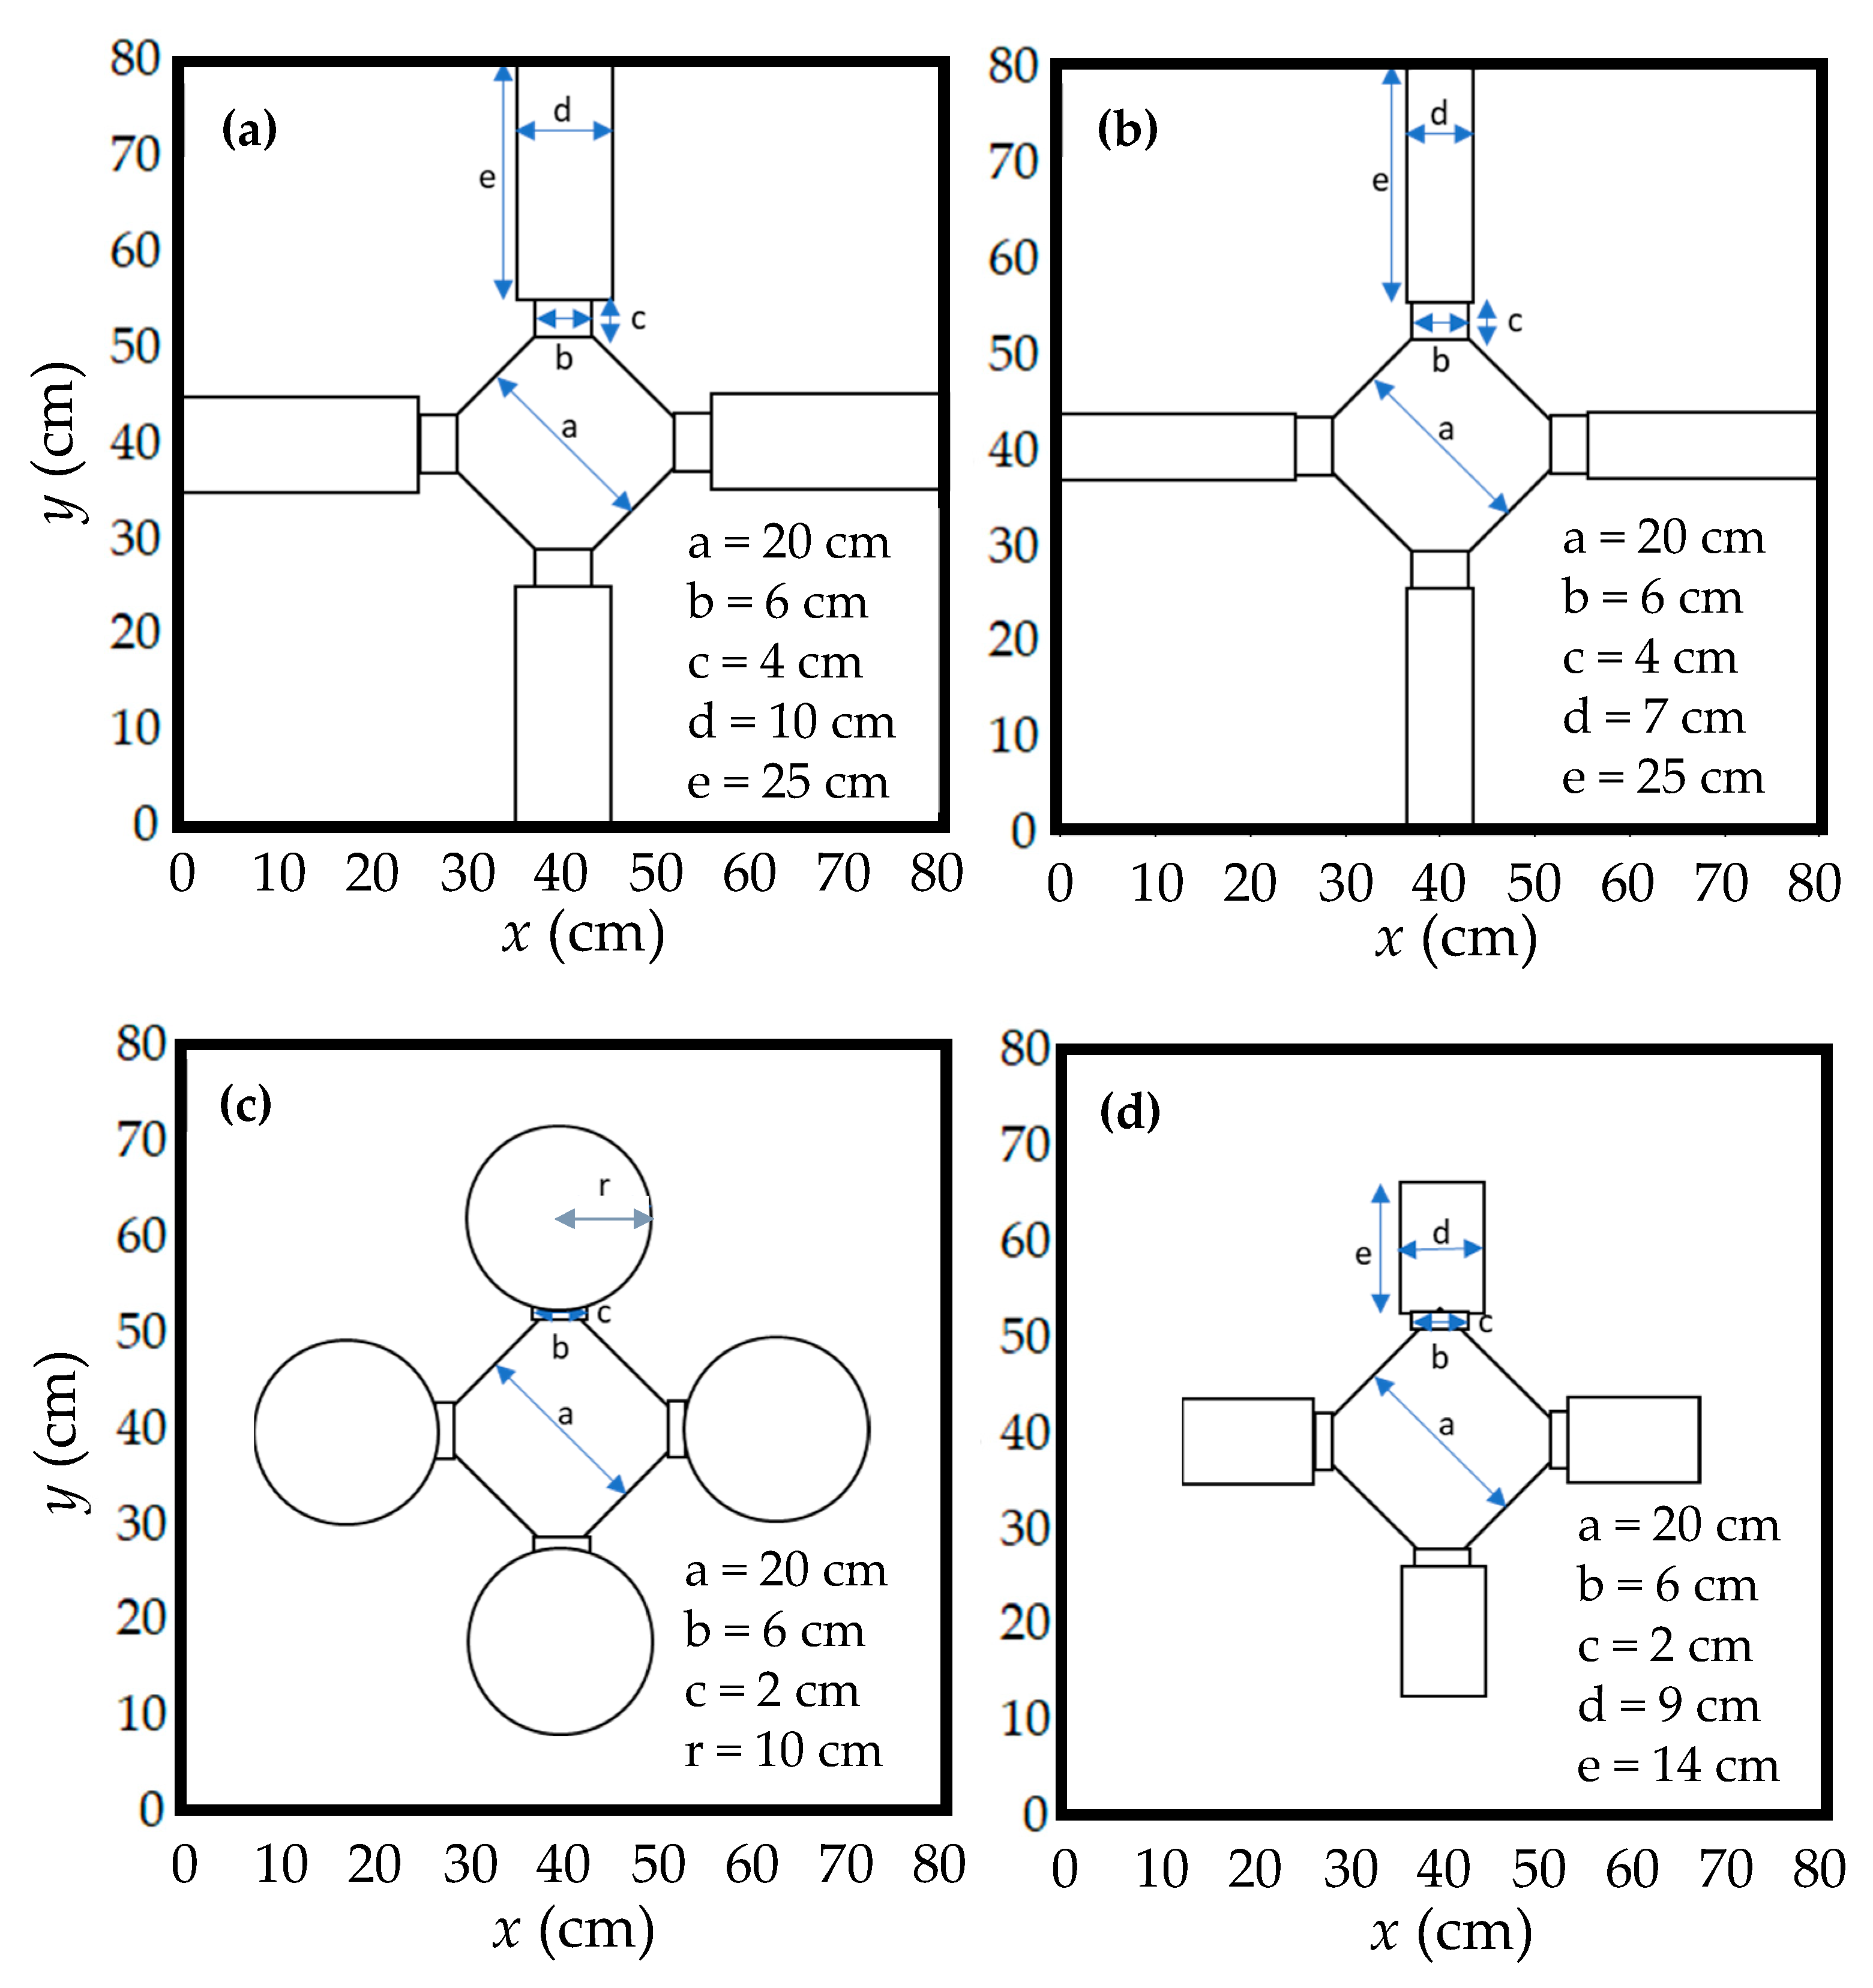
2.4. Preliminary Selection of a Reinforcing Float for the Amphibious Drone System

The amphibious drones that we used have a patented ability to flip automatically when overturned on water [18,26]. However, because even the genuine floats by the drone manufacturer were not compatible with the auto-flip technology, the drones were not confirmed to reorient themselves on the water when they were used with our external water quality monitoring system [18]. The genuine floats were designed for horizontal operations on water [18], but we were unable to operate the drone with the floats in the field with aqueous plants. We added some floating materials for the drones to increase the floating stability during vertical operations (Figure 5) as a simple way of ensuring the floating stability of amphibious drones. We tried to arrange the water quality monitoring system symmetrically in the horizontal section of the drones, but restrictions on the arrangement (e.g., antenna of the drone, battery slot, camera) caused some asymmetry within the range of the maximum payloads. We compared the floating stability of the water quality sensing amphibious drones with those of commercially available floating materials placed symmetrically below each drone (quadcopter) arm.
The amount of each float was estimated by minimizing the distance from the center of gravity to the center of buoyancy of the drone system (Figure 5). The metacentric height [27] H (Equation (1)) of the drone system should also be controlled (e.g., >0.15 m [27]) to maintain its position against reverting force [28]. Therefore, we tried to extend each drone arm to increase the inertial area moment within the range of shear strength of the float against the forces in a splashdown.
H = I V L
In that equation, I stands for the second moment of area of the horizontal section for the minor (weak) axis (m4), V signifies the volume of displaced water (m3), and L denotes the distance from the center of gravity to the center of buoyancy (m). In the worst case of floating stability of the present study, in which the maximum payload is placed above the drone while the floats push up the drone above the water as high as 7 cm, L extends to 0.1 m, but H is higher than 0.15 m with each of the candidate floating materials. The estimated H values by a simplified top view (horizontal view) for the respective floats (Figure 6) were (a) 0.91 m, (b) 0.62 m, (c) 0.80 m, and (d) 0.18 m at V = 0.0042 m3 (4.2 L, for 4.2 kg maximum flight weight at 1.0 kg L−1 density of water). The increase in the inertial area moment by the drone arm extension avoids capsizing the amphibious drone on water. The actual floating stability was confirmed by a harsh splashdown on the waters using the tension of the tethering thread connected to the drone. The floating stability test was carried out on flat water where few aquatic (rooting) plants grew because surface plants would complicate the floating stability evaluation. We presumed that the system would only experience vertical splashdown and take-off.

2.5. System Stability Evaluations

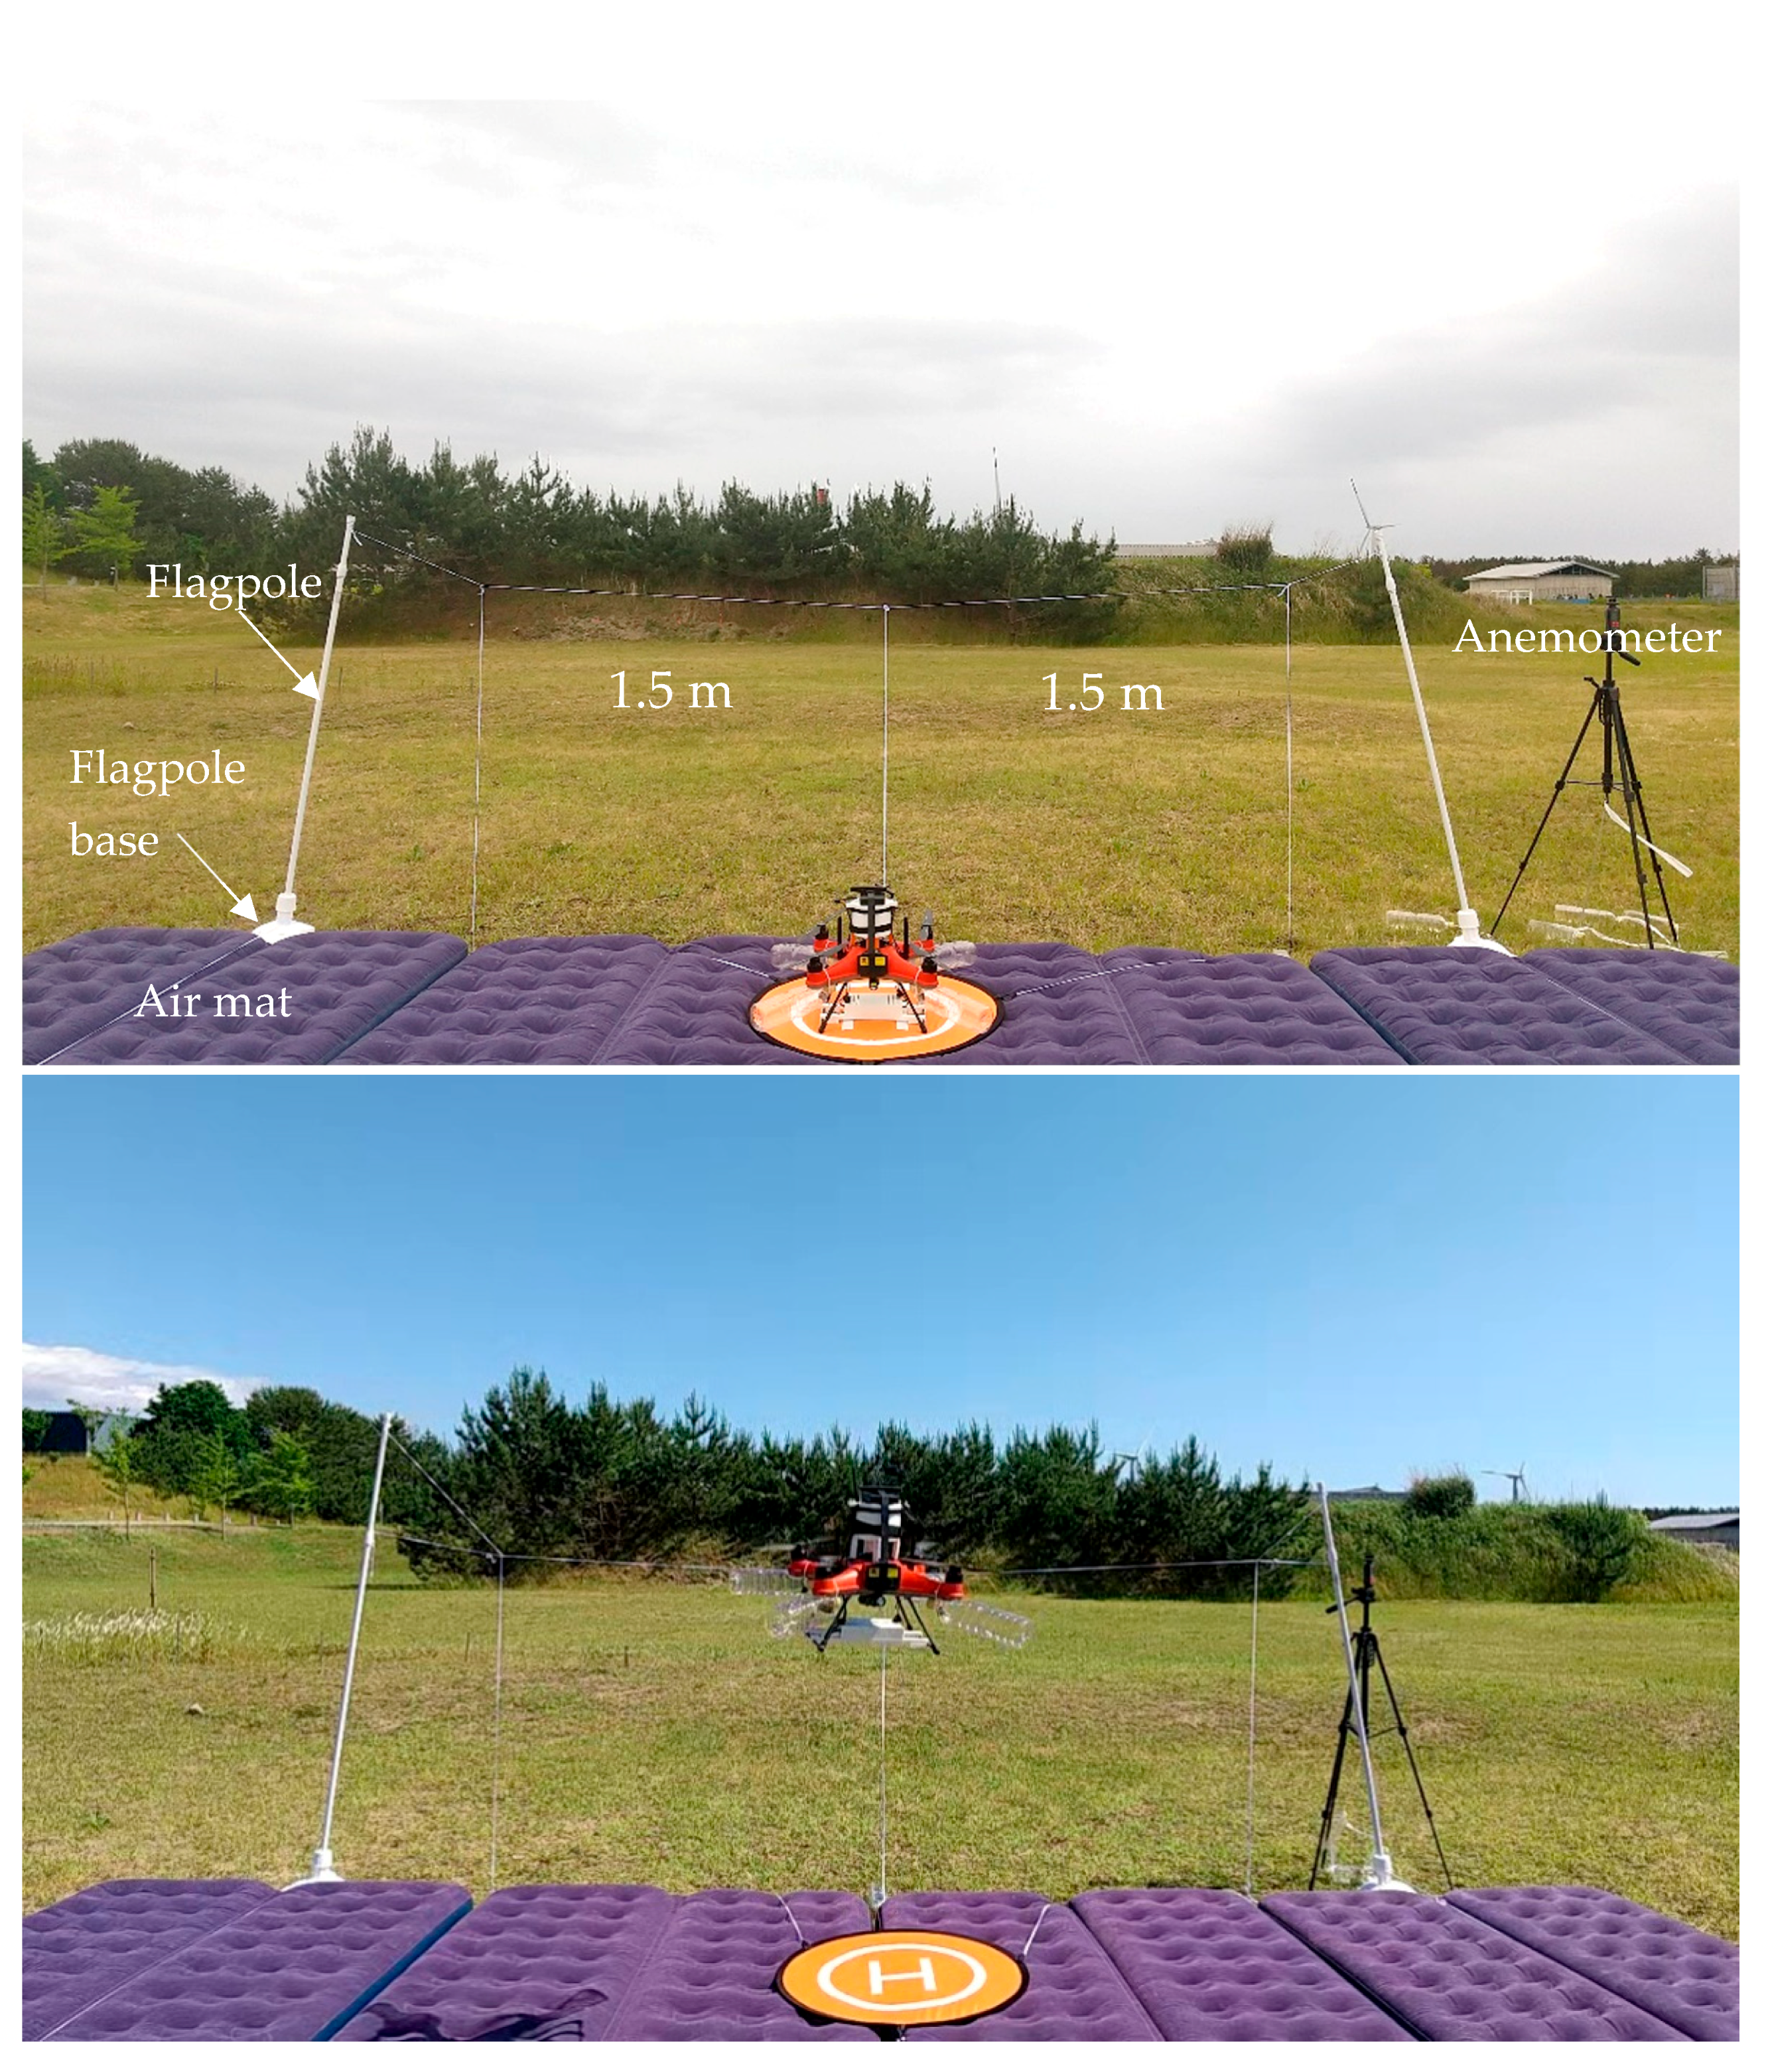
2.5.1. Flight Stability Test

To evaluate the drone flight stability for use with water quality measurement systems, flight stability testing was carried out (Figure 7). We measured the time to deviate from the center of a 3 m line during hovering stability tests (Figure 7). We did not control the drones with the aileron until time measurements were completed. Therefore, we excluded effects of individual flight skills on lateral flight stability evaluation.
To simplify the flight stability evaluation procedures, the throttle and the elevator of the controller were used for manual adjustment of the hovering location. The initial location of the drone at each test was the center of the 3 m line at 1.5-meter height above the ground mat (four sheets of loosely filled air mat with 22 cm thickness and a landing pad at the center) (Figure 7). The test line was demarcated with a soft rubber string tightened on two flagpoles supported by the flagpole bases (8 kg) (Figure 7). Each of the two vertical lines indicating 1.5 m of deviation from the center was made by suspending a soft string with a square water bottle as a plumb. The vertical soft strings were used to detect deviation of the drone from the test line. The calibration steps provided by the manufacturer’s manual (i.e., compass calibration, gyro sensor calibration, accelerometer calibration or inertial measurement unit calibration) were followed before starting the test. After those calibrations, >15 min of waiting time was added to confirm stable GNSS data reception. Hovering time without the water quality sensor systems was measured before starting the test. If the measured time was reduced by >10% (reduced hovering stability), then the drone was recalibrated before testing. We used the GPS (actually used both GPS and GLONASS) mode of the drones. The leg height of the upper mounter was optimized by referring to the GPS quality indicator of the drone system to maintain less than 1 m accuracy of the GPS positioning. A wind-cup-type anemometer (CHE-WD2; Sanwa Supply Inc., Okayama City, Japan) was used for measuring the average wind speed during hovering stability tests. The measured hovering time values were classified under five grades of average wind speed based on the Beaufort scale (<0.5, 0.5–1.5, 1.6–3.3, 3.4–5.5, and 5.6–7.9 m s−1). The test was canceled when the average wind speed exceeded 8.0 m s−1 (the maximum limit specified in the SplashDroneTM 4 manufacturer’s manual [18]). We compared the hovering stability with additional floating materials for stable floating on water.

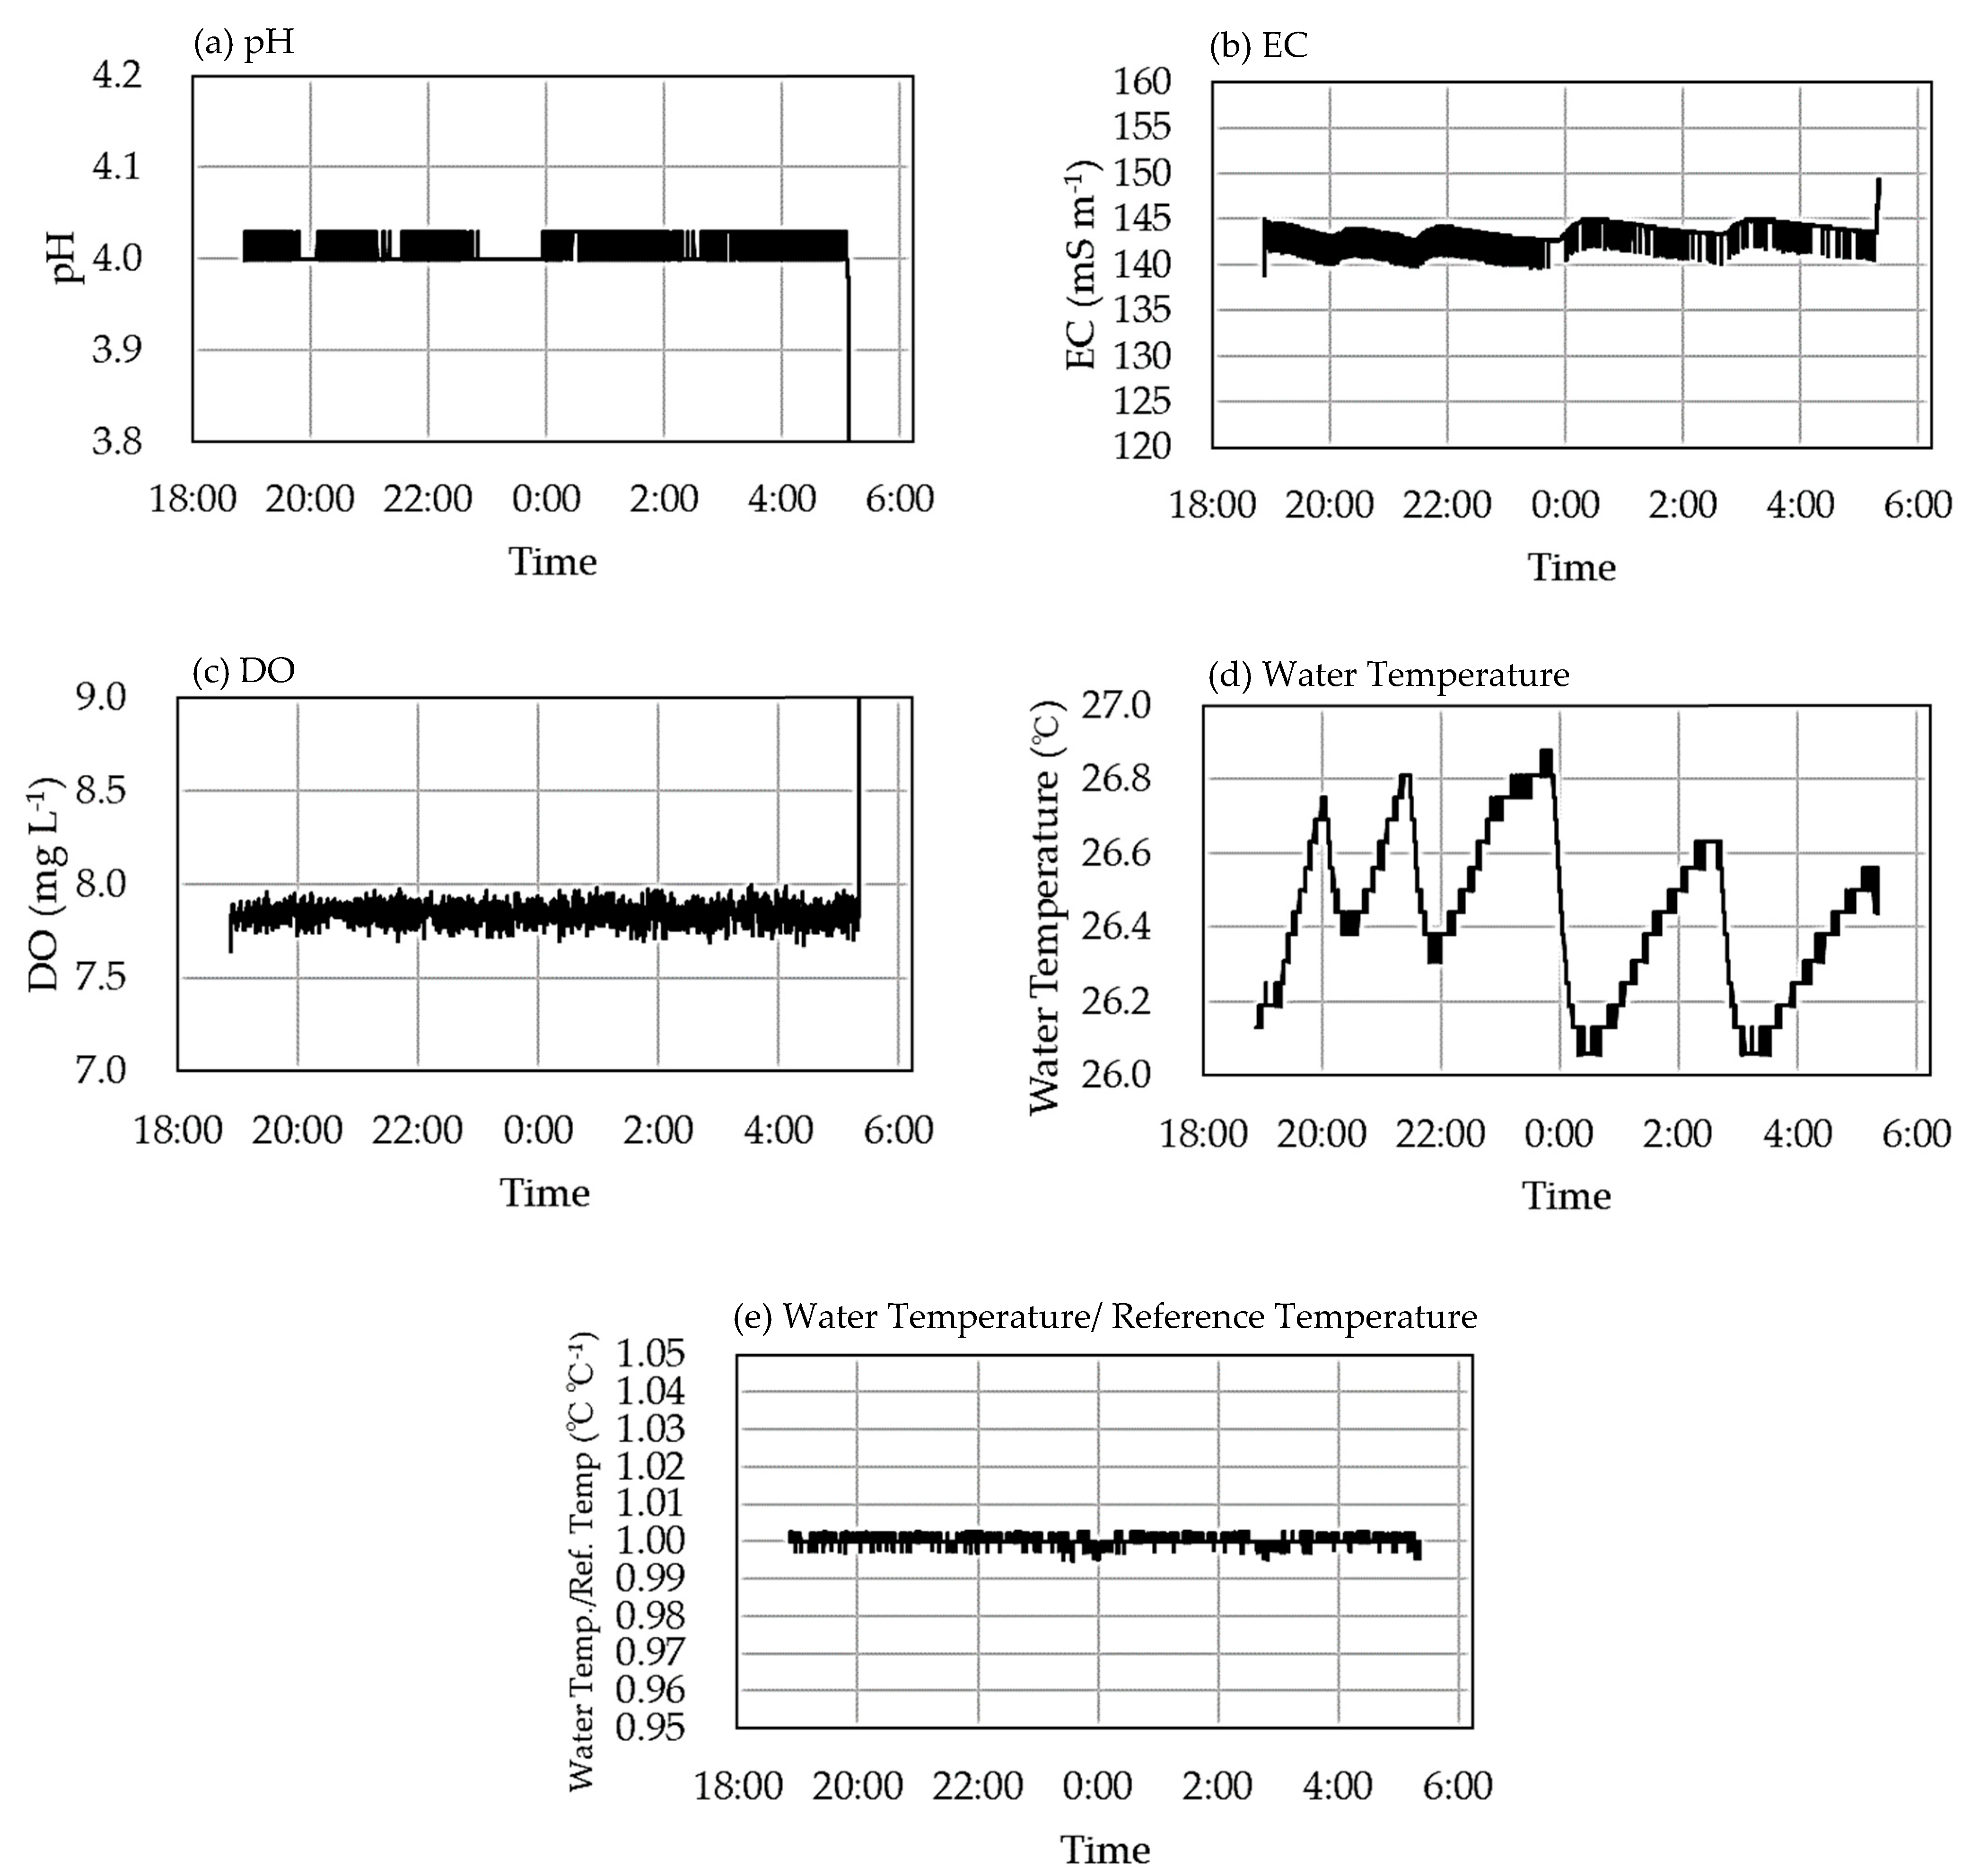
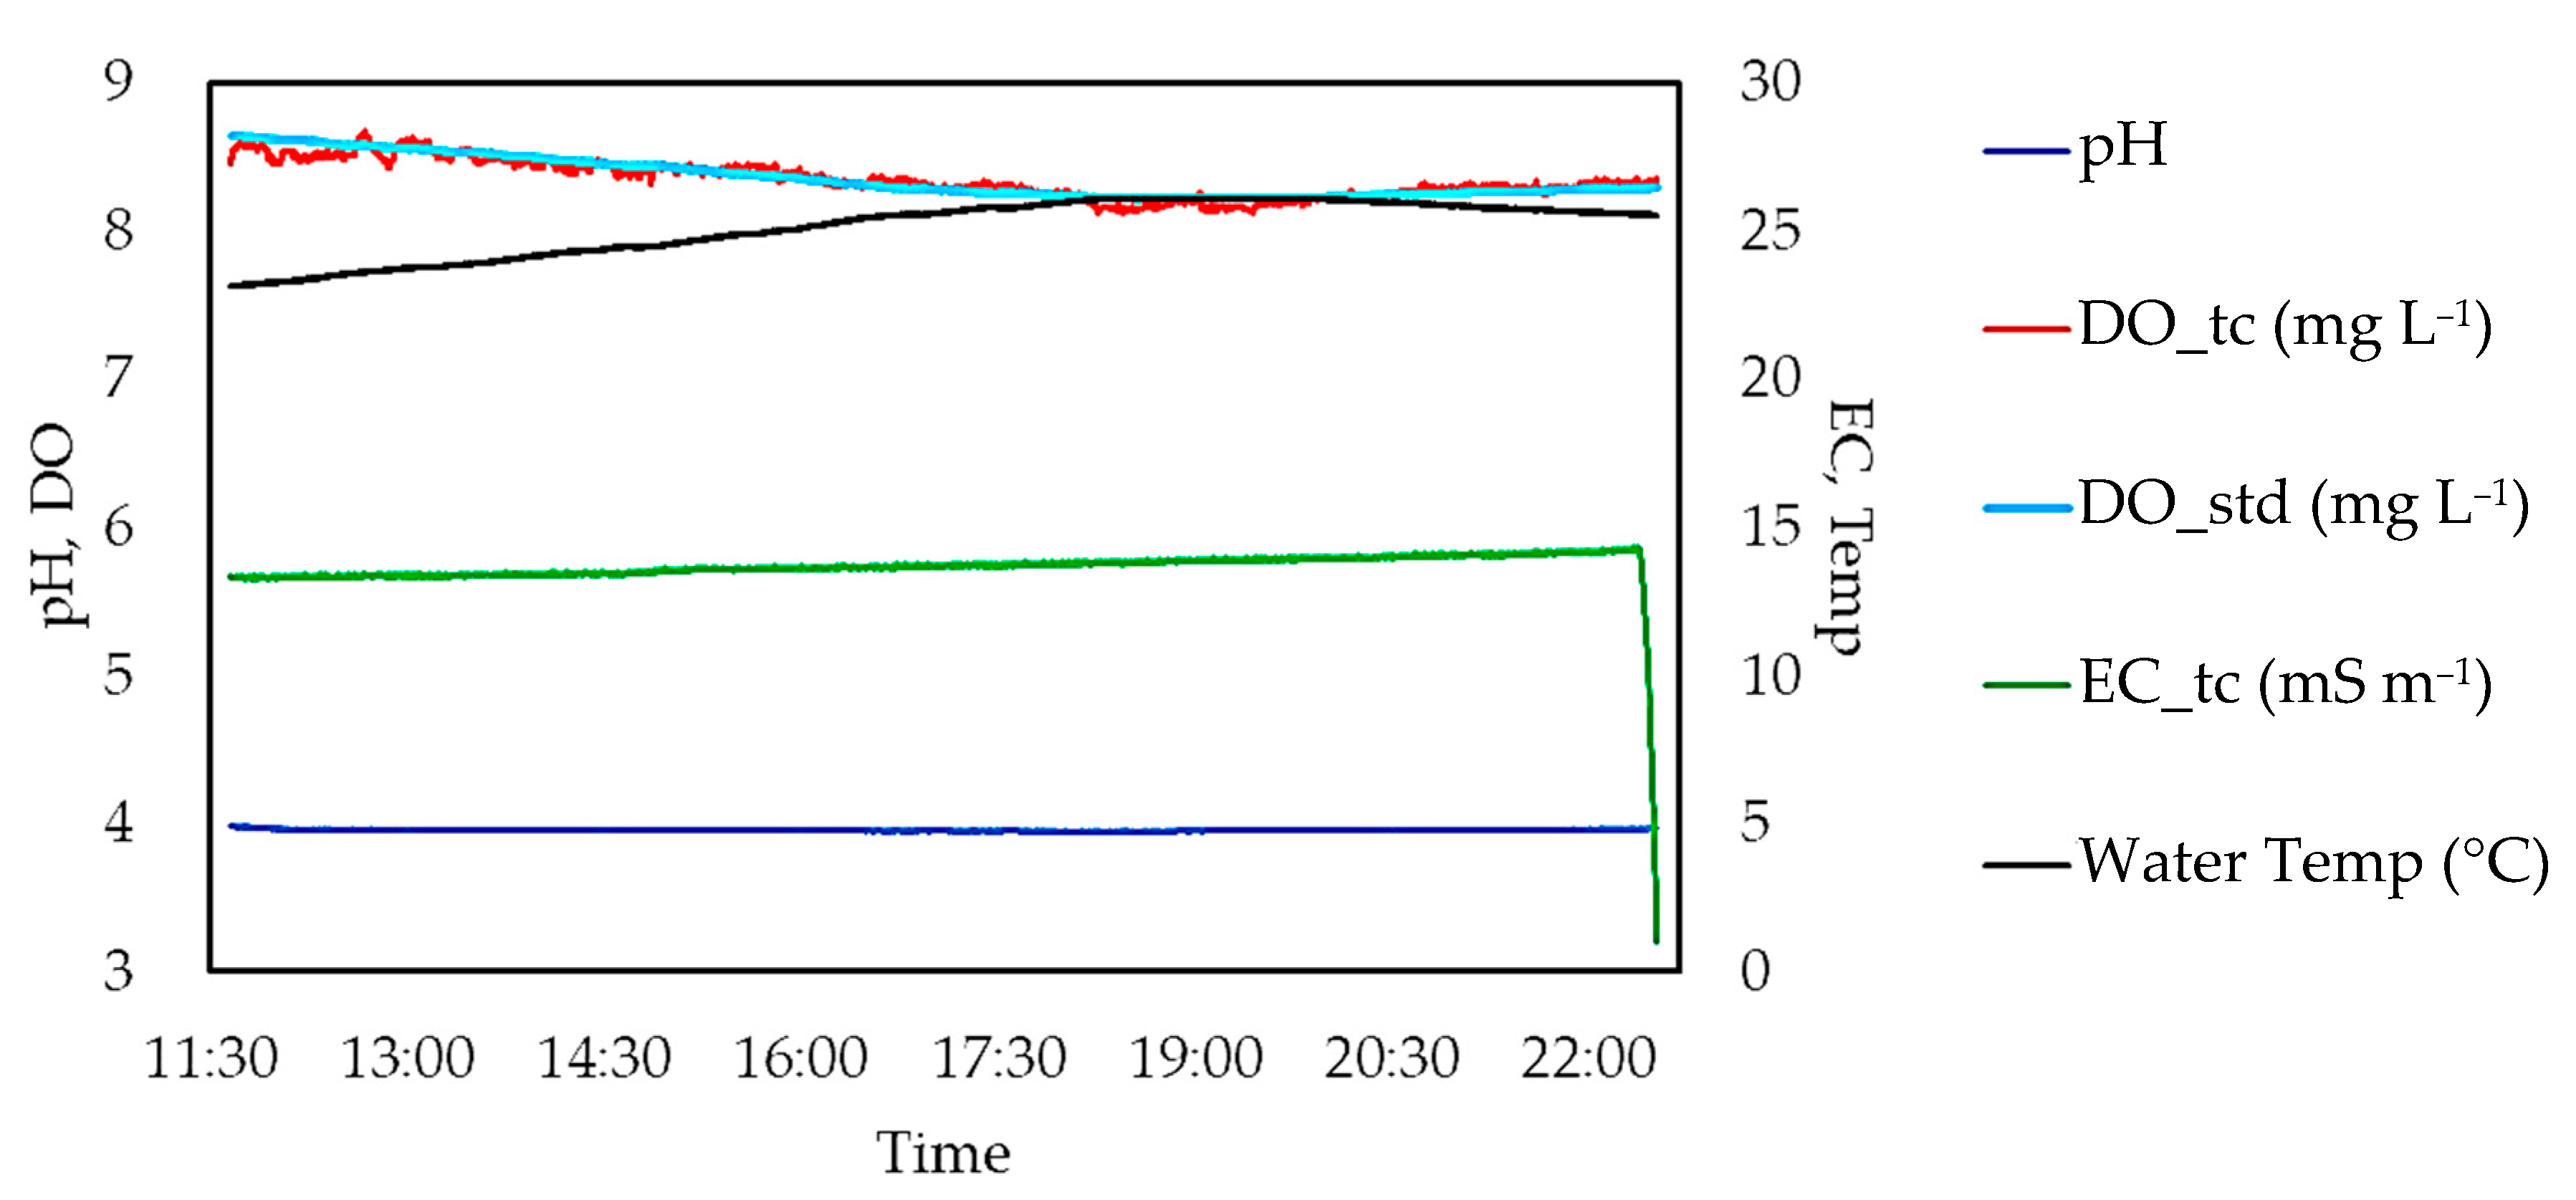
2.5.2. Water Quality Data Stability Test

To confirm the stability of water quality data from this system with fluctuating battery voltage, we measured the water quality data (pH, EC, DO, and water temperature) with a fully charged nickel–metal hydride (Ni-MH) battery set (six cells of a serially connected AA-type battery, eneloopTM BK-3MCC; Panasonic Corp., Osaka, Japan). Each of the pH and EC sensors was immersed in a standard-solution (pH 4.01 or EC 1.41 dS m−1) bottle (approximately 5 mL) with a water-tight screw cap. For the SplashDroneTM 4 system, the EC sensor was immersed directly in tap water for freshwater monitoring. The DO sensor was placed in approximately 1 L of circulating tap water with continuous aeration at approximately 1.5 L min−1 of bubbling in an external circulator vessel and approximately 2.4 L min−1 of circulation for more than 15 min. The water temperature sensor and the water-tight bottles for pH and EC measurement were also immersed in the same water. The water temperature values with the batteries were validated with the same measurement with a continuous power source (9.0 V DC output converted from 100 V AC domestic power source with an AC/DC adapter, GPE018A-090100-6; Succul Co., Ltd., Okayama City, Japan). Atmospheric pressure, relative humidity, and air temperature were measured using an atmospheric sensor (SEN-15440; SparkFun Electronics Inc., United States) with a continuous power source (via the USB port of a laptop computer connected to 100 V AC domestic power source) for estimating the saturated DO concentration and evaluation of stability in water temperature measurements. The data were recorded using computer software for real-time data/message visualization and storage (Processing Grapher ver. 1.3.5; Simon Bluett) or using Tera Term ver. 4.106 (TeraTerm Project) at approximately 10 s intervals. The time to 5% deviation from temperature-corrected reference values by depleting the battery was measured as the lifetime of the system per power charge. Before starting the test, each water quality sensor was calibrated using the standard solutions.

2.6. Evaluation of the Efficiency of Hovering Relay by Networking Metrics

Each of the two amphibious drone systems measured water quality data and transmitted the relevant data to the receiver system. In the API-router mode of the XBeeTM, each XBeeTM chip on the drone relays the data received from other XBeeTM chips to the receiver system with a coordinator XBeeTM chip.
Before testing the system in actual water bodies, the data relaying efficiency of the system was examined by a hovering relay test. The test was conducted on 12 December 2023, in a flat field at Akita Prefectural University (Akita Campus), Japan. No tall grasses were present in the field on the test date. The weather during the test was cloudy, with a wind speed of 3–4 m s−1 and an air temperature of 5–6 °C (278–279 K). The distance between the transmitter drone and the receiver was approximately 100 m. The locations of the devices were confirmed with a controller of the SplashDroneTM 4 (±1 m accuracy, at the accuracy level 10 [18]). The relayer drone was positioned at the center of the line between the transmitter drone and the receiver. Networking metrics (throughput, Received Signal Strength Indicator: RSSI; Packet Delivery Ratio: PDR) were measured both with and without the relayer drone hovering at a height of around 3 m. The payload for measuring networking metrics was fixed at 20 bytes and utilized in loopback mode. The test duration for the throughput test was set as 60 s for the rapid environmental monitoring with drones, and the transmit timeout was set as 10 s for a measurement of water quality at 10 s intervals. In the range test (RSSI and PDR test), 60 packets were sent for each test. Each packet was to be sent ideally at 1000 ms intervals, but the receiver timeout was set as 10 s for consistency with the following field tests. The XBeeTM antenna height of the relayer drone in the landing state was 44 cm and that of the transmitter drone was 45 cm. The receiver XBeeTM antenna height was 12 cm. The baud rate was fixed at 9600 to ensure compatibility with the water quality monitoring system operating at low rates.

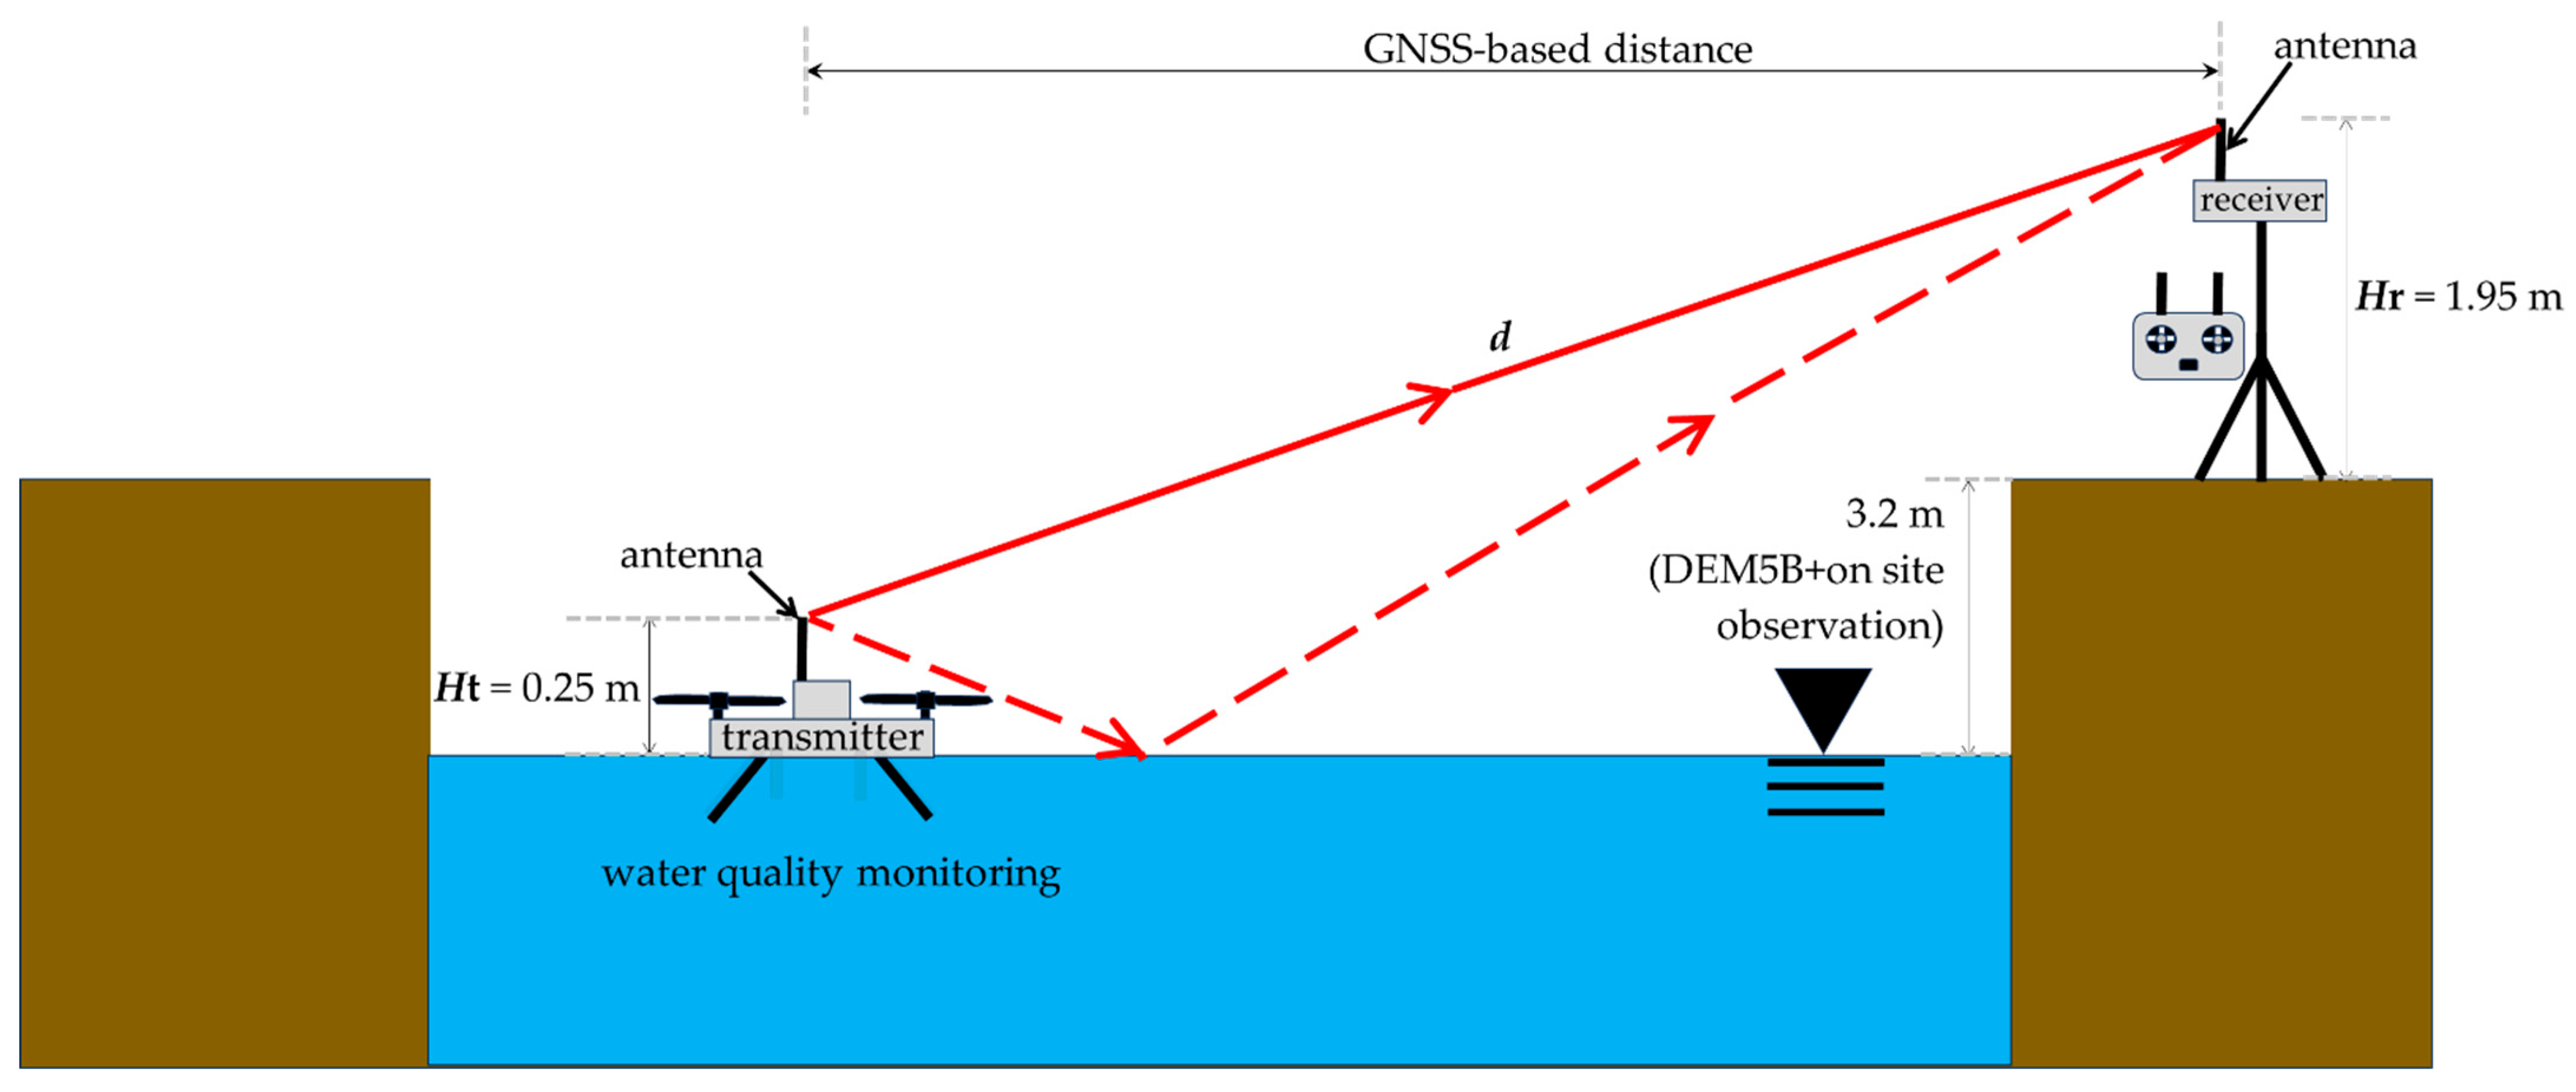
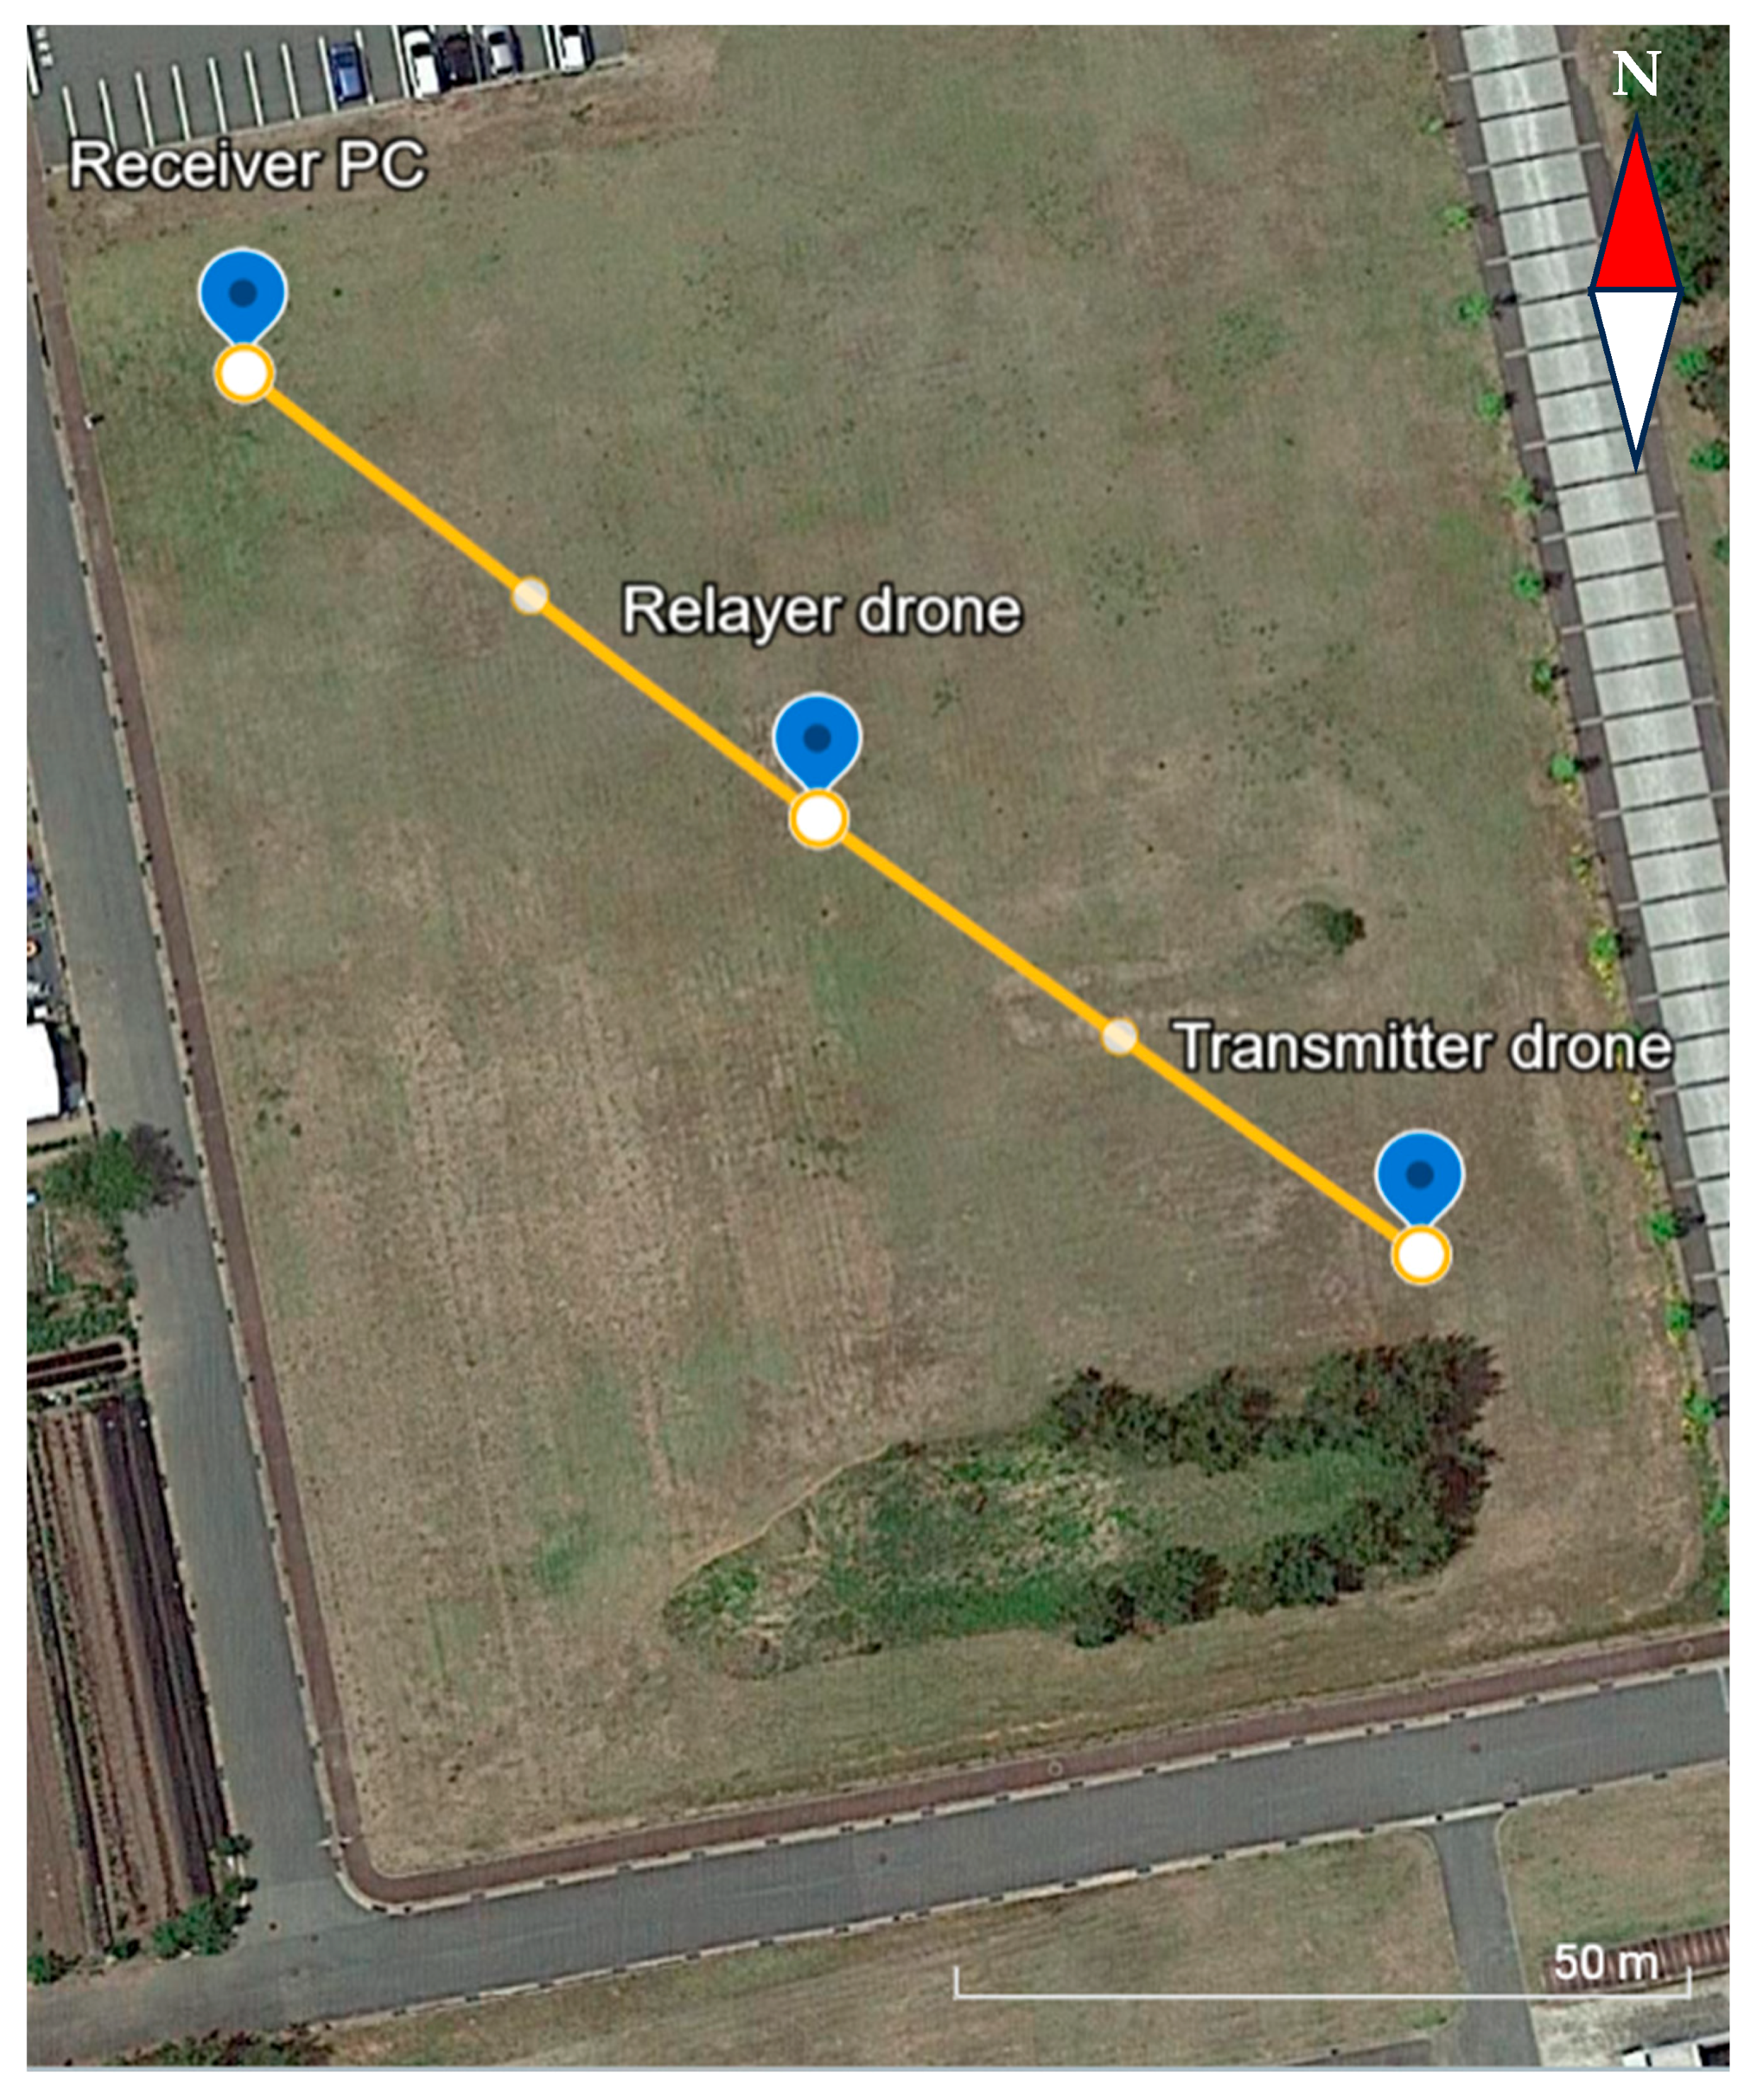
2.7. Field Tests for the Wireless Data Relay

To examine the capabilities for wireless data transfer of the water quality monitoring system with the XBeeTM chips, two amphibious drones were prepared with the water quality monitoring system and the data receiver system (Figure 8 and Figure 9).
The demonstration experiment was conducted on a large marsh pond with shoreline vegetation (2 m maximum depth, 0.3 km2; Ogata Marsh Pond in Akita Prefectural Koizumigata Park) in Akita, Japan, where most of the water surface is ideally able to be covered using a single amphibious drone (a 500 m radius semicircle). The transmitter drone (SplashDroneTM 3+ system) was placed on the nearshore water with the minimum reinforcing float (Figure 6d); then, the relayer drone (SplashDroneTM 4 system) was brought to the offshore site for data relay to the receiver. The transmitted EC data were zero-filled for the high-concentration range sensor of the SplashDroneTM 3+ system (DFRobotTM EC sensor) because of the low electrical conductivity of the pond water. The receiver was set on a portable tripod (SLIK GX-m 7500; Kenko Tokina Corp., Tokyo, Japan) of 1.8 m height (60% of the Fresnel radius at 2.4 GHz for communication through 300 m of presumed line of sight to a drone). The receiver was located on an elevated (approximately +3.5 m by the Digital Elevation Model 5B (DEM5B), Geospatial Information Authority of Japan) site to increase the allowable distance in wireless communication, but the antenna height of the drone on the water was approximately 0.25 m. The drone and receiver locations were determined using the basic two-ray multipath model applied for earlier studies [19,20,21]. Data relay tests were conducted for (1) extending relay (19 July 2023, cloudy with occasional rain) and (2) bypassing relay for shoreline vegetation (27 September 2022, cloudy with occasional sun). The data relay was attempted for both floating and hovering states (<10 m above the drone controller) of the relayer drone. The use of other wireless communication tools (e.g., smartphone, 5W transceiver) was avoided during the drone flight. A waterproof (IP68) flashlight (Wuben L50; Shenzhen Shengqi Lighting Technology Co., Ltd., Shenzhen, China) was used to confirm the drone direction visually. The interval for water quality measurements was set as 7.0 s for the bypassing relay test, but the interval was extended to 10 s for stable communication in the extending relay test. The exact location of the transmitter in the extending relay test was adjusted by approaching the shoreline vegetation (approximately 2 m adjustment to disable the direct wireless communication).
After a gentle splashdown of the amphibious drone system on water, stable readings for pH, EC, and water temperature were awaited. The first complete set of readings after splashdown was used for DO because of the internal oxygen consumption by the sensor electrode. Manual sampling measurement of nearshore water was also conducted with portable water quality meters (WM-32EP; DKK-TOA Corp., Tokyo, Japan and HQ30d; Hach Co., Milwaukee, WI, USA). We presumed that the operational flight time of these drones with a fully charged battery was less than 10 min in the field tests because of the water quality sensor system payload and the repeated splashdown and flying from the water. The communicable distance over the flat freshwater surface in low-altitude connections (reflection coefficient ≈ −1.0, total external reflection) was estimated simply based on Equations (2) and (3) [19,20] (Figure 10).
P a = P t λ 4 π d 2 G t G r
P r = 4 P a sin 2 π H t H r λ d 2
where Pa is the received power transmitted through the air (W), Pt is the transmitter power (W), λ is the wavelength (m), d is the transmitted distance (m), Gt is the gain of transmitter antenna (2.1 dBi = 1.62), Gr is the gain of receiver antenna (2.1 dBi = 1.62), Pr is the received power (W), Ht is the height of transmitter antenna (m), and Hr is the height of receiver antenna (m).

2.8. Legal Procedures for Field Tests

Possible legal registrations for drone flights might be a salient concern for this type of application. We tried to minimize legal procedures by optimizing the system design for water quality monitoring. Therefore, our system did not include requirements for any of the following: (a) throwing objects from drones, (b) hanging objects in flight, (c) high- power radio wave outputs for communication, (d) exceeding 25 kg of weight in flight, or (e) payload including toxic substances. We registered the drones through the Japanese Drone/UAS Information Platform System (DIPS) as a type of drone with 0.100–25 kg flight weight. The rules set by the manager of Akita Prefectural Koizumigata Park were followed. Notification of the flight was made before the flight tests.

3. Results

As described herein, the results of the system stability evaluations for flight characteristics and water quality data are presented concisely as core processes of the development of the amphibious-drone-based system for surface water quality monitoring. Subsequently, we present detailed results of field tests of the wireless data relay using two amphibious drone systems.

3.1. System Stability Evaluations

3.1.1. Flight Stability Test

The floats attached to the drone reduced the stable hovering time (Table 1). The hovering durations controlled within a ±1.5 m y-axis range were 34 ± 6 s for PET bottles, 14 ± 1 s for polystyrene foam bars, and >180 s for the base drone (Beaufort wind force scale 2–3, Table 1). In contrast, the results obtained using these floats were similar to those obtained under light wind conditions (Beaufort wind force scale 1–2, Table 1). With the disk-type floats (Figure 6c, for the highest floating stability among the candidate floats), the drone was unable to reach the test height (1.5 m). During the test, the GNSS accuracy indicated on the SplashDroneTM 4 controller [18] was 10 (<1 m location error), irrespective of the partially shaded (up to 40° of elevation angle) GNSS antenna by the upper mounter. The PET bottle floats were selected for subsequent field tests.

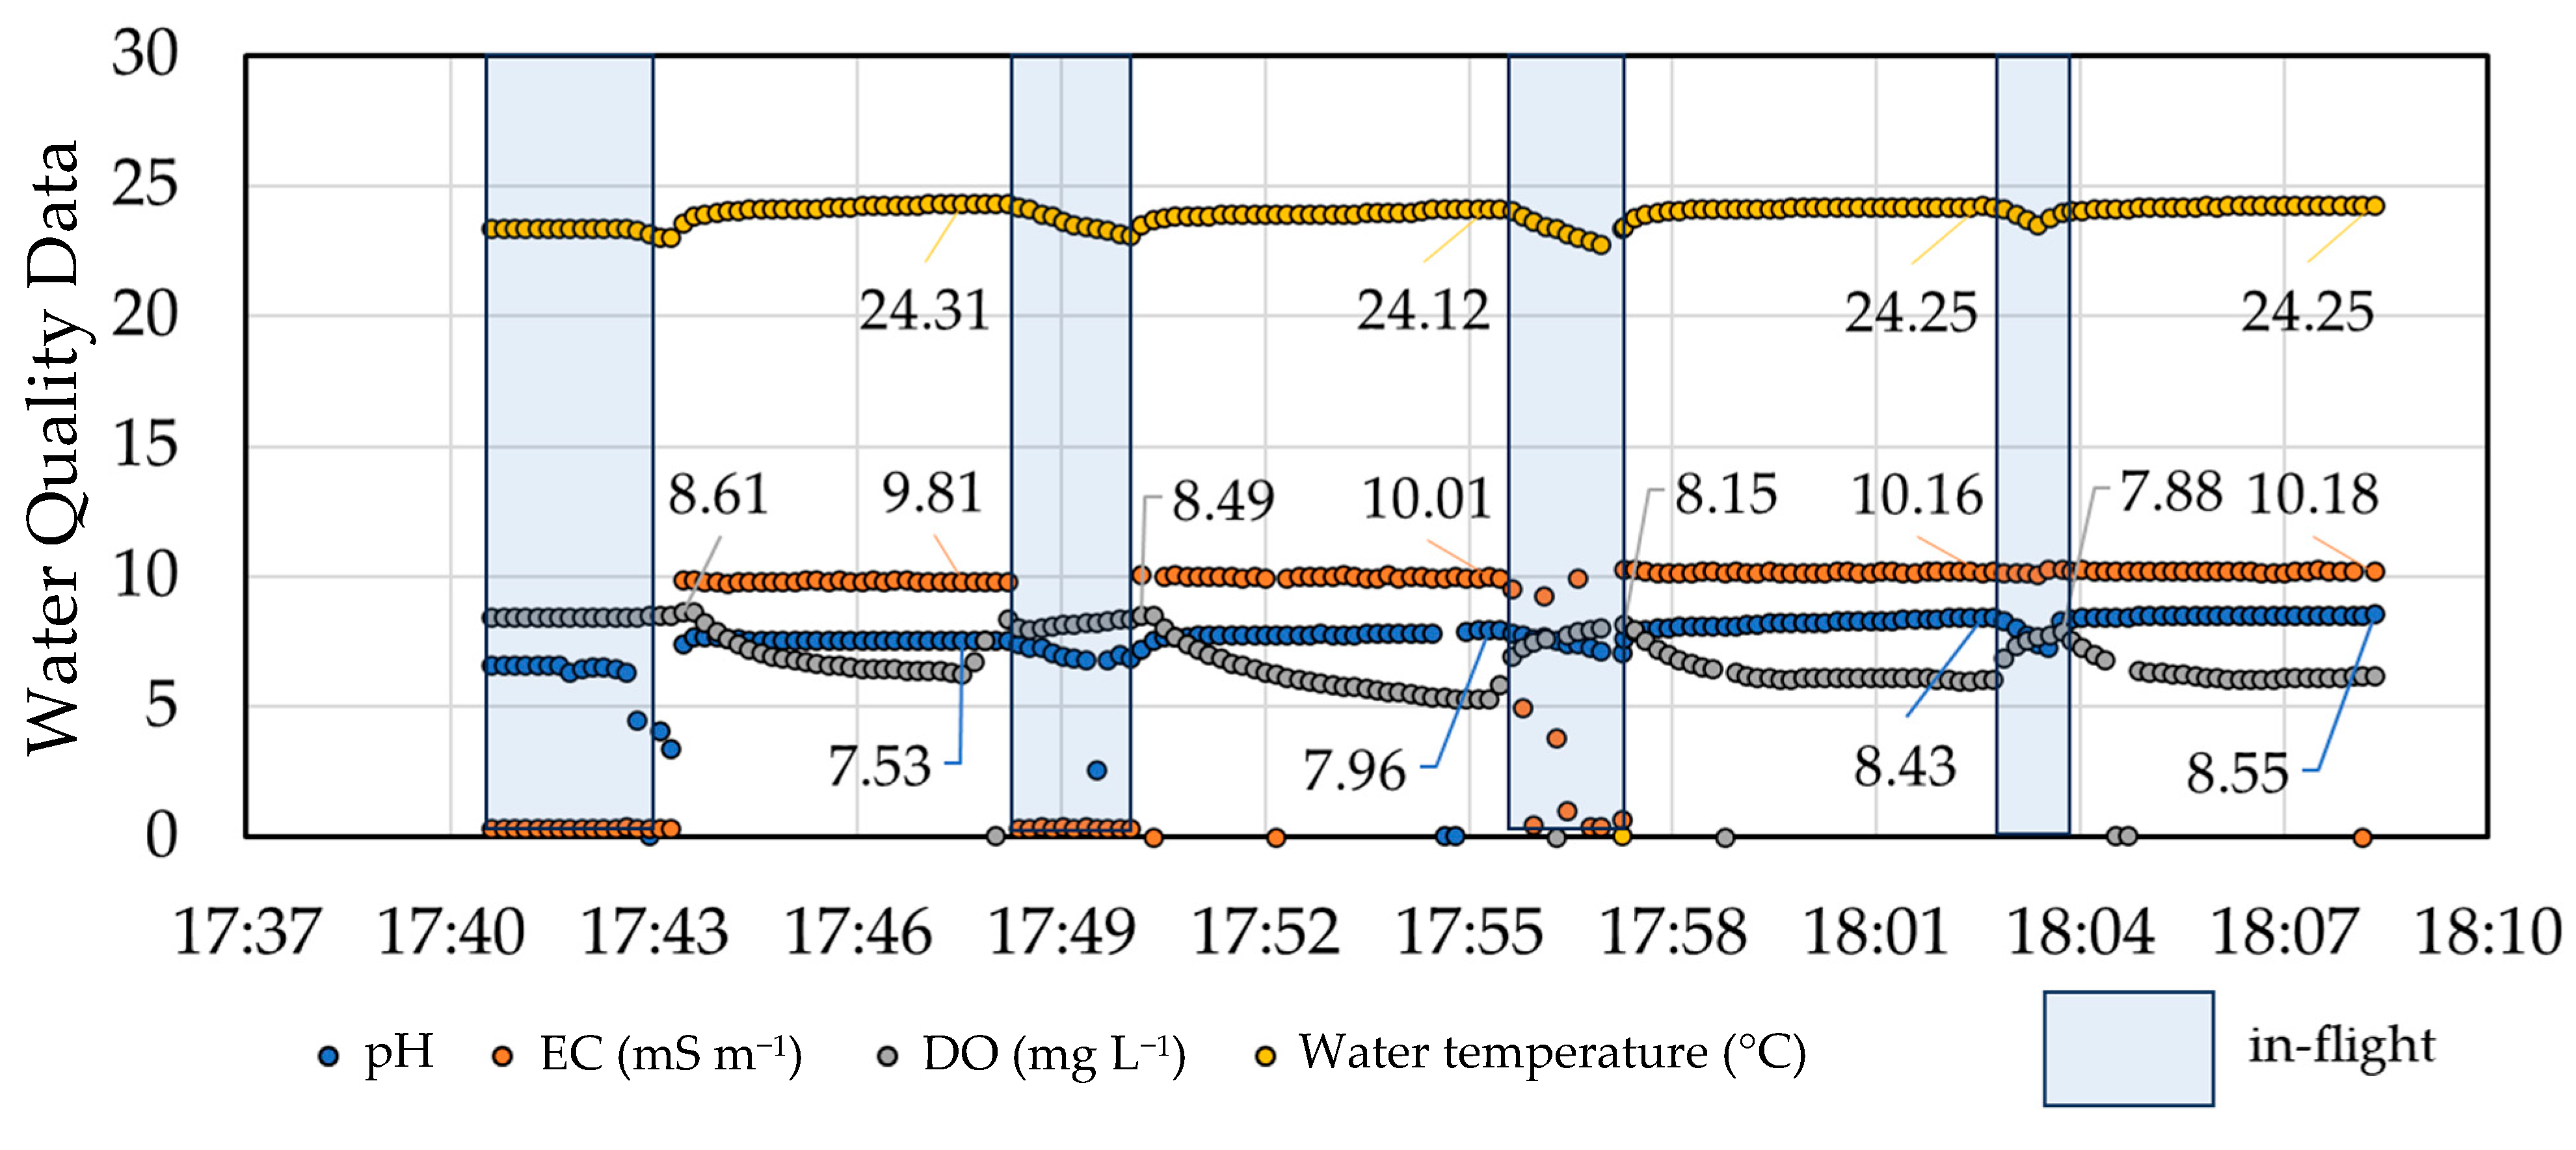
3.1.2. Water Quality Data Stability Test

The water quality sensors used for this study showed stable readings until the rechargeable NiMH batteries were depleted (Figure 11). The available sensing time was approximately 10 h at 10 s intervals. Temperature correction was necessary to obtain stable readings with both the EC and the DO sensors. The temperature correction coefficients to minimize the standard deviation of the readings differed for the two DO sensors (4.8% K−1 for Atlas Scientific’s DO sensor and 2.9% K−1 for the DFRobotTM DO sensor). The water temperature values fluctuated, but the ratio of the water temperature to the reference water temperature (measured using a continuous power source) was within the range of 0.99–1.01 (Figure 11). The air pressure values measured using this test increased gradually from 1004 hPa to 1007 hPa. The fluctuation of corrected DO values by the reference water temperature (for membrane permeability correction of the oxygen electrode) (Figure 11) fell within the range of ±5% of deviation of the reference value of oxygen-saturated water with saturated air humidity [29], except for the last three data points before termination by battery depletion. Figure 12 (for the SplashDroneTM 4 system) shows that the DO data fitted well to the standard value predicted by the equation reported by Benson and Krause (1980) [29]. The EC values in Figure 12 declined sharply before battery depletion. The pH values were stable in this room-temperature test (Figure 12).

3.2. Wireless Data Relay by Introducing Additional (Relayer) Drone

The water quality monitoring amphibious drone system was assessed at Ogata Pond. The pond had surrounding shoreline vegetation, which obstructed direct wireless communication between the transmitter drone (on water) and the receiver (with the drone controller). We introduced an additional drone system for the wireless data relay. By choosing appropriate test conditions, we conducted successful tests, although the system was not available in some situations. Troublesome situations included a site with large metallic fences along the shoreline (wireless communication failure), pond water with frozen surfaces/dense aquatic vegetation (direct landing failure), and prolonged testing with low-temperature water (battery exhaustion failure). The limitations identified from the field tests were assessed afterwards to establish a confirmed routine for reproducible water quality monitoring. In the wireless data relay tests, the relayer drone was able to monitor water quality data during the landing time on water. The series of water quality data in the repeated flights and landings on water show trends of the sensor responses (Figure 13).
The membrane-electrode DO sensor consumed oxygen to decrease the readings (Figure 13). Therefore, we chose the first reading after each landing on water. Manual measurements of the nearshore water with an optical DO sensor showed oversaturation with oxygen (up to 12.03 mg L−1 at 24.5 °C water temperature, 1004 hPa). In this case, we were unable to wait until a sufficient equilibration time for the DO sensor. The other indicators (pH, EC, temperature) were stabilized after each landing on water (Figure 13). The selected readings showed stable water temperature and electrical conductivity, but the pH value increased during repeated landings on water (Table 2).

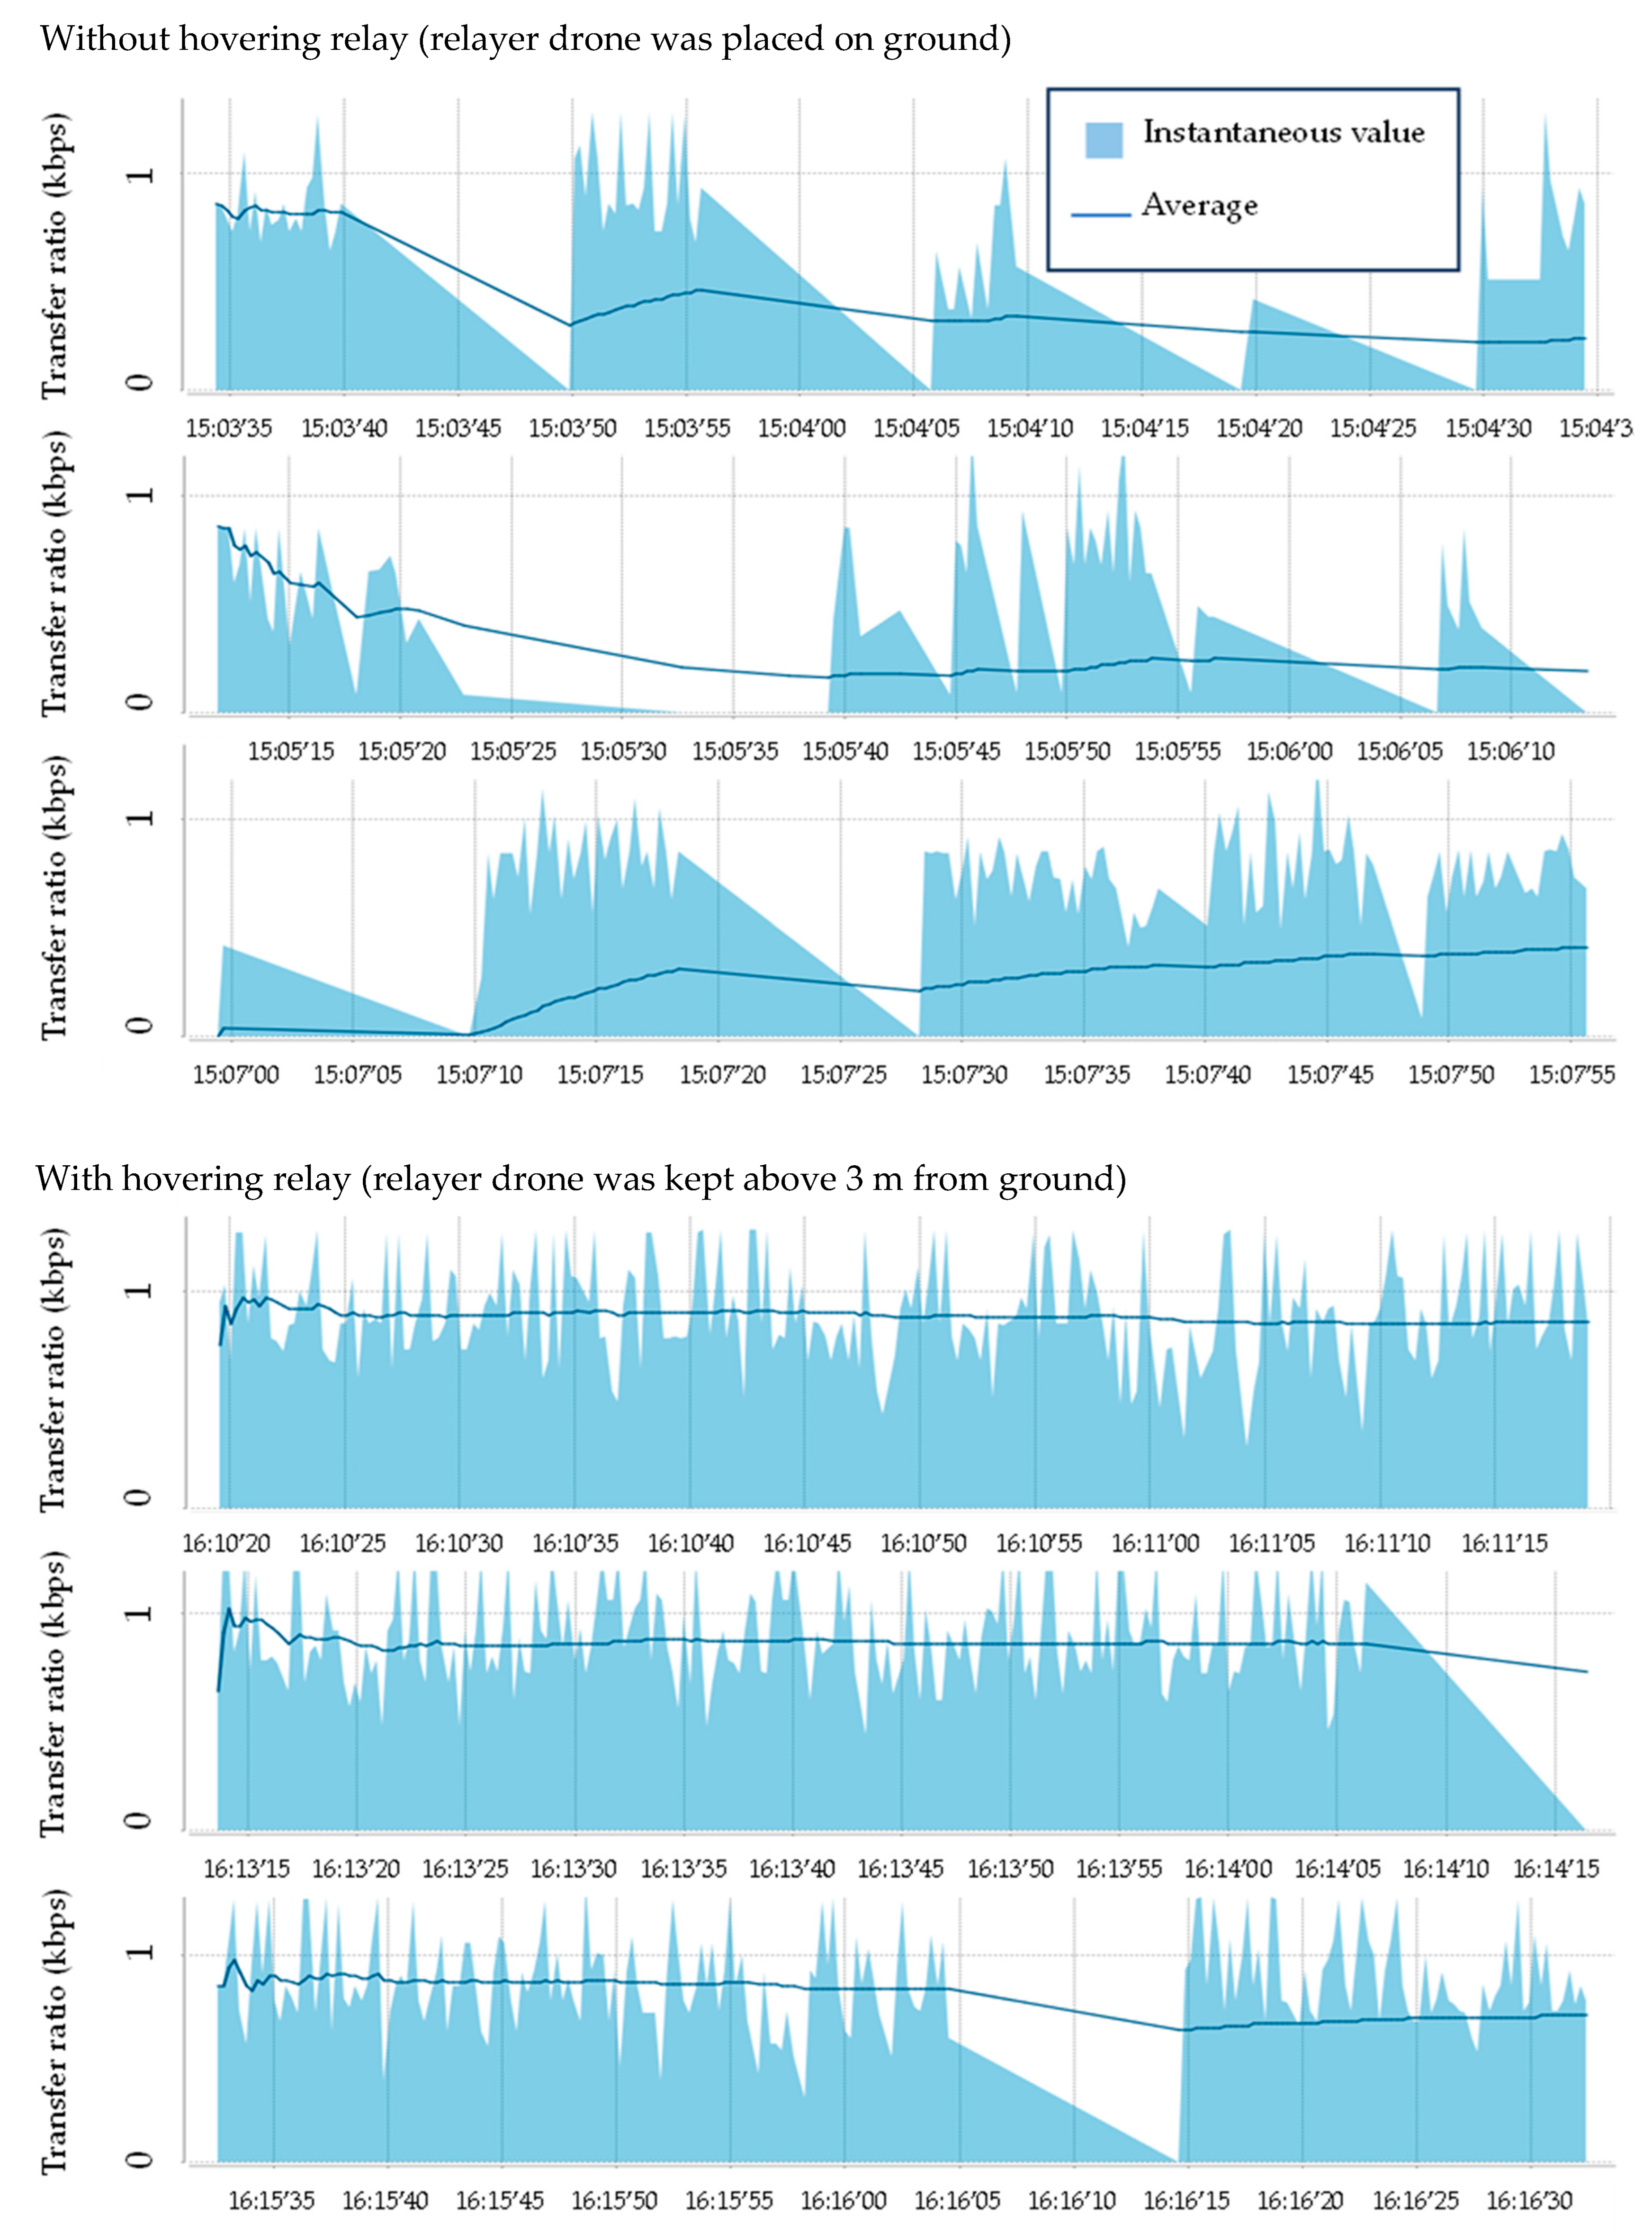
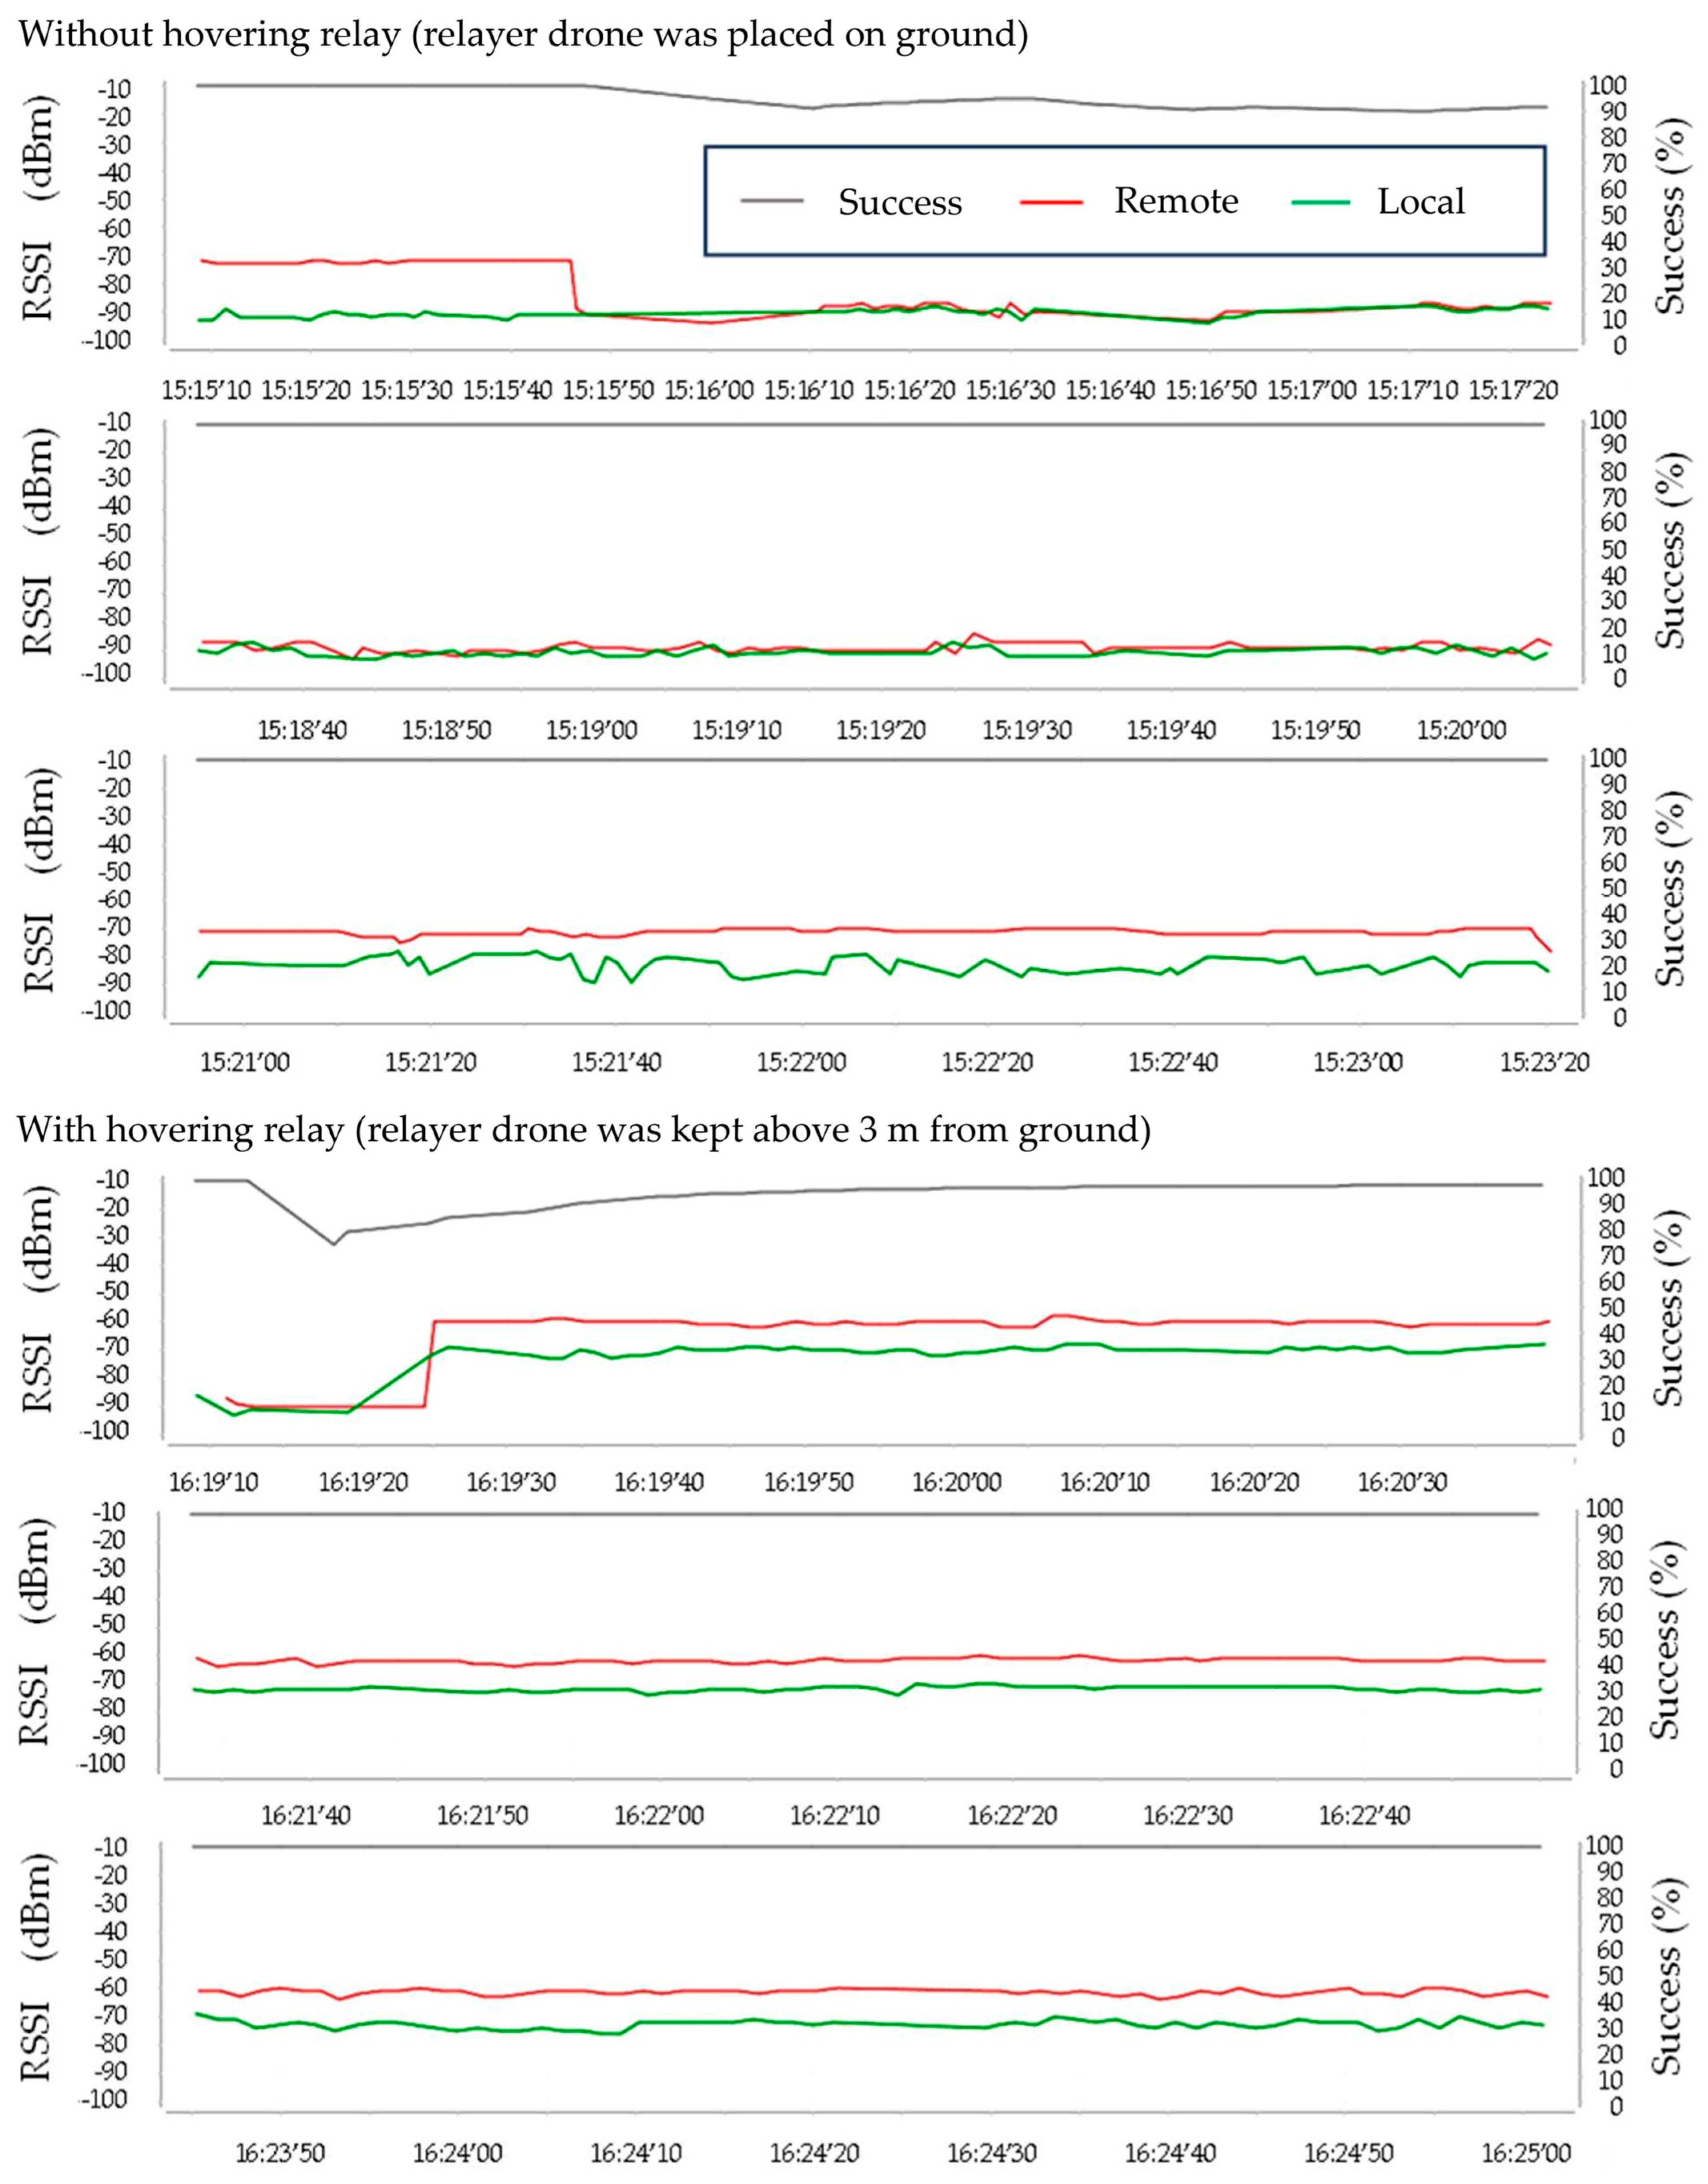
3.2.1. Evaluation of the Efficiency of Hovering Relay by Networking Metrics

The locations of wireless communication devices are shown in Figure 14. The average throughput in this test was 0.28 ± 0.07 kbps for the on-ground relayer drone and 0.77 ± 0.05 kbps for the hovering relayer drone kept around 3 m from the ground (Figure 15). The range test by the XCTU showed an over +15 dBm increase in the local RSSI by the hovering relay (Figure 16). The average PDR was 97 ± 2.7% for the on-ground relayer and 100 ± 0.3% for the hovering relayer (Figure 16).

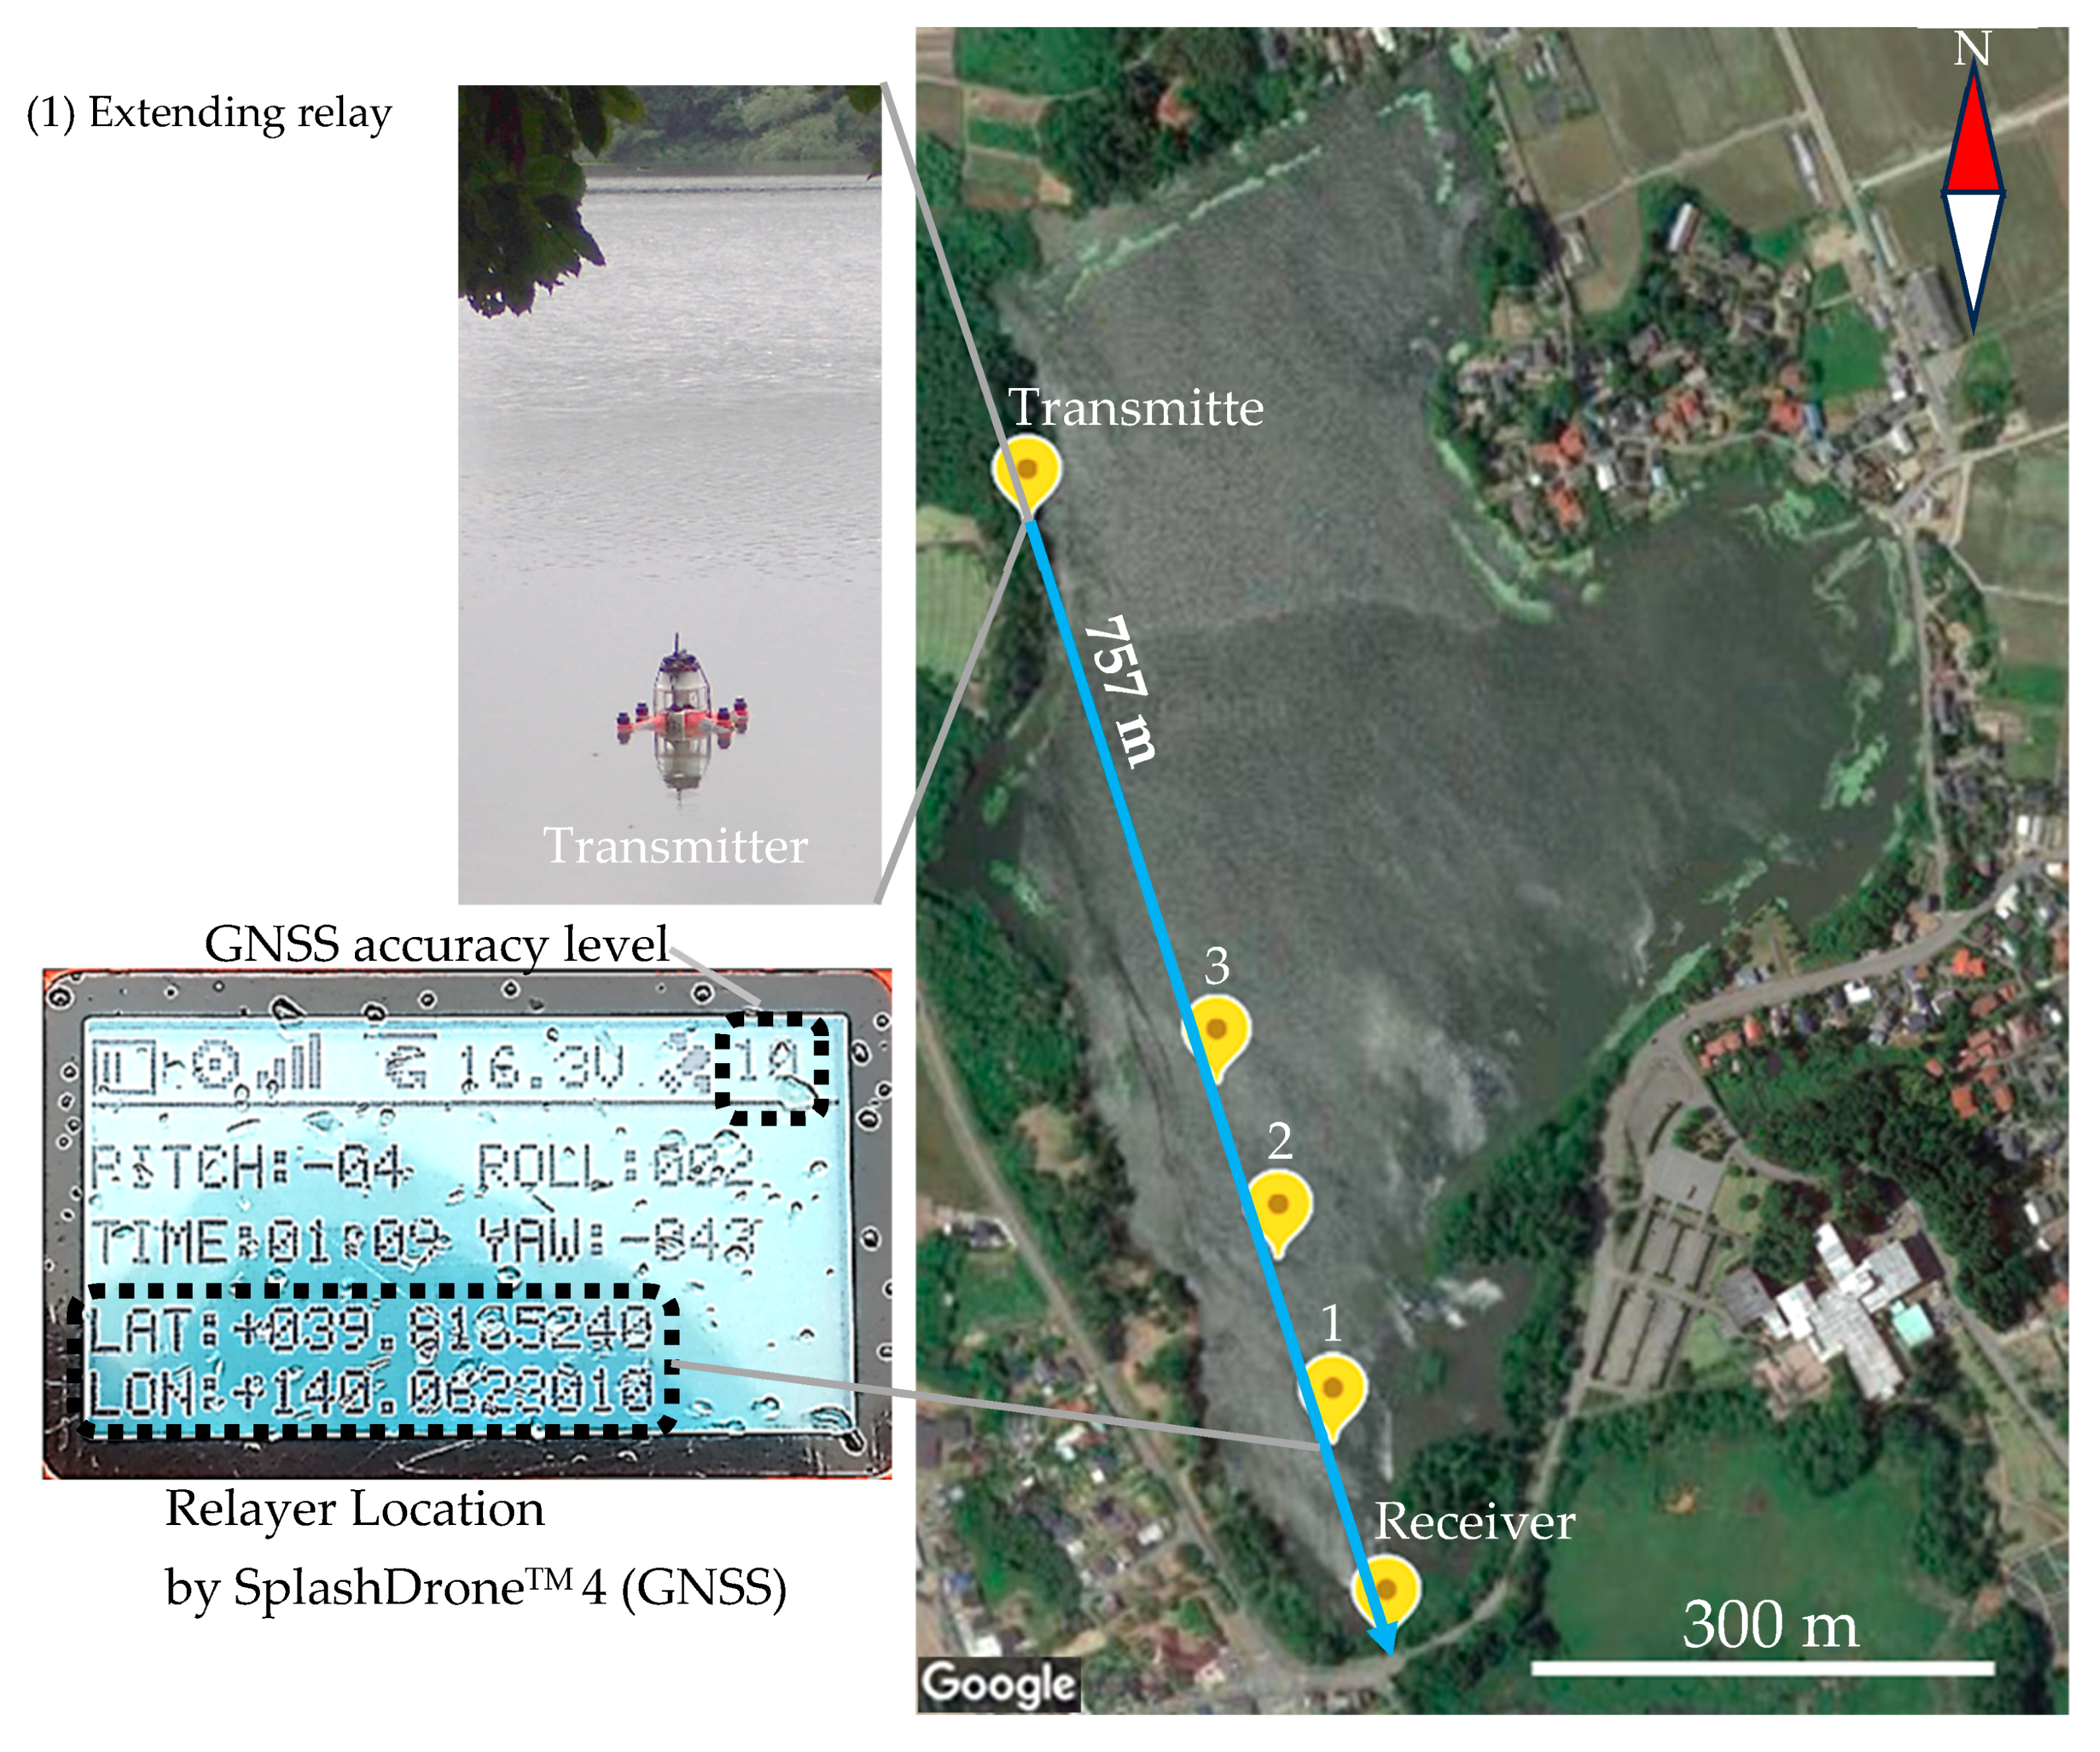
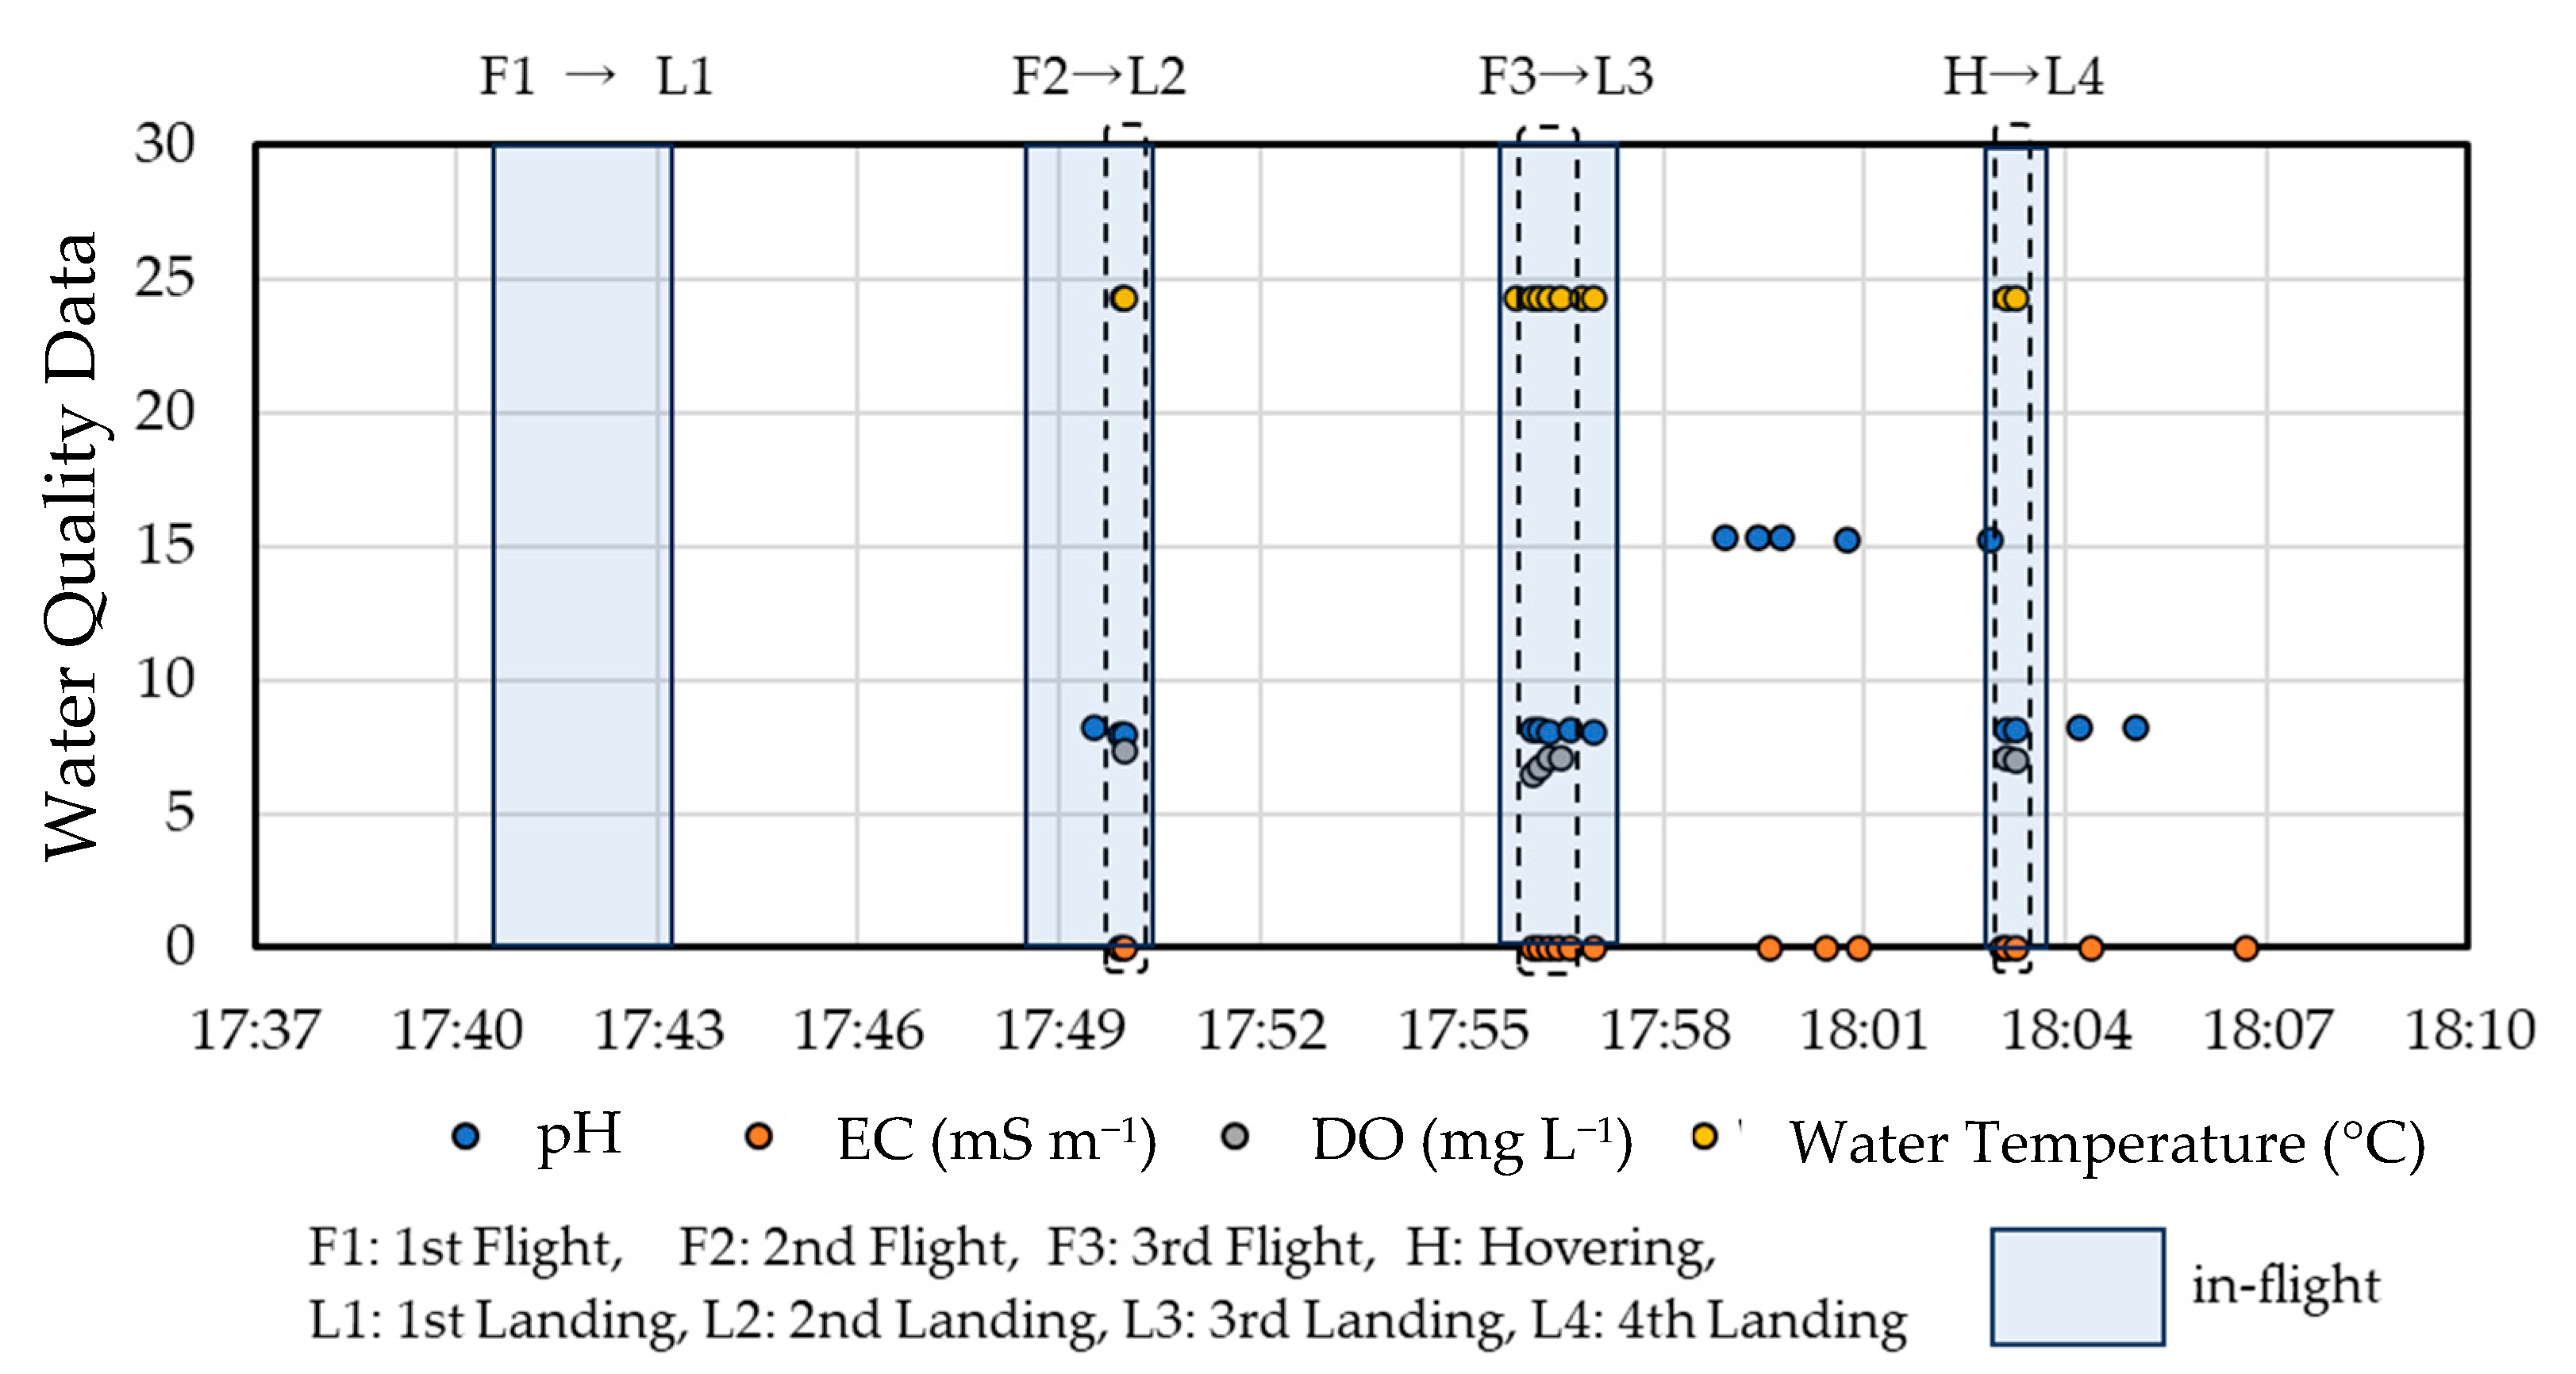
3.2.2. Extending Relay

Wireless data relay testing was conducted under line-of-sight conditions. Direct communication between the transmitter drone and the receiver was disabled by separating the transmitter by 757 m of distance from the receiver for the relay test (Figure 17). The maximum distance for wireless communication by the XBeeTM S2C chips is 1200 m in free (air) space [17], but the actual communicable distance in this study was decreased by the water surface and the shoreline vegetation. The antenna height of the transmitter on water was approximately 0.25 m (0.1 m antenna vertical length + 0.15 m thickness of the system above the draft line). That of the receiver was approximately 1.95 m (0.1 m antenna vertical length + 1.8 m height of the tripod + 0.05 m thickness of the receiver). The actual difference in antenna heights was approximately 4.9 m (1.7 m + 3.5 m difference in altitude-0.3 m raised water level by a previous heavy rain). The estimated communicable distance by the two-ray ground reflection model was 755–866 m with ±0.7 m of altitude error by the Digital Elevation Model 5B (DEM5B), excluding effects of multipath formation by shoreline vegetation.
The controller of the relayer drone (SplashDroneTM 4) continuously displayed the highest accuracy level of the GNSS (10, Figure 17), which indicates at least ±1 m of accuracy for the relayer drone location (the maximum instrumental accuracy of the GNSS was ±0.5 m [18]). The relayer drone was able to fly along a line-of-sight direction to the transmitter drone. The relayer drone landed on water four times. The horizontal distance from landed sites to the transmitter drone were L1, 624 m; L2, 500 m; L3, 381 m; and L4, 368 m (Figure 18). During each relayer drone flight, the water quality data were relayed to the receiver, except for the first flight to L1 (Figure 18). No complete dataset (pH, EC, DO, and water temperature) was relayed by the relayer drone on water. The estimated communicable distance by the two-ray ground reflection model between the two drones on water (0.25 m antenna height) was 179 m. During the fourth flight, 30 s of hovering (<10 m height from the controller) of the relayer drone was conducted, while two complete datasets measured at 10 s intervals were relayed (Figure 18).

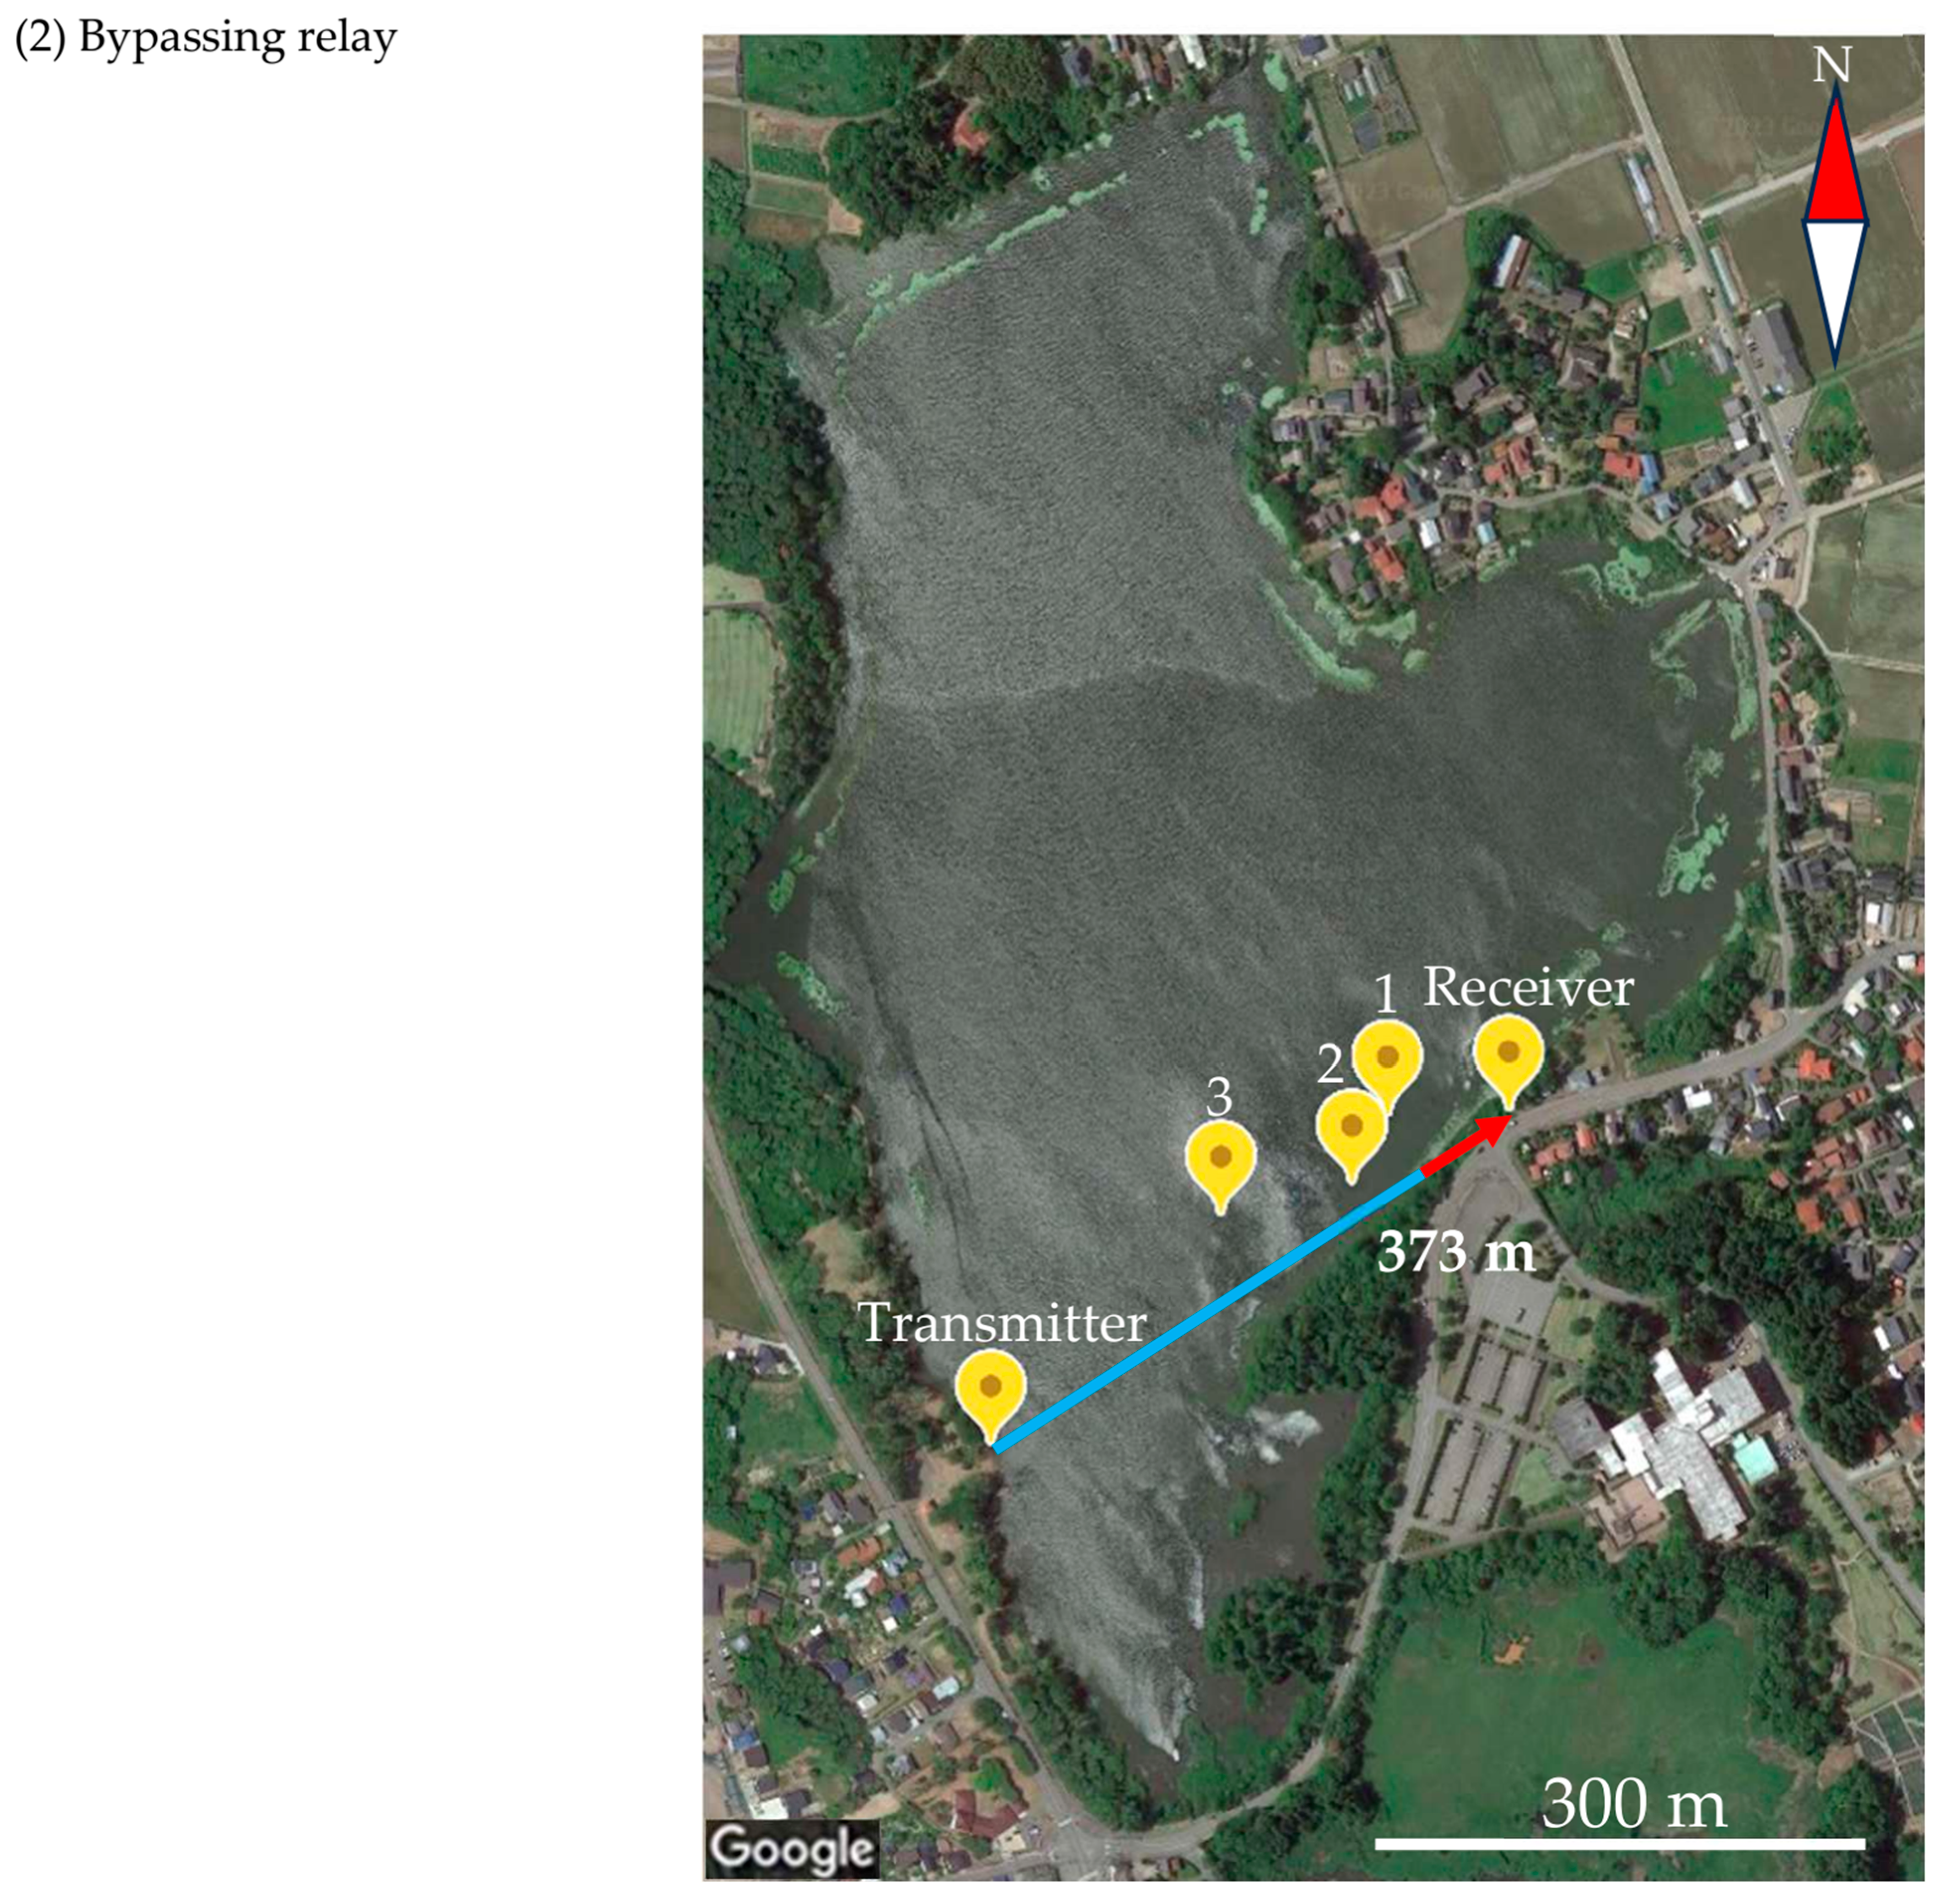
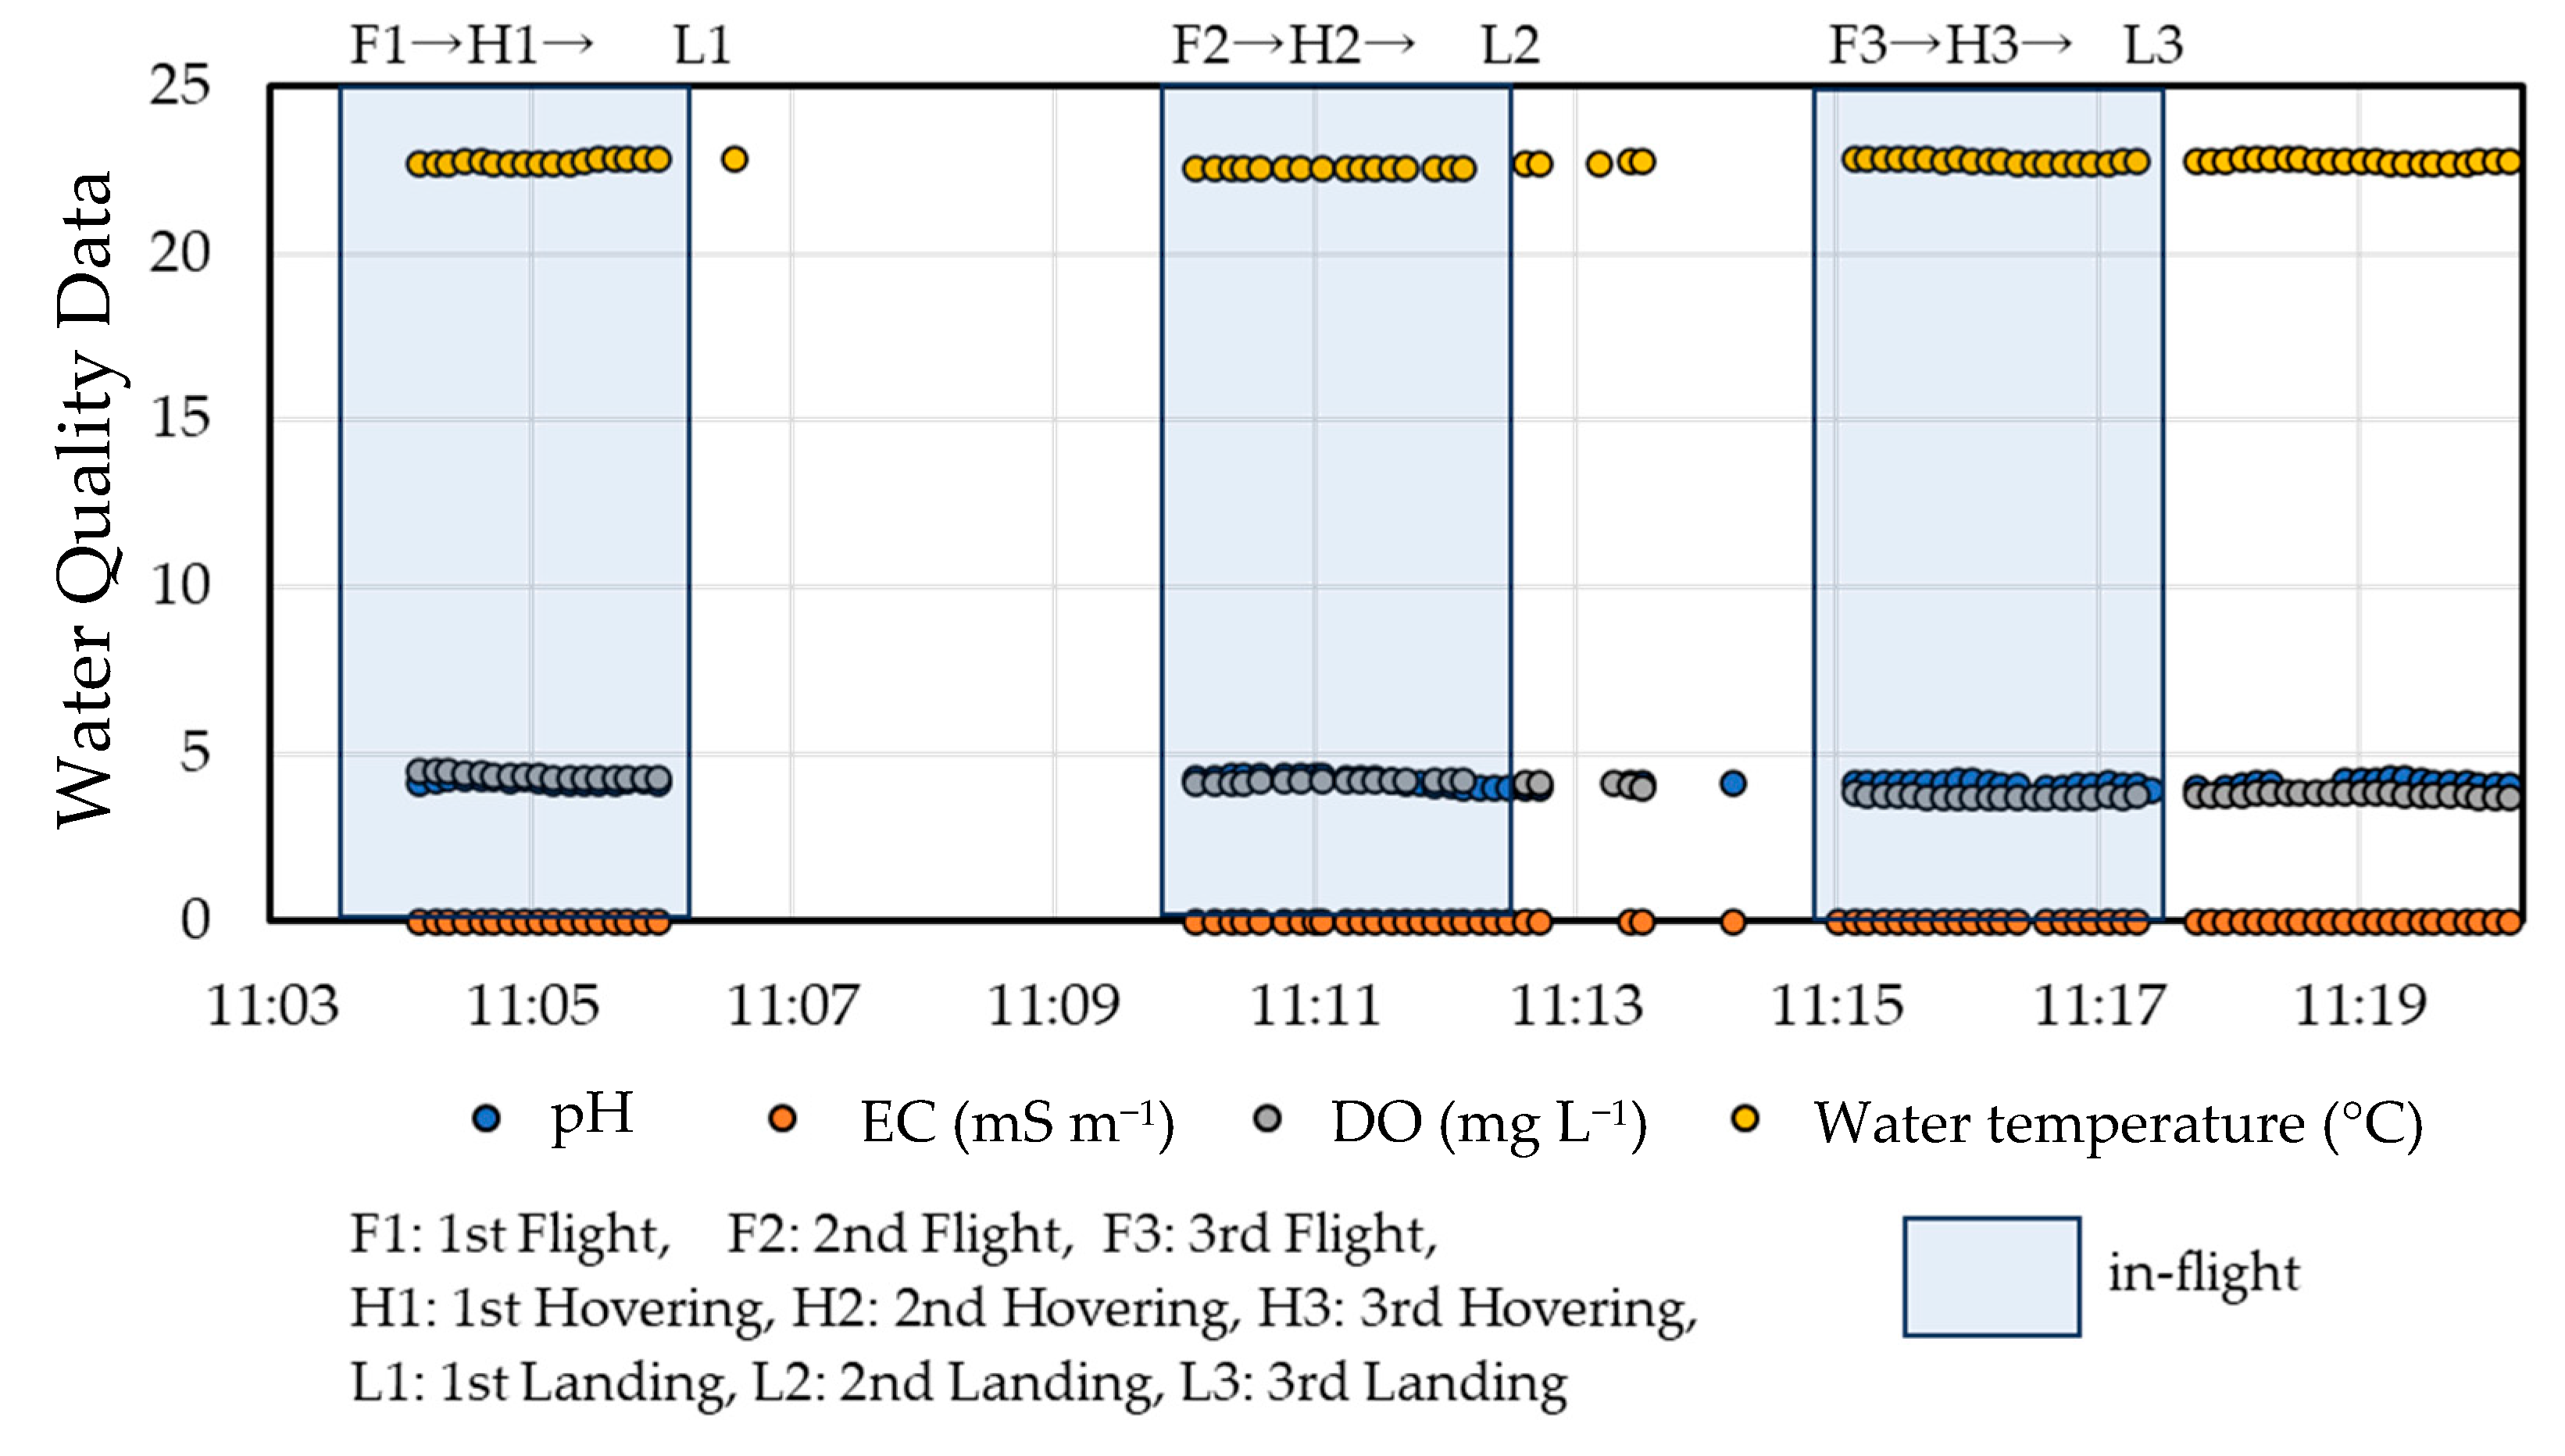
3.2.3. Bypassing Relay

Even in the line-of-sight relay test, the effects of shoreline vegetation on the wireless data relay could not be excluded from consideration. In the bypassing relay test, the line of sight was obstructed by the shoreline vegetation (Figure 19). Irrespective of the short distance to the direct wireless communication (373 m), no data were received without the relayer drone. We tried to locate the relayer drone to bypass the shoreline vegetation. By confirming a connected path formed with a pair of mutually observable drones (Figure 19), the wireless data relay was achieved during each flight (Figure 20). After landing on L3, the relayer drone was able to relay the data on water (Figure 20). The horizontal distance between L3 to the transmitter drone was 181 m. The actual difference in the antenna height was also approximately 4.9 m (1.7 m + 3.2 m altitude difference), but the altitude difference between the transmitter drone and the relayer drone on L3 was not confirmed by the DEM5B data (1.0 m, inordinately high for stable pond water). A slight elevation of the shoreline with vegetation and slowly surging wind waves (approximately 0.05 m) observed at the transmitter location confirmed the 181 m successful data relay on the water by the two-ray ground reflection model.

4. Discussion

Although the averaged stable hovering time showed similar values for the PET-bottle float and the polystyrene-foam bar float (Table 1), the flight stability evaluation was sensitive to anomalies of the wind speed (maximum wind speed) for large payloads. Although the base drone (SplashDroneTM 4) was stable during the test (the cutoff time for a stable system was set as 180 s), the flight controller adjusted for the base drone was unable to respond correctly to the additional forces generated by the gusts on the large floats. Possible improvement might be provided by adjusting the parameters for the inertial measurement unit, the Proportional–Integral–Derivative (PID) control, or by increasing the elevation angle for the GNSS signal reception. The manufacturer provides a set of large floats (approximately 4.6 L) of SplashDroneTM 4 for boat-mode operations. The average wind speed allowed for flight with the genuine floats was limited to 5 m s−1 [18]. The waiting time for the GNSS cold-start after each battery refill was also not negligible for flight tests, which would affect the efficiency of water quality monitoring with amphibious drones.
The water quality data stability test gave a fluctuating trend of EC in Figure 11b, but the raw data (temperature-corrected EC in Figure 11b × 1.020(t−25), t: water temperature in °C) before temperature correction were stable during testing. The water temperature was stable during testing (Figure 11e). Therefore, a thermal inhomogeneity between the EC sensor (capped with a standard solution) and the temperature sensor was implied. For this study, we did not use the values of the EC sensor for the transmitter drone (SplashDroneTM 3+) during field testing of pond water, because of the low electrical conductivity of the test site (freshwater pond). However, each water quality sensor used for this study has proven performance at standalone operations in the presumed applications [30]. In the field test, the fluctuations in the EC and the water temperature values by the system for the relayer drone (SplashDroneTM 4) were within the range of ±2%, but the pH values increased gradually by the repeated landings on water (Table 2). The manufacturer claimed fluctuations by the thermal non-uniformity of the pH sensor boards for the previous version [31]. Therefore, for high-precision monitoring of water quality, a thermal sink or an air circulator with a waterproof filter would be required for the modules sealed in the upper mounter. The DO values relayed from the transmitter drones (Figure 18) were lower than those obtained using the relayer drone (Figure 13), reflecting oxygen consumption by the electrodes. For long-term floating applications of amphibious drones, an optical DO sensor is preferable to reduce errors by electrode consumption.
The above-ground relay tests have shown a significant increase (by a t-test at a 99% level of significance) in wireless communication throughput by the low-altitude (around 3 m) hovering relay (Figure 15). The PDR did not show any significant difference with the 10 s receiver timeout, but the extended test duration for the on-ground relayer (Figure 16) indicated limited availability of the on-ground relay in faster measurements. According to the two-ray ground reflection model, the local RSSI in the range test from the transmitter drone (Figure 16) was consistent with the predicted value (−92 dBm). The predicted communicable distance between two amphibious drones was 180 m for the drones on water, but the +15 dBm increase by the hovering relay enables a search range of 420 m by another drone. The extended range by the hovering relay is comparable with the controllable distance of the amphibious drones on water [18]. For larger-scale monitoring, reciprocal hovering of the amphibious drones (Figure 1, lower) can be an easily attainable practice for overcoming the limited availability of wireless communication on large water bodies.
The maximum communicable distance found during the field tests was influenced by the water level of the pond on the test day (+0.3 m water level for the extending relay test) (Figure 21a). The estimated communicable distance by the two-ray ground reflection model [19,20] was 835 m, but the distance decreased to 812 m because of the +0.3 m rise in the water level. The actual communicable distance in the field was shorter than the values predicted by the surface reflection model, indicating the influences of other factors including the shoreline vegetation, noises from the surrounding environment, the surface roughness/high dielectric permittivity of water [32], signal loss from the lower part of the dipole antenna of the amphibious drone on water, and inaccuracies of the altitude data. During testing, we were able to keep the amphibious drone systems away from other park users (Figure 21b,c). In earlier studies, the greater surface roughness, dielectric permittivity, and conductivity of the seawater surface in comparison with a flat ground have been found to provide only a 2–3 dBm decrease in the received signal strength at 2.4 GHz [32]. When the antenna height used in the two-ray ground reflection model calculation was lowered to (a) the antenna base height or (b) the phase center of the antenna, the estimated value of the maximum communicable distance was decreased (a, 703 m; b, 757 m). The result obtained with the phase center calculation (b) was comparable to those in the field test (approximately 757 m of direct communication was possible when the transmitter drone was kept away from the shoreline vegetation). The high actual performance which necessitated consideration of the antenna length was attributed to the conformation of the λ/4 monopole antenna, inclusion of the s-waves (horizontally polarized electric waves), incidental coherent signal enhancement by multipath transmission, and inaccuracy of the altitude data (approximately 0.99 m of synthetic error for the altitude difference between the transmitter and the receiver). The altitude error might be an important factor affecting wireless communication. Based on the synthetic error for the altitude difference, the predicted communicable distance ranged from 731 m to 887 m (including the +0.3 m of water rise independently from the error on the mapping survey). Among all factors recognized, the shoreline vegetation demonstrated a strong effect, which is consistent with earlier studies of the numerous complicated paths of wireless communication generated by vegetation [21]. Although the line of sight in the bypassing relay test was concealed only by thin (approximately 70 m) shoreline vegetation (Figure 19), direct data reception was unattainable. The vegetation included some tall, foliated tree species (e.g., oak, pine, pseudoacacia) grown to over 20 m in height. The path loss through vegetated paths has most frequently been estimated using the International Telecommunication Union-Radiocommunication sector (ITU-R) model [21]. The model predicts a path loss of 26.4 dB for the vegetated path of 70 m. The path loss for the remaining path (373 m − 70 m = 303 m), estimated by the two-ray ground reflection model, is 84.9 dB. The estimated signal intensity through the entire direct path is -103.3 dBm, a value below the sensitivity of the receiver (−102 dBm [17]). Experimental evidence of a sharp signal drop in 2.4 GHz BluetoothTM and Zigbee through a 25 m path of thick foliage has also been reported by an earlier study [33]. The first landing site in Figure 19 was only approximately 36 m away from the shoreline vegetation, but the wireless data relay network was established during flight. The link waiting time was expected to be sufficiently short (<10 s) to conduct a 10 s interval measurement because the 30 s hovering relay provided two complete datasets at 10 s intervals (Figure 18). The connected line-of-sight relay used for this study can be expected by classical theories, under the condition of (1) a line of sight formed with mutually observable pair(s) of drones and (2) a sufficient node discovery backoff time.
The validation of the system in the field tests confirmed the feasibility of drone swarm applications in amphibious settings. Such applications include water quality monitoring with immersive sensors or direct water sampling by landing on water, providing crucial conditions for water-sensitive hardware. By utilizing amphibious drones and wireless communication tools with mesh-networking abilities, water quality monitoring with drones can be conducted safely and is available for environmental scientists and engineers with limited knowledge in other fields of study.
By considering the data rate and the network structure of wireless communication in this study, the possible size of the amphibious drone swarm, accounting for latencies caused by hardware settings [34] such as baud rate, USB-UART conversion, and data display processes, is estimated at 15 drones with 10-second measurement intervals. In the estimation, the serial connection of all nodes is assumed as the worst case of the mesh-type network structure. The overall traffic in the serial connection is calculated as (n + 1)/2-folds (n: number of transmitters) of that in the star-type network (direct connection of each transmitter to a receiver). The throughput obtained in this study’s implementation and test conditions was 1.7 kbps for 16-byte payloads (2-byte data for four water quality indicators and four sensor numbers). Therefore, the estimated traffic with 15 drones is 15 × (15 + 1)/2 [transmission packets] × 16 × 8 [bits per transmission packet]/10 s = 1.536 kbps (<1.7 kbps). Pilot contamination by the 2.4 GHz WiFi drone controller could be avoided by fixing the channel for each drone and using the XBeeTM network for the least-populated water body, but the number of channels for the drone controller was limited to 10 [26]. For the actual settings of this study, water quality data for each drone (pH, EC, DO, temperature, and the sensor numbers) were sent separately to secure each data point. In this case, the practical size is up to five drones. The traffic in this scenario is calculated as 5 × (5 + 1)/2 × 8 [transmission packets] × 2 × 8 [bits per transmission packet]/10 s = 0.192 kbps (<0.25 kbps actual throughput).
The theoretical maximum speed (250 kbps for 2.4 GHz XBeeTM S2C [17]) without rerouting (optimized route is maintained reactively) and latencies, except for wireless communication, is estimated by multiplying the ratio of payload (16 bytes for a drone) to frames (37 bytes of transmission frame and transmission status frame). The given theoretical throughput is 108 kbps. With the optimized throughput of 108 kbps, the theoretical maximum of the drone swarm is estimated to be 129. In this case, the traffic is calculated as 129 × (129 + 1)/2 [transmission packets] × 16 × 8 [bits per transmission packet]/10 s = 107.328 kbps (<108 kbps). Even if the network structure can be approximated to a star-type network, there are still other constraints. To prevent collisions of numerous packets at the coordinator, the backoff time in Carrier Sense Multiple-Access-Collision Avoidance (CSMA/CA) [17] becomes crucial. The waiting time for sending a packet from a node under challenging conditions was assumed as approximately 400 ms. The assumption corresponds to the worst case of successful transmission with four times of repeated carrier sensing with a (28 − 1) × 0.32 ms backoff time [35], 0.128 ms carrier sensing, and 18 ms latencies from hardware settings. For a 10-second measurement interval, the cost of packet collision and carrier sensing is considered non-negligible if the number of transmitters approaches 25.
If legal limitations for the use of wireless communication are not a concern, low-frequency wireless communication for drones [25] could reduce the number of required drones. In contrast, higher-frequency communication, such as millimeter-wave communication, provides higher throughput and enables a large number of drone swarms, provided that the receiver gain is maintained by novel technologies such as massive Multi-Input Multi-Output (MIMO) drone swarms [36] with future advancements in beamforming speed, antenna size, etc.
For future applications of this system to water quality monitoring, the controllable range of the amphibious drones can be extended with tracking technology (e.g., ‘follow me’ technology [37]) and a power generator (Figure 22). Similar systems have been proposed in earlier studies [38,39]. The vertical flight ability of amphibious drones can be advantageous for locations with dense aquatic vegetation. Combined use of the system with a high-sensitivity LoRaTM module would enable water quality monitoring in large-scale water bodies (e.g., seas, lakes, reservoirs) with a greater number of amphibious drones.

Author Contributions

Conceptualization, O.K.; methodology, O.K., A.S., H.M. and T.N.; software, A.S.; validation, A.S., O.K., H.M., T.N., M.I., S.W., M.Y., H.O. and N.K.; formal analysis, O.K.; investigation, A.S., O.K., T.N., H.M., S.W. and T.K.; resources, O.K.; data curation, A.S. and O.K.; writing—original draft preparation, A.S.; writing—review and editing, A.S., O.K., H.M., T.N. and M.I.; visualization, A.S.; supervision, O.K.; project administration, O.K.; funding acquisition, O.K. and H.M. All authors have read and agreed to the published version of the manuscript.

Funding

This research and the APC were funded by Akita Prefectural University, the Grant for Promotion of Academic-Industrial Collaboration (2021–2023 fiscal year).

Data Availability Statement

Datasets, movies/photos, programs, and 3D-printer files described as a result of this study are available upon request to the corresponding author.

Acknowledgments

We thank Toshiya Hori for his patience and support during field tests. The field tests were realized through the courtesy of the staff in Akita Prefectural Koizumigata Park, Akita, Japan. We sincerely appreciate Stephanie Nix of Iwate Prefectural University for her invaluable suggestions related to this manuscript.

Conflicts of Interest

The authors declare that they have no conflicts of interest.

References

  1. Yang, X.; Wang, T.; Liang, J.; Yao, G.; Liu, M. Survey on the Novel Hybrid Aquatic–Aerial Amphibious Aircraft: Aquatic Unmanned Aerial Vehicle (AquaUAV). Prog. Aerosp. Sci. 2015, 74, 131–151. [Google Scholar] [CrossRef]
  2. Rodrigues, P.; Marques, F.; Pinto, E.; Pombeiro, R.; Lourenço, A.; Mendonça, R.; Santana, P.; Barata, J. An Open-Source Watertight Unmanned Aerial Vehicle for Water Quality Monitoring. In Proceedings of the OCEANS 2015-MTS/IEEE Washington, Washington, DC, USA, 19–22 October 2015; pp. 1–6. [Google Scholar]
  3. Esakki, B.; Ganesan, S.; Mathiyazhagan, S.; Ramasubramanian, K.; Gnanasekaran, B.; Son, B.; Park, S.W.; Choi, J.S. Design of Amphibious Vehicle for Unmanned Mission in Water Quality Monitoring Using Internet of Things. Sensors 2018, 18, 3318. [Google Scholar] [CrossRef] [PubMed]
  4. Faraji, A.; Haas-Stapleton, E.; Sorensen, B.; Scholl, M.; Goodman, G.; Buettner, J.; Schon, S.; Lefkow, N.; Lewis, C.; Fritz, B.; et al. Toys or Tools? Utilization of Unmanned Aerial Systems in Mosquito and Vector Control Programs. J. Econ. Entomol. 2021, 114, 1896–1909. [Google Scholar] [CrossRef] [PubMed]
  5. Den Ouden, C.J.; Wills, P.S.; Lopes, L.; Sanderson, J.; Ouyang, B. Evolution of the Hybrid Aerial Underwater Robotic System (HAUCS) for Aquaculture: Sensor Payload and Extension Development. Vehicles 2022, 4, 390–408. [Google Scholar] [CrossRef]
  6. Yang, Z.; Yu, X.; Dedman, S.; Rosso, M.; Zhu, J.; Yang, J.; Xia, Y.; Tian, Y.; Zhang, G.; Wang, J. UAV Remote Sensing Applications in Marine Monitoring: Knowledge Visualization and Review. Sci. Total Environ. 2022, 838, 155939. [Google Scholar] [CrossRef] [PubMed]
  7. Swellpro Technology Co., Ltd. SplashDrone 4 WQMS (Water Quality Monitoring System) User Manual; Version 1.0; Swellpro Technology Co., Ltd.: Shenzhen, China, 2022; pp. 6–7. Available online: https://support.swellpro.com/hc/article_attachments/14003389713433 (accessed on 13 September 2023).
  8. Spreng, J. Expanded Development of Consumer-Level Unmanned Aerial Vehicles for Oceanographic Research. Graduate Thesis, University of Washington, Seattle, WA, USA, 2 June 2019. Available online: https://digital.lib.washington.edu/researchworks/bitstream/handle/1773/45633/sprengjohncolvin_3569755_56886300_SprengThesis.pdf (accessed on 13 September 2023).
  9. Ryu, J.H. UAS-Based Real-Time Water Quality Monitoring, Sampling, and Visualization Platform (UASWQP). HardwareX 2022, 11, e00277. [Google Scholar] [CrossRef]
  10. Potter, B.; Valentino, G.; Yates, L.; Benzing, T.; Salman, A. Environmental Monitoring Using a Drone-Enabled Wireless Sensor Network. In Proceedings of the 2019 Systems and Information Engineering Design Symposium (SIEDS), Charlottesville, VA, USA, 26 April 2019; pp. 1–6. [Google Scholar]
  11. Heng, F. Construction and Research of Water Quality Monitoring System Based on ZigBee Technology. In Proceedings of the E3S Web of Conferences 2020 (2nd International Conference on Civil Architecture and Energy Science), Changchun, China, 20–22 March 2020; Volume 165, p. 03060. [Google Scholar]
  12. Forcella, M. Creating a Mesh Sensor Network Using Raspberry Pi and XBee Radio Modules. Master’s Thesis, State University of New York, New Paltz, NY, USA, 2017. Available online: https://soar.suny.edu/bitstream/handle/20.500.12648/705/Forcella_Thesis.pdf (accessed on 13 September 2023).
  13. Ab Aziz, M.A.; Abas, M.; Faudzi, A.; Saad, N.M.; Irawan, A. Development of Wireless Passive Water Quality Catchment Monitoring System. J. Telecommun. Electron. Comput. Eng. 2018, 10, 37–40. [Google Scholar]
  14. Cheng, L.; Tan, X.; Yao, D.; Xu, W.; Wu, H.; Chen, Y. A Fishery Water Quality Monitoring and Prediction Evaluation System for Floating UAV Based on Time Series. Sensors 2021, 21, 4451. [Google Scholar] [CrossRef] [PubMed]
  15. Pan, M.; Chen, C.; Yin, X.; Huang, Z. UAV-Aided Emergency Environmental Monitoring in Infrastructure-Less Areas: LoRa Mesh Networking Approach. IEEE Internet Things J. 2021, 9, 2918–2932. [Google Scholar] [CrossRef]
  16. Campagnaro, F.; Steinmetz, F.; Renner, B.-C. Survey on Low-Cost Underwater Sensor Networks: From Niche Applications to Everyday Use. J. Mar. Sci. Eng. 2023, 11, 125. [Google Scholar] [CrossRef]
  17. Digi International Inc. XBee/XBee-PRO® S2C Zigbee® RF Module User Guide; Revision AN; Digi International Inc.: Hopkins, MN, USA, 2022; pp. 32–71. Available online: https://www.digi.com/resources/documentation/digidocs/pdfs/90002002.pdf (accessed on 13 September 2023).
  18. Swellpro Technology Co., Ltd. SplashDrone 4 User Manual; Version 2.3.2; Swellpro Technology Co., Ltd.: Shenzhen, China, 2022; pp. 37–39. Available online: https://support.swellpro.com/hc/article_attachments/14995989756569 (accessed on 13 September 2023).
  19. Loyka, S.; Kouki, A. Using Two Ray Multipath Model for Microwave Link Budget Analysis. IEEE Antennas Propag. Mag. 2001, 43, 31–36. [Google Scholar] [CrossRef]
  20. Jakes, W. Microwave Mobile Communication; John Wiley & Sons, Inc.: Hoboken, NJ, USA, 1974; pp. 81–83. Available online: https://courses.engr.illinois.edu/ece458/Jakes_Book_optim.pdf (accessed on 7 September 2023).
  21. Barrios-Ulloa, A.; Ariza-Colpas, P.P.; Sánchez-Moreno, H.; Quintero-Linero, A.P.; De la Hoz-Franco, E. Modeling Radio Wave Propagation for Wireless Sensor Networks in Vegetated Environments: A Systematic Literature Review. Sensors 2022, 22, 5285. [Google Scholar] [CrossRef]
  22. Nadziejko, A. Wireless Sensor Networking Applied to Swarms of Aquatic Drones. Ph.D. Thesis, Universidade da Beira Interior, Covilhã, Portugal, June 2016. Available online: https://ubibliorum.ubi.pt/bitstream/10400.6/5875/1/4906_10783.pdf (accessed on 13 September 2023).
  23. Fan, J.; Cui, M.; Zhang, G.; Chen, Y. Throughput Improvement for Multi-Hop UAV Relaying. IEEE Access 2019, 7, 147732–147742. [Google Scholar] [CrossRef]
  24. Kawamoto, Y.; Nishiyama, H.; Kato, N.; Ono, F.; Miura, R. Toward Future Unmanned Aerial Vehicle Networks: Architecture, Resource Allocation and Field Experiments. IEEE Wirel. Commun. 2019, 26, 94–99. [Google Scholar] [CrossRef]
  25. Miura, R.; Kagawa, T.; Ono, F.; Shan, L.; Matsuda, T.; Kojima, F. Propagation Measurements of Multi-Hop Command and Telemetry Communications System in the 169 MHz Band for Drones. J. Robot. Mechatron. 2021, 33, 363–370. [Google Scholar] [CrossRef]
  26. Swellpro Technology Co., Ltd. SplashDrone 3+ User Manual; Version 1.5.4; Swellpro Technology Co., Ltd.: Shenzhen, China, 2021; p. 40. Available online: https://www.swellpro.co.za/wp-content/uploads/2021/04/84eca2209d-splashdrone-3-user-manual-v154en.pdf (accessed on 13 September 2023).
  27. Nowacki, H.; Ferreiro, L.D. Historical Roots of the Theory of Hydrostatic Stability of Ships. In Proceedings of the Eighth International Conference Stability of Ships and Ocean Vehicles, Madrid, Spain, 15–19 September 2003; pp. 1–30. [Google Scholar]
  28. Molland, A.F. Floatation and stability. In The Maritime Engineering Reference Book; Elsevier: Amsterdam, The Netherlands, 2011; pp. 75–115. [Google Scholar]
  29. Benson, B.B.; Krause, D., Jr. The Concentration and Isotopic Fractionation of Gases Dissolved in Freshwater in Equilibrium with the Atmosphere. 1. Oxygen. Limnol. Oceanogr. 1980, 25, 662–671. [Google Scholar] [CrossRef]
  30. de Camargo, E.T.; Spanhol, F.A.; Slongo, J.S.; da Silva, M.V.R.; Pazinato, J.; de Lima Lobo, A.V.; Coutinho, F.R.; Pfrimer, F.W.D.; Lindino, C.A.; Oyamada, M.S.; et al. Low-Cost Water Quality Sensors for IoT: A Systematic Review. Sensors 2023, 23, 4424. [Google Scholar] [CrossRef] [PubMed]
  31. Atlas Scientific LLC. pH Circuit; Version 5.0; Atlas Scientific LLC: Long Island, NY, USA, 2013; p. 14. Available online: http://www.codbyte.com.br/wp-content/uploads/2017/12/pH_Circuit_5.0.pdf (accessed on 30 August 2023).
  32. Yamamoto, B.; Wong, A.; Agcanas, P.J.; Jones, K.; Gaspar, D.; Andrade, R.; Trimble, A.Z. Received Signal Strength Indication (RSSI) of 2.4 GHz and 5 GHz Wireless Local Area Network Systems Projected over Land and Sea for near-Shore Maritime Robot Operations. J. Mar. Sci. Eng. 2019, 7, 290. [Google Scholar] [CrossRef]
  33. Mathew, K.; Tabassum, M. Analysis of bluetooth and zigbee signal penetration and interference in foliage. In Proceedings of the International MultiConference of Engineers and Computer Scientists (IMECS), Hong Kong, China, 16–18 March 2016; Volume 2, pp. 547–552. [Google Scholar]
  34. Haque, K.F.; Abdelgawad, A.; Yelamarthi, K. Comprehensive Performance Analysis of Zigbee Communication: An Experimental Approach with XBee S2C Module. Sensors 2022, 22, 3245. [Google Scholar] [CrossRef] [PubMed]
  35. Son, K.J.; Hong, S.H.; Moon, S.-P.; Chang, T.G.; Cho, H. Segmentized Clear Channel Assessment for IEEE 802.15. 4 Networks. Sensors 2016, 16, 815. [Google Scholar] [CrossRef] [PubMed]
  36. Chandhar, P.; Danev, D.; Larsson, E.G. Massive MIMO for Communications with Drone Swarms. IEEE Trans. Wirel. Commun. 2017, 17, 1604–1629. [Google Scholar] [CrossRef]
  37. Short, J.E.; Merrill, D.J.; Liao, E.W.; Kalanithi, J.J.; Loehr, K.; Guinn, C.A. Systems and Methods for Controlling Pilotless Aircraft. International Patent WO2016/161426 A1, 6 October 2016. [Google Scholar]
  38. Rangel, R.K.; Freitas, J.L.; Rodrigues, V.A. Development of a Multipurpose Hydro Environmental Tool Using Swarms, UAV and USV. In Proceedings of the 2019 IEEE Aerospace Conference, Big Sky, MT, USA, 2–9 March 2019; pp. 1–15. [Google Scholar]
  39. Barbatei, R.; Skavhaug, A.; Johansen, T.A. Acquisition and Relaying of Data from a Floating Wireless Sensor Node Using an Unmanned Aerial Vehicle. In Proceedings of the 2015 International Conference on Unmanned Aircraft Systems (ICUAS), Denver, CO, USA, 9–12 June 2015; pp. 677–686. [Google Scholar]
Figure 1. A conceptual illustration of wireless data relay for water quality monitoring using multiple amphibious drones. Upper: no data relay, middle: data relay by a flying drone, lower: data relay with alternated roles of drones for large-scale applications with variable receiver locations. Drones A and B are identical but situated in different locations.
Drones 08 00038 g001
Figure 2. Schematic representation of amphibious drone-mounted water quality monitoring system with wireless data relay.
Drones 08 00038 g002
Figure 3. Water quality monitoring modules and output data. (a) Modules for the SplashDroneTM 3+ in a data stability test; (b) sensor electrodes for the SplashDroneTM 3+; (c) modules for the SplashDroneTM 4 in a data stability test; (d) received data displayed on a laptop PC. Its components have been numbered as follows: 1, sensor boards for the SplashDroneTM 3+ system; 2, sensor electrodes for the SplashDroneTM 3+ system; 3, controller for the SplashDroneTM 3+ system; 4, controller for reference temperature measurement with a continuous power source; 5, rechargeable batteries; 6, data display (laptop PC); 7, pH sensor; 8, EC sensor; 9, DO sensor; 10, temperature sensor (reference); 11, temperature sensor; 12, pH 4 buffer solution in a screw cap; 13, EC 1.41 dS m−1 standard solution in a screw cap; 14, aerator; 15, controller for the SplashDrone 4 system; 16, XBeeTM S2C board; 17, sensor boards for pH/EC/DO; 18, sensor board for temperature; 19, I2C connector hub; 20, rechargeable battery (for demonstration of a minimized installation into the system mounter).
Drones 08 00038 g003
Figure 4. Slicer output images of the mounters for water quality monitoring tools with amphibious drones. (a) Mounters for the SplashDroneTM 3+ with vertical installation of sensor electrodes; (b) mounters for the SplashDroneTM 4 with horizontal installation of sensor electrodes (the holder is shown as a vertical image for 3D-printer output). GNSS-secure legs were used for sufficient space between the bottom of the upper mounter vessel and the GNSS antenna surface of each drone.
Drones 08 00038 g004
Figure 5. Simplified side-view of the amphibious drone system with an upper mounter and additional floating materials. Some points are identified: M, metacenter; G, center of gravity; B, center of buoyancy. The floating materials are sufficiently narrow to release airflow and minimize the distance from G to B.
Drones 08 00038 g005
Figure 6. Simplified top view (horizontal view) of the amphibious drone system with additional floating materials: (a) symmetric L-shaped polystyrene-foam bars (the concave of each L-shaped bar is fitted to each of the drone arms, approximately 60 g total weight) made by cutting a polystyrene foam box, (b) empty PET bottles (approximately 940 mL volume, approximately 136 g total weight), (c) coiled tubular polyethylene sponge foam discs (approximately 400 g total weight), and (d) the least amount of sponge-form arm-covers (approximately 85 g total weight) to balance the drones on still water.
Drones 08 00038 g006
Figure 7. Flight stability test with the payload of the water quality monitoring system and reinforcing floats for aqueous operations. Upper: initial location of the drone system. Lower: on-flight location to be stabilized at ideally (initial location of each test). Lateral (y-axis) fluctuation was evaluated without aileron control. The threshold was set as 1.5 m by demarcating the test space with elastic strings. The time to deviate from the inner space (±1.5 m) was measured.
Drones 08 00038 g007
Figure 8. Scheme of the wireless data relay tests. The transmitter drone measured surface water quality data and transmitted the data. The relayer drone relayed the data to a receiver. The receiver received the data.
Drones 08 00038 g008
Figure 9. Components of the water quality monitoring system with amphibious drones for wireless data relay tests: 1, SplashDroneTM 3+; 2, SplashDroneTM 4; 3, upper mounter for SplashDroneTM 3+; 4, upper mounter for SplashDroneTM 4; 5, lower mounter for SplashDroneTM 4; 6, side mounter(s) for SplashDroneTM 3+; 7, drone controller for SplashDroneTM 4; 8, laptop computer for data display; 9, receiver; and 9’, contents included in the receiver.
Drones 08 00038 g009
Figure 10. Schematic showing field tests at a pond for two-ray ground reflection model calculation of communicable distance. Each antenna height in this figure includes its own vertical length.
Drones 08 00038 g010
Figure 11. Results of data stability testing of the system for the SplashDroneTM 3+ with rechargeable batteries: (a) pH values of a standard solution (potassium phthalate buffer, pH 4.01); (b) electrical conductivity values of a 1.41 dS m−1 standard solution (141 mS m−1); (c) dissolved oxygen concentration values of the drawn tap water circulated continuously with air bubbling; (d) water temperature values of the tap water; (e) the ratio of water temperature and reference temperature values (the reference temperature values were obtained with stable power source). The EC values were corrected by the water temperature data to represent the values at 298 K. Temperature compensation for the DO measurement was conducted only for the membrane permeability fluctuation (not for standardization).
Drones 08 00038 g011
Figure 12. Summarized result of the data stability test of the system for the SplashDroneTM 4 with rechargeable batteries. In the figure, tc represents temperature correction; std represents calculated standard data by the equations from Benson and Krause (1980). Also, EC_tc data are standardized values at 298 K (25 °C).
Drones 08 00038 g012
Figure 13. Example of a time series dataset from the water quality monitoring system on an amphibious drone (Ogata Pond, 19 July 2023): EC, electrical conductivity; DO, dissolved oxygen; F1, first flight; L1, first landing on water; F2, second flight; L2, second landing on water; F3, third flight; L3, third landing on water; H, hovering; L4, fourth landing on water. Numbers on the data represent readings obtained at equilibrium (pH, EC, and water temperature) and immediately after each landing on water (DO). Exceptional treatment of the data on DO was conducted for oversaturated water by algal bloom, as detected by manual sampling measurements of nearshore water.
Drones 08 00038 g013
Figure 14. Arrangement of wireless communication devices for quantifying the efficiency of drone hovering in data relaying. The test was conducted on 12 December, 2023 in a flat field at Akita Prefectural University (Akita Campus), Japan. The distance between the transmitter drone and the receiver (connected to a laptop computer) was approximately 100 m. The relayer drone was positioned at the center of the line between the transmitter drone and the receiver. No tall grasses were present in the field on the date of the test. Networking metrics (throughput, RSSI, and PDR) were measured both with and without hovering of the relayer drone. The hovering height was maintained at approximately 3 m.
Drones 08 00038 g014
Figure 15. Results of throughput tests with hovering relayer drone positioned at the center of a 100 m line of sight. The test for each condition was repeated three times. The test duration (cutoff time) was set as 60 s for the rapid environmental monitoring with drones. The average throughput was 0.28 ± 0.07 kbps for the on-ground relayer and 0.77 ± 0.05 kbps for the hovering relayer,.
Drones 08 00038 g015
Figure 16. Results of range tests with a hovering relayer drone positioned at the center of a 100 m line of sight. RSSI: Received Signal Strength Indicator. Success (%) on the right-side vertical axis represents the Packet Delivery Ratio (PDR, %). The test for each condition was repeated three times. Each packet was to be sent ideally at 1000 ms intervals, but the receiver timeout was set as 10 s for a measurement of water quality at 10 s intervals. The average PDR was 97 ± 2.7% for the on-ground relayer and 100 ± 0.3% for the hovering relayer. The sensitivity of the receiver (XBeeTM S2C coordinator in the boost mode) was −102 dBm [17].
Drones 08 00038 g016
Figure 17. Locations of the wireless water quality monitoring system for extending relay test (Ogata Marsh Pond on 19 July 2023). Transmitter, transmitter drone (landed on the water and was fixed by mooring); 1–3, locations where the relayer drone was placed; Receiver, receiver on a tripod.
Drones 08 00038 g017
Figure 18. Received water quality data from the extending relay test. The horizontal distance between the transmitter drone and the relayer drone at each landing site was the following: L1, 624 m; L2, 500 m; L3, 381 m; L4, 368 m. Each of the complete datasets (pH, EC, DO, and temperature) is surrounded by a dotted line.
Drones 08 00038 g018
Figure 19. Locations of wireless water quality monitoring system for bypassing relay test (Ogata Pond on 27 September 2022): Transmitter, transmitter drone (landed on the water and was fixed by mooring from shore); 1–3, locations where the relayer drone was placed; Receiver, receiver on a tripod. Red arrow indicates the wireless communication path blocked by shoreline vegetation.
Drones 08 00038 g019
Figure 20. Water quality data received from the bypassing relay test. Distances between the transmitter drone and the relayer drone at each landing site were the following: L1, 313 m; L2, 270 m; L3, 181 m.
Drones 08 00038 g020
Figure 21. Photographs of the field test site. (a) Path to the pond shoreline with raised water (+0.3 m). (b) Overview from the shore in the extending relay test. (c) Overview from the shore in the bypassing relay test.
Drones 08 00038 g021
Figure 22. Example of a wireless data relay application to amphibious drones. A tracking (‘follow me’) technology (3D Robotics Inc., Berkeley, CA, USA) enables large-scale water surveys with amphibious drones.
Drones 08 00038 g022
Table 1. Flight stability test results. Wind scale corresponds to the Beaufort wind force scale.
Float TypeStable Hovering Time (s)
Wind Scale 1–2Wind Scale 2–3
Polystyrene-foam bar
(Figure 6a)
41 ± 2614 ± 1
PET bottle
(Figure 6b)
43 ± 2534 ± 6
Coiled polyethylene-foam disc
(Figure 6c)
Not DeterminedNot Determined
Drone-only>18090 ± 47
Table 2. Water quality readings from time series data obtained using the amphibious drone system (Ogata Pond, 19 July 2023). EC, electrical conductivity; DO, dissolved oxygen. Landing locations are described in the extending relay test.
EventTimepHEC (mS m−1)DO (mg L−1)Water Temperature (°C)
1st landing17:43–17:487.539.818.6124.31
2nd landing17:50–17:557.9610.018.4924.12
3rd landing17:57–18:028.4310.168.1524.25
4th landing18:03–18:088.5510.187.8824.25
Disclaimer/Publisher’s Note: The statements, opinions and data contained in all publications are solely those of the individual author(s) and contributor(s) and not of MDPI and/or the editor(s). MDPI and/or the editor(s) disclaim responsibility for any injury to people or property resulting from any ideas, methods, instructions or products referred to in the content.

