Article

Using YOLO Object Detection to Identify Hare and Roe Deer in Thermal Aerial Video Footage—Possible Future Applications in Real-Time Automatic Drone Surveillance and Wildlife Monitoring

1
Department of Chemistry and Bioscience, Aalborg University, 9220 Aalborg, Denmark
2
Department of Energy, Aalborg University Esbjerg, 6700 Esbjerg, Denmark
3
Aalborg Zoo, 9000 Aalborg, Denmark
*
Author to whom correspondence should be addressed.
Submission received: 24 November 2023 / Revised: 21 December 2023 / Accepted: 22 December 2023 / Published: 24 December 2023
(This article belongs to the Special Issue Drone Advances in Wildlife Research)

Abstract

:
Wildlife monitoring can be time-consuming and expensive, but the fast-developing technologies of uncrewed aerial vehicles, sensors, and machine learning pave the way for automated monitoring. In this study, we trained YOLOv5 neural networks to detect points of interest, hare (Lepus europaeus), and roe deer (Capreolus capreolus) in thermal aerial footage and proposed a method to manually assess the parameter mean average precision (mAP) compared to the number of actual false positive and false negative detections in a subsample. This showed that a mAP close to 1 for a trained model does not necessarily mean perfect detection and provided a method to gain insights into the parameters affecting the trained models’ precision. Furthermore, we provided a basic, conceptual algorithm for implementing real-time object detection in uncrewed aircraft systems equipped with thermal sensors, high zoom capabilities, and a laser rangefinder. Real-time object detection is becoming an invaluable complementary tool for the monitoring of cryptic and nocturnal animals with the use of thermal sensors.

1. Introduction

The use of aerial drones for wildlife monitoring has increased exponentially in the past decade [1,2,3,4,5,6,7]. These drones, also known as uncrewed aerial vehicles (UAVs), unmanned aerial systems (UASs), and remotely piloted aircraft systems (RPASs), can carry a variety of sensors, including high-resolution visible-light-cameras (RGB) and thermal infrared (TI) cameras. As the technologies advance and the price of these drones and sensors drops, they become more accessible to conservation biologists, wildlife managers, and other professionals working with wildlife monitoring [2,3,4,5]. The prospects of drones in wildlife monitoring have already been proven to save time, create better imagery and spatial data for especially cryptic and nocturnal animals [8,9], and reduce the risks and hazards for the observer [10,11]. However, the methods are still in the early stages, and need further development to be truly superior and cost-saving compared to traditional monitoring methods. Automatic detection is pivotal for this development, and computer vision is likely to be the solution [1].

1.1. Automatic Detection and Computer Vision

Over the past decade, artificial intelligence has led to significant progress in the domain of computer vision, automating image and video analysis tasks. Among computer vision methods, Convolutional Neural Networks (CNNs) are particularly promising for future advances in automating wildlife monitoring [6,12,13,14,15,16,17,18]. Corcoran et al. [3] concluded that when implementing automatic detection, fixed-winged drones with RGB sensors were ideal for detecting larger animals in open terrain, whereas, for small, elusive animals in more complex habitats, multi-rotor systems with infrared (IR) or thermal infrared sensors are the better choice, especially when monitoring cryptic and nocturnal animals. It was also noted that there is a knowledge gap in understanding the effects of the chosen drone platforms, sensors, and survey design on the false positive detections made by the trained models, thereby potentially overestimating [3].

1.2. You-Only-Look-Once-Based UAV Technology

A popular and open-source group of CNNs is the YOLO (You Only Look Once) object detection and image segmentation models, with several iterations and active development [14,19,20,21,22], and a technology cross-fusion with drones has already been proposed as YOLO-Based UAV Technology (YBUT) [6]. The advantages of the YOLO models are that they are fast [8], making it possible to perform object detection in real-time on live footage, and that they are relatively user-friendly and intuitive, making the models approachable to non-computer scientists. By using the Python programming language, it is more accessible for custom development and customization. This makes it possible to implement it in external hardware so that, for example, object detection can be carried out in real-time onboard a drone. Object detection and tracking of cars and persons are already integrated into several unmanned aerial systems, such as the DJI Matrice 300RTK [23], but customization of these systems is limited. The YOLO framework and YBUT show potential for active community development [6,24]. Examples of this are architectures based on YOLOv5 that improve the model’s ability to detect minutely small objects in drone imagery [12,25], improved infrared image object detection network, YOLO-FIRI [26], and improved YOLOv5 framework to detect wildlife in dense spatial distribution [17].

1.3. Mean Average Precision

When training neural networks, here called models, one of the main parameters for explaining the performance of a model is the mean average precision (mAP) [27]. This is a metric used to evaluate the performance of a model when predicting bounding boxes at different confidence levels, and thereby measure the precision of the trained model in comparison to other models applied to the same test dataset. A training dataset may be a collection of manually annotated images divided into a set for the training itself, a validation set, and a testing set, also known as dataset splitting [27]. The validation set is used to detect the overfitting of a trained model and the test set is used to evaluate its performance on an unseen dataset. Mean average precision (mAP) consists of several parameters: precision, recall, and intersection over union (IOU) [18,27]. The precision of a model (calculated as the number of true positives divided by the sum of true and false positives generated by the model), describes the proportion of positive predictions that are correct. The precision of a model does, however, not take the false negatives into account. The recall of a model, calculated as the number of true positives divided by the sum of true positives and false negatives, describes how many of the true positives the model correctly detects. This means that there is a trade-off between precision and recall. Detection becomes less precise when making more predictions at a lower confidence level, which in return gives a higher recall. Precision–recall curves visualize how the precision of the model behaves when changing the selected confidence threshold. The IOU measures how much overlap there is between the bounding box on an image from the test dataset, manually annotated, and a bounding box annotated by the trained model, on the same image. Therefore, the IOU gives a proportion of how much of the object of the specified class and how much of the surroundings are included in the detection. mAP curves are the mean of the precision–recall curve for all classes and for all IOU thresholds for each class, so it both takes into consideration the number of false negatives and false positives, as well as how precise the bounding boxes are drawn around the object for detection [18,27].
Povlsen et al. [28] flew in predetermined flight paths at 60 m altitude with a DJI Mavic 2 Enterprise Advanced with the thermal camera pointing directly down (90°), covering the transects that were simultaneously surveyed, monitoring hare, deer, and fox. Using transect counting, it was possible to spot roughly the same number of animals as the traditional ground-based spotlight count [28]. However, this method covered a relatively small area per flight, and required post-processing of the captured imagery, still making it time-consuming. In the present study, we tried a slightly different approach by manually piloting the UAV continuously, using the scouring method which also had been shown to match and potentially surpass the traditional spotlight method [9]. By scouring the area with the camera angled at about 45°, we attained better situational awareness and covered a larger area per flight. This approach does require some experience from the drone pilot [24], both in piloting the drone and camera and in spotting animals in thermal imagery, but, as we will show, there is a potential in automating this approach using machine learning (ML) to improve post-processing efficiency and possibly even collect data in real-time automatically while the drone is airborne. The aim of this study was to provide a basic, conceptual algorithm for implementing real-time object detection, based on artificial intelligence, in unmanned aircraft systems (UASs) with the ambition of automating wildlife monitoring. We trained YOLOv5 neural networks to detect points of interest (POIs), hare (Lepus europaeus), and roe deer (Capreolus capreolus) in thermal aerial footage. In addition, we proposed a simple method to determine the ratio of true false positive and true false negative detections to assess the given mAP and to gain insights into the parameters affecting the trained model’s precision.

2. Materials and Methods

In order to build a model capable of detecting certain species, a dataset was needed for the training of the neural network. There is a growing number of datasets with various animals available [27], but as this study was a proof-of-concept, it was meant to show that a dataset of any target species can be built with drone images fairly simply. The custom-trained models should be able to detect specific species, or even individuals, in a specific environment or setting [29]. The efficacy of the trained models is very dependent on the settings of the image material it will be used upon. The more similarities there are between the environmental settings of the stock datasets images and the real-life settings that the model is applied upon, the better the model [27]. Roboflow.com, an end-to-end computer vision platform, was used for manual annotation, and the CNN used for custom training and detection was YOLOv5 [19], both described in detail below.

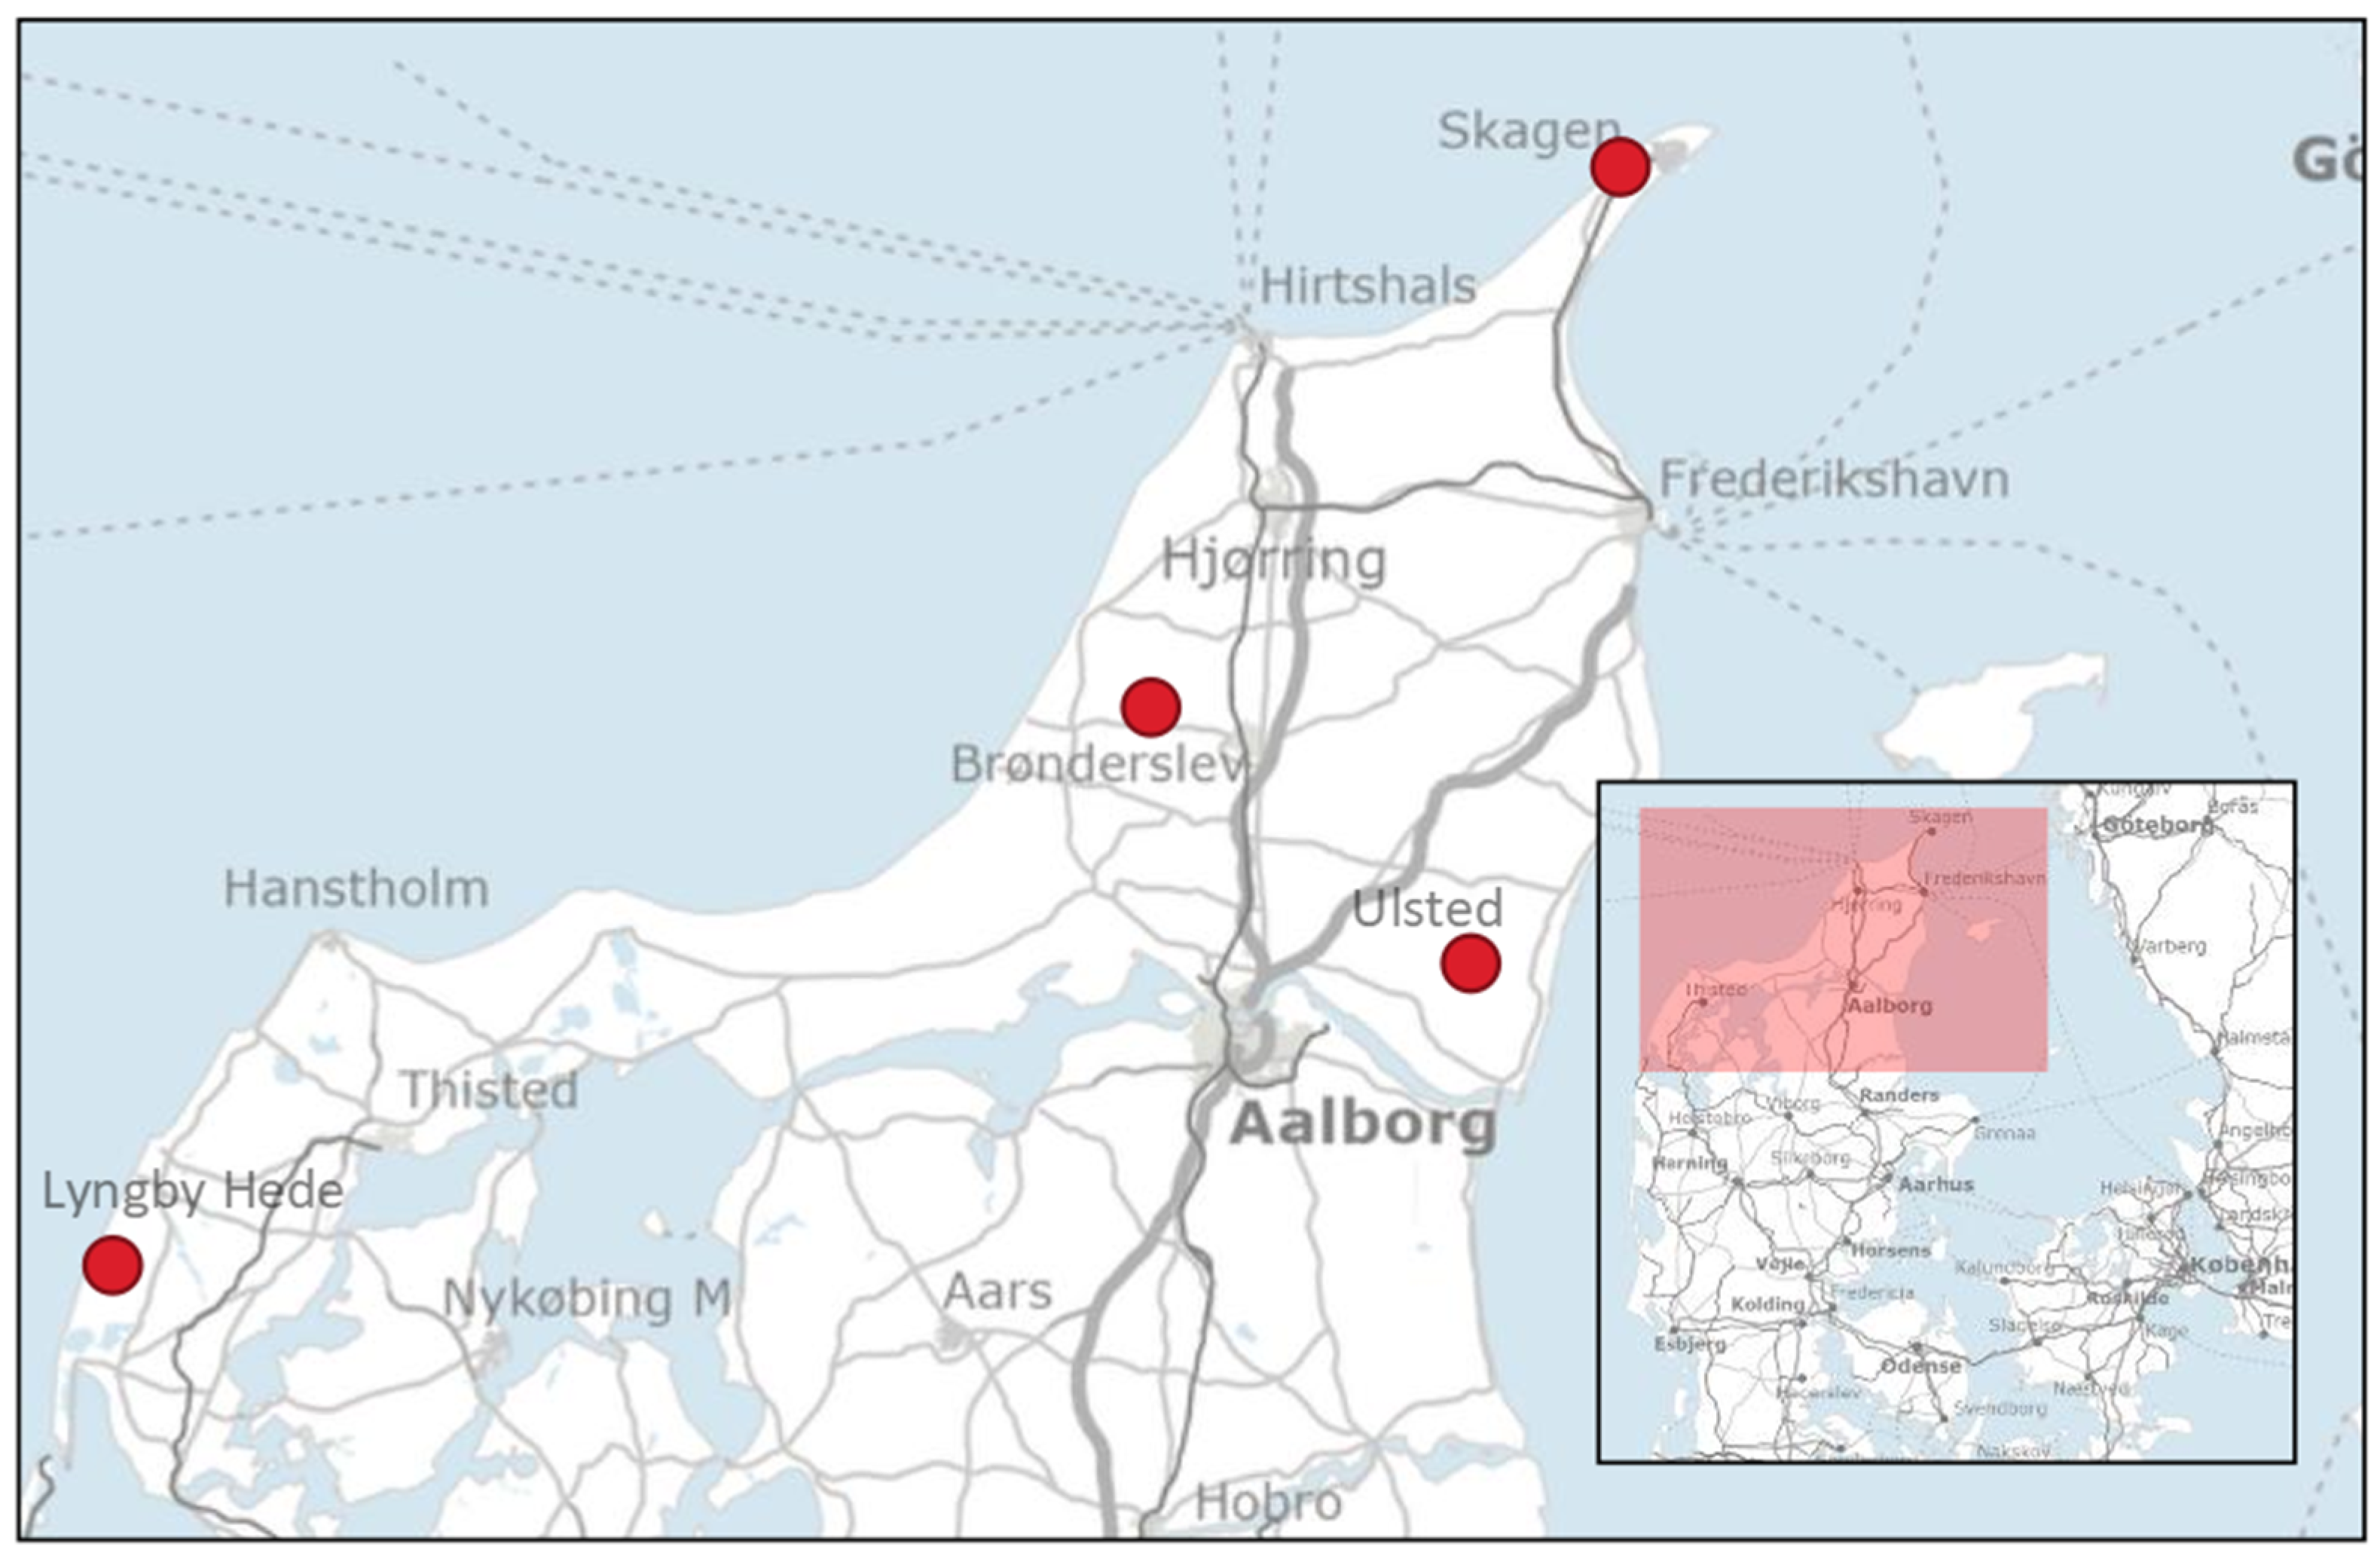
2.1. Collecting Thermal Footage of the Species

To build up a database of thermal images for later annotation, two drones were used: a DJI Mavic 2 Enterprise Advanced (M2EA) and a DJI Matrice 300RTK (M300) with a Zenmuse H20N payload. The thermal camera on the M2EA had a resolution of 640 × 512 pixels, a field of view (FOV) of 48°, and 16× digital zoom. The two thermal cameras in the H20N both had a resolution of 640 × 512 pixels, a FOV of 45.5° and 12.5°, with 4× and 32× zoom, respectively. The chosen thermal color palette was white-hot consistently for all footage, to keep it simple and broadly applicable. The imagery was captured by night, in biotopes ranging from heath and dunes in areas near Skagen and Lyngby Hede, Thy, to woodland and agricultural areas near Ulsted and Brønderslev, Denmark (Figure 1).
Weather conditions ranged from dry nights at temperatures around 10 °C, over heavy rain at temperatures around 5 °C (M300 only), to snow-covered ground at temperatures around −5 °C. The drone-mounted thermal cameras did not show an absolute temperature range, but a relative one, so the difference between these weather conditions was not obvious in the footage afterwards. However, in the snow-covered landscapes, footprints and tracks were very visible. Rain did not obscure the footage noticeably, but the occasional heavy fog could cover the lens with condensation, rendering the cameras almost unusable. The contrasts between the animals and the background with ambient temperatures were more dependent on what was in the frame, e.g., trees, big patches of monotonous field, sea, or sky, than the actual temperature difference. Emissivity, the characteristic of specific materials’ ability to emit and absorb thermal radiation, also plays a big part in how objects seen through the thermal lens present themselves in relation to each other. Still, images from the video footage were captured with VLC using VideoLAN.

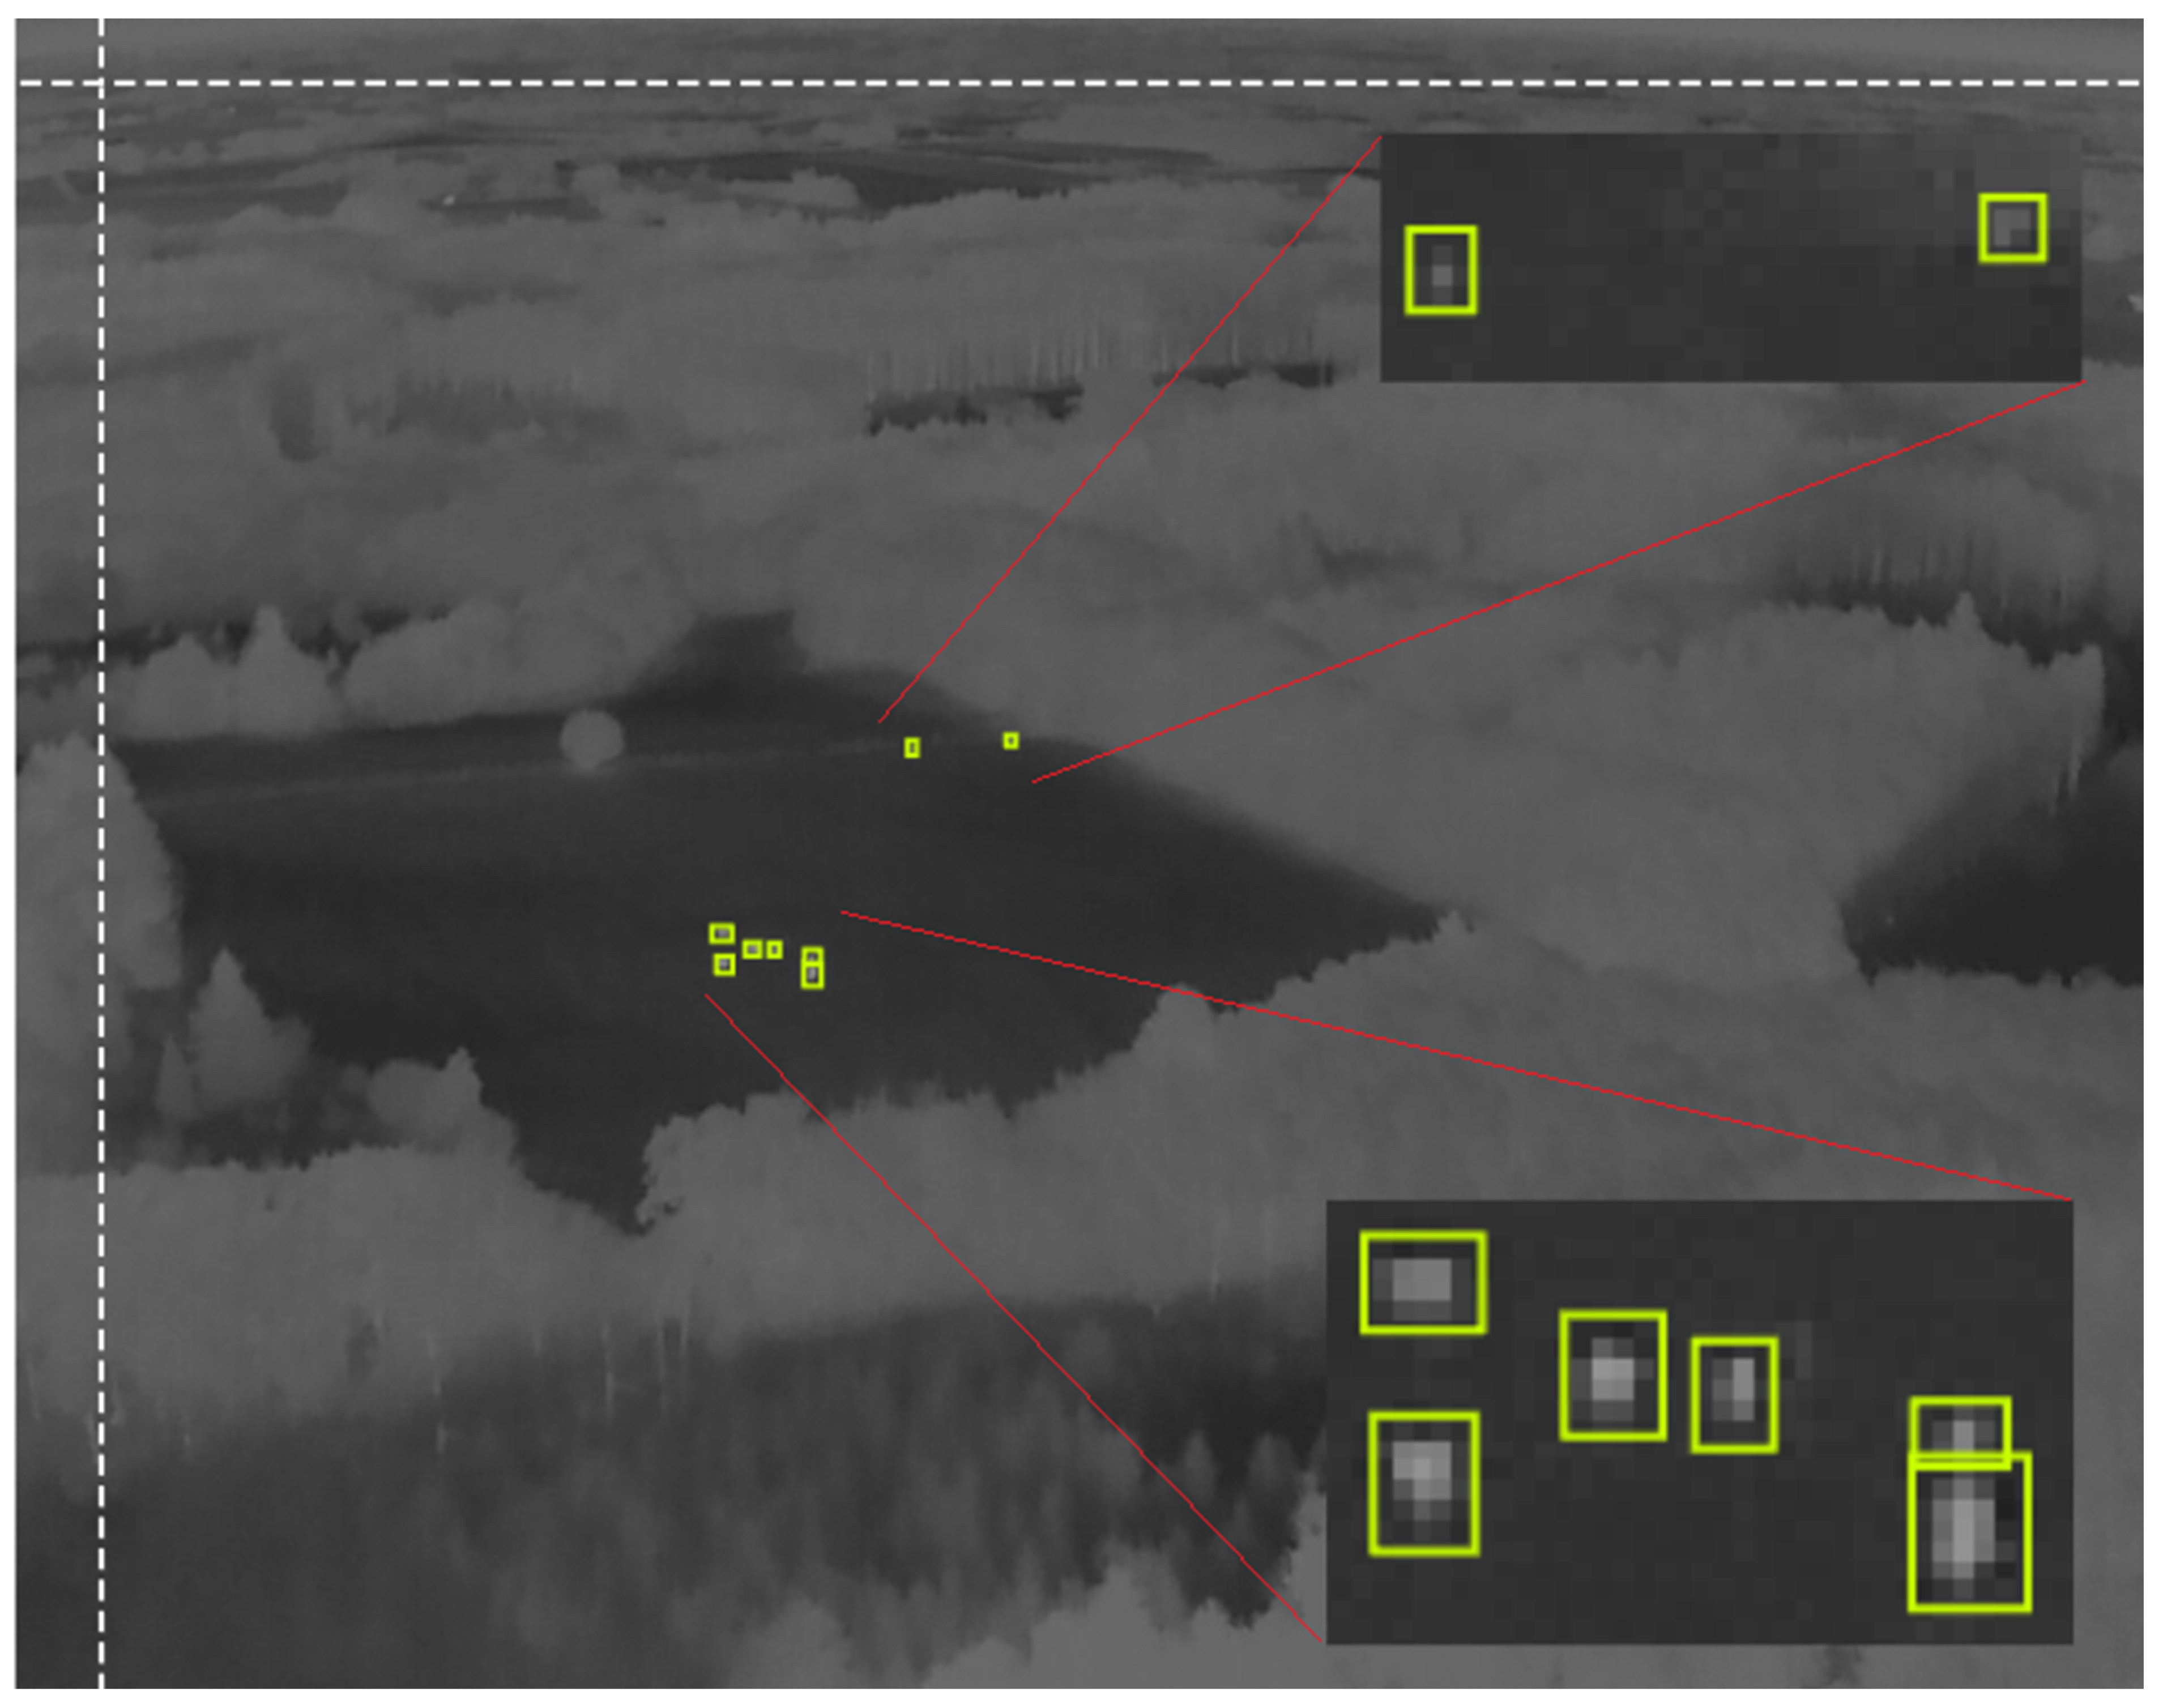
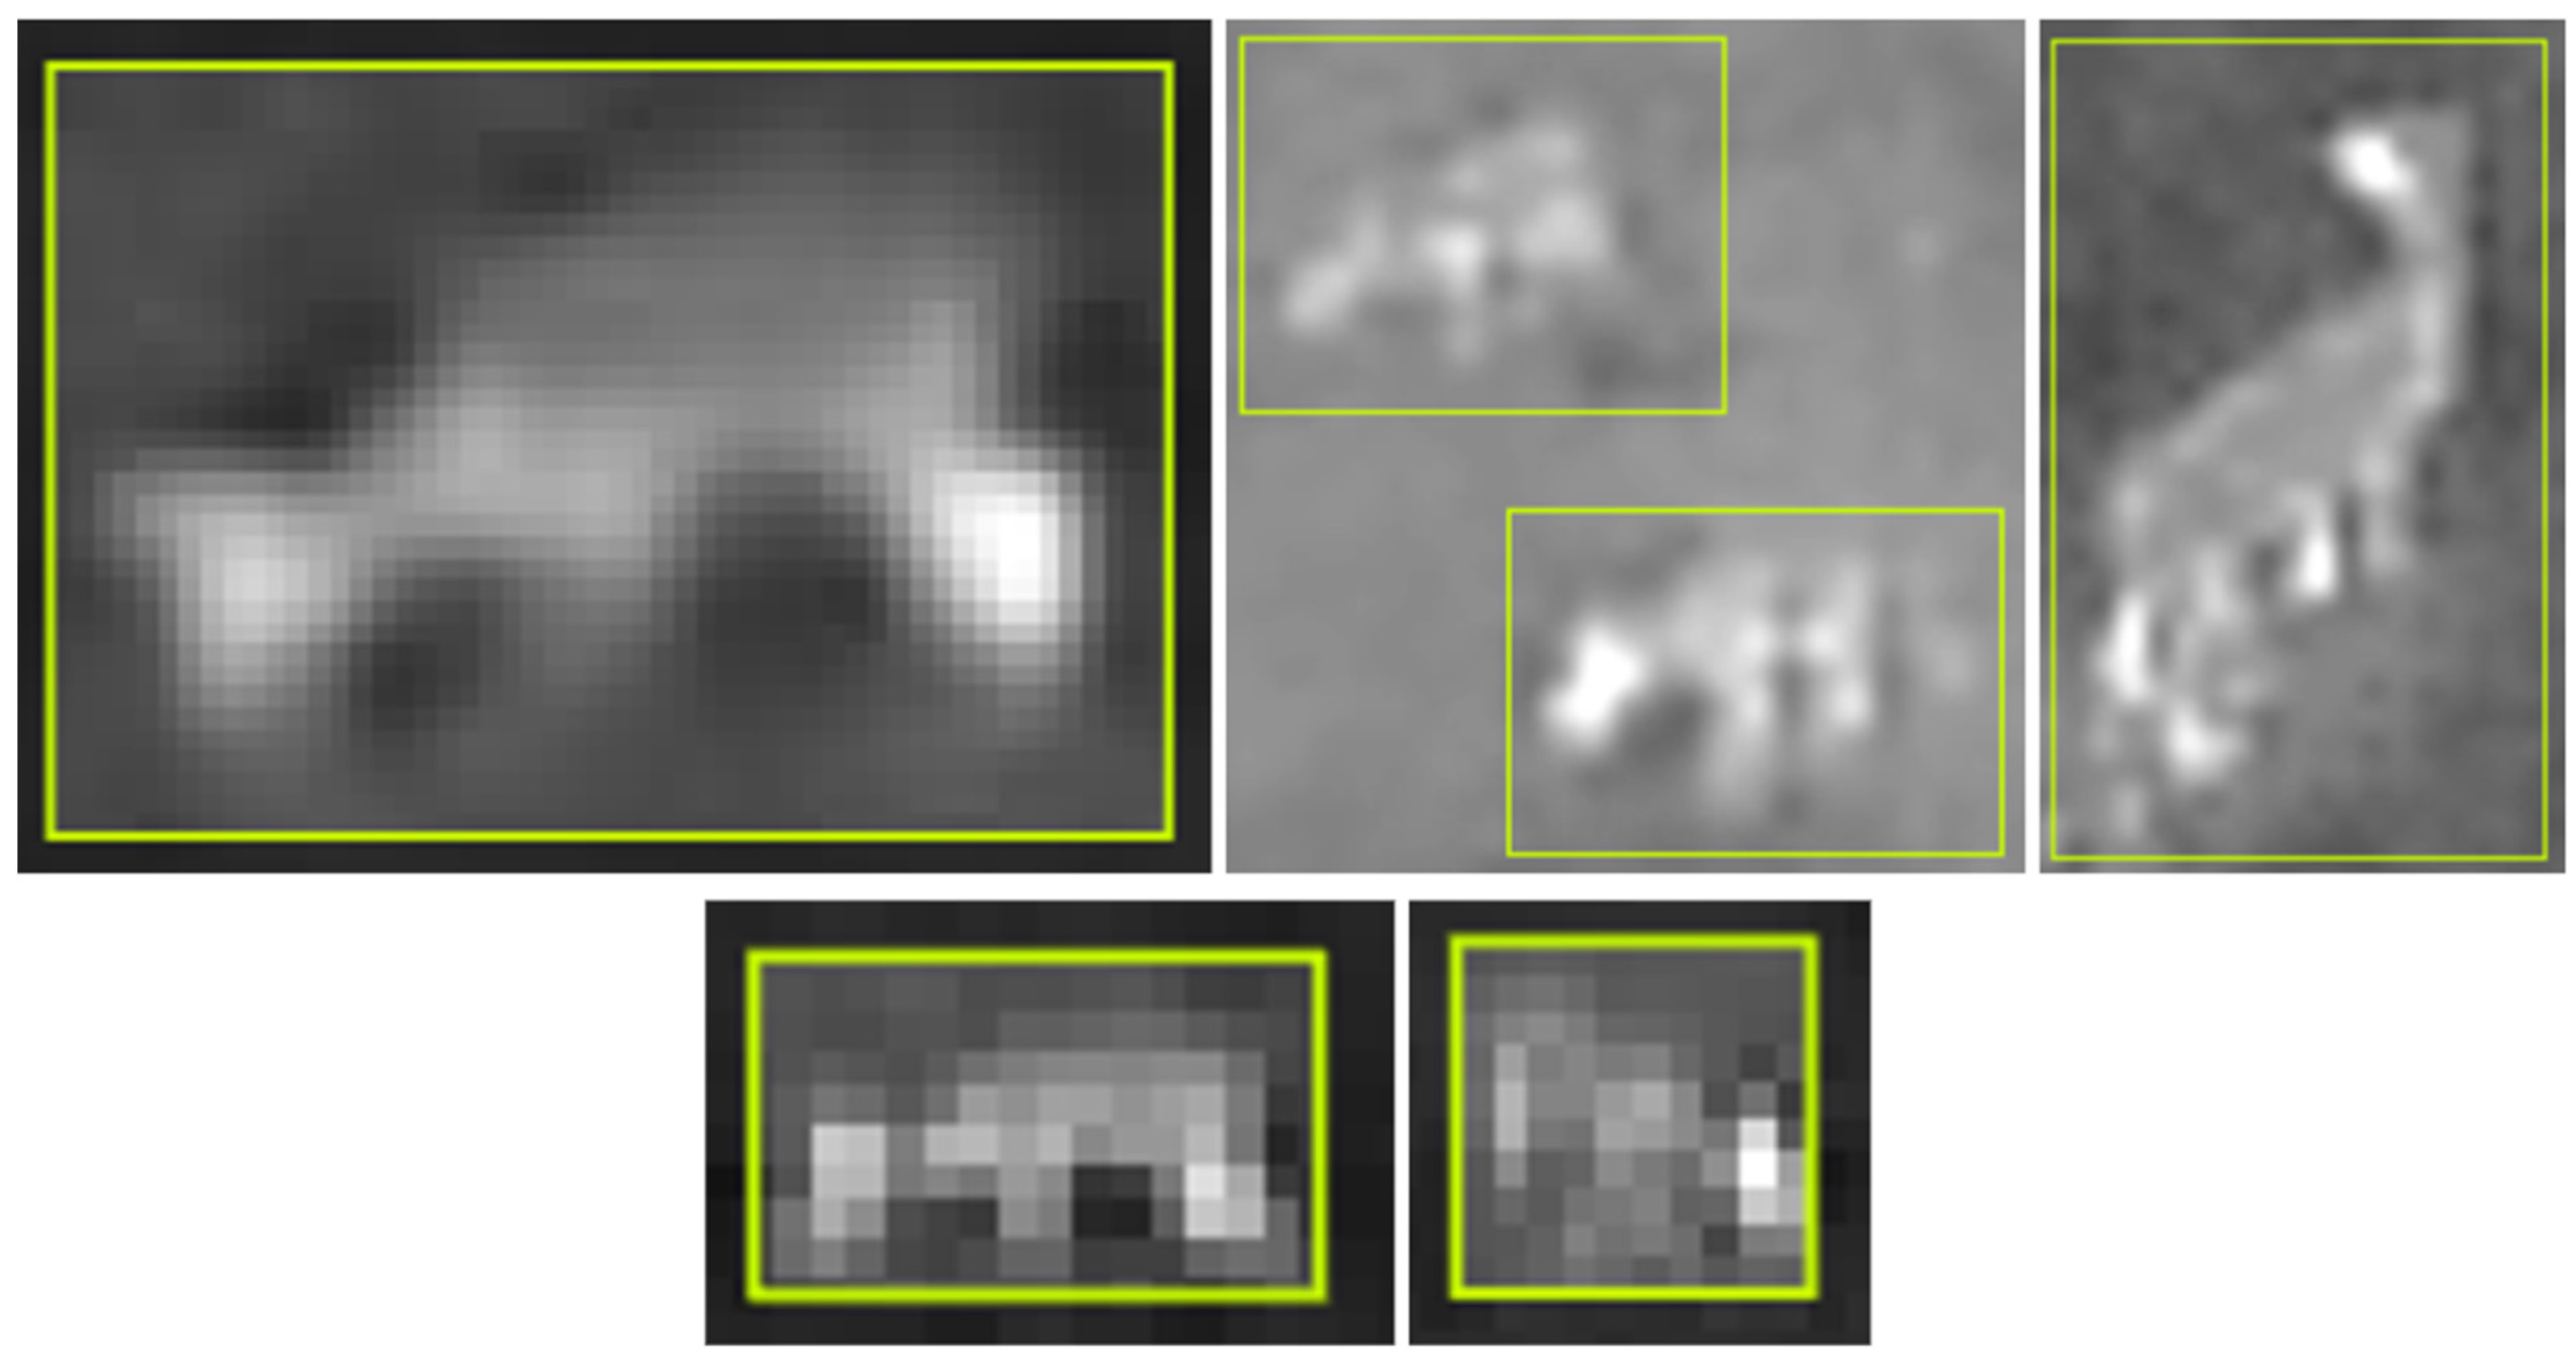
2.2. Image Annotation

For manual annotations of the images, comprising the datasets used for training of the models, Roboflow.com was used. Square bounding boxes were placed around the objects, with the three classes: points of interest (POIs) (Figure 2), hare (Figure 3), and roe deer (Figure 4). POIs are everything that a drone pilot would react to and zoom in on to inspect further when manually searching for animals in the terrain. Images of hare and roe deer were taken from various flight heights and zoom levels, and species recognition was performed manually based on both contour and patterns of movement. The datasets included images with no objects as a baseline to improve the distinction of background when training [27].
Augmentations were applied to the annotated images to create a larger and more robust dataset. These produced copies of the images that were flipped horizontally and vertically and rotated 90° clockwise, counterclockwise, and upside down. Other augmentations, such as cropping, blur, saturation, and brightness, were not applied to the dataset to keep it simple. In the preprocessing, the images were resized to fit within 640 × 512 pixels [27]. The dataset, including the augmentations, was divided into a training set, a validation set, and a test set for each of the three models: hare, roe deer, and POI (Table 1).

2.3. Custom Training of YOLOv5 for Object Detection

To custom train YOLOv5 neural networks, an online Google Colab repository, or Notebook, maintained by Roboflow was used (https://github.com/roboflow/notebooks/blob/main/notebooks/train-yolov5-object-detection-on-custom-data.ipynb (accessed on 21 December 2023) [30]. This repository integrates seamlessly with the online Roboflow software, and the annotated datasets were inserted directly by a link. There are, however, many other options, online as well as offline, to train a YOLOv5 model [19,22,27,30]. The specific training parameters used were as follows: image size of 640, batch number of 16, 300 epochs, and yolov5l.pt weights (large model) [18]. The remaining hyperparameters were default.

2.4. Evaluating Model Accuracy, Detection, and False Positives and False Negatives

To assess the training, the plugin Weights & Biases, an AI developer platform, was used (wandb.ai). This automatically stores data about each training progress and calculates parameters such as precision, recall, and mAP to be accessed online later. An amount of 300 epochs was chosen as standard, but most training sessions had the best mAP_0.50 at less than 100 epochs and therefore ended automatically at around 200 epochs.
Mean average precision can be a good indicator of the precision of the trained model [18,27]. However, it assumes that all false positives and false negatives are registered using the input test set, which leaves room for bias. Therefore, we have manually tested a small sample to check for false positive and negative detections (Figure 5) to hold this against the mAP calculated using the model itself, showing a method to assess the trained models’ own assessments of precision.
To manually test the number of false positives and false negatives that the models would produce on a new set of images, 100 aerial images of both hare, roe deer, and POIs, in similar settings and zoom range as the training datasets, were chosen to be run through the trained models. The confidence threshold for the YOLOv5 detection was set to 0.5 and 0.8 for hare and roe deer, and 0.2, 0.5, and 0.8 for POIs, meaning that detected objects with a confidence score lower than the selected threshold would not be included in the output (Figure 5). A confidence threshold of 0.2 is too low for practical use, but it was included to assess the number of false negatives and false positives the model produced at this level. The detections were made offline on an Anaconda-installed version of YOLOv5 (git cloned in January and February 2023) but using the models trained in the Google Colab repository.

3. Results

The mAP of the models was 0.99 and 0.96 for hare and roe deer, while for POIs it was 0.43. The best mAP for all models was reached at 100 epochs (Figure 6). The relatively low mAP for the POI model is also seen in the manually tested false negatives and false positives, where only 60% of the detections were annotated correctly, at a confidence limit of 0.20, while the hare model and the roe deer model had 72% and 97% correctly annotated, with 0% and 24% false positives (see Table 2 for all values). Precision and recall could be re-calculated from the manual results to find the best confidence threshold, but as model optimization was not the goal of this study, it was refrained.

4. Discussion

The mAPs of the hare model and the roe-deer model were very high, 0.99 and 0.96 (Table 2), and it is likely that the roe deer model could become even more precise with a larger training dataset (Table 1) [27,30]. The high mAP could be a sign of overfitting; however, the images upon which the trained models were applied were in similar settings and zoom range as the training datasets, making overfitting less likely. The POI model only reached 0.43 (Table 2) and would need improvement to be useful. This could be achieved by building a larger training dataset, possibly even several datasets, with more similarities to the settings the model should later be applied upon, such as weather conditions, drone flight height, and biotope type [27,30]. Since the POI should be detected at longer distances (>500 m), they consist of very few pixels; therefore, a variation of, or addition to, the YOLOv5 framework to detect very small objects and optimized for thermal imagery, should be added [12,17,26]. When choosing images for datasets, objects should have approximately the same size as in the target footage that the model would be applied upon [8].
The manual test for false negatives and false positives showed that, with the trained models, the optimal confidence level threshold for the hare model and roe deer model lies somewhere between 0.50 and 0.80 to give the optimal ratio between correct annotations, false negatives, and false positives (Table 2). This would also be improved with a larger training dataset tailored to the situation. The POI model only annotated 60% correctly at the lowest confidence limit of 0.20, which also suggests that this trained model needs further improvement to be functional. The mAP curves (Figure 6) showed that less than 100 epochs were sufficient to reach the optimal mAP during training. This indicates that relatively little training time is needed, even with a significantly larger training dataset. The method of manually assessing false negatives and false positives was very time-consuming but indicates that, even with a mAP near 1.0, the models can produce more than 20% false positives at a confidence limit of 0.50 and miss 28% of the objects needed to be detected at a confidence limit of 0.80 (Table 2). This points out that mAP should not be the only parameter used to assess a trained model. As mentioned, several initiatives could be taken to improve the models, such as building a sufficiently large training dataset and customizing the dataset to the specific setting where object detection would be applied, but further studies are needed to elucidate this. This method could be used to assess and pinpoint the most significant of the tweaked parameters.

4.1. Conceptual Algorithm for Automated Wildlife Monitoring Using YBUT

In Figure 7, we propose a conceptual algorithm for implementing real-time object detection in unmanned aircraft systems (UASs), with the ambition of automating wildlife monitoring. This concept requires a drone mounted with a camera with good zoom capabilities and a laser rangefinder. Increased spatial accuracy can be achieved with RTK technology (Real-Time Kinematic positioning) but is not a necessity. The flowchart starts with the drone flying autonomously in a predetermined flight path at a high altitude. In most countries with EU legislation, the maximum altitude is 120 m [31]. The camera is angled at 45°, and the camera feed is passed through external hardware with a graphics processing unit (GPU), such as a Jetson Nano or similar, or the DJI developer kit. On this external hardware, neural networks (NNs), such as pre-trained YOLOv5, would be installed and running, continuously detecting the camera feed.
In the first stage, only the NN trained to detect POI would be activated. When a POI is detected, a script takes over the user controls to fly the drone and control the camera autonomously, but with the possibility of the drone operator overriding and overtaking manual control. This script would require extensive development and fine tuning to be functional, depending on the accessibility of the UAS. The script will stop and hover the drone mid-flight and take over the controls of the camera to zoom in on the detected POI, while saving the GPS coordinate using the laser rangefinder. Meanwhile, it switches to another NN that is trained to detect several target species, and possibly even sex or age if using segmentation annotating NN, or individuals [29]. If the density of the monitored animals is high, a NN trained to detect groups of animals may be needed [17]. The script will zoom in on, and possibly track, the POI until a detection is made. If detection is not possible within a predetermined time frame, the observation would be registered as unidentified. This annotation will be saved along with the coordinate, the camera will zoom out, and the script will reset to look for new POIs.

4.2. Limitations of Study

As the proposed algorithm is merely conceptual, there will be several challenges to be solved, such as keeping track of the detected animals if they are moving, so they will not be counted twice, and keeping track of POIs to investigate. Legislation may also prove to be an obstacle, since most countries only allow flying a drone within the visual line of sight (VLOS) of the drone operator without special permits [31]. Safety issues, such as the risk of losing control of the drone, must also be addressed. The mAPs (Table 2) suggest that the selection of training data for the POI should be revised, enhanced, and possibly differentiated into specific habitats, settings, and weather conditions. It would be useful to investigate the effects of background composition in the training data and the degree of similarity to the settings that the object detection is applied upon.

4.3. Similar Studies and Perspectives

Since the start of this project, several iterations and improvements on the YOLO models have been released, with YOLOv8, YOLO-NAS, and YOLO9000 being some of the state-of-the-art models at the time of writing. Which model to choose depends on the choice in hardware and application, but the differences in performance between the models are minor compared to the importance of the quality of the training datasets [27]. Several studies have combined aerial footage analysis with the use of machine learning [4,6,8,12,14,15,25,32,33,34,35,36,37], and the increased use of drones for wildlife surveys highlights the need for automation when analyzing imagery. This opens up possibilities of combining real-time object detection and tracking with commercial drone technology. The newest YOLO models have been shown to be able to track and count objects in real-time using custom-trained versions [27], making it possible to quantify a survey directly. With the fast development of image segmentation, only marking the pixels containing objects for detection, and implementation of unsupervised learning, the resolution of the gathered data can become significantly higher, making it possible to determine sex, age, body condition, or even recognition of individual animals.

5. Conclusions

In this study, we presented a basic, conceptual algorithm for implementing real-time convolutional neural network-based object detection in unmanned aircraft systems, with the ambition of automating wildlife monitoring. We trained YOLOv5 neural networks to detect points of interest (mAP 0.43), hare (mAP 0.99), and roe deer (mAP 0.96) in thermal aerial footage. The mAPs suggest that the selection of training data for the POI should be revised, enhanced, and possibly differentiated into specific habitats, settings, and weather conditions. We proposed a simple method to determine the ratio of true false positive and true false negative detections to assess the given mAP, and to gain insights into the parameters affecting the trained model’s precision. This showed that the object detection model’s own assessment of the training would miss a number of false positives and false negatives, even with a mAP near 1, which indicates that mAP should not be the only parameter used to assess a trained model, and that manual control is needed. Several initiatives could be taken to improve the models, such as building a sufficiently large training dataset and customizing the dataset to the specific setting in need of object detection, but further studies are needed to elucidate this. This method could be used to assess and pinpoint the most significant of the tweaked parameters.

Author Contributions

Conceptualization, P.P., D.B., P.D., D.O.A. and C.P.; methodology, P.P.; formal analysis, P.P.; investigation, P.P.; resources, D.B. and C.P.; data curation, P.P.; writing—original draft preparation, P.P.; writing—review and editing, P.P., D.B., P.D., D.O.A. and C.P.; visualization, P.P.; supervision, D.B., P.D., D.O.A. and C.P.; funding acquisition, C.P. and D.B. All authors have read and agreed to the published version of the manuscript.

Funding

This research was funded by The Institute Infrastructure funding (Aalborg University) and the Aalborg Zoo Conservation Foundation (AZCF: grant number 07-2022). Thank you for your support and for making this study possible.

Data Availability Statement

The data presented in this study are available on request from the corresponding author.

Conflicts of Interest

The authors declare no conflict of interest. The funders had no role in the design of the study; in the collection, analyses, or interpretation of data; in the writing of the manuscript; or in the decision to publish the results.

References

  1. Linchant, J.; Lisein, J.; Semeki, J.; Lejeune, P.; Vermeulen, C. Are unmanned aircraft systems (UASs) the future of wildlife monitoring? A review of accomplishments and challenges. Mammal. Rev. 2015, 45, 239–252. [Google Scholar] [CrossRef]
  2. Lyu, X.; Li, X.; Dang, D.; Dou, H.; Wang, K.; Lou, A. Unmanned Aerial Vehicle (UAV) Remote Sensing in Grassland Ecosystem Monitoring: A Systematic Review. Remote Sens. 2022, 14, 1096. [Google Scholar] [CrossRef]
  3. Corcoran, E.; Winsen, M.; Sudholz, A.; Hamilton, G. Automated detection of wildlife using drones: Synthesis, opportunities and constraints. Methods Ecol. Evol. 2021, 12, 1103–1114. [Google Scholar] [CrossRef]
  4. Petso, T.; Jamisola, R.S.; Mpoeleng, D. Review on methods used for wildlife species and individual identification. Eur. J. Wildl. Res. 2022, 68, 3. [Google Scholar] [CrossRef]
  5. Robinson, J.M.; Harrison, P.A.; Mavoa, S.; Breed, M.F. Existing and emerging uses of drones in restoration ecology. Methods Ecol. Evol. 2022, 13, 1899–1911. [Google Scholar] [CrossRef]
  6. Chen, C.; Zheng, Z.; Xu, T.; Guo, S.; Feng, S.; Yao, W.; Lan, Y. YOLO-Based UAV Technology: A Review of the Research and Its Applications. Drones 2023, 7, 190. [Google Scholar] [CrossRef]
  7. Tomljanovic, K.; Kolar, A.; Duka, A.; Franjevic, M.; Jurjevic, L.; Matak, I.; Ugarkovic, D.; Balenovic, I. Application of UAS for Monitoring of Forest Ecosystems—A Review of Experience and Knowledge. Croat. J. For. Eng. 2022, 43, 487–504. [Google Scholar] [CrossRef]
  8. Psiroukis, V.; Malounas, I.; Mylonas, N.; Grivakis, K.; Fountas, S.; Hadjigeorgiou, I. Monitoring of free-range rabbits using aerial thermal imaging. Smart Agric. Technol. 2021, 1, 100002. [Google Scholar] [CrossRef]
  9. Povlsen, P.; Bruhn, D.; Pertoldi, C.; Pagh, S. A Novel Scouring Method to Monitor Nocturnal Mammals Using Uncrewed Aerial Vehicles and Thermal Cameras—A Comparison to Line Transect Spotlight Counts. Drones 2023, 7, 661. [Google Scholar] [CrossRef]
  10. Chrétien, L.; Théau, J.; Ménard, P. Wildlife multispecies remote sensing using visible and thermal infrared imagery acquired from an unmanned aerial vehicle (UAV). Int. Arch. Photogramm. Remote Sens. Spat. Inf. Sci. 2015, XL-1/W4, 241–248. [Google Scholar] [CrossRef]
  11. Beaver, J.T.; Baldwin, R.W.; Messinger, M.; Newbolt, C.H.; Ditchkoff, S.S.; Silman, M.R. Evaluating the Use of Drones Equipped with Thermal Sensors as an Effective Method for Estimating Wildlife. Wildl. Soc. Bull. 2020, 44, 434–443. [Google Scholar] [CrossRef]
  12. Baidya, R.; Jeong, H. YOLOv5 with ConvMixer Prediction Heads for Precise Object Detection in Drone Imagery. Sensors 2022, 22, 8424. [Google Scholar] [CrossRef] [PubMed]
  13. Zhang, M.; Gao, F.; Yang, W.; Zhang, H. Wildlife Object Detection Method Applying Segmentation Gradient Flow and Feature Dimensionality Reduction. Electronics 2023, 12, 377. [Google Scholar] [CrossRef]
  14. Winsen, M.; Denman, S.; Corcoran, E.; Hamilton, G. Automated Detection of Koalas with Deep Learning Ensembles. Remote Sens. 2022, 14, 2432. [Google Scholar] [CrossRef]
  15. Rominger, K.R.; Meyer, S.E. Drones, Deep Learning, and Endangered Plants: A Method for Population-Level Census Using Image Analysis. Drones 2021, 5, 126. [Google Scholar] [CrossRef]
  16. Tan, M.; Chao, W.; Cheng, J.; Zhou, M.; Ma, Y.; Jiang, X.; Ge, J.; Yu, L.; Feng, L. Animal Detection and Classification from Camera Trap Images Using Different Mainstream Object Detection Architectures. Animals 2022, 12, 1976. [Google Scholar] [CrossRef]
  17. Pei, Y.; Xu, L.; Zheng, B. Improved YOLOv5 for Dense Wildlife Object Detection; Deng, W., Feng, J., Huang, D., Kan, M., Sun, Z., Zheng, F., Wang, W., He, Z., Eds.; Springer Nature Switzerland: Cham, Switzerland, 2022; pp. 569–578. [Google Scholar]
  18. Eikelboom, J.A.J.; Wind, J.; van de Ven, E.; Kenana, L.M.; Schroder, B.; de Knegt, H.J.; van Langevelde, F.; Prins, H.H.T. Improving the precision and accuracy of animal population estimates with aerial image object detection. Methods Ecol. Evol. 2019, 10, 1875–1887. [Google Scholar] [CrossRef]
  19. Ultralytics/YOLOv5. Available online: https://github.com/ultralytics/yolov5 (accessed on 27 April 2023).
  20. Redmon, J.; Farhadi, A. YOLOv3: An Incremental Improvement. arXiv 2018, arXiv:1804.02767. [Google Scholar] [CrossRef]
  21. Redmon, J.; Divvala, S.; Girshick, R.; Farhadi, A. You Only Look Once: Unified, Real-Time Object Detection. In Proceedings of the 2016 IEEE Conference on Computer Vision and Pattern Recognition (CVPR), Las Vegas, NV, USA, 27–30 June 2016; pp. 779–788. [Google Scholar]
  22. Ultralytics.com. Available online: https://docs.ultralytics.com/ (accessed on 28 April 2023).
  23. DJI Matrice 300RTK. Available online: https://www.dji.com/dk/matrice-300 (accessed on 27 April 2023).
  24. Whitworth, A.; Pinto, C.; Ortiz, J.; Flatt, E.; Silman, M. Flight speed and time of day heavily influence rainforest canopy wildlife counts from drone-mounted thermal camera surveys. Biodivers Conserv. 2022, 31, 3179–3195. [Google Scholar] [CrossRef]
  25. Dai, W.; Wang, H.; Song, Y.; Xin, Y. Wildlife small object detection based on enhanced network in ecological surveillance. In Proceedings of the 33rd Chinese Control and Decision Conference (CCDC), Kunming, China, 22–24 May 2021. [Google Scholar]
  26. Li, S.; Li, Y.; Li, Y.; Li, M.; Xu, X. YOLO-FIRI: Improved YOLOv5 for Infrared Image Object Detection. IEEE 2021, 9, 141861–141875. [Google Scholar] [CrossRef]
  27. Roboflow.com. Available online: https://help.roboflow.com/ (accessed on 27 April 2023).
  28. Povlsen, P.; Linder, A.C.; Larsen, H.L.; Durdevic, P.; Arroyo, D.O.; Bruhn, D.; Pertoldi, C.; Pagh, S. Using Drones with Thermal Imaging to Estimate Population Counts of European Hare (Lepus europaeus) in Denmark. Drones 2023, 7, 5. [Google Scholar] [CrossRef]
  29. Clapham, M.; Miller, E.; Nguyen, M.; Darimont, C.T. Automated facial recognition for wildlife that lack unique markings: A deep learning approach for brown bears. Ecol. Evol. 2020, 10, 12883–12892. [Google Scholar] [CrossRef] [PubMed]
  30. Roboflow Notebooks. Available online: https://github.com/roboflow/notebooks (accessed on 27 April 2023).
  31. Droneregler.dk. Available online: https://www.droneregler.dk/ (accessed on 27 April 2023).
  32. Zhao, J.; Zhang, X.; Yan, J.; Qiu, X.; Yao, X.; Tian, Y.; Zhu, Y.; Cao, W. A wheat spike detection method in UAV images based on improved yolov5. Remote Sens. 2021, 13, 3095. [Google Scholar] [CrossRef]
  33. Lee, S.; Song, Y.; Kil, S. Feasibility Analyses of Real-Time Detection of Wildlife Using UAV-Derived Thermal and RGB Images. Remote Sens. 2021, 13, 2169. [Google Scholar] [CrossRef]
  34. Micheal, A.A.; Vani, K.; Sanjeevi, S.; Lin, C. Object Detection and Tracking with UAV Data Using Deep Learning. J. Indian Soc. Remote Sens. 2021, 49, 463–469. [Google Scholar] [CrossRef]
  35. Lipping, T.; Linna, P.; Narra, N. New Developments and Environmental Applications of Drones: Proceedings of FinDrones 2020; Springer International Publishing AG: Cham, Switzerland, 2021. [Google Scholar]
  36. Partheepan, S.; Sanati, F.; Hassan, J. Autonomous Unmanned Aerial Vehicles in Bushfire Management: Challenges and Opportunities. Drones 2023, 7, 47. [Google Scholar] [CrossRef]
  37. Chen, J.; Chen, Z.; Huang, R.; You, H.; Han, X.; Yue, T.; Zhou, G. The Effects of Spatial Resolution and Resampling on the Classification Accuracy of Wetland Vegetation Species and Ground Objects: A Study Based on High Spatial Resolution UAV Images. Drones 2023, 7, 61. [Google Scholar] [CrossRef]
Figure 1. Map of the areas where the thermal imagery was captured: Lyngby Hede, Brønderslev, Ulsted, and Skagen, Denmark.
Drones 08 00002 g001
Figure 2. Examples of manually generated bounding boxes (yellow lines) annotating points of interest (POIs) in a thermal image. The image was captured at nighttime, 700 m away from the animals, with a white-hot, relative temperature palette. The animals were during the flight identified as roe deer (Capreolus capreolus).
Drones 08 00002 g002
Figure 3. Examples of manually generated bounding boxes (purple lines) annotating hare (Lepus europaeus) in thermal images. The images were captured at nighttime, 60–500 m away from the animals, with a white-hot, relative temperature palette. The animals were manually identified by both contour and movement patterns.
Drones 08 00002 g003
Figure 4. Examples of manually generated bounding boxes (yellow lines) annotating roe deer (Capreolus capreolus) in thermal images. The images were captured at nighttime, 120–500 m away from the animals, with a white-hot, relative temperature palette. The animals were manually identified by both contour and movement patterns.
Drones 08 00002 g004
Figure 5. Examples of automatically annotated thermal images, including false positives and false negatives, and the corresponding confidence scores. Bounding boxes were made with object detection, using custom-trained YOLOv5 neural networks. The images were captured at nighttime, 60–300 m away from the animals, with a white-hot, relative temperature palette. The animals, false positives, and false negatives were later manually identified by both contour and movement patterns in the original footage.
Drones 08 00002 g005
Figure 6. mAP curves for the training of the models detecting points of interest, hare, and roe deer.
Drones 08 00002 g006
Figure 7. A conceptual flowchart of a proposed algorithm for implementing real-time object detection with several custom-trained neural networks in unmanned aircraft systems (UASs), with the ambition of automating wildlife monitoring.
Drones 08 00002 g007
Table 1. The number of images before augmentations, approximate number of objects per image, and the total number of training, validation, and test images, including the augmented images, to comprise the three datasets (hare, roe deer, and point of interest) for training.
Number of
Annotated Images
Number of
Objects per Image
Number of Training Set Images Number of Validation Set Images Number of Test Set Images
Hare627~1.1131012340
Roe deer158~1.33133117
POI260~5.45494621
Table 2. The model and chosen confidence limit of the detection and the mean average precision (mAP) of the trained neural networks. The number of objects in the 100 images per detection run and the percentage of correctly annotated objects, false negatives, and false positives produced by the models at various confidence limits and manually identified.
Model/
Confidence Limit
Trained
Model mAP
Number
of Object
Correctly
Annotated %
False
Negative %
False
Positive %
Hare 0.500.99169100021
Hare 0.800.9916972280
Roe deer 0.500.96133100058
Roe deer 0.800.9613397324
POI 0.200.43624604010
POI 0.500.4362429712
POI 0.800.4362401000
Disclaimer/Publisher’s Note: The statements, opinions and data contained in all publications are solely those of the individual author(s) and contributor(s) and not of MDPI and/or the editor(s). MDPI and/or the editor(s) disclaim responsibility for any injury to people or property resulting from any ideas, methods, instructions or products referred to in the content.

