
MGFNet: A Progressive Multi-Granularity Learning Strategy-Based Insulator Defect Recognition Algorithm for UAV Images


Abstract
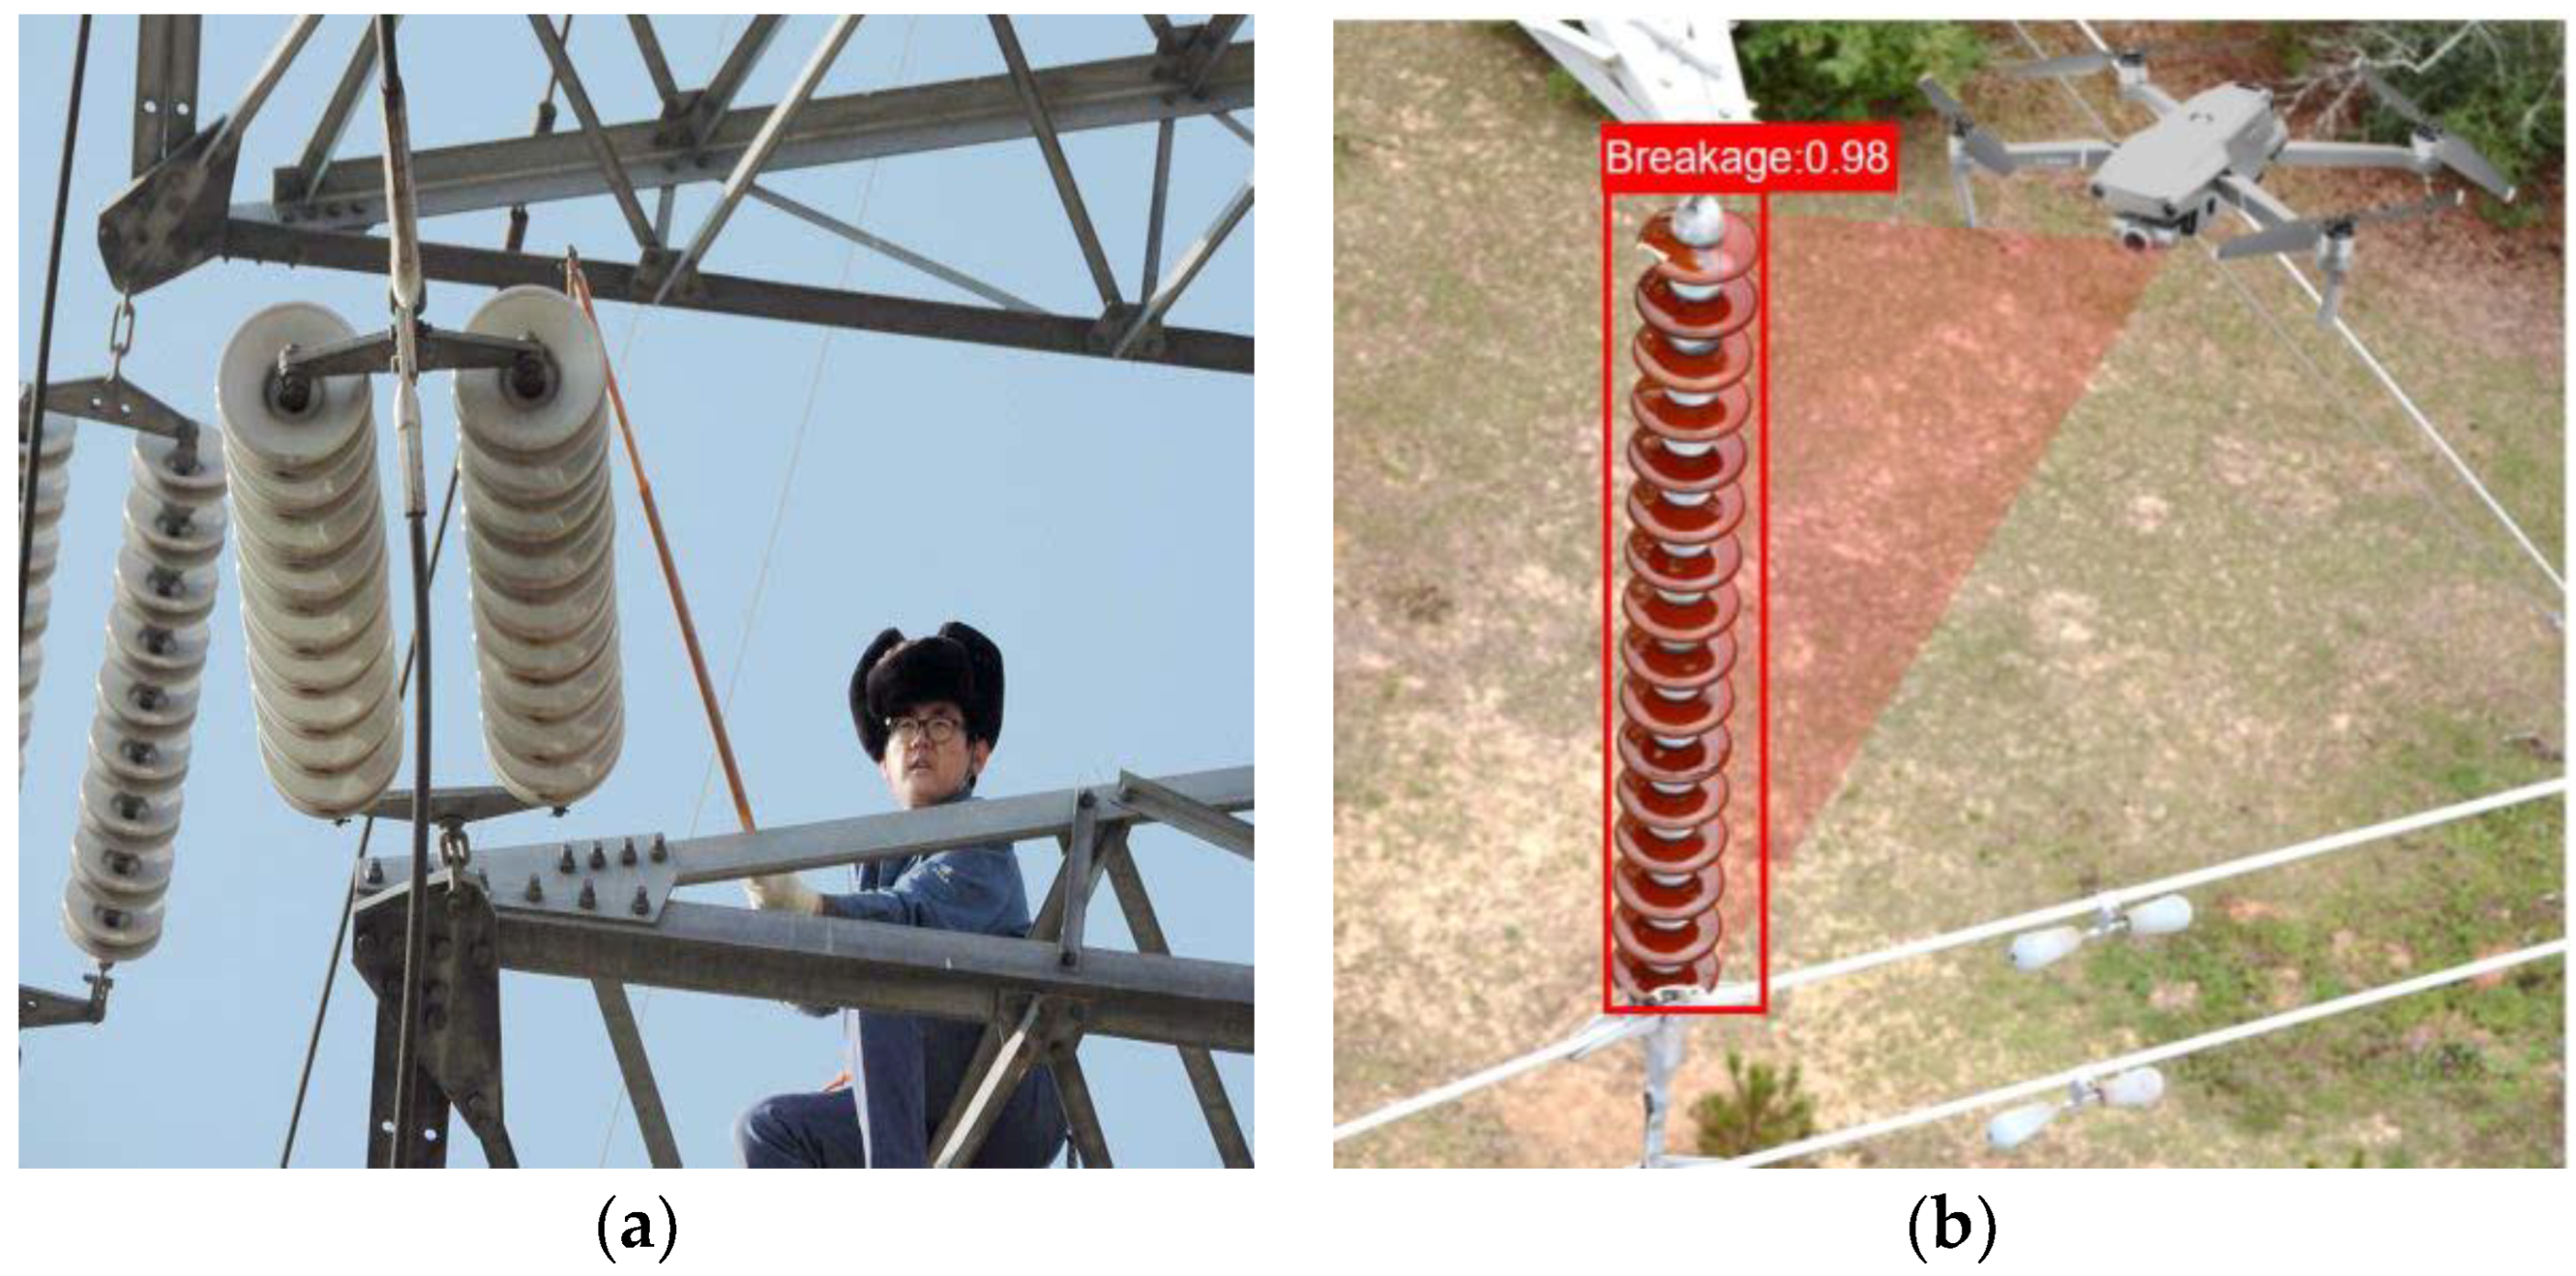
:1. Introduction
- To solve the distortion issue caused by images pre-processing, we propose a novel traversal clipping module (TC). A TC can divide insulators into multiple patches according to their aspect ratios and traverse each patch for diagnosis. A TC not only mitigates image distortion but also increases the number of data samples, playing a role of data enhancement.
- We propose a novel progressive multi-granularity learning strategy (PMGL) that leverages convolution operations at various granularities to extract the feature information of different granularities in images, including detailed information at low levels and semantic information at high levels. This strategy enables the network to achieve a good recognition performance for defects in different granularities. Moreover, we utilize KL divergence to guide multi-granularity features to focus on different objectives and extract complementary information.
- To improve the ability to distinguish between defect and normal regions, we propose a region relation attention module (RRA) that performs a non-local interaction between local features. RRA aggregates and adjusts non-local information in the feature map, which helps the model to better understand the relationships between normal and defective regions in the image, thereby improving its performance in visual analysis and recognition.
- Based on the above three points, we propose a multi-granularity fusion defect network (MGFNet) for insulator defect recognition. The experiments show that an MGFNet achieves 91.27% accuracy, outperforming advanced methods, with a parameter size of 84.1 megabytes and a speed of 126.2 images/s, demonstrating its practical value.
2. Related Work
2.1. Defect Detection
2.2. Attention Mechanism
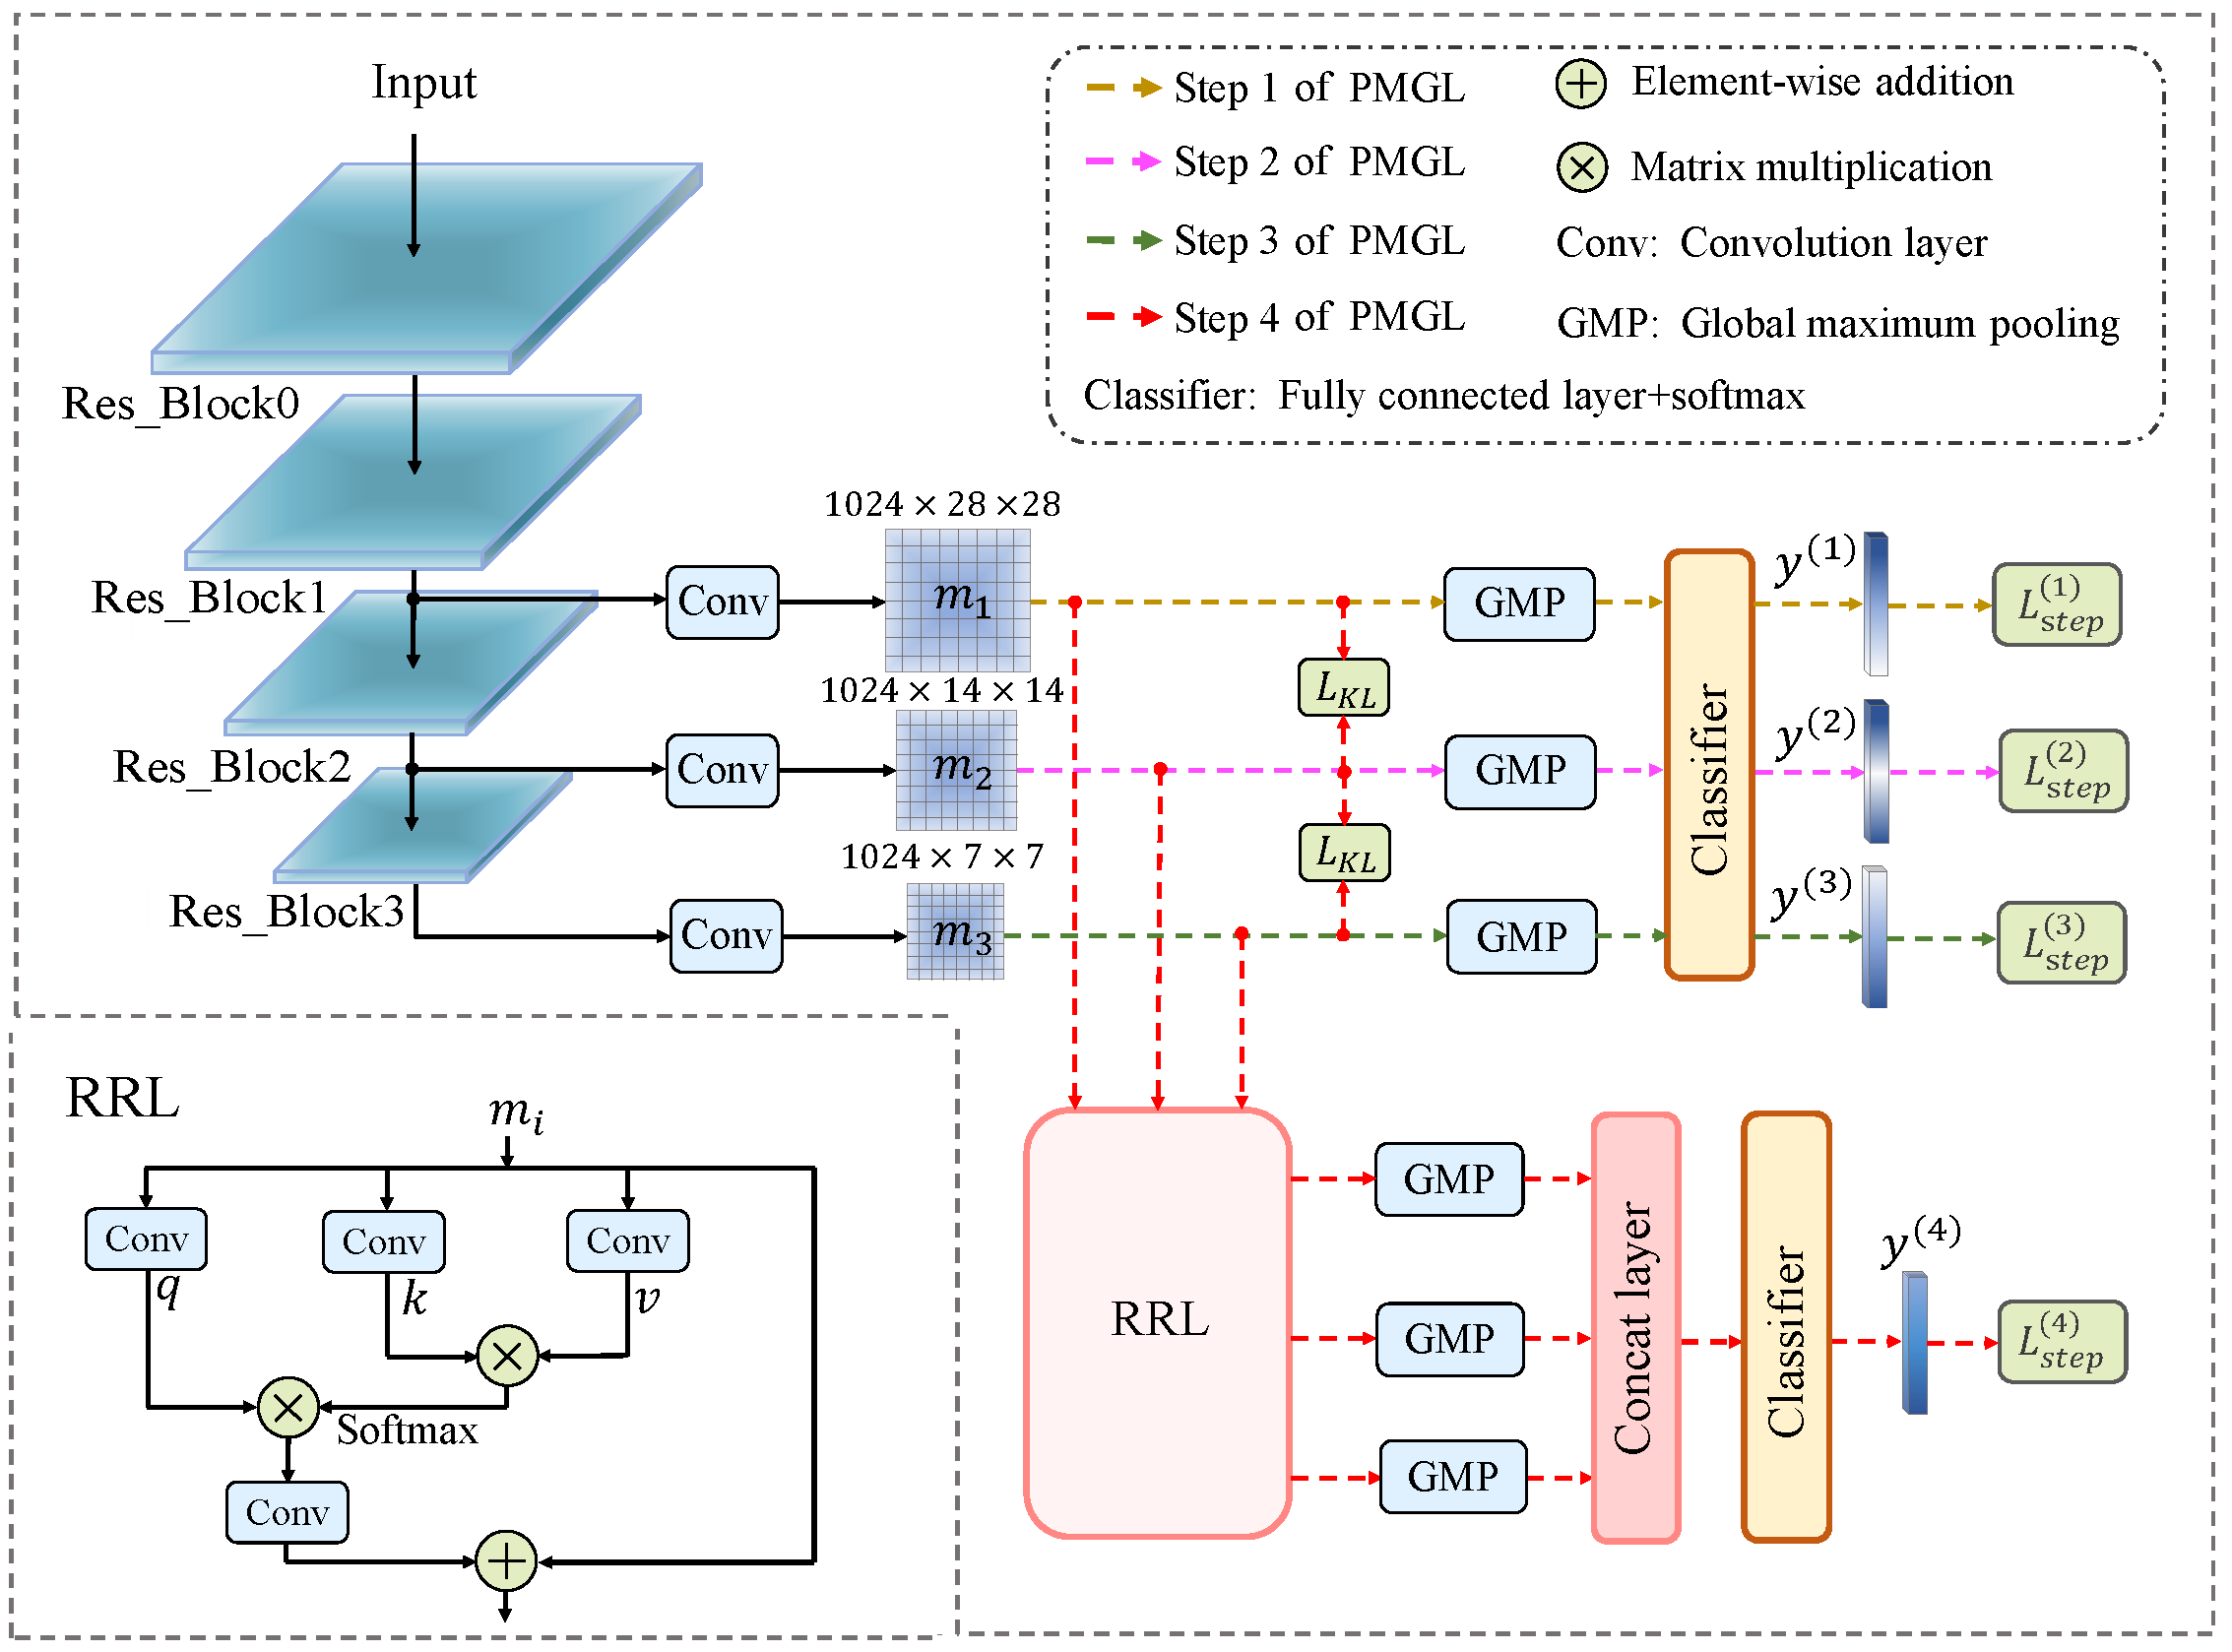
3. The Proposed MGFNet
3.1. MGFNet Overview
3.2. Traversal Clipping Module
3.3. Progressive Multi-Granularity Learning Strategy
3.4. Local Relationship Attention Module
| Algorithm 1: The training process of MGFNet. |
| Input: training set D, model parameter θ, hyperparameter k, α, β |
| while n ≤ N do randomly sample x in D for xi in for i in rage (4): ## the 4 steps of MGFNet if i < 3: is the parameter of Res_Block0-i else: Return model parameter θ |
3.5. MGFNet-Based Two-Stage Insulator Defect Detection Algorithm
4. Experimental Results and Analysis
4.1. Implementation Details
4.1.1. Training Process
4.1.2. Dataset Acquisition
4.1.3. Metrics
4.2. Ablation Studies
4.2.1. Effectiveness of Each Learning Stage and Multi-Stage Fusion
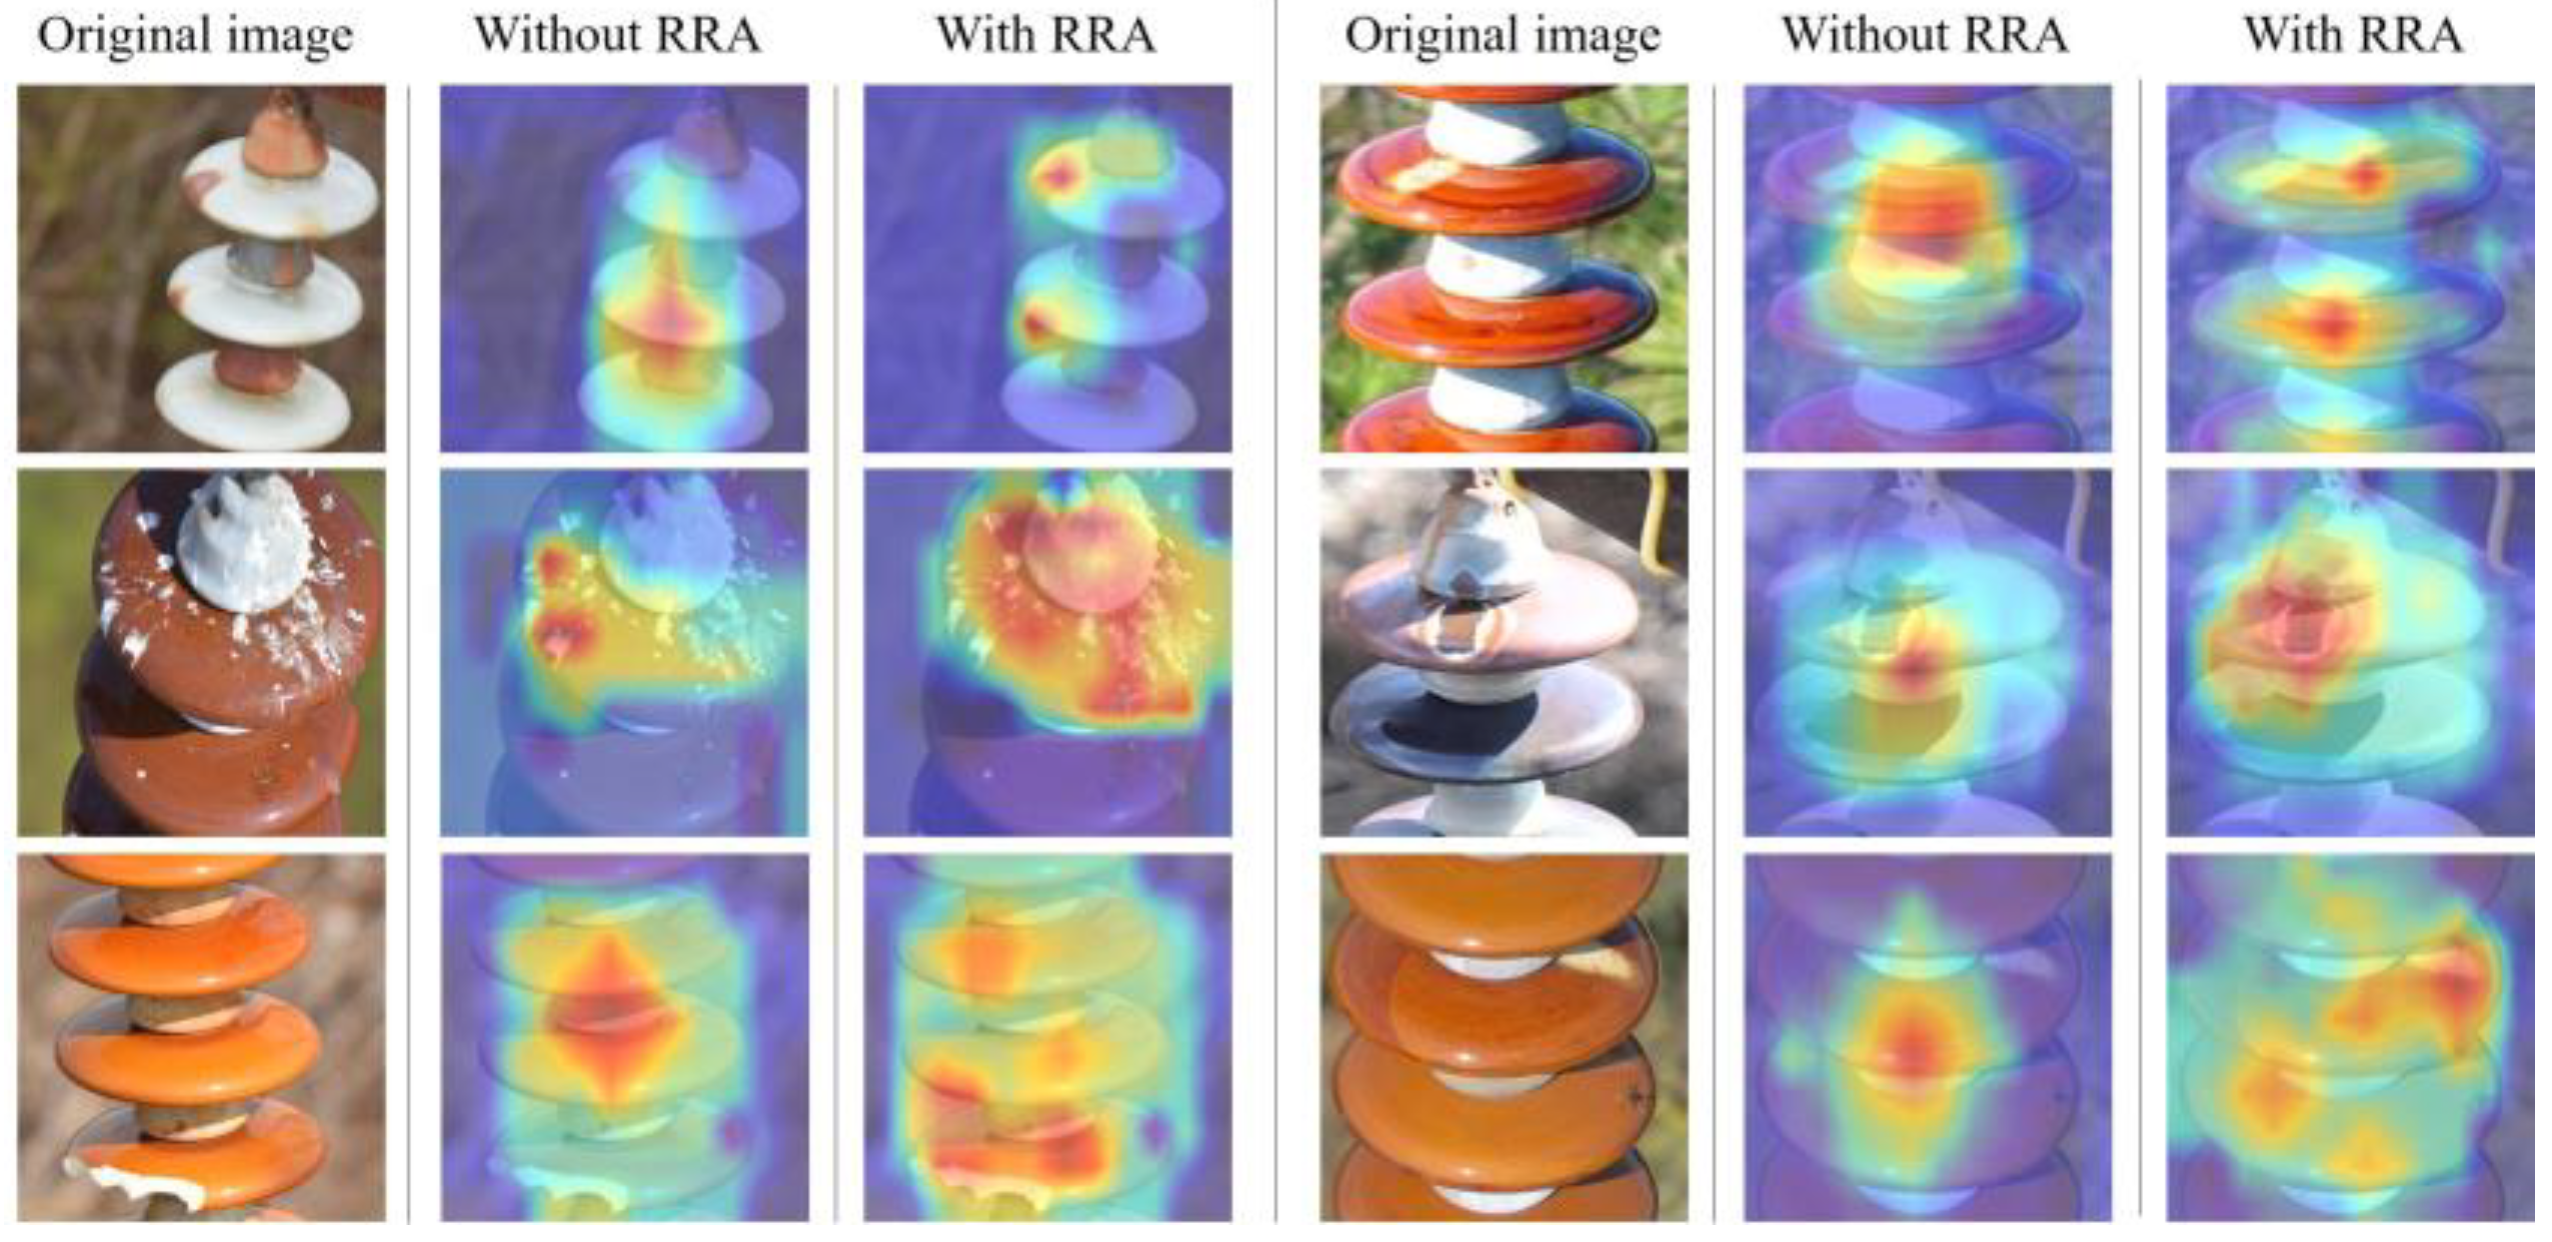
4.2.2. Visualization of the RRA
4.2.3. Sensitivity Analysis of and
4.2.4. Sensitivity Analysis of k
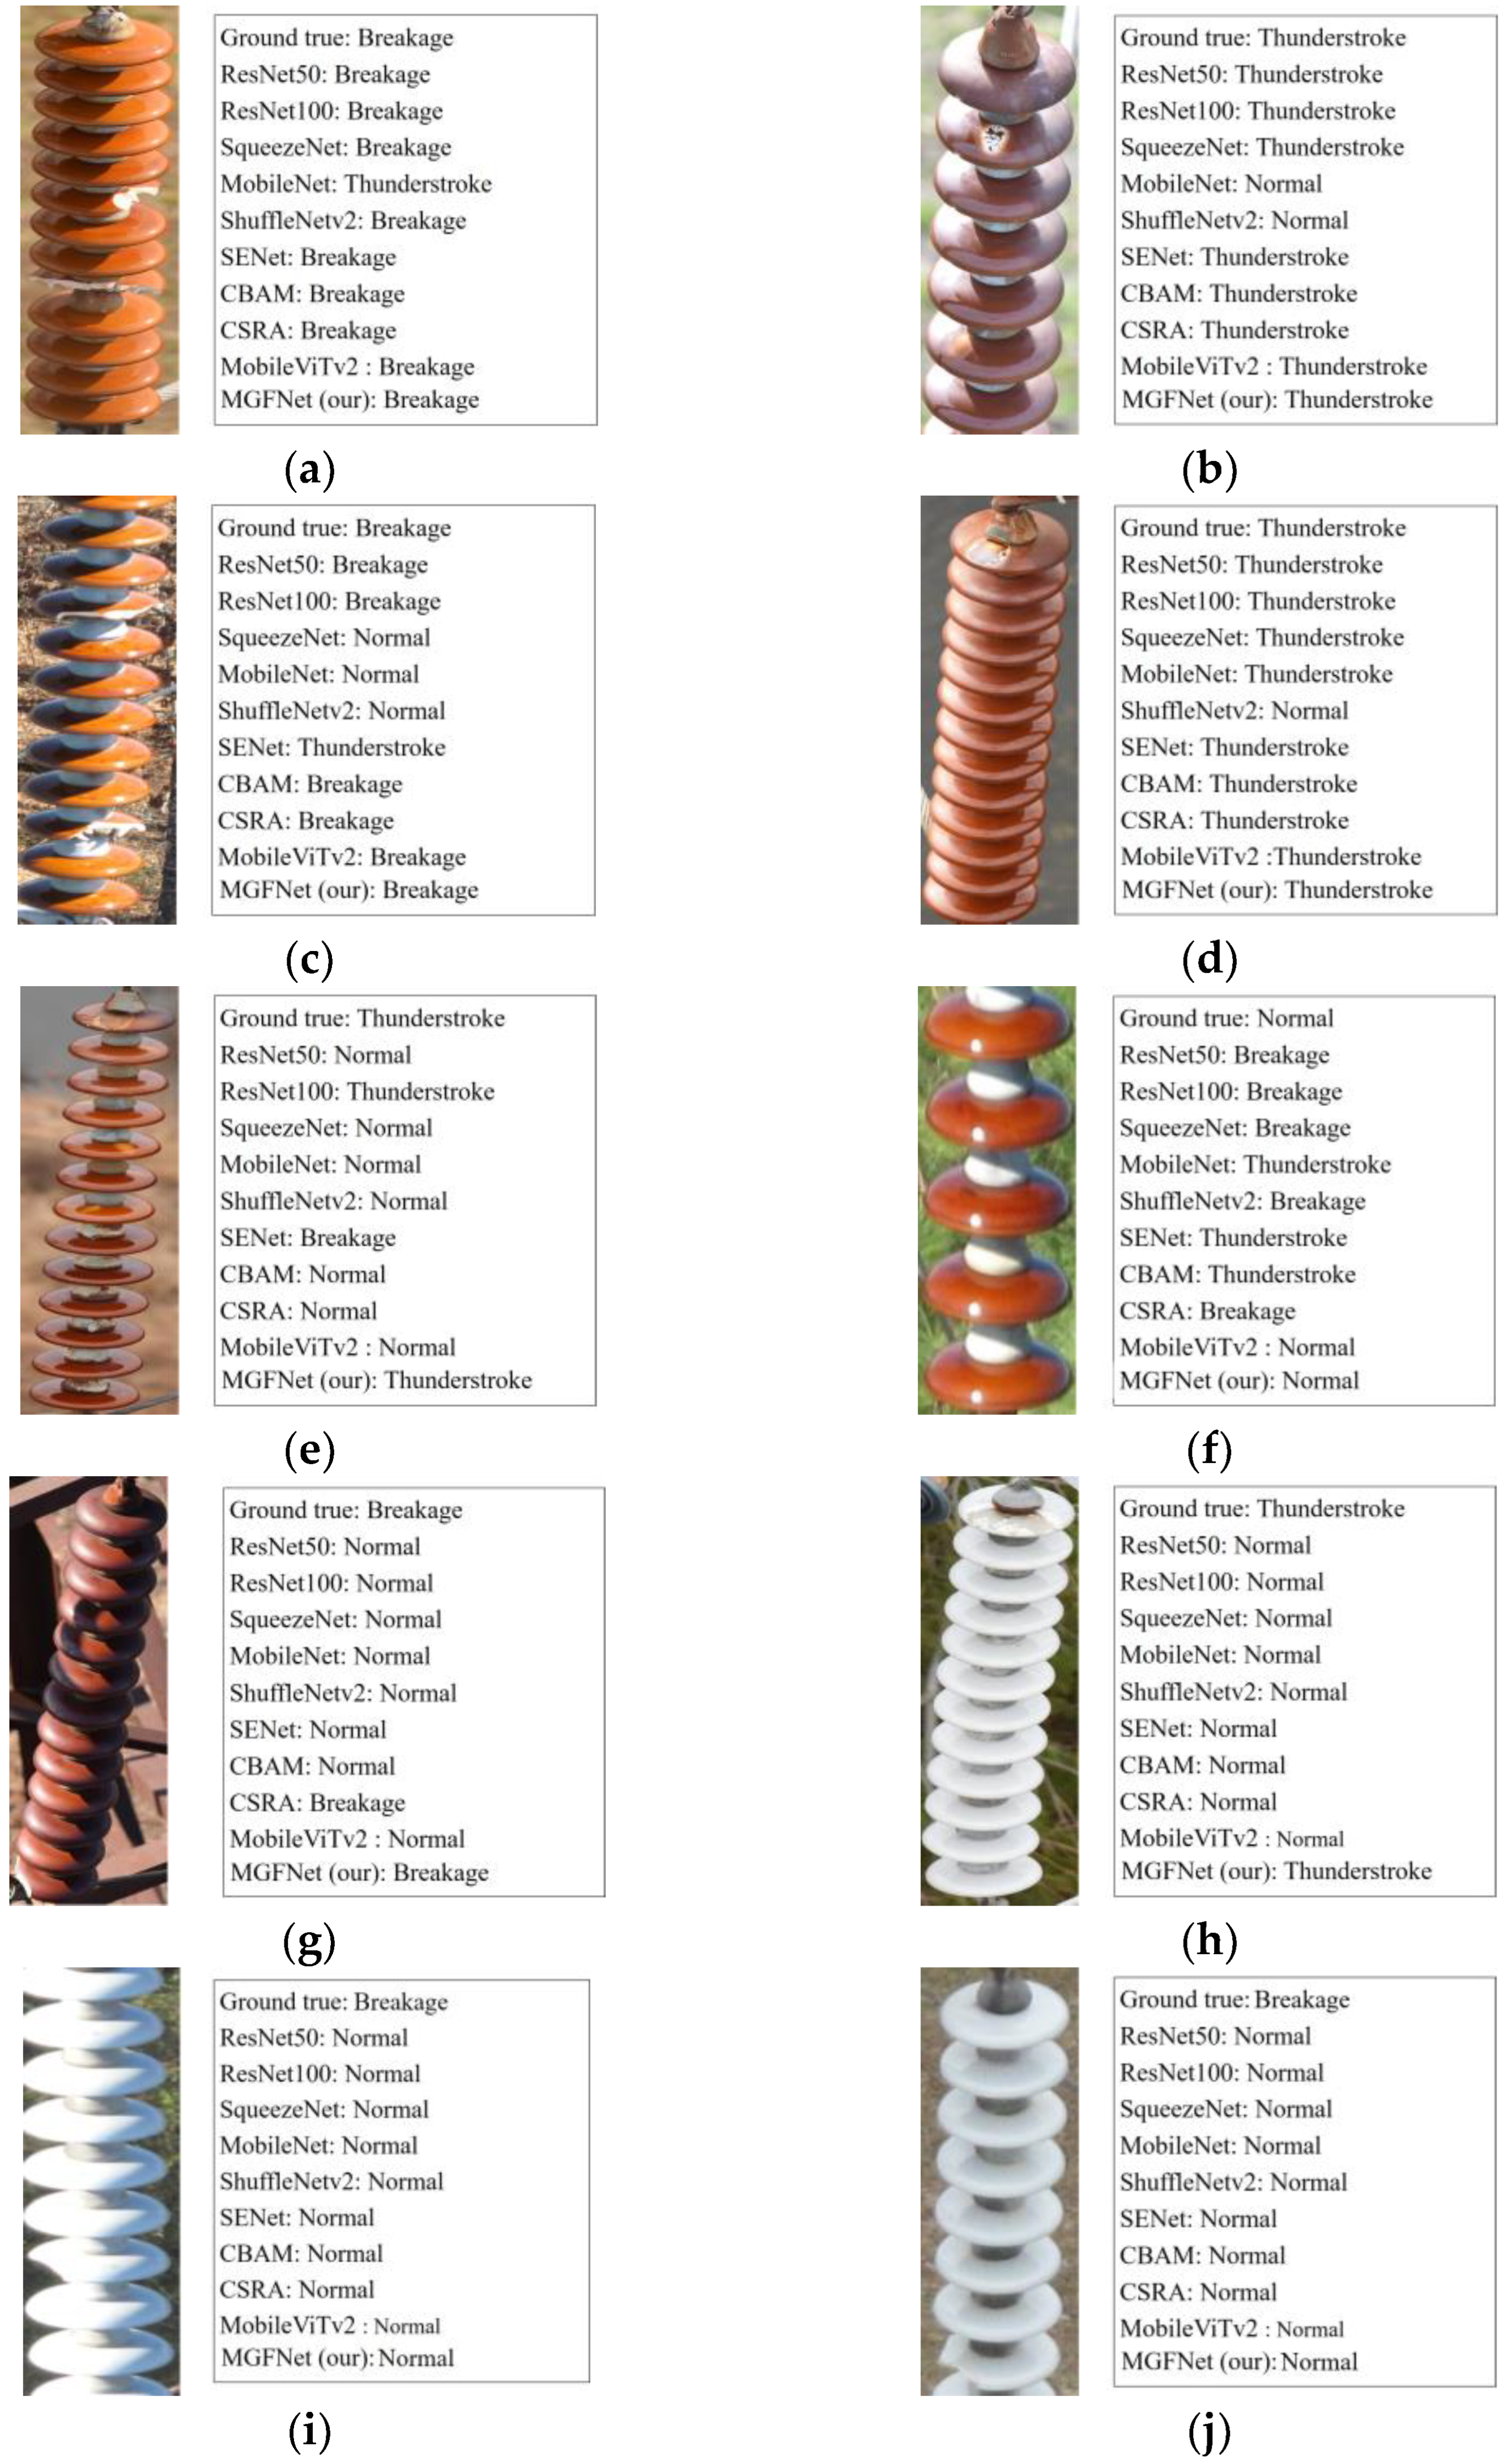
4.3. Comparison Experiment
4.3.1. Quantitative Evaluation
4.3.2. Qualitative Evaluation
4.4. MGFNet-Based Two-Stage Insulator Defect Detection Experiment
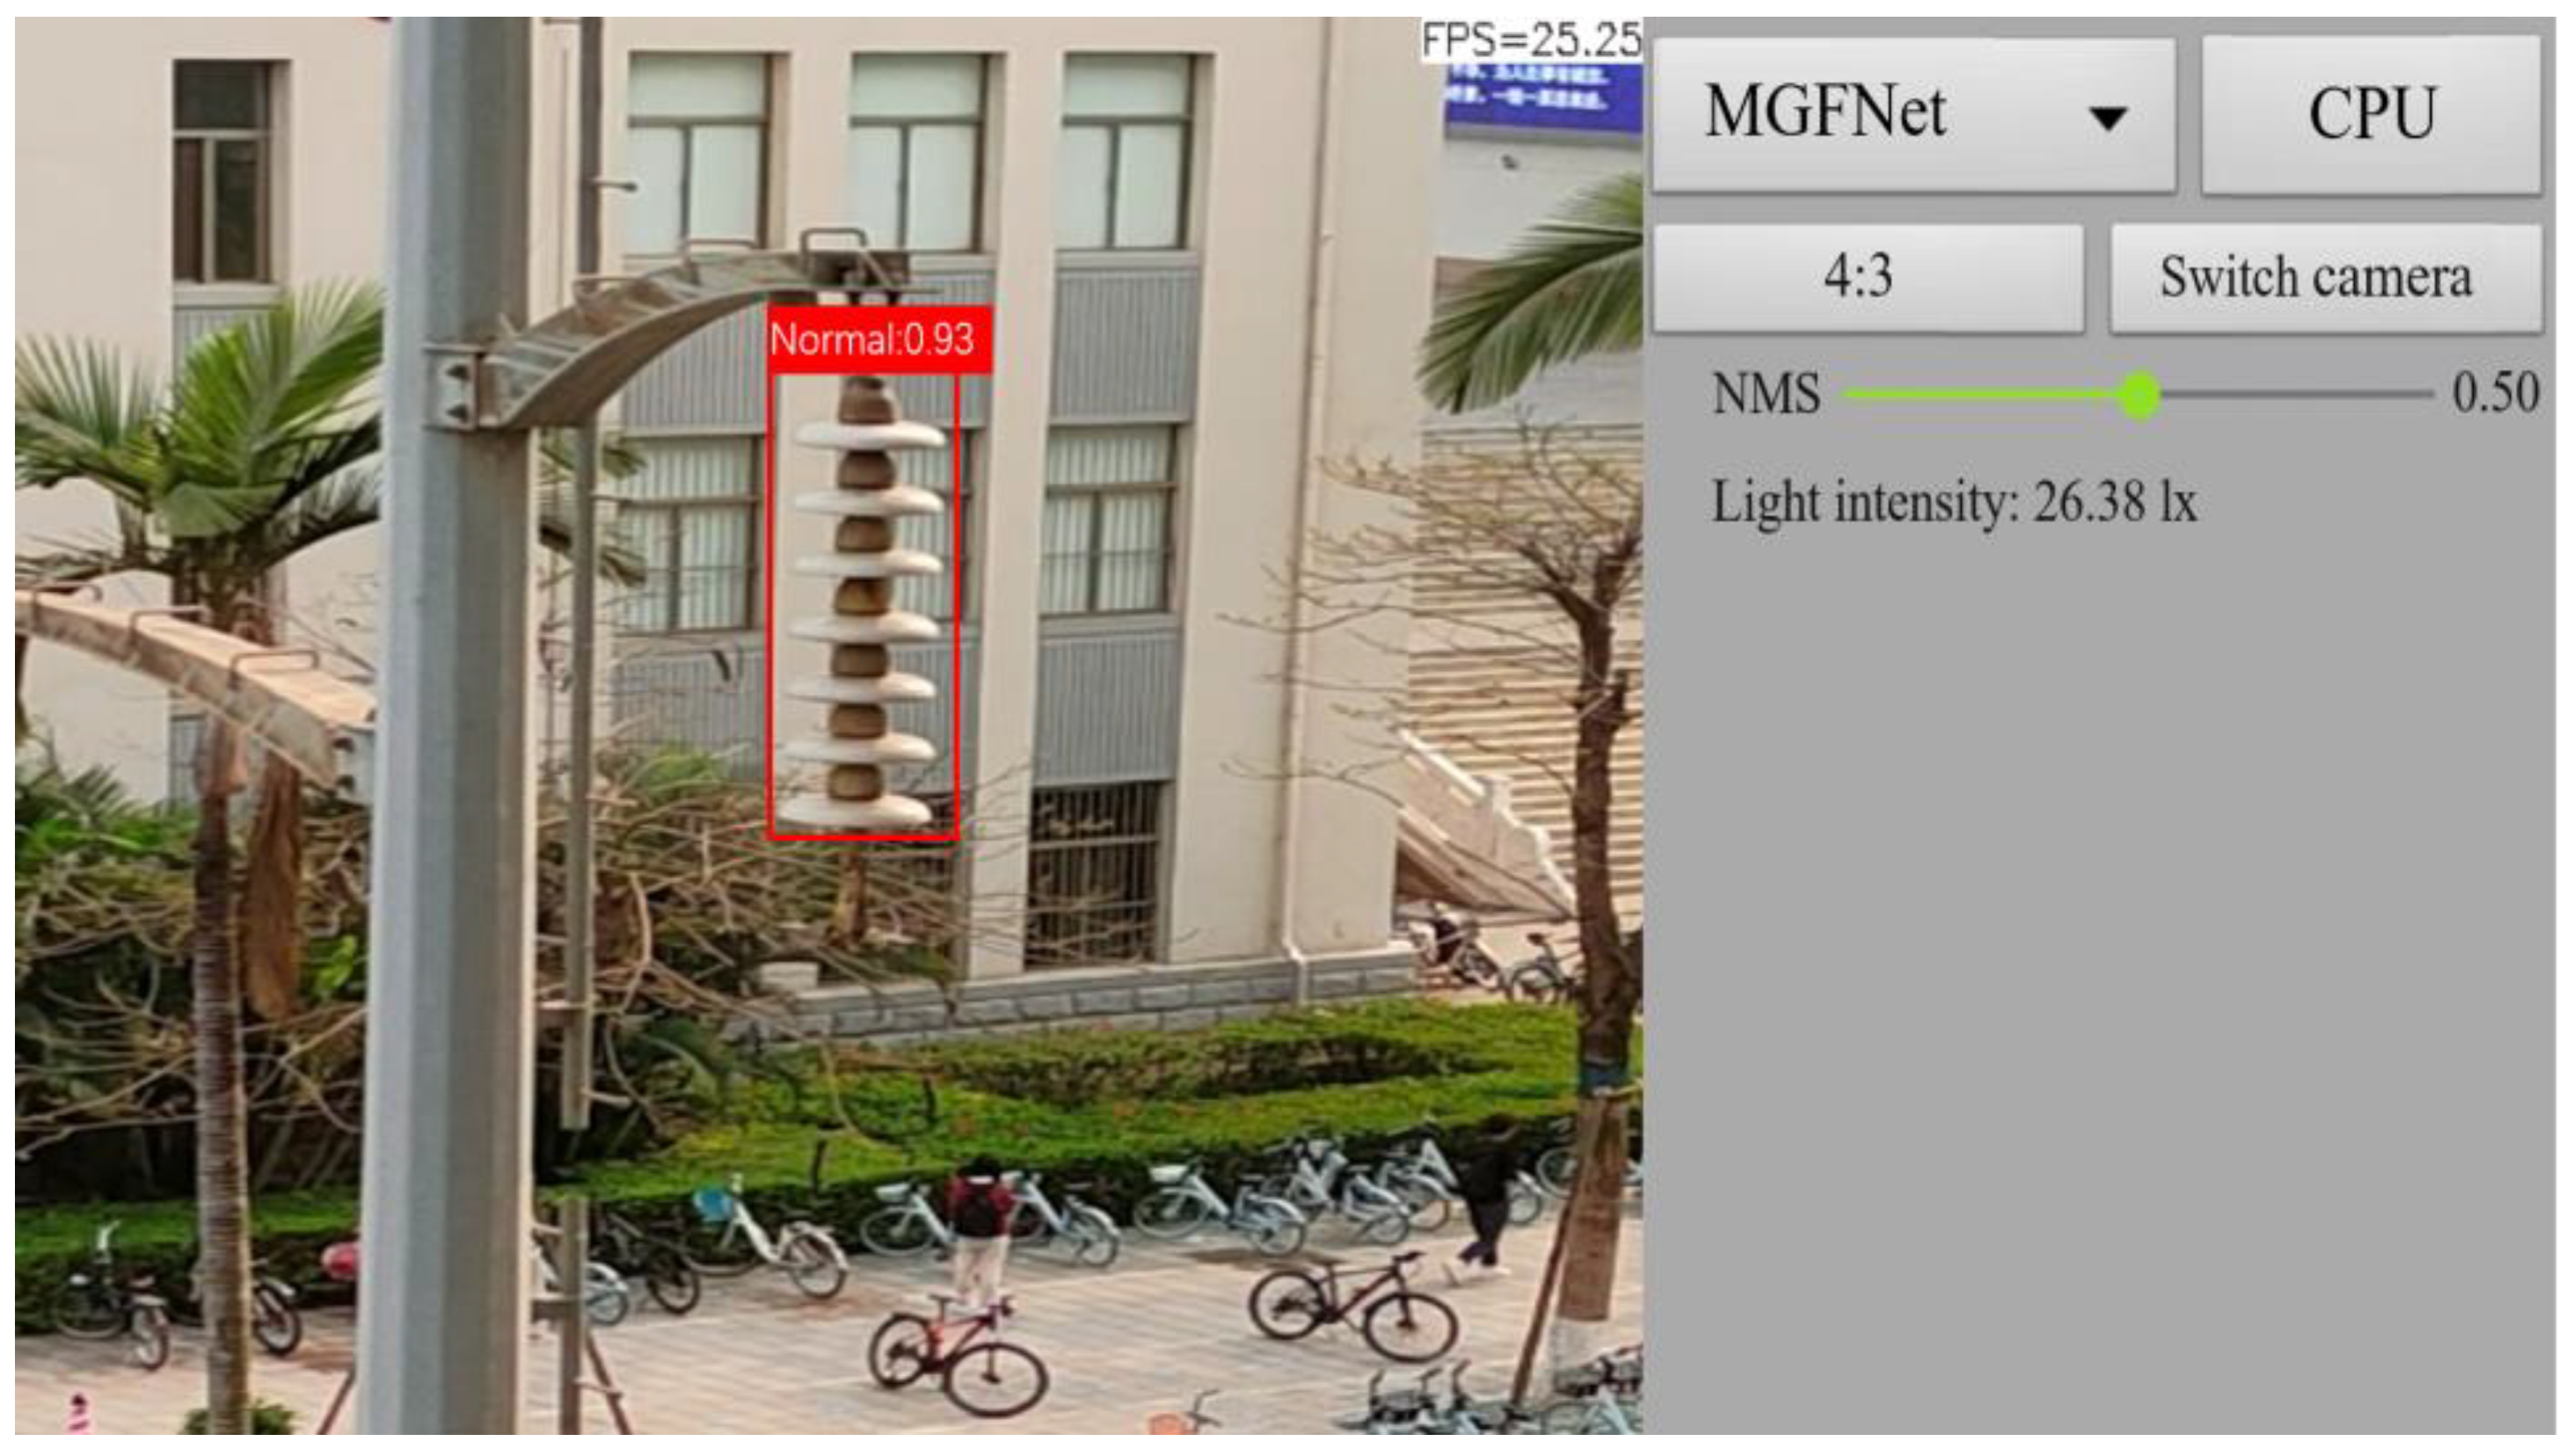
4.5. Performance of MGFNet on UAV Platform
5. Conclusions
Author Contributions
Funding
Data Availability Statement
Conflicts of Interest
References
- Liu, W.; Liu, Z.; Wang, H.; Han, Z. An automated defect detection approach for catenary rod-insulator textured surfaces using unsupervised learning. IEEE Trans. Instrum. Meas. 2020, 69, 8411–8423. [Google Scholar] [CrossRef]
- Zhang, D.; Gao, S.; Yu, L.; Kang, G.; Wei, X.; Zhan, D. DefGAN: Defect detection GANs with latent space pitting for high-speed railway insulator. IEEE Trans. Instrum. Meas. 2020, 70, 1–10. [Google Scholar] [CrossRef]
- Song, Y.; Liu, Z.; Ling, S.; Tang, R.; Duan, G.; Tan, J. Coarse-to-Fine Few-Shot Defect Recognition with Dynamic Weighting and Joint Metric. IEEE Trans. Instrum. Meas. 2022, 71, 2514910. [Google Scholar] [CrossRef]
- Liu, X.; Miao, X.; Jiang, H.; Chen, J. Box-point detector: A diagnosis method for insulator faults in power lines using aerial images and convolutional neural networks. IEEE Trans. Power Deliv. 2021, 36, 3765–3773. [Google Scholar] [CrossRef]
- Zhang, X.; Zhang, Y.; Liu, J.; Zhang, C.; Xue, X.; Zhang, H.; Zhang, W. InsuDet: A fault detection method for insulators of overhead transmission lines using convolutional neural networks. IEEE Trans. Instrum. Meas. 2021, 70, 5018512. [Google Scholar] [CrossRef]
- Redmon, J.; Divvala, S.; Girshick, R.; Farhadi, A. You only look once: Unified, real-time object detection. In Proceedings of the IEEE Conference on Computer Vision and Pattern Recognition, Las Vegas, NV, USA, 26 June–1 July 2016; pp. 779–788. [Google Scholar]
- Lan, Z.; Hong, Y.; Li, Y. An improved YOLOv3 method for PCB surface defect detection. In Proceedings of the 2021 IEEE International Conference on Power Electronics, Computer Applications (ICPECA), Shenyang, China, 22–24 January 2021; pp. 1009–1015. [Google Scholar]
- Zhao, Y.J.; Yan, Y.H.; Song, K.C. Vision-based automatic detection of steel surface defects in the cold rolling process: Considering the influence of industrial liquids and surface textures. Int. J. Adv. Manuf. Technol. 2017, 90, 1665–1678. [Google Scholar] [CrossRef]
- Sharifzadeh, M.; Alirezaee, S.; Amirfattahi, R.; Sadri, S. Detection of steel defect using the image processing algorithms. In Proceedings of the International Conference on Electrical Engineering, Cairo, Egypt, 27–29 May 2008; pp. 125–127. [Google Scholar]
- Leavers, V.F. Which hough transform? CVGIP Image Underst. 1993, 58, 250–264. [Google Scholar]
- Yang, J.; Li, X.; Xu, J.; Cao, Y.; Zhang, Y.; Wang, L.; Jiang, S. Development of an optical defect inspection algorithm based on an active contour model for large steel roller surfaces. Appl. Opt. 2018, 57, 2490. [Google Scholar] [CrossRef] [PubMed]
- Liao, G.-P.; Yang, G.-J.; Tong, W.-T.; Gao, W.; Lv, F.-L.; Gao, D. Study on Power Line Insulator Defect Detection via Improved Faster Region-Based Convolutional Neural Network. In Proceedings of the 2019 IEEE 7th International Conference on Computer Science and Network Technology (ICCSNT), Dalian, China, 19–20 October 2019; pp. 262–266. [Google Scholar] [CrossRef]
- Perera, P.; Nallapati, R.; Xiang, B. One-class Novelty Detection Using GANs with Constrained Latent Representations. arXiv 2019, arXiv:1903.08550. [Google Scholar]
- Hu, J.; Shen, L.; Sun, G. Squeeze-and-Excitation Networks. In Proceedings of the 2018 IEEE/CVF Conference on Computer Vision and Pattern Recognition, Salt Lake City, UT, USA, 23 June 2018; pp. 7132–7141. [Google Scholar] [CrossRef]
- Wang, Q.; Wu, B.; Zhu, P.; Li, P.; Zuo, W.; Hu, Q. ECA-Net: Efficient Channel Attention for Deep Convolutional Neural Network. In Proceedings of the 2020 IEEE/CVF Conference on Computer Vision and Pattern Recognition (CVPR), Seattle, WA, USA, 19 June 2020; pp. 11531–11539. [Google Scholar] [CrossRef]
- Woo, S.; Park, J.; Lee, J.Y.; Kweon, I.S. Cbam: Convolutional block attention module. In Proceedings of the European Conference on Computer Vision (ECCV), Munich, Germany, 8–14 September 2018; pp. 3–19. [Google Scholar]
- Li, X.; Wang, W.; Hu, X.; Yang, J. Selective Kernel Networks. In Proceedings of the 2019 IEEE/CVF Conference on Computer Vision and Pattern Recognition (CVPR), Long Beach, CA, USA, 15–20 June 2019; pp. 510–519. [Google Scholar] [CrossRef]
- Liu, W.; Anguelov, D.; Erhan, D.; Szegedy, C.; Reed, S.; Fu, C.-Y.; Berg, A.C. Ssd: Single shot multibox detector. In Proceedings of the Computer Vision–ECCV 2016: 14th European Conference, Amsterdam, The Netherlands, 11–14 October 2016; Part I 14. Springer International Publishing: Berlin/Heidelberg, Germany, 2016; pp. 21–37. [Google Scholar]
- Selvaraju, R.R.; Cogswell, M.; Das, A.; Vedantam, R.; Parikh, D.; Batra, D. Grad-CAM: Visual Explanations from Deep Networks via GradientBased Localization. In Proceedings of the 2017 IEEE International Conference on Computer Vision (ICCV), Venice, Italy, 22–29 October 2017; pp. 618–626. [Google Scholar]
- He, K.; Zhang, X.; Ren, S.; Sun, J. Deep residual learning for image recognition. In Proceedings of the IEEE Conference on Computer Vision and Pattern Recognition, Las Vegas, NV, USA, 26 June–1 July 2016. [Google Scholar]
- Iandola, F.N.; Han, S.; Moskewicz, M.W.; Ashraf, K.; Dally, W.J.; Keutzer, K. SqueezeNet: AlexNet-level accuracy with 50x fewer parameters and <0.5 MB model size. arXiv 2016, arXiv:1602.07360. [Google Scholar]
- Sandler, M.; Howard, A.; Zhu, M.; Zhmoginov, A.; Chen, L.-C. Mobilenetv2: Inverted residuals and linear bottlenecks. In Proceedings of the IEEE Conference on Computer Vision and Pattern Recognition, Salt Lake City, UT, USA, 18–22 June 2018. [Google Scholar]
- Ma, N.; Zhang, X.; Zheng, H.-T.; Sun, J. Shufflenet v2: Practical guidelines for efficient cnn architecture design. In Proceedings of the European Conference on Computer Vision (ECCV), Munich, Germany, 8–14 September 2018. [Google Scholar]
- Zhu, K.; Wu, J. Residual Attention: A Simple but Effective Method for Multi-Label Recognition. In Proceedings of the 2021 IEEE/CVF International Conference on Computer Vision (ICCV), Montreal, BC, Canada, 11–17 October 2021; pp. 184–193. [Google Scholar]
- Sachin, M.; Rastegari, M. Separable self-attention for mobile vision transformers. arXiv 2022, arXiv:2206.02680. [Google Scholar]


| Hardware platform | CPU | Intel® X®(R) Gold 6136 CPU @3.00 GHz |
| GPU | TITAN v@12 GB | |
| Memory size | 187 GB | |
| Software platform | Operating system version | Ubuntu 16.04.6 LTS |
| Deep learning framework | Pytorch 1.4.0 | |
| Python version | 3.8.12 | |
| Hyperparameters | Batch-size | 8 |
| Epoch | 50 | |
| Input-size | 224 × 224 | |
| Learning rate | 0.001 | |
| Optimizer | SGD | |
| Momentum coefficient | 0.9 | |
| Weight decay coefficient | 5 × 10⁻⁴ | |
| 1.3 | ||
| 0.8 | ||
| 0.2 |
| Model | (a) | (b) | (c) | (d) | |
|---|---|---|---|---|---|
| ResNet50 | √ | √ | √ | √ | |
| TC | √ | √ | √ | ||
| MGFNet | √ | √ | |||
| RRA | √ | ||||
| Acc (%) | Average | 56.39 | 88.08 | 90.69 | 91.27 |
| Normal | 70.13 | 95.12 | 97.50 | 98.31 | |
| Anomaly | 80.49 | 86.49 | 92.00 | 92.50 | |
| Pollution | 81.99 | 88.99 | 90.00 | 90.01 | |
| Breakage | 30.76 | 77.23 | 81.21 | 82.05 | |
| Thunderstroke | 38.89 | 85.12 | 87.83 | 87.99 | |
| Params (megabytes) | 42.5 | 42.5 | 69.16 | 84.1 | |
| Speed (images/sec) | 419.6 | 138.3 | 130.3 | 126.2 | |
| Model (c) | KL Divergence | Acc (%) | |||||
|---|---|---|---|---|---|---|---|
| Average | Normal | Abnormal | Pollution | Breakage | Thunderstroke | ||
| Step 1 of PMGL | 80.12 | 89.21 | 83.35 | 78.65 | 80.34 | 62.72 | 80.12 |
| Step 2 of PMGL | 85.35 | 93.36 | 89.88 | 82.36 | 85.15 | 71.62 | 85.35 |
| Step 3 of PMGL | 89.58 | 95.15 | 91.56 | 87.11 | 89.99 | 79.71 | 89.58 |
| Multi-granularity fusion | 90.38 | 97.28 | 91.83 | 88.52 | 81.09 | 87.93 | 90.38 |
| Multi-granularity fusion | 91.27 | 98.31 | 92.50 | 90.01 | 82.05 | 87.99 | 91.27 |
| Acc (%) | Speed (Images/s) | ||||||
|---|---|---|---|---|---|---|---|
| Average | Normal | Anomaly | Pollution | Breakage | Thunderstroke | ||
| 1.0 | 91.12 | 98.28 | 92.46 | 87.92 | 81.99 | 87.52 | 95.2 |
| 1.3 | 91.27 | 98.31 | 92.50 | 90.01 | 82.05 | 87.99 | 126.2 |
| 1.6 | 90.82 | 98.72 | 92.22 | 87.69 | 81.81 | 86.95 | 144.1 |
| 1.9 | 89.65 | 97.31 | 91.30 | 86.86 | 80.25 | 86.45 | 156.2 |
| 2.1 | 88.12 | 95.65 | 90.28 | 85.65 | 79.05 | 84.60 | 180.2 |
| Model | TC | Acc (%) | |||||
|---|---|---|---|---|---|---|---|
| Average | Normal | Anomaly | Pollution | Breakage | Thunderstroke | ||
| ResNet50 [20] | No | 56.39 | 70.13 | 80.49 | 81.99 | 30.76 | 38.89 |
| SqueezeNet [21] | No | 46.80 | 54.16 | 80.99 | 79.99 | 12.82 | 45.84 |
| MobileNet [22] | No | 46.48 | 54.65 | 80.25 | 79.18 | 12.75 | 43.97 |
| ShuffleNetv2 [23] | No | 46.20 | 54.15 | 80.52 | 79.85 | 12.75 | 43.16 |
| SENet [14] | No | 59.11 | 73.24 | 77.12 | 83.02 | 38.02 | 37.09 |
| CBAM [16] | No | 59.75 | 73.65 | 78.63 | 83.45 | 38.46 | 38.55 |
| CSRA [24] | No | 61.35 | 76.26 | 79.36 | 82.64 | 39.96 | 39.91 |
| MobileViTv2 [25] | No | 62.32 | 75.36 | 79.83 | 82.36 | 38.36 | 48.28 |
| ResNet50 [20] | Yes | 88.08 | 95.12 | 86.49 | 89.99 | 77.23 | 85.12 |
| SqueezeNet [21] | Yes | 72.09 | 81.94 | 84.49 | 73.99 | 57.69 | 66.66 |
| MobileNet [22] | Yes | 82.26 | 91.66 | 85.99 | 77.99 | 75.64 | 73.59 |
| ShuffleNetv2 [23] | Yes | 76.16 | 79.86 | 82.99 | 83.99 | 67.94 | 72.22 |
| SENet [14] | Yes | 89.28 | 98.45 | 87.65 | 88.29 | 78.12 | 83.85 |
| CBAM [16] | Yes | 89.03 | 98.22 | 87.35 | 88.15 | 77.99 | 84.11 |
| CSRA [24] | Yes | 89.77 | 98.56 | 87.11 | 88.89 | 78.25 | 82.42 |
| MobileViTv2 [25] | Yes | 90.07 | 96.88 | 88.36 | 88.23 | 81.23 | 87.30 |
| MGFNet (Ours) | Yes | 91.27 | 98.31 | 92.50 | 90.01 | 82.05 | 87.99 |
| Model | TC | Params (Megabytes) | Speed (Images/s) |
|---|---|---|---|
| ResNet | Yes | 42.5 | 156.3 |
| SqueezeNet | Yes | 1.2 | 1342.7 |
| MobileNet | Yes | 3.5 | 654.3 |
| ShuffleNetv2 | Yes | 1.4 | 503.8 |
| SENet | Yes | 44.5 | 115.1 |
| CBAM | Yes | 44.5 | 125.0 |
| CSRA | Yes | 45.7 | 124.16 |
| MobileViTv2 | Yes | 19.30 | 125.3 |
| MGFNet(ours) | Yes | 84.1 | 126.2 |
| Model | Insulator Extraction | Defect Recognition | Params (Megabytes) | Speed (Images/s) |
|---|---|---|---|---|
| mAP@0.5 (%) | Acc (%) | |||
| YoLov5 | 100 | 79.15 | 14 | 19.19 |
| Faster RCNN | 100 | 79.85 | 360.1 | 29.12 |
| YoLov5+MGFNet | 100 | 91.27 | 98.1 | 24.45 |
| Faster RCNN+MGFNet | 100 | 91.17 | 444.1 | 16.86 |
Disclaimer/Publisher’s Note: The statements, opinions and data contained in all publications are solely those of the individual author(s) and contributor(s) and not of MDPI and/or the editor(s). MDPI and/or the editor(s) disclaim responsibility for any injury to people or property resulting from any ideas, methods, instructions or products referred to in the content. |
© 2023 by the authors. Licensee MDPI, Basel, Switzerland. This article is an open access article distributed under the terms and conditions of the Creative Commons Attribution (CC BY) license (https://creativecommons.org/licenses/by/4.0/).
Share and Cite
Lu, Z.; Li, Y.; Shuang, F. MGFNet: A Progressive Multi-Granularity Learning Strategy-Based Insulator Defect Recognition Algorithm for UAV Images. Drones 2023, 7, 333. https://doi.org/10.3390/drones7050333
Lu Z, Li Y, Shuang F. MGFNet: A Progressive Multi-Granularity Learning Strategy-Based Insulator Defect Recognition Algorithm for UAV Images. Drones. 2023; 7(5):333. https://doi.org/10.3390/drones7050333
Chicago/Turabian StyleLu, Zhouxian, Yong Li, and Feng Shuang. 2023. "MGFNet: A Progressive Multi-Granularity Learning Strategy-Based Insulator Defect Recognition Algorithm for UAV Images" Drones 7, no. 5: 333. https://doi.org/10.3390/drones7050333