


Effect of the Red-Edge Band from Drone Altum Multispectral Camera in Mapping the Canopy Cover of Winter Wheat, Chickweed, and Hairy Buttercup
Abstract
:1. Introduction
2. Materials and Methods
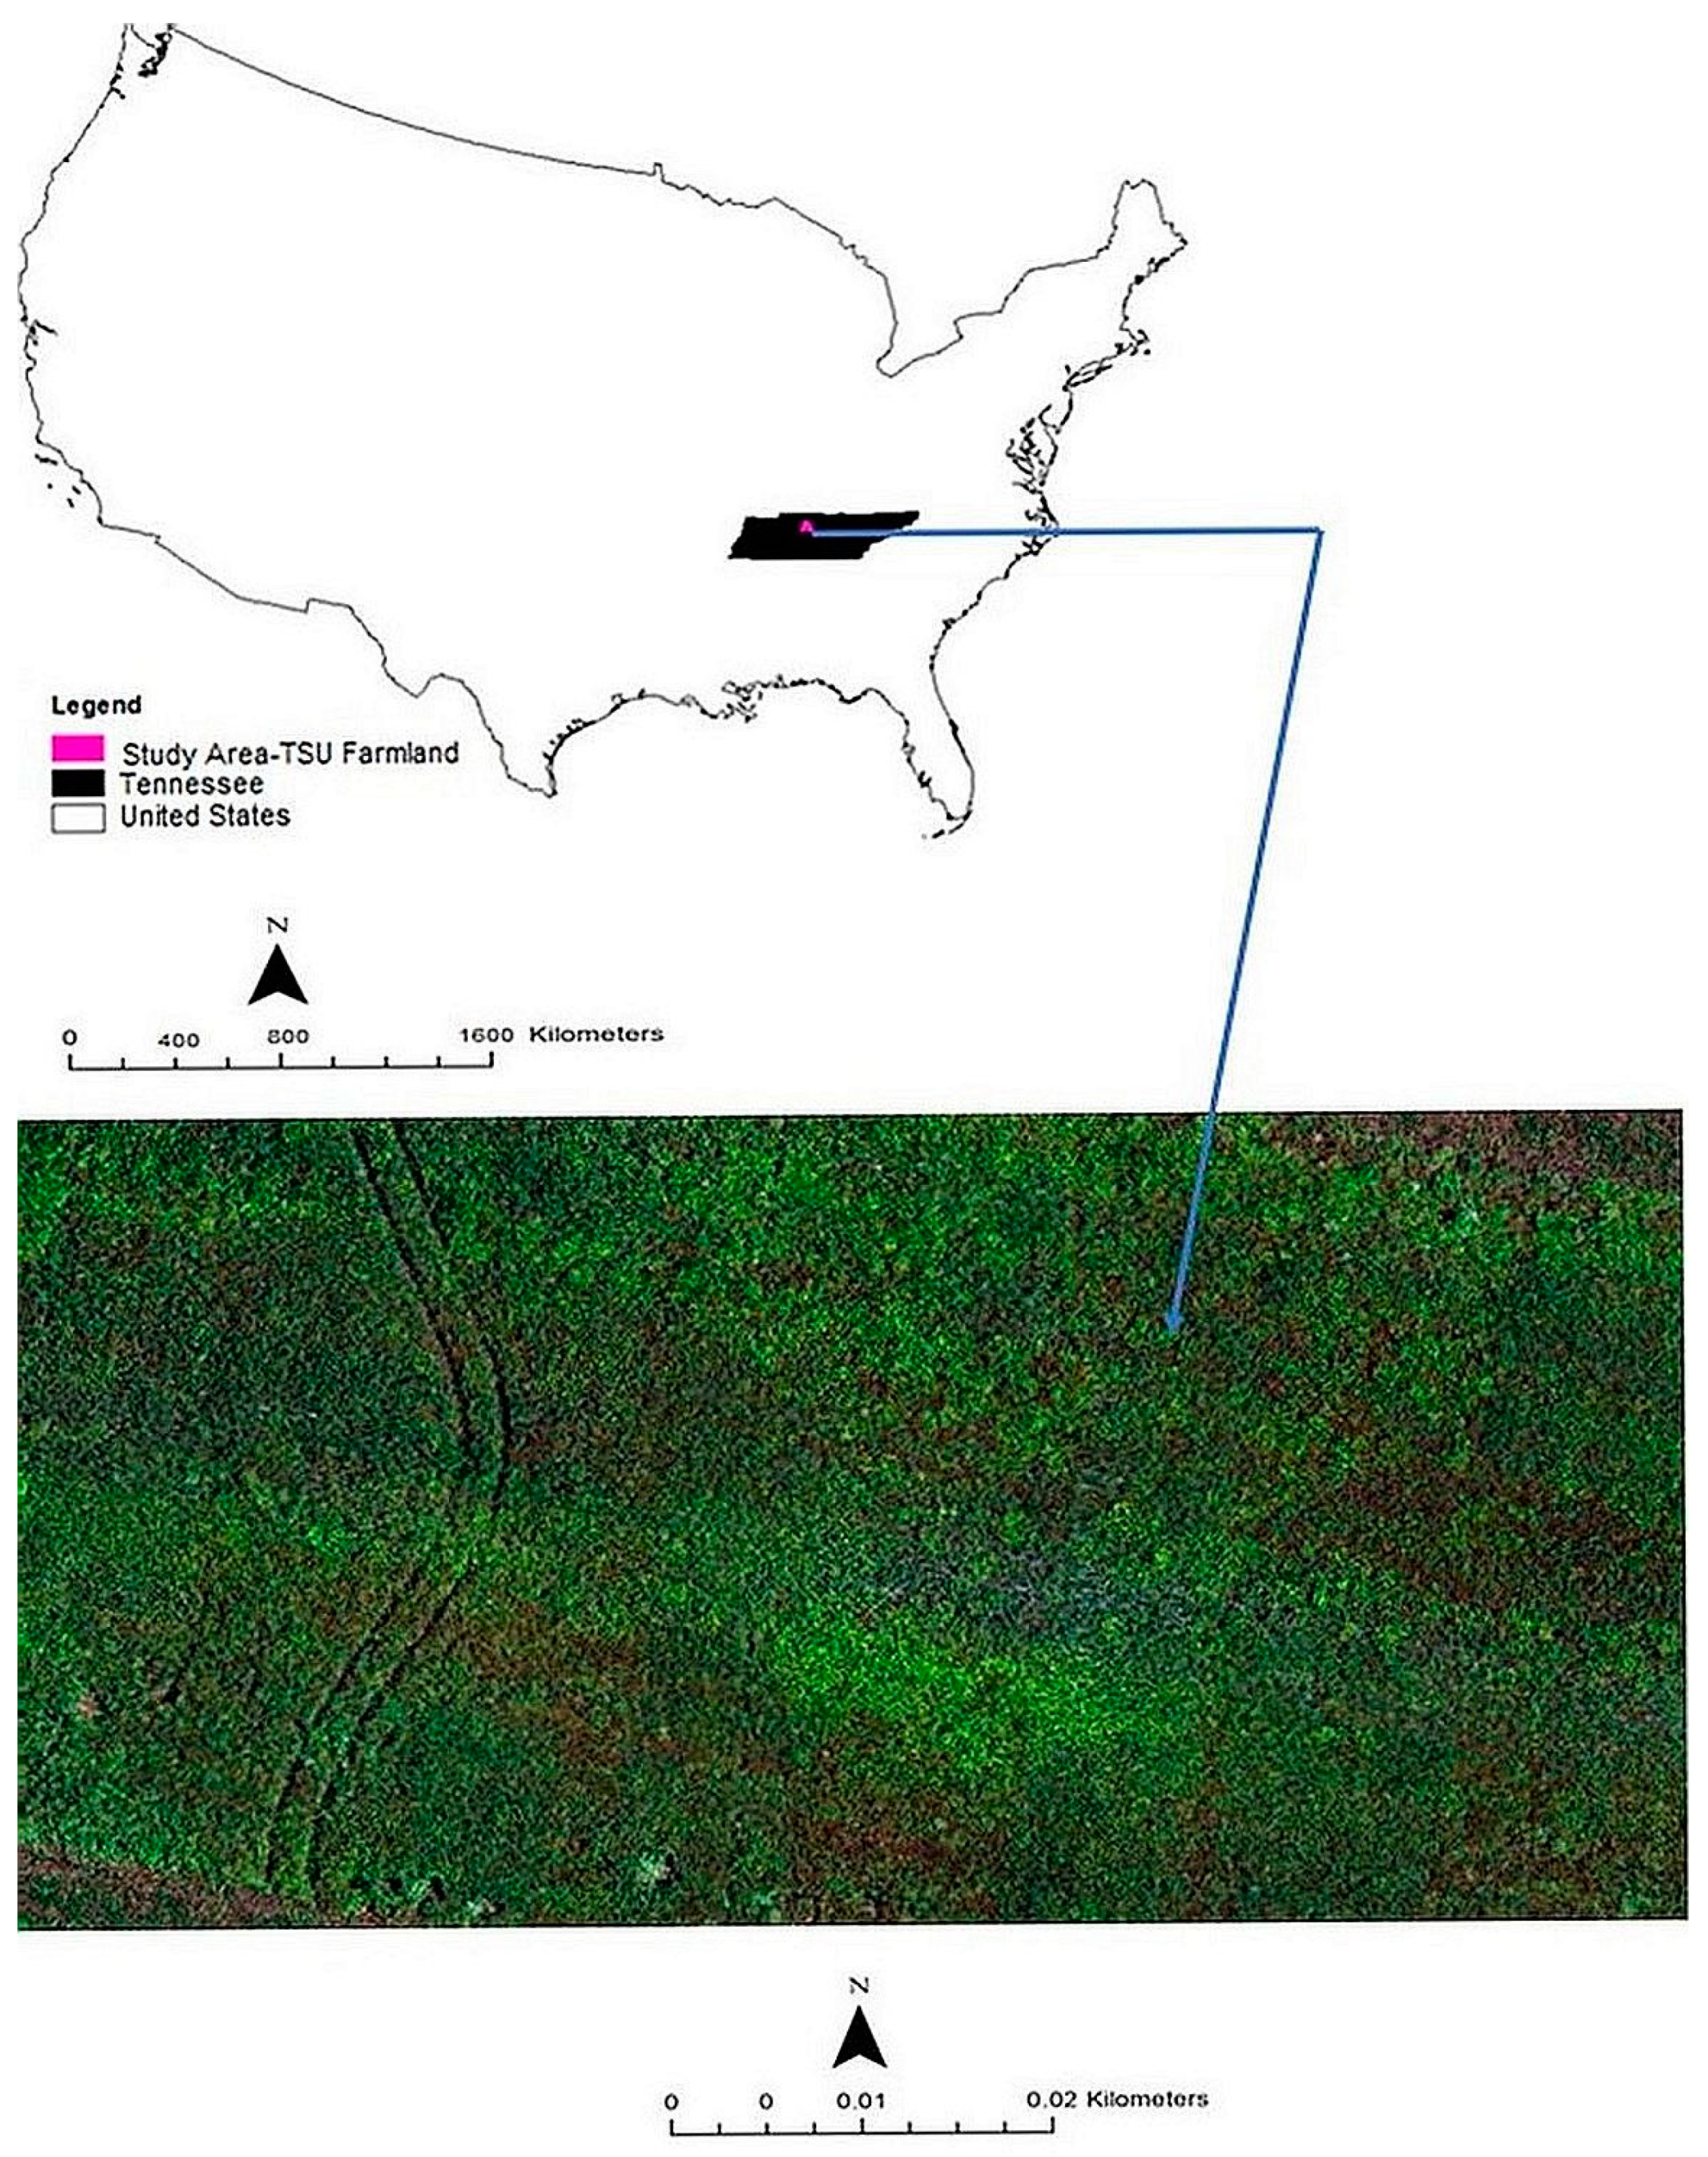
2.1. Study Area
2.1.1. Climate
2.1.2. Soil and Topography
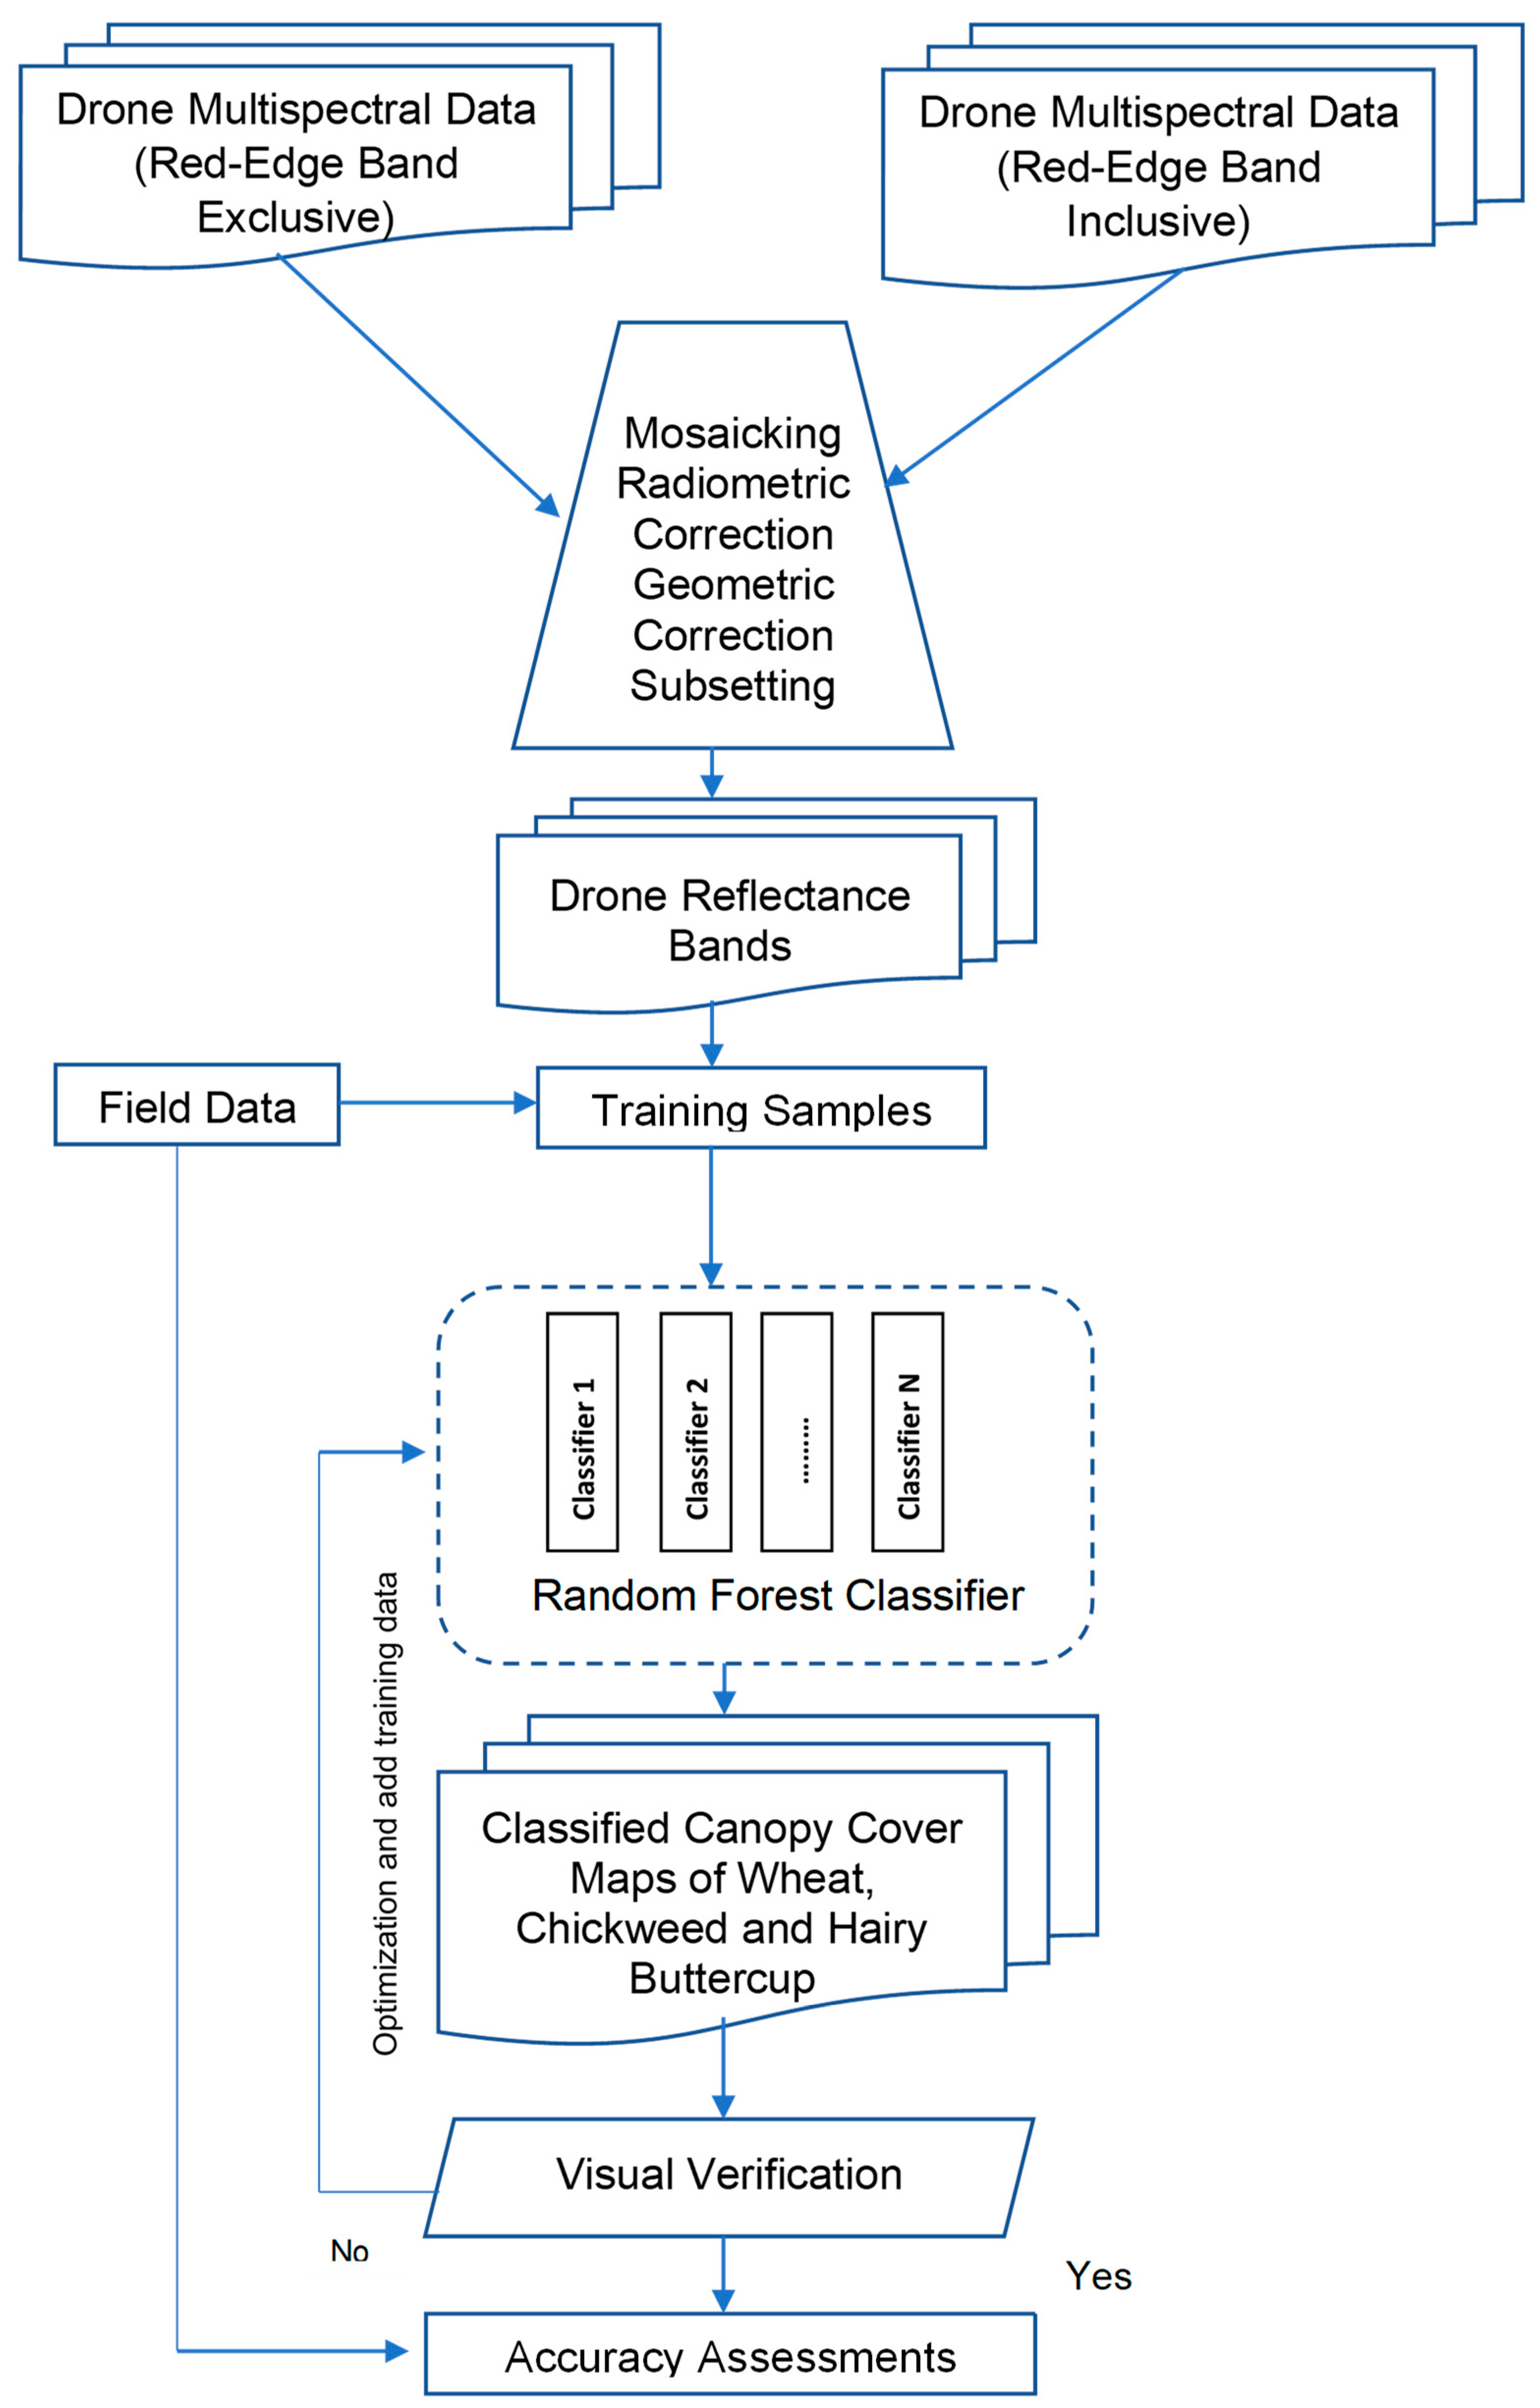
2.2. Methodology
2.2.1. Growing of Winter Wheat
2.2.2. Drone Data
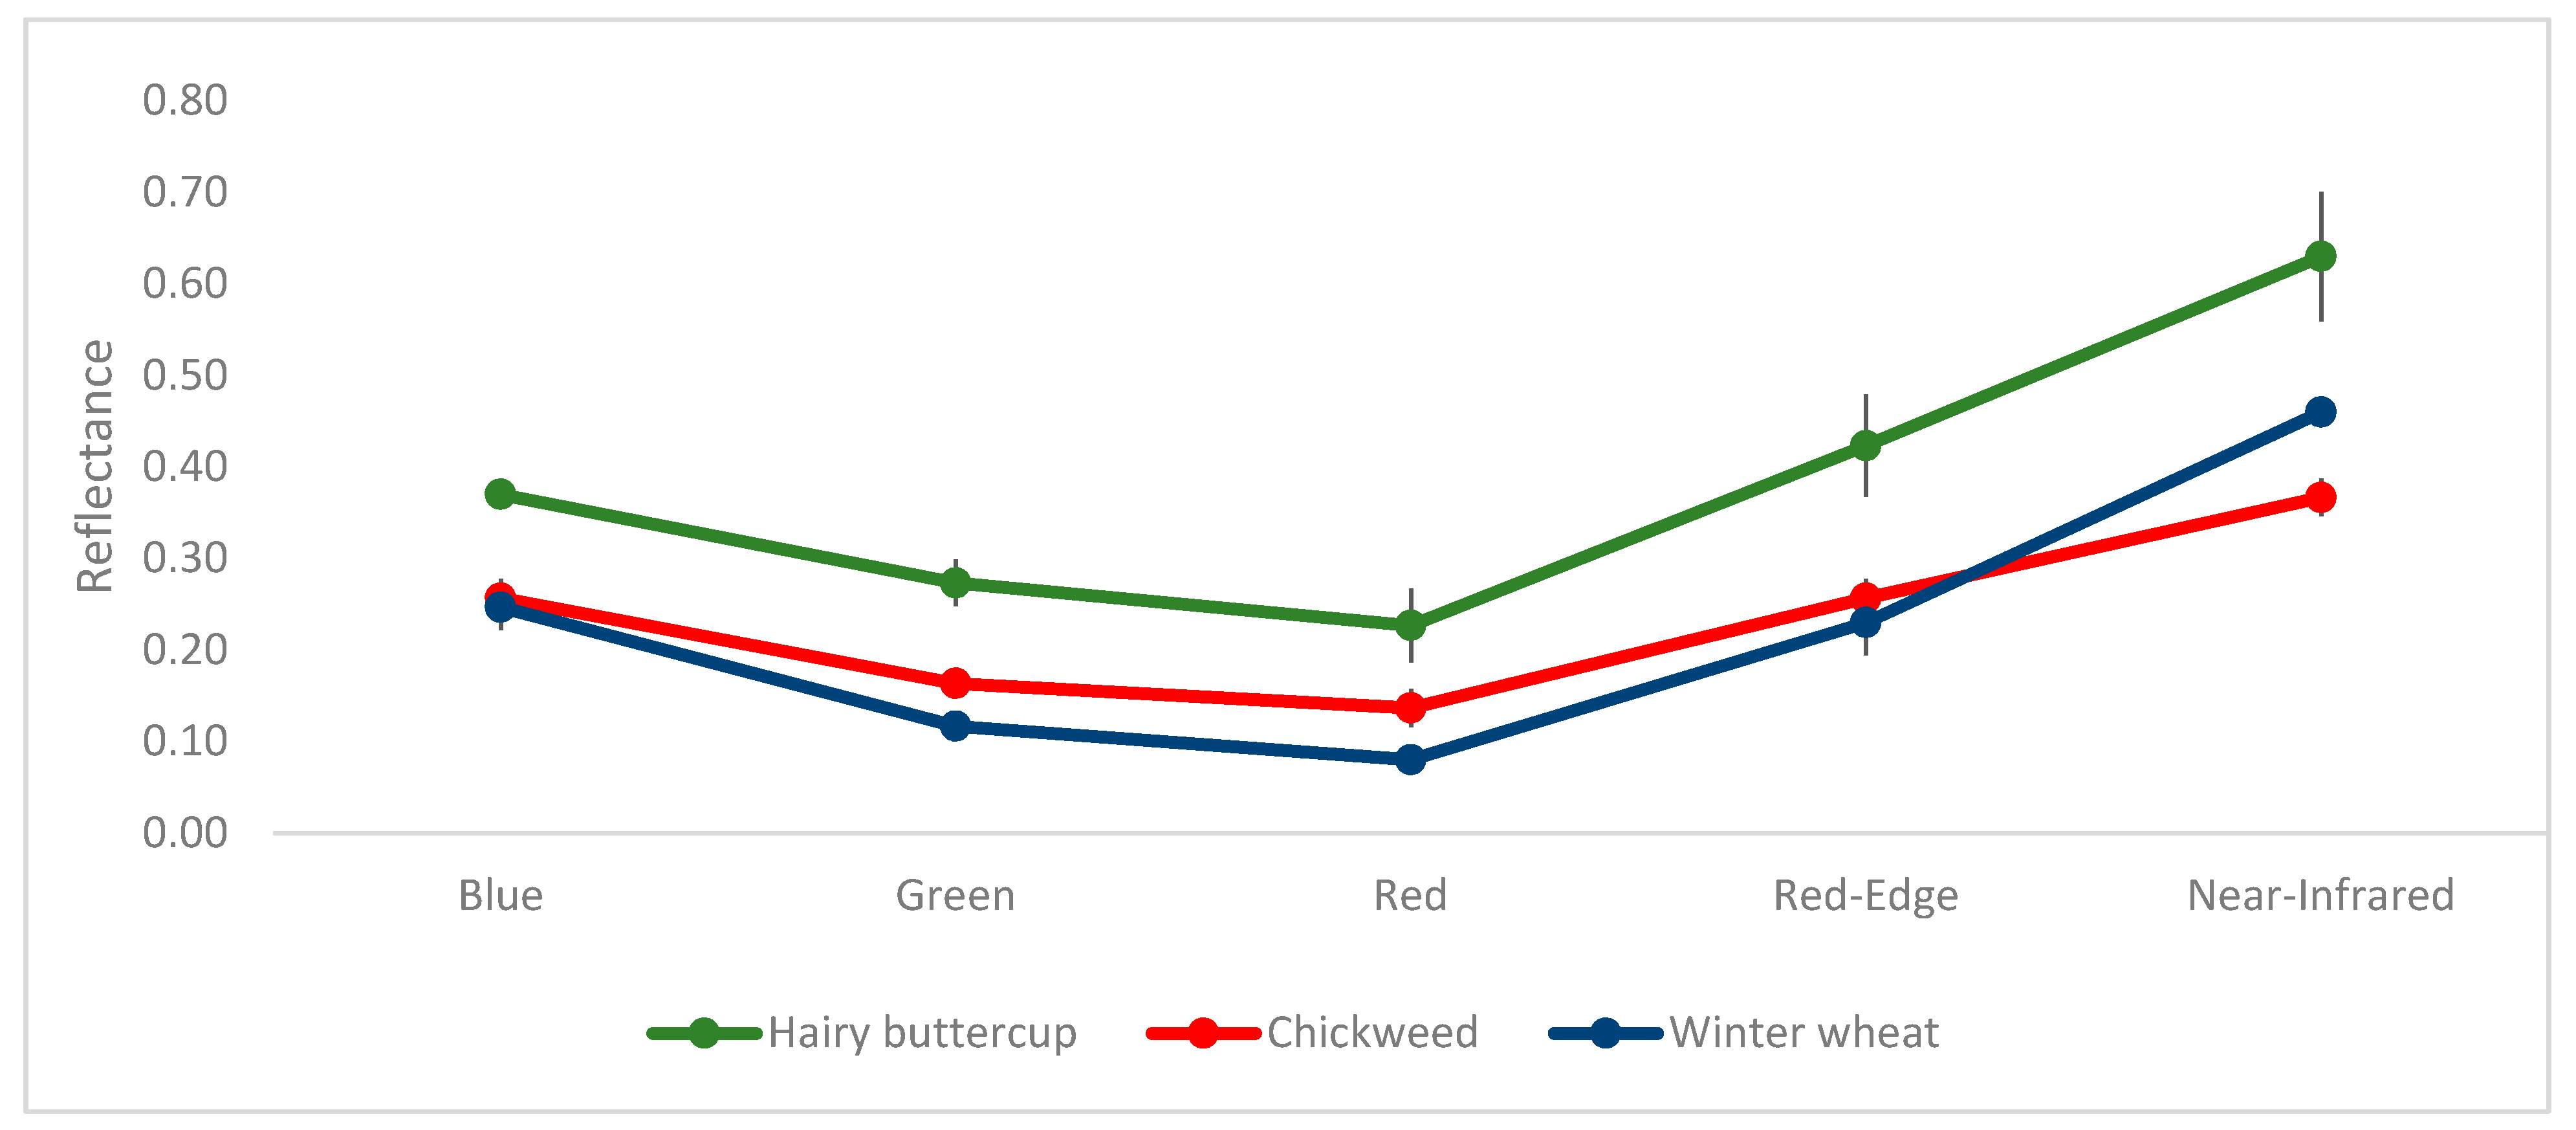
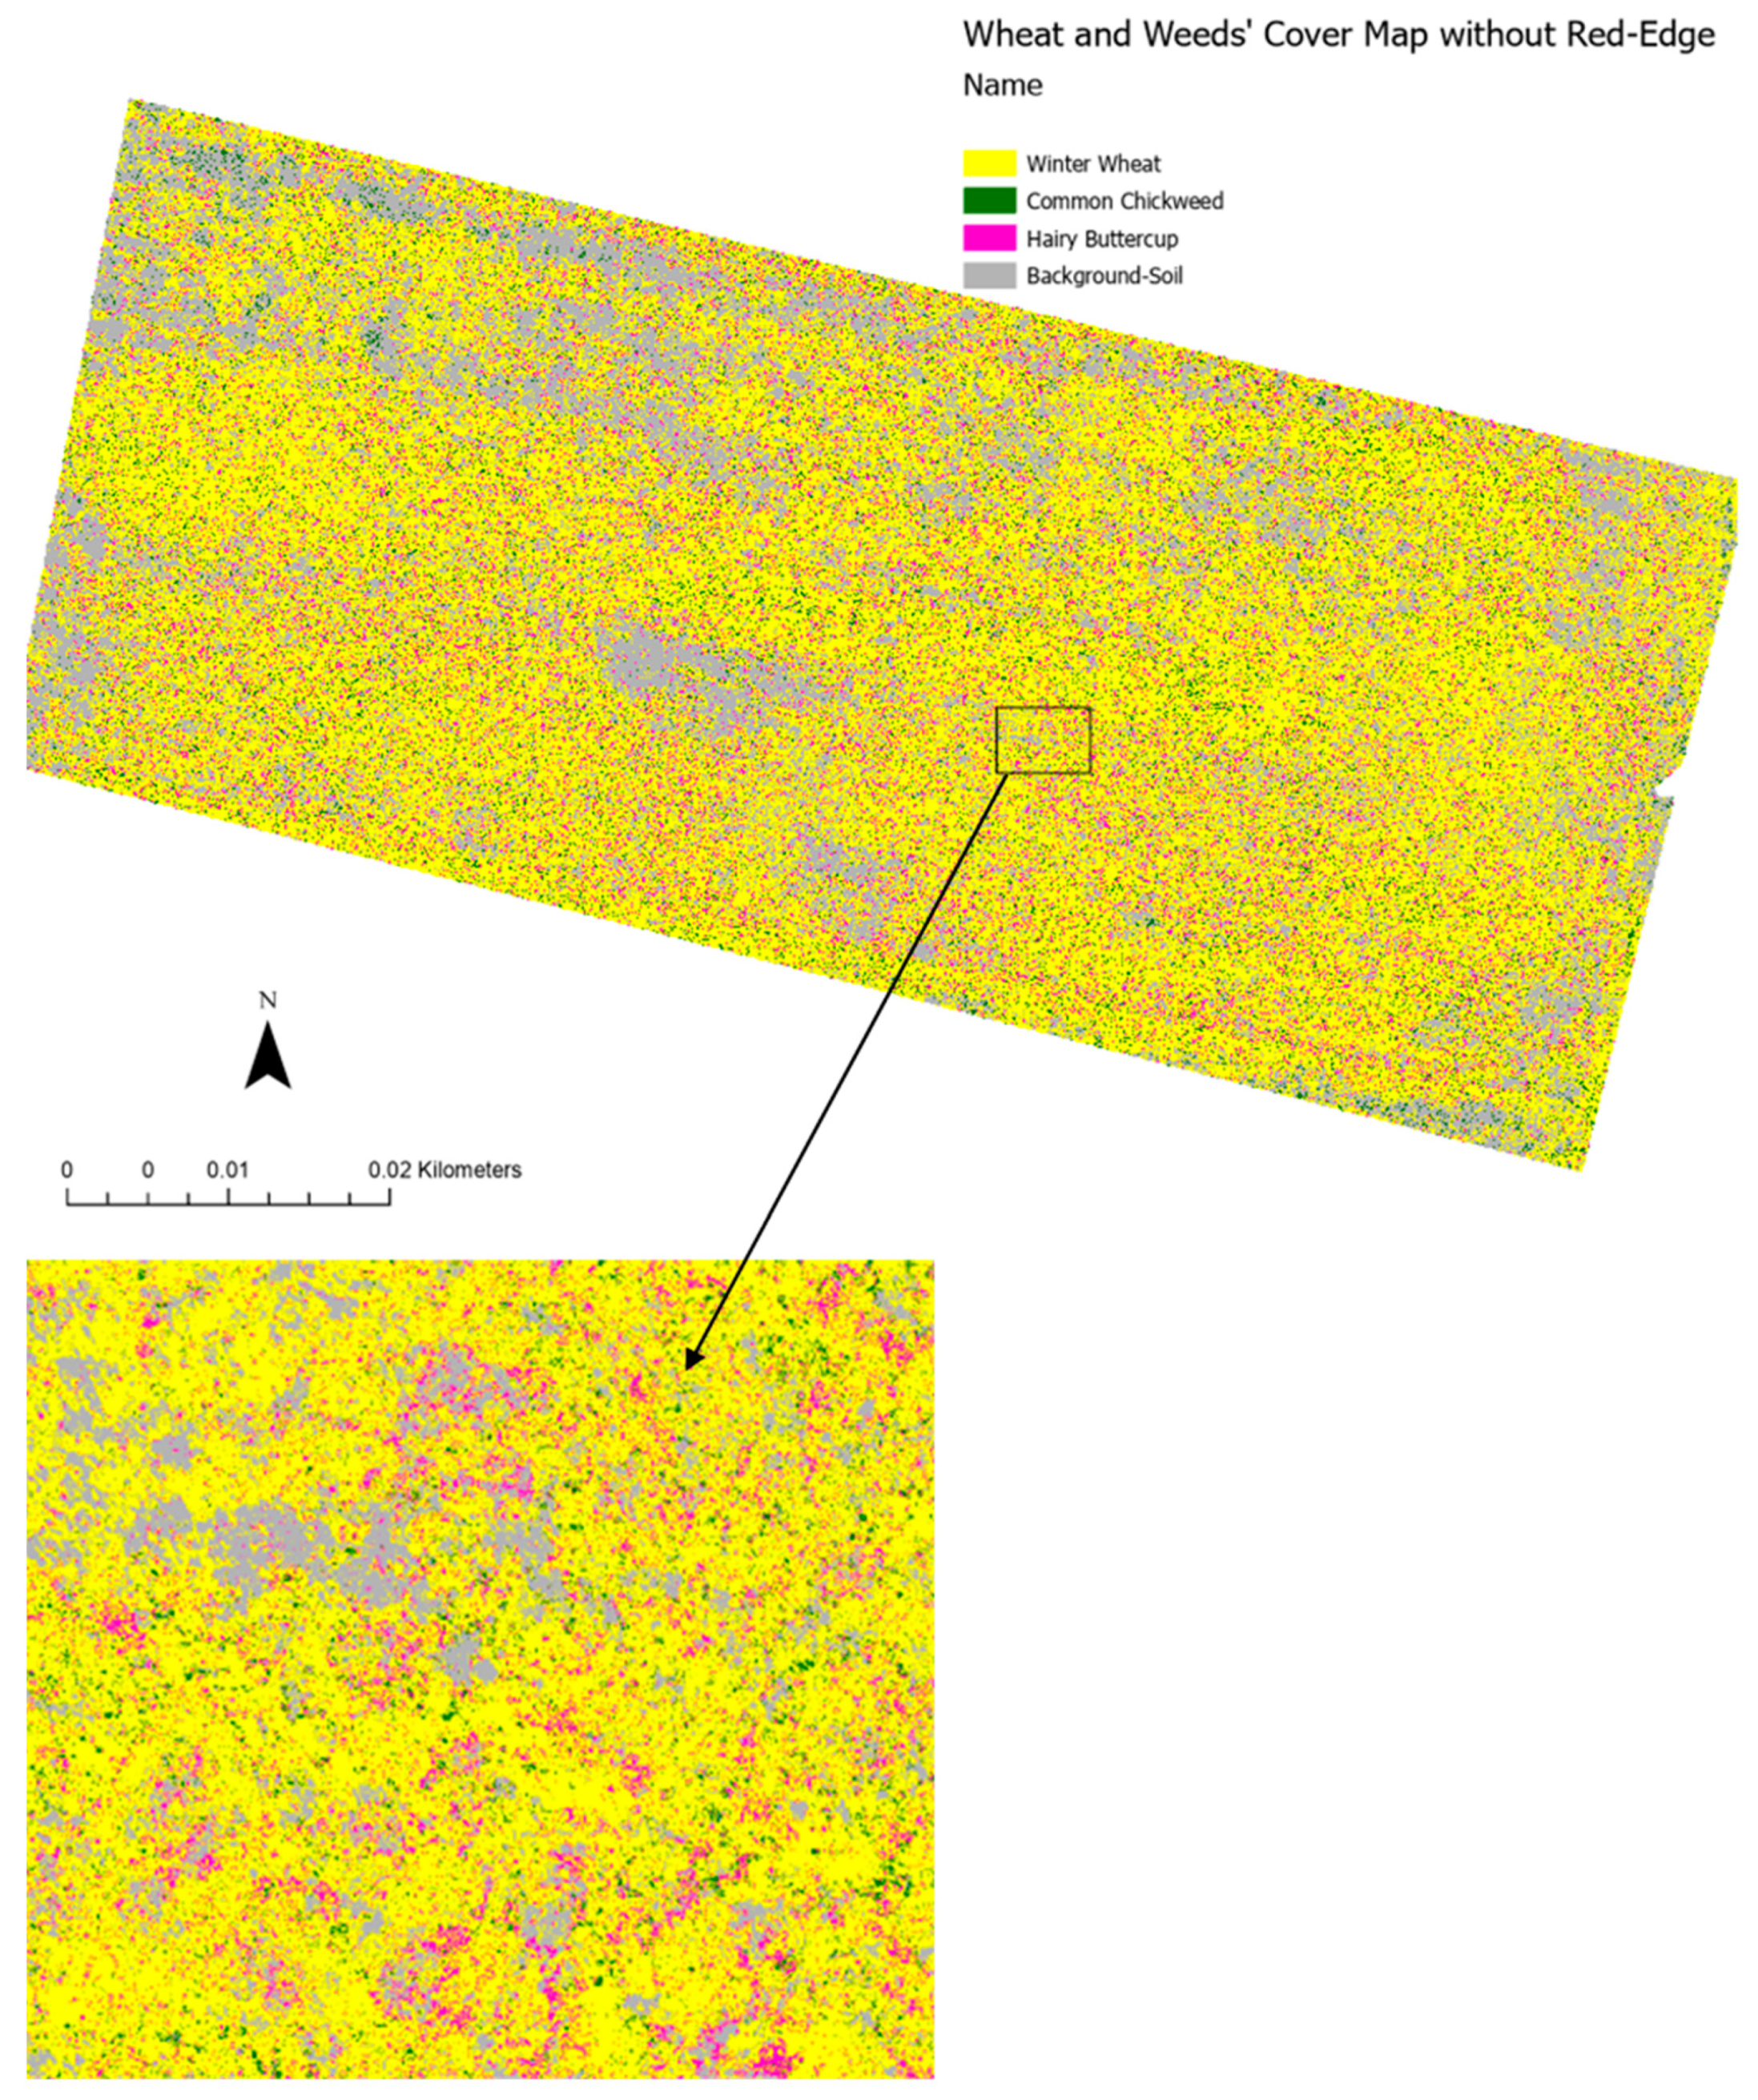
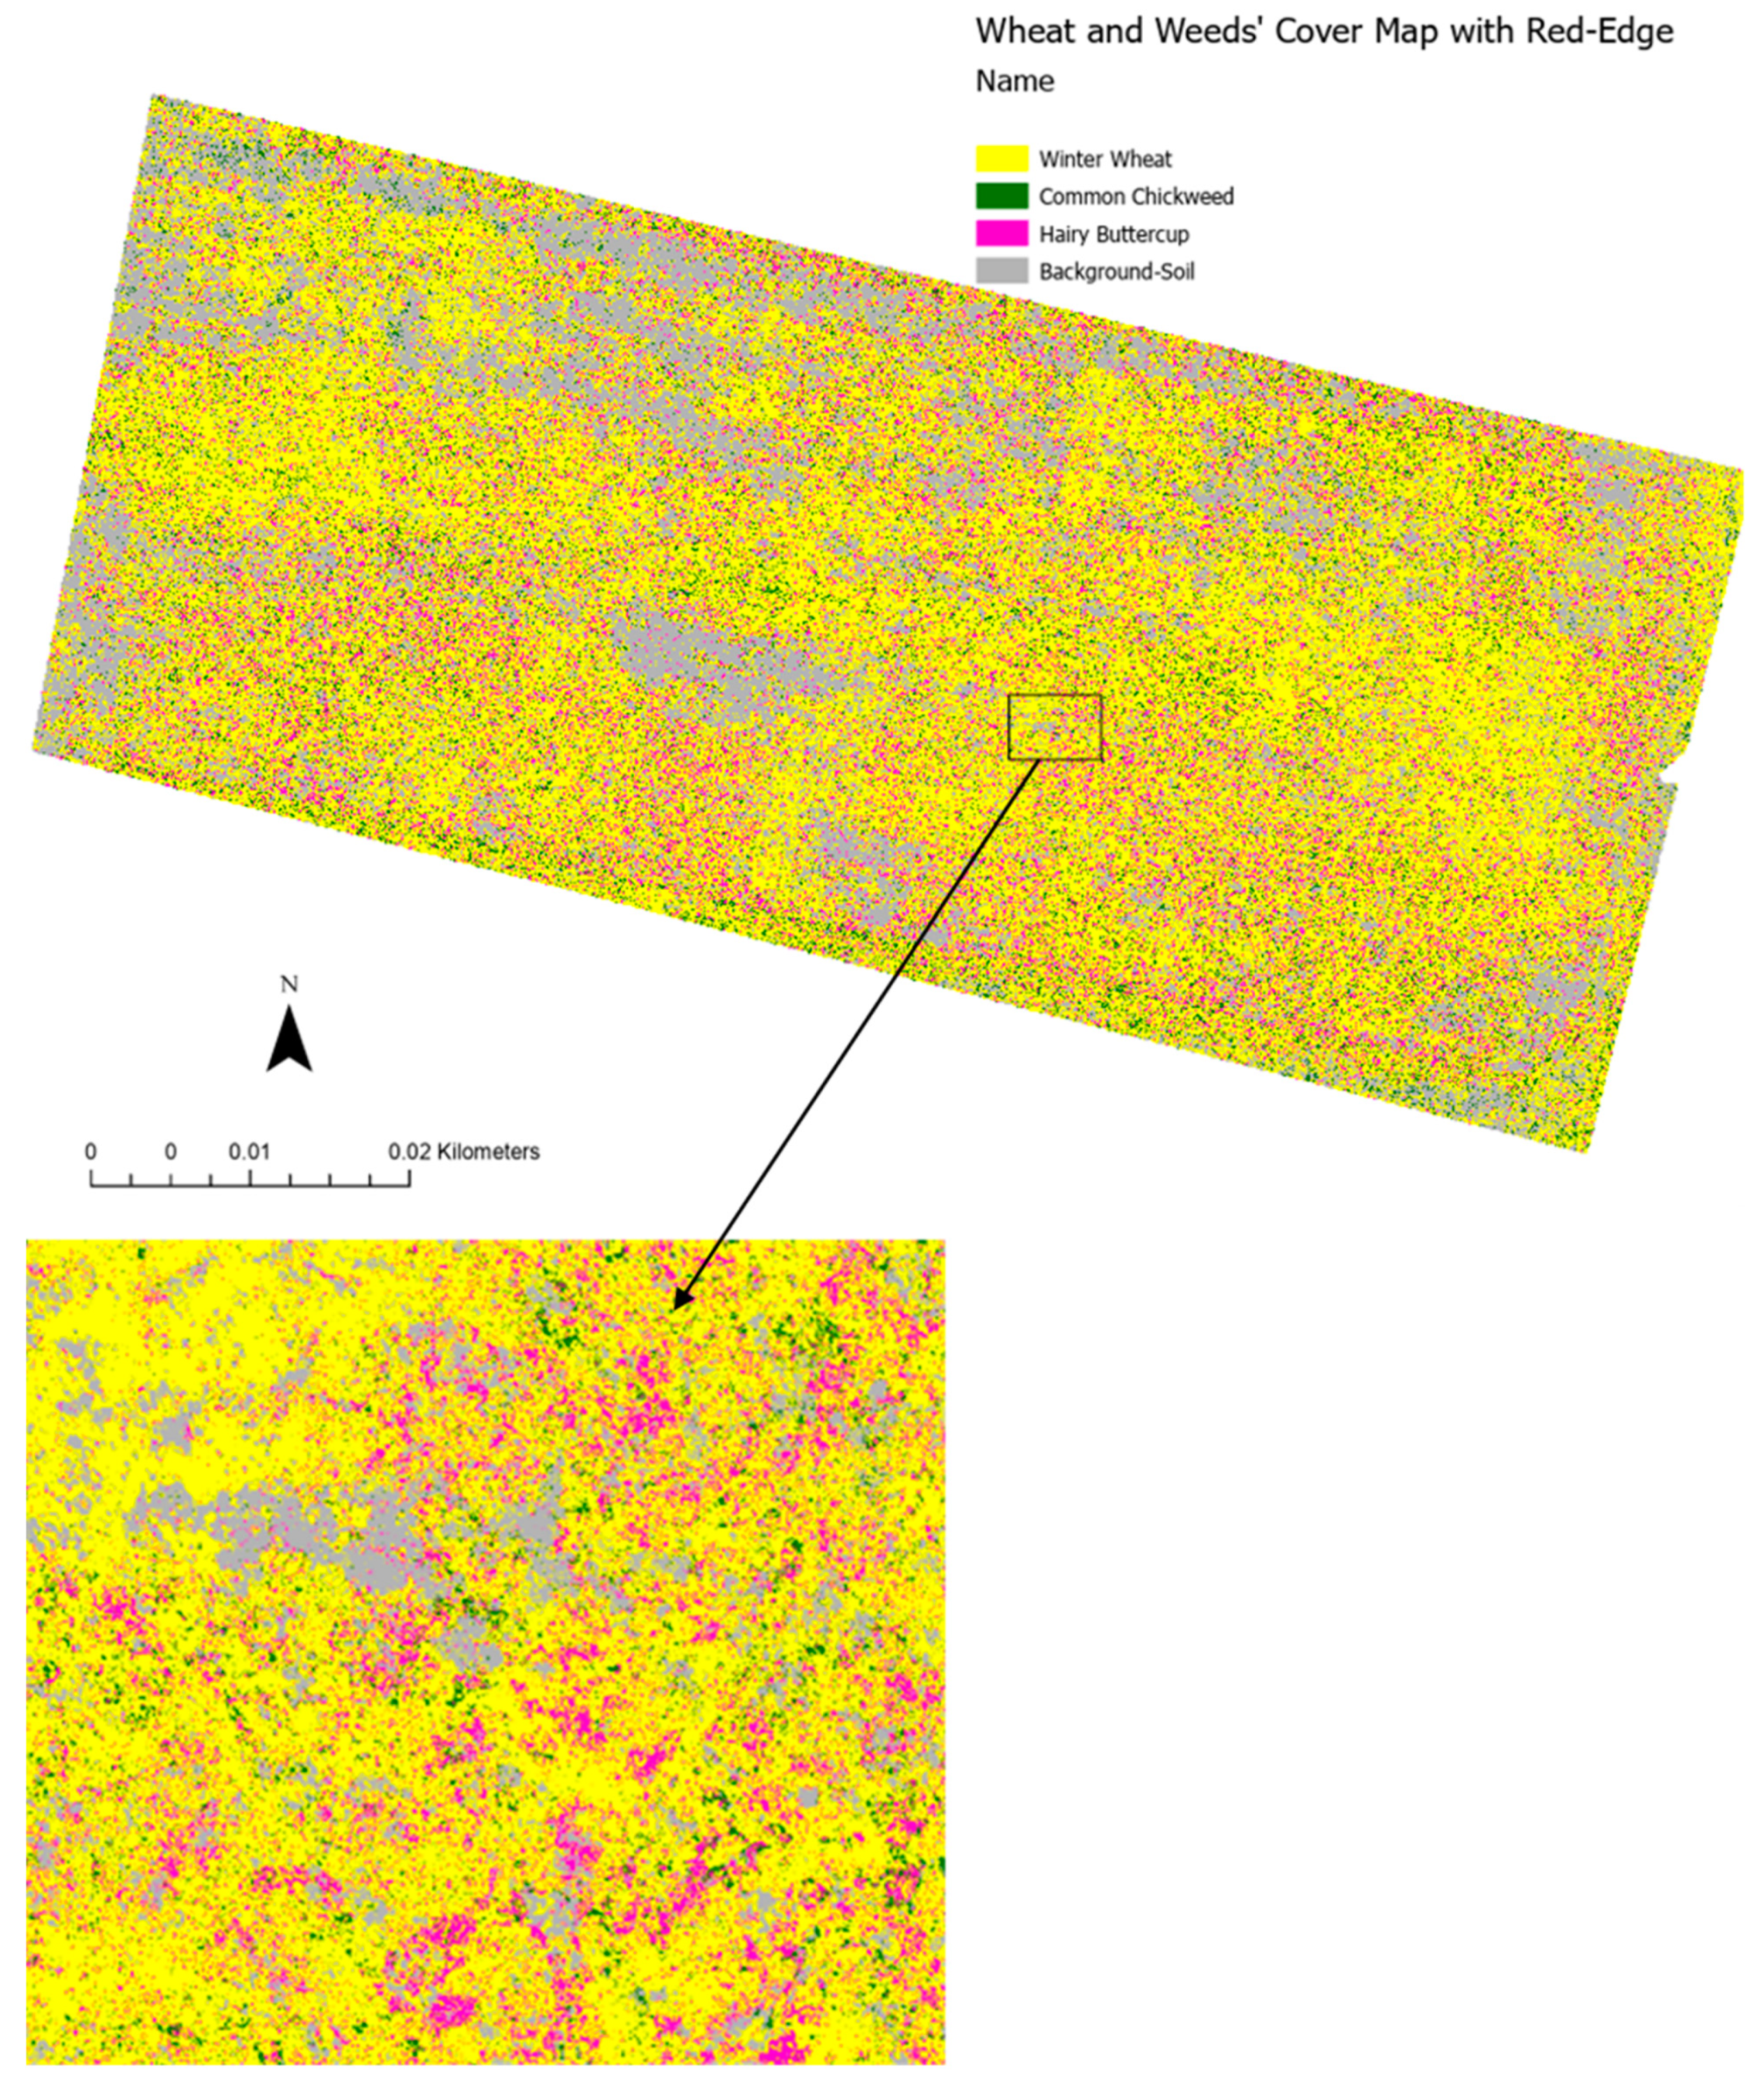
3. Results
4. Discussion
5. Conclusions
Author Contributions
Funding
Institutional Review Board Statement
Informed Consent Statement
Data Availability Statement
Acknowledgments
Conflicts of Interest
References
- Zhao, C.J. Advances of research and application in remote sensing for agriculture. Trans. Chin. Soc. Agric. Mach. 2014, 45, 277–293. [Google Scholar]
- Kang, Y.; Meng, Q.; Liu, M.; Zou, Y.; Wang, X. Crop Classification Based on Red-Edge Features Analysis of GF-6 WFV Data. Sensors 2021, 21, s21134328. [Google Scholar] [CrossRef] [PubMed]
- Chen, Z.X.; Ren, J.Q.; Tang, H.J.; Shi, Y.; Liu, J. Progress and perspectives on agricultural remote sensing research and applications in China. J. Remote Sens. 2016, 20, 748–767. [Google Scholar]
- Hunter III, J.E.; Gannon, T.W.; Richardson, R.J.; Yelverton, F.H.; Leon, R.G. Integration of remote-weed mapping and an autonomous spraying unmanned aerial vehicle for site-specific weed management. Pest Manag. Sci. 2020, 76, 1386–1392. [Google Scholar] [CrossRef] [PubMed]
- Lopez-Granados, F. Weed detection for site-specific weed management: Mapping and real-time approaches. Int. J. Weed Biol. Ecol. Veg. Manag. 2011, 51, 1–11. [Google Scholar] [CrossRef]
- Flessner, M.L.; Burke, I.C.; Dille, J.A.; Everman, W.J.; VanGessel, M.J.; Tidemann, B.; Manuchehri, M.R.; Soltani, N.; Sikkema, P.H. Potential wheat yield loss due to weeds in the United States and Canada. Weed Technol. 2021, 35, 916–923. [Google Scholar] [CrossRef]
- Wilson, B.J.; Wright, K.J.; Brain, P.; Clements, M.; Stephens, E. Predicting the competitive effects of weed and crop density on weed biomass, weed seed production and crop yield in wheat. Int. J. Weed Biol. Ecol. Veg. Manag. 1995, 35, 265–278. [Google Scholar] [CrossRef]
- Adeux, G.; Vieren, E.; Carlesi, S.; Bàrberi, P.; Munier-Jolain, N.; Cordeau, S. Mitigating crop yield losses through weed diversity. Nat. Sustain. 2019, 2, 1018–1026. [Google Scholar] [CrossRef]
- Singh, S.; Pandey, P.; Khan, M.S.; Semwal, M. Multi-temporal High Resolution Unmanned Aerial Vehicle (UAV) Multispectral Imaging for Menthol Mint Crop Monitoring. In Proceedings of the 2021 6th International Conference for Convergence in Technology (I2CT), Maharashtra, India, 2–4 April 2021; pp. 1–4. [Google Scholar]
- Brewer, K.; Clulow, A.; Sibanda, M.; Gokool, S.; Naiken, V.; Mabhaudhi, T. Predicting the Chlorophyll Content of Maize over Phenotyping as a Proxy for Crop Health in Smallholder Farming Systems. Remote Sens. 2022, 14, 518. [Google Scholar] [CrossRef]
- Bilodeau, M.F.; Esau, T.J.; MacEachern, C.B.; Farooque, A.A.; White, S.N.; Zaman, Q.U. Identifying hair fescue in wild blueberry fields using drone images for precise application of granular herbicide. Smart Agric. Technol. 2023, 3, 100127. [Google Scholar] [CrossRef]
- Clevers, J.G.P.W.; Gitelson, A.A. Remote estimation of crop and grass chlorophyll and nitrogen content using red-edge bands on Sentinel-2 and -3. Int. J. Appl. Earth Obs. Geoinf. 2013, 23, 344–351. [Google Scholar] [CrossRef]
- Weichelt, H.; Rosso, R.; Marx, A.; Reigber, S.; Douglass, K.; Heynen, M. The RapidEye Red-Edge Band-White Paper. Available online: https://apollomapping.com/wp-content/user_uploads/2012/07/RapidEye-Red-Edge-White-Paper.pdf (accessed on 3 November 2022).
- Xianju, L.; Gang, C.; Jingyi, L.; Weitao, C.; Xinwen, C.; Yiwei, L. Effects of RapidEye Imagery’s Red-edge Band and Vegetation Indices on Land Cover Classification in an Arid Region. Chin. Geogr. Sci. 2017, 27, 827–835. [Google Scholar]
- Sun, L.; Chen, J.; Guo, S.; Deng, X.; Han, Y. Integration of Time Series Sentinel-1 and Sentinel-2 Imagery for Crop Type Mapping over Oasis Agricultural Areas. Remote Sens. 2020, 12, 158. [Google Scholar] [CrossRef]
- Recio, J.A.; Helmholz, P.; Muller, S. Potential Evaluation of Different Types of Images and Their Combination for the Classification of GIS Objects Cropland and Grassland; The International Archives of the Photogrammetry Remote Sensing and Spatial Information Sciences: Hannover, Germany, 2011; Volume XXXVIII-4/W19, p. 6. [Google Scholar]
- Forkuor, G.; Dimobe, K.; Serme, I.; Tondoh, J.E. Landsat-8 vs. Sentinel-2: Examining the added value of sentinel-2′s red-edge bands to land-use and land-cover mapping in Burkina Faso. GIScience Remote Sens. 2018, 55, 331–354. [Google Scholar] [CrossRef]
- Luo, C.; Liu, H.; Lu, L.; Liu, Z.; Kong, F.; Zhang, X. Monthly composites from Sentinel-1 and Sentinel-2 images for regional major crop mapping with Google Earth Engine. J. Integr. Agric. 2021, 20, 1944–1957. [Google Scholar] [CrossRef]
- Zahir, I.A.D.M.; Omar, A.F.; Jamlos, M.F.; Azmi, M.A.M.; Muncan, J. A review of visible and near-infrared (Vis-NIR) spectroscopy application in plant stress detection. Sens. Actuators A Phys. 2022, 338, 113468. [Google Scholar] [CrossRef]
- Meng, H.; Li, C.; Liu, Y.; Gong, Y.; He, W.; Zou, M. Corn Land Extraction Based on Integrating Optical and SAR Remote Sensing Images. Land 2023, 12, 398. [Google Scholar] [CrossRef]
- Hodges, J.A.; Norrell, R.J.; Sarah, M.H. Tennessee; Encyclopedia Britannica, Inc.: Chicago, IL, USA, 2018; Available online: https://www.britannica.com/place/Tennessee (accessed on 10 January 2023).
- United States Climate Data. Climate Nashville-Tennessee. Available online: https://www.usclimatedata.com/climate/nashville/tennessee/united-states/ustn0357 (accessed on 15 January 2023).
- USDA-NRCS. Byler Series; National Cooperative Soil Survey, United States Department of Agriculture—Natural Resources Conservation Service: Nashville, TN, USA, 2001. [Google Scholar]
- MicaSense. MicaSense Altum™ and DLS 2 Integration Guide; MicaSense, Inc.: Seattle, WA, USA, 2020. [Google Scholar]
- Agilandeeswari, L.; Prabukumar, M.; Radhesyam, V.; Phaneendra, K.L.N.B.; Farhan, A. Crop Classification for Agricultural Applications in Hyperspectral Remote Sensing Images. Appl. Sci. 2022, 12, 1670. [Google Scholar] [CrossRef]
- Breiman, L. Random forests. Mach. Learn. 2001, 45, 5–32. [Google Scholar] [CrossRef]
- Islam, N.; Rashid, M.M.; Wibowo, S.; Xu, C.; Morshed, A.; Wasimi, S.A.; Moore, S.; Rahman, S.M. Early Weed Detection Using Image Processing and Machine Learning Techniques in an Australian Chilli Farm. Agriculture 2021, 11, 387. [Google Scholar] [CrossRef]
- Khosravi, I.; Alavipanah, S.K. A random forest-based framework for crop mapping using temporal, spectral, textural and polarimetric observations. Int. J. Remote Sens. 2019, 40, 7221–7251. [Google Scholar] [CrossRef]
- Son, N.; Chen, C.; Chen, C.; Minh, V. Assessment of Sentinel-1A data for rice crop classification using random forests and support vector machines. Geocarto Intern. 2018, 33, 587–601. [Google Scholar] [CrossRef]
- Belgiu, M.; Dragut, L. Random forest in remote sensing: A review of applications and future directions. ISPRS J. Photogramm. Remote Sens. 2016, 114, 24–31. [Google Scholar] [CrossRef]
- Magidi, J.; Nhamo, L.; Mpandeli, S.; Mabhaudhi, T. Application of the Random Forest Classifier to Map Irrigated Areas Using Google Earth Engine. Remote Sens. 2021, 13, 876. [Google Scholar] [CrossRef]
- Breiman, L. Random Forests—Random Features; Technical Report 567; Statistics Department, University of California: Berkeley, CA, USA, 1999; Available online: ftp://ftp.stat.berkeley.edu/pub/users/breiman (accessed on 15 December 2022).
- Sharma, R.C.; Hara, K.; Hirayama, H. A Machine Learning and Cross-Validation Approach for the Discrimination of Vegetation Physiognomic Types Using Satellite Based Multispectral and Multitemporal Data. Scientifica 2017, 2017, 9806479. [Google Scholar] [CrossRef] [PubMed]
- Costa, H.; Almeida, D.; Vala, F.; Marcelino, F.; Caetano, M. Land Cover Mapping from Remotely Sensed and Auxiliary Data for Harmonized Official Statistics. Int. J. Geo-Inf. 2018, 7, 157. [Google Scholar] [CrossRef]
- Mather, P.M.; Koch, M. Computer Processing of Remotely-Sensed Images: An Introduction; John Wiley and Sons: Chichester, UK, 2011. [Google Scholar]
- Rasmussen, J.; Azim, S.; Nielsen, J. Pre-harvest weed mapping of Cirsium arvense L. based on free satellite imagery-The importance of weed aggregation and image resolution. Eur. J. Agron. 2021, 130, 126373. [Google Scholar] [CrossRef]
- Yi, Z.; Jia, L.; Chen, Q. Crop Classification Using Multi-Temporal Sentinel-2 Data in the Shiyang River Basin of China. Remote Sens. 2020, 12, 4052. [Google Scholar] [CrossRef]
- Shamsoddini, A.; Asadi, B. Crop mapping using Sentinel-1 and Sentinel-2 images and random forest algorithm. In Proceedings of the 4th Intercontinental Geoinformation Days (IGD), Tabriz, Iran, 20–21 June 2022; pp. 103–107. [Google Scholar]
- Hasan, A.S.M.M.; Sohel, F.; Diepeveen, D.; Laga, H.; Jones, M.G.K. A survey of deep learning techniques for weed detection from images. Comput. Electron. Agric. 2021, 184, 106067. [Google Scholar] [CrossRef]
- Al-Badri, A.H.; Ismail, N.; Al-Dulaimi, K.; Ghalib Ahmed Salman, G.A.; Khan, A.R.; Al-Sabaawi, A.; Salam, M.S.H. Classification of weed using machine learning techniques: A review—Challenges, current and future potential techniques. J. Plant Dis. Prot. 2022, 129, 745–768. [Google Scholar] [CrossRef]
- Xu, B.; Meng, R.; Chen, G.; Liang, L.; Lv, Z.; Zhou, L.; Sun, R.; Zhao, F.; Yang, W. Improved Weed Mapping in Corn Fields by Combining Uav-Based Spectral, Textural, Structural, and Thermal Measurements. Available online: https://papers.ssrn.com/sol3/papers.cfm?abstract_id=4255457 (accessed on 3 January 2023).
- Balasundram, S.K.; Shamshiri, R.R.; Sridhara, S.; Rizan, N. The Role of Digital Agriculture in Mitigating Climate Change and Ensuring Food Security: An Overview. Sustainability 2023, 15, 5325. [Google Scholar] [CrossRef]
- Balafoutis, A.; Beck, B.; Fountas, S.; Vangeyte, J.; van der Wal, T.; Soto, I.; Gómez-Barbero, M.; Barnes, A.; Eory, V. Precision Agriculture Technologies Positively Contributing to GHG Emissions Mitigation, Farm Productivity and Economics. Sustainability 2017, 9, 1339. [Google Scholar] [CrossRef]
- Duchene, O.; Bathellier, C.; Dumont, B.; David, C.; Celette, F. Weed community shifts during the aging of perennial intermediate wheatgrass crops harvested for grain in arable fields. Eur. J. Agron. 2023, 143, 126721. [Google Scholar] [CrossRef]
- Kordbacheh, F.; Flaten, D.N.; Gulden, R.H. Weed community dynamics under repeated fertilization with different nutrient sources over 5 years. Agric. Ecosyst. Environ. 2023, 346, 108328. [Google Scholar] [CrossRef]
- Fernandez-Quintanilla, C.; Pena, J.M.; Andujar, D.; Dorado, J.; Ribeiro, A.; Lopez-Granados, F. Is thecurrent state of the art of weed monitoring suitable for site-specific weed management in arable crops? Weed Res. 2018, 58, 259–272. [Google Scholar] [CrossRef]
- Marino, S. Understanding the spatio-temporal behavior of crop yield, yield components and weed pressure using time series Sentinel-2-data in an organic farming system. Eur. J. Agron. 2023, 145, 126785. [Google Scholar] [CrossRef]
- Oad, F.C.; Siddiqui, M.H.; Buriro, U.A. Growth and yield losses in wheat due to different weed densities. Asian J. Plant Sci. 2007, 6, 173–176. [Google Scholar] [CrossRef]
- Jack, O.; Menegat, A.; Gerhards, R. Winter wheat yield loss in response to Avena fatua competition and effect of reduced herbicide dose rates on seed production of this species. J. Plant Dis. Prot. 2017, 124, 371–382. [Google Scholar] [CrossRef]


| Band Name | Centre Wavelength (nm) | Bandwidth (nm) |
|---|---|---|
| Blue | 475 | 32 |
| Green | 560 | 27 |
| Red | 668 | 16 |
| Red-Edge | 717 | 12 |
| Near Infrared | 842 | 57 |
| LWIR | 11,000 | 6000 |
| Classes | Winter Wheat | Chickweed | Hairy Buttercup | Total |
|---|---|---|---|---|
| Reference | ||||
| Winter Wheat | 90 | 48 | 16 | 155 |
| Chickweed | 1 | 51 | 6 | 58 |
| Hairy Buttercup | 2 | 12 | 73 | 87 |
| Total | 93 | 112 | 95 | 300 |
| User’s accuracy (%) | Producer’s accuracy (%) | |||
| Winter Wheat | 58 | 97 | ||
| Chickweed | 88 | 45 | ||
| Hairy Buttercup | 84 | 77 |
| Classes | Winter Wheat | Chickweed | Hairy Buttercup | Total |
|---|---|---|---|---|
| Reference | ||||
| Winter Wheat | 90 | 34 | 8 | 132 |
| Chickweed | 3 | 68 | 4 | 75 |
| Hairy Buttercup | 3 | 15 | 75 | 93 |
| Total | 96 | 117 | 87 | 300 |
| User’s accuracy (%) | Producer’s accuracy (%) | |||
| Winter Wheat | 68 | 94 | ||
| Chickweed | 91 | 58 | ||
| Hairy Buttercup | 81 | 86 |
Disclaimer/Publisher’s Note: The statements, opinions and data contained in all publications are solely those of the individual author(s) and contributor(s) and not of MDPI and/or the editor(s). MDPI and/or the editor(s) disclaim responsibility for any injury to people or property resulting from any ideas, methods, instructions or products referred to in the content. |
© 2023 by the authors. Licensee MDPI, Basel, Switzerland. This article is an open access article distributed under the terms and conditions of the Creative Commons Attribution (CC BY) license (https://creativecommons.org/licenses/by/4.0/).
Share and Cite
Akumu, C.E.; Dennis, S. Effect of the Red-Edge Band from Drone Altum Multispectral Camera in Mapping the Canopy Cover of Winter Wheat, Chickweed, and Hairy Buttercup. Drones 2023, 7, 277. https://doi.org/10.3390/drones7040277
Akumu CE, Dennis S. Effect of the Red-Edge Band from Drone Altum Multispectral Camera in Mapping the Canopy Cover of Winter Wheat, Chickweed, and Hairy Buttercup. Drones. 2023; 7(4):277. https://doi.org/10.3390/drones7040277
Chicago/Turabian StyleAkumu, Clement E., and Sam Dennis. 2023. "Effect of the Red-Edge Band from Drone Altum Multispectral Camera in Mapping the Canopy Cover of Winter Wheat, Chickweed, and Hairy Buttercup" Drones 7, no. 4: 277. https://doi.org/10.3390/drones7040277