1. Introduction
1.1. UAV-Based Shallow-Water Monitoring
Unoccupied Aerial Vehicles (UAVs) have become a widely applied tool in the field of spatial ecology [
1,
2], including the mapping and monitoring of shallow-water habitats [
3,
4,
5,
6,
7,
8,
9]. Their ability to collect aerial imagery with a high spatial and temporal resolution over relatively large areas in a cost- and time-efficient way has allowed researchers to study ecosystems on new spatial scales by bridging the gap between traditional satellite and plane-based remote sensing and in-water techniques, including diver and vessel-based surveys [
10]. Especially, lightweight multirotor platforms have gained popularity among researchers due to their low acquisition cost, vertical take-off and landing capability, easy handling, flexible payload arrangements and their ability to hover in a fixed position over a point of interest. Examples of research conducted in shallow-water habitats using UAVs include mapping and monitoring coral reefs [
11,
12,
13], submerged vegetation in marine [
3,
4,
14,
15,
16] and freshwater [
17,
18,
19,
20] environments, as well as of submerged habitats as a whole [
21,
22,
23].
1.2. Limitations of UAV-Based Shallow-Water Monitoring
Despite its popularity, researchers still face a number of limitations when conducting UAV-based monitoring of shallow-water habitats. One example is the collection of high-resolution ground-truthing data needed as training and validation samples for the classification of the obtained aerial imagery. Low-altitude images taken by a conventional UAV-mounted camera are occasionally of sufficient quality to be used for ground-truthing purposes, given the right environmental conditions and favorable properties of the study area [
3]. In most areas, however, this method is limited to areas of a maximum depth of a few decimeters, while at the same time being very weather dependent, as the spectral signal reflecting from benthic substrates quickly gets absorbed or scattered with increasing depth, low visibilities or wind-induced movements at the water surface, not allowing for a clear determination of present species or habitats from low-altitude imagery [
5,
24,
25]. In most cases, it is necessary to apply traditional in-water ground-truthing methods involving divers, remotely operated vehicles (ROVs) or vessel-based drop-down camera systems to obtain adequate training and validation samples [
26]. Unoccupied Surface Vehicles (USVs) have recently been used for the monitoring of shallow-water habitats, including seagrasses, due to their capacity to collect georeferenced underwater imagery [
27]. As the camera of a USV, however, sits right below the water surface, class discrimination becomes more difficult with increasing water depth, especially in turbid waters. In general, in-water methods labor, cost and time intensive, often lack spatial accuracy or spatial extent, and are limited to areas that are accessible by boat or by divers. These limitations often result in a shortage of ground-truthing samples used in studies exploring the potential of UAV-based shallow-water monitoring [
15,
16,
18], sometimes with samples being exclusively obtained through knowledge-based visual interpretation and manual on-screen selection using the UAV-derived high-altitude imagery itself [
12,
20].
Furthermore, environmental conditions and study site-specific properties often do not allow us to obtain imagery that enables a classification down to species level or to record additional ecologically relevant information such as density, health status or depth limit of submerged vegetation, which are important ecological indicators and therefore a central target in many shallow-water monitoring campaigns [
28,
29,
30]. Optically deep waters and unfavorable environmental conditions can furthermore weaken or disturb the spectral signal to such an extent that it becomes impossible to perform area-based classifications of submerged habitats due to low reflection signals and resulting issues with aligning the obtained imagery to a georeferenced orthomosaic covering the entire study site.
1.3. Aim of the Study
Inspired by several studies experimenting with UAV-based subsurface data collection capable payload systems [
31,
32,
33,
34,
35,
36,
37,
38,
39], this study aims to address the mentioned limitations of UAV-based shallow-water monitoring by applying a low-tech ground-truthing payload device for subsurface data collection in the form of underwater videos and depth measurements. The potential of the developed payload-system to (1) collect training and validation data that can be used for area-based classification of submerged habitats, (2) collect data that helps identify additional ecologically relevant information such as the vegetation depth limit, (3) collect data that can be used for the creation of a class distribution map, based solely on the interpolation of point observations, as well as to (4) collect data that can be used to create a high resolution bathymetry map of the study area essentially adding valuable information to the survey [
40].
2. System Design
The UAV platform used in this study was a consumer-grade, low-weight quadcopter of the type DJI
® Phantom 4 RTK. Moreover, the customized payload system consisted of a payload mount, an emergency release mechanism, a nylon string, an underwater camera (with depth sensor), as well as two buoys and a counterweight. The payload mount was 3D printed using PETG carbon fiber, designed for quick mounting in the field and compatibility with any DJI
® Phantom model. An STL file with the model of the payload mount is made available in the
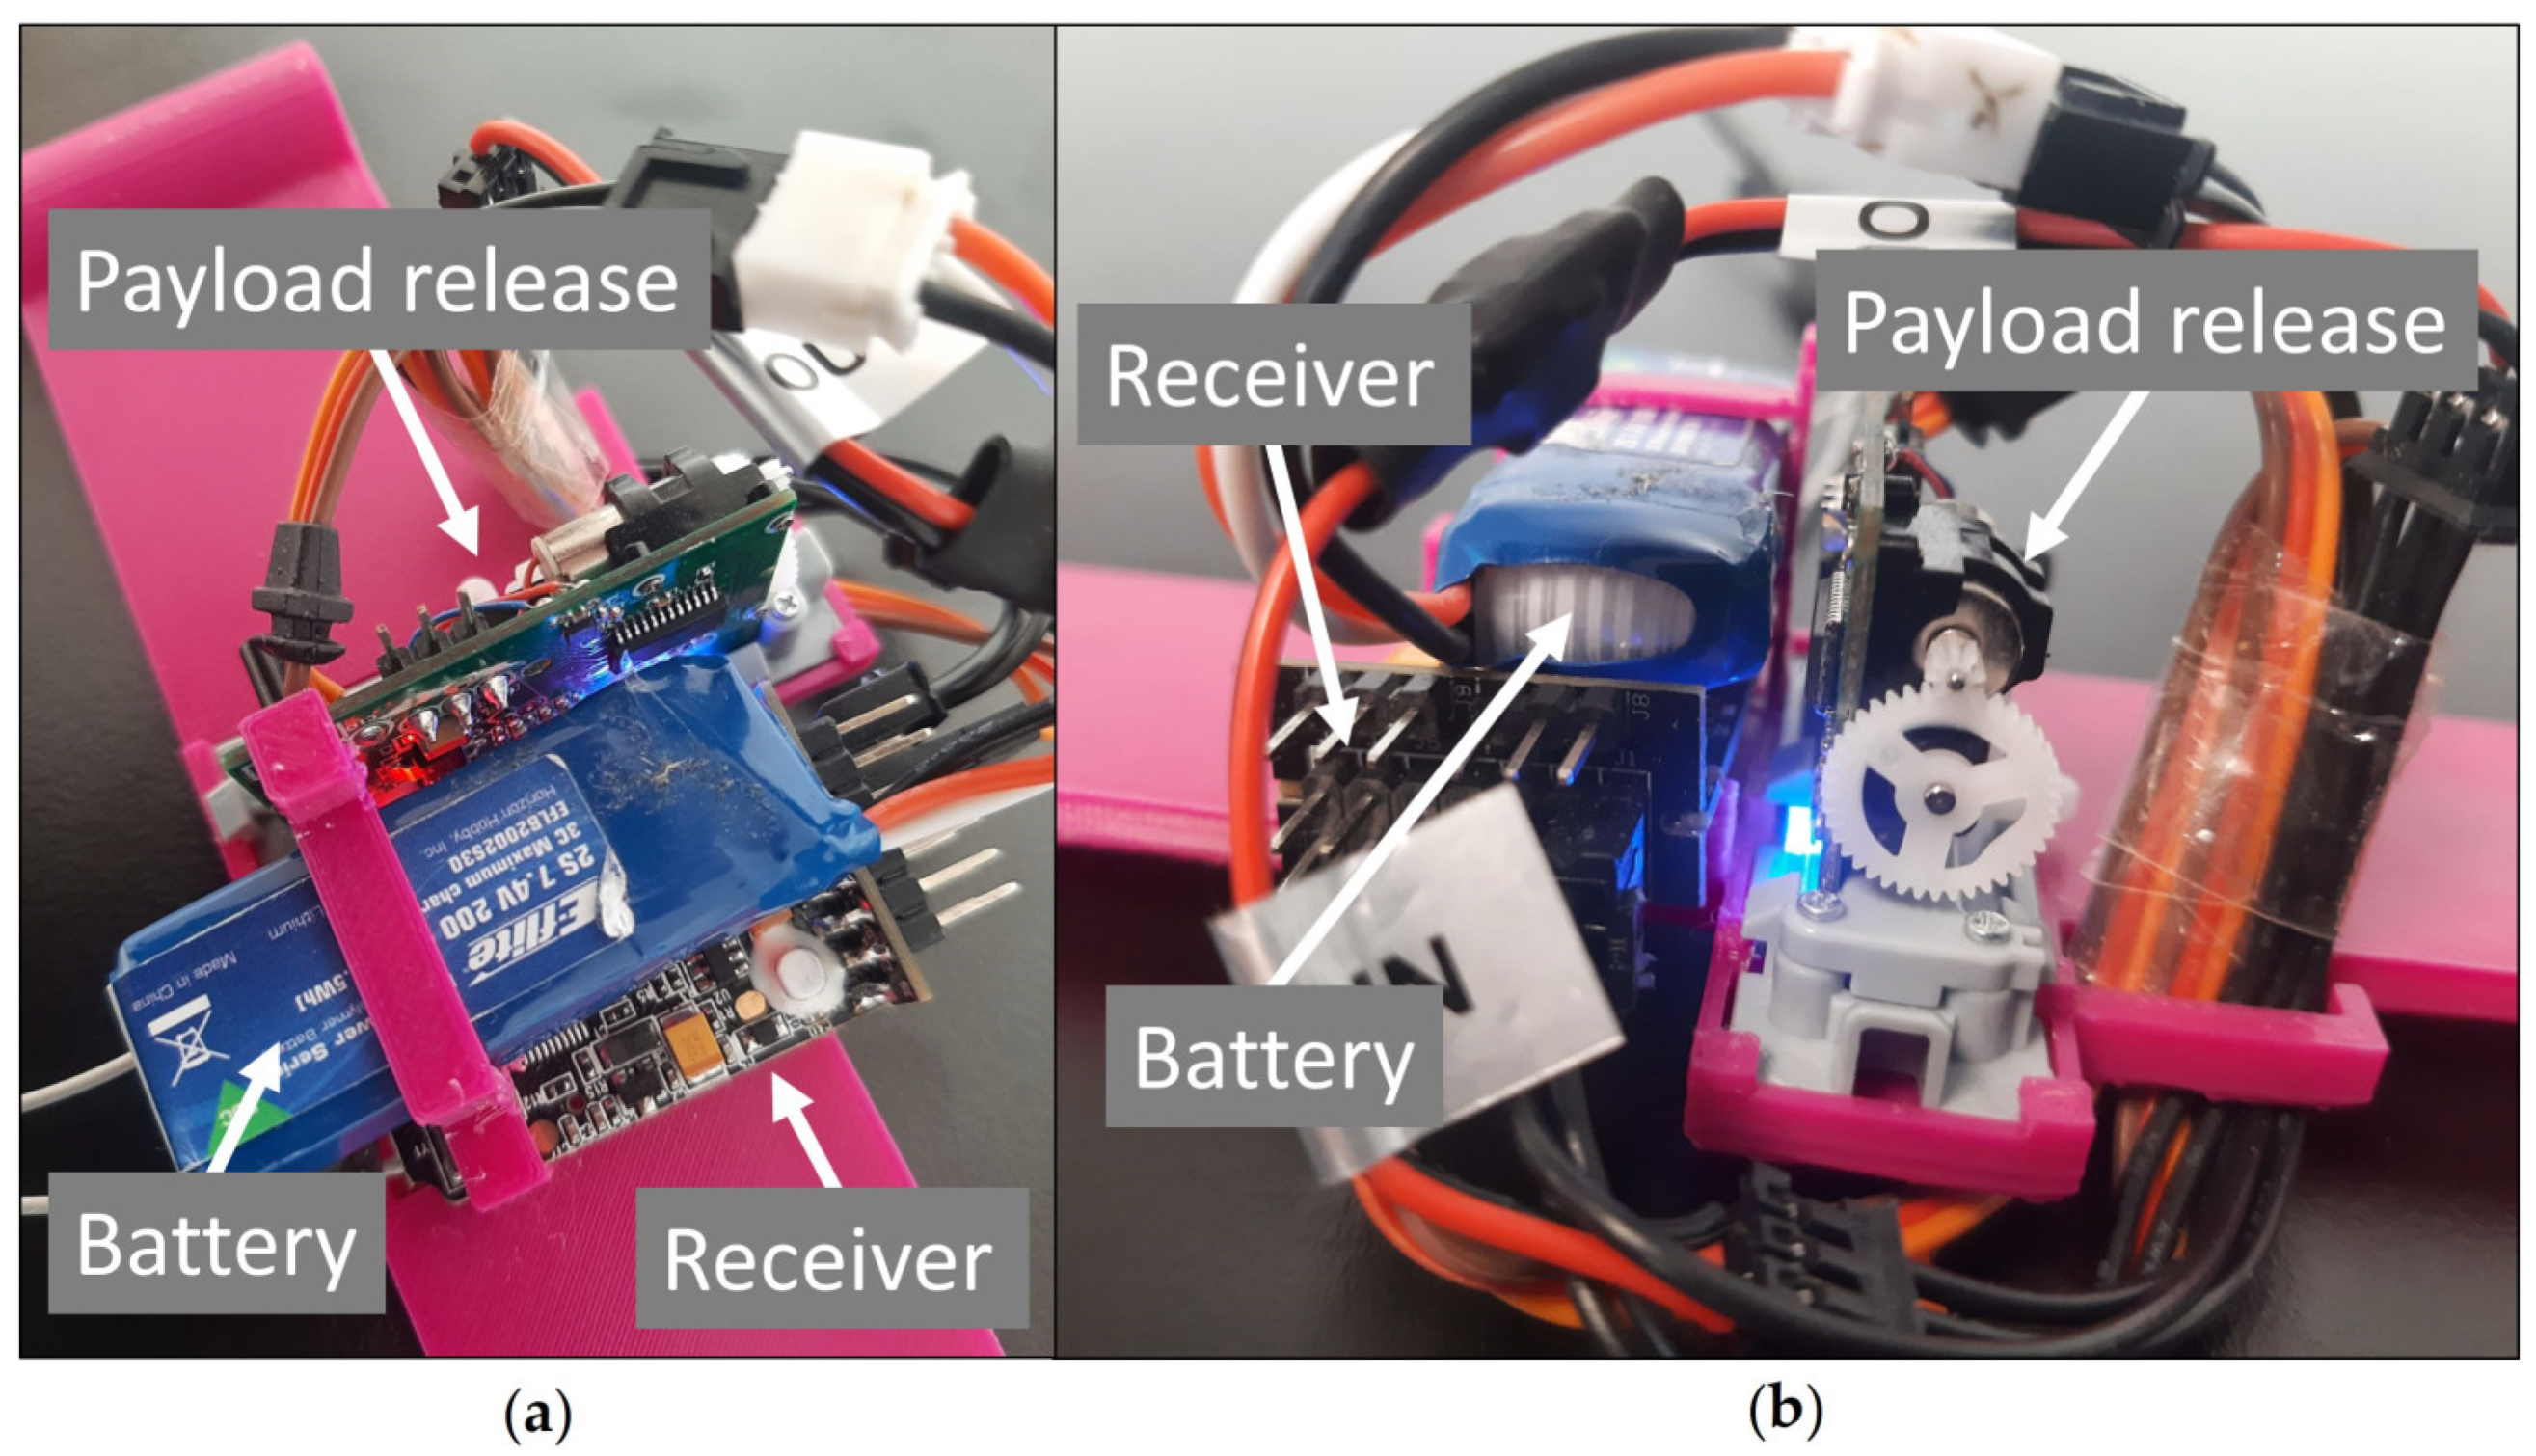
Supplementary Materials. The payload mount vehicle was integrated into the emergency release mechanism, which consisted of a Li-Po battery (2S 7.4 V, 220 mAh, E-flite, Horizon Hobby, LLC, Champaign, IL, USA), a receiver (4.0–8.4 V, 2.4 GHz, FS-iA6B, Shenzhen Flysky Technology Co., Ltd., Shenzhen, China) and a servoless payload release system (4.8–8.5 V, EFLA405, E-flite, Horizon Hobby, LLC, USA). The voltage of the receiver was regulated with a battery eliminator circuit (BAC). The release mechanism could be activated by the UAV pilot using a transmitter (2.4 GHz, FS-i6X, Shenzhen Flysky Technology Co., Ltd., China) with an operational range of 1500 m, in case the camera-sensor cluster would get entangled during subsurface data collection. A marker buoy was attached to the system for retrieval. The payload mount and emergency release mechanism are illustrated in
Figure 1.
Figure 2 shows the single components of the emergency release mechanism.
The payload mount and release system did not interfere with the UAV on-board camera, so both systems could operate at the same time. The underwater camera used in this set up was a Paralenz® Vaquita (12 MP, 4 K at 60 fps, 1080 p at 240 fps, FOV (1/1.8″) D108° H90° V59° lens, 18 mm focal length). This underwater camera performed automatic depth color correction and was equipped with a temperature and pressure logger. An auto-record function allowed for the automatic start of recordings at a pre-set depth, avoiding unnecessary recording time during flights between the sample points.
Figure 3 illustrates the set-up with UAV and payload system. A nylon string of 10 m in length was used to attach the underwater camera to the payload mount system via the emergency release mechanism. The lowering of the camera into the water was controlled by adjusting the UAV flight altitude. A fixed distance of 1 m from the camera to the sea floor during data collection was controlled by a floater and counterweight system consisting of a floater attached to the camera and a counterweight attached to the lower end of the line. The floater and camera were fixed to the line 1 m distance to the counterweight. The floater and counterweight were calibrated against each other, so that the upward force of the floater was slightly larger than the downward force of the camera, but not larger than that of the camera and counterweight combined. In this way, the combined downward force of the camera and the counterweight pulled the floater down when entering the water. As soon as the counterweight touched the sea floor and therefore stopped pulling downwards, the floater remained in position, as it had just enough force to pull the camera upwards. The distance of the camera to the sea floor can be adjusted by changing the distance between the camera and the counterweight.
The total weight of the payload system amounted to 275 g, which reduced the practical flight time of the UAV by 10 min, from 25 min to 15 min.
3. Experimental Procedures
3.1. Study Site
The payload system was tested in a 7-ha large study area situated along the southern coast of Lovns Broad in Limfjorden, Denmark (56°37’52.1″ N 9°13’57.6″ E) (
Figure 4).
The broad is an important fishing ground for blue mussel fisheries [
41] and is subject to high nutrient loads, highly organic sediments and low light conditions. As a designated Natura 2000 habitat, the area has been extensively monitored since 2009. Vessel-based video transect campaigns have been conducted triennially as part of an environmental impact assessment (EIA’s) of the blue mussel fisheries, which has created a robust record of the broad’s benthic habitats [
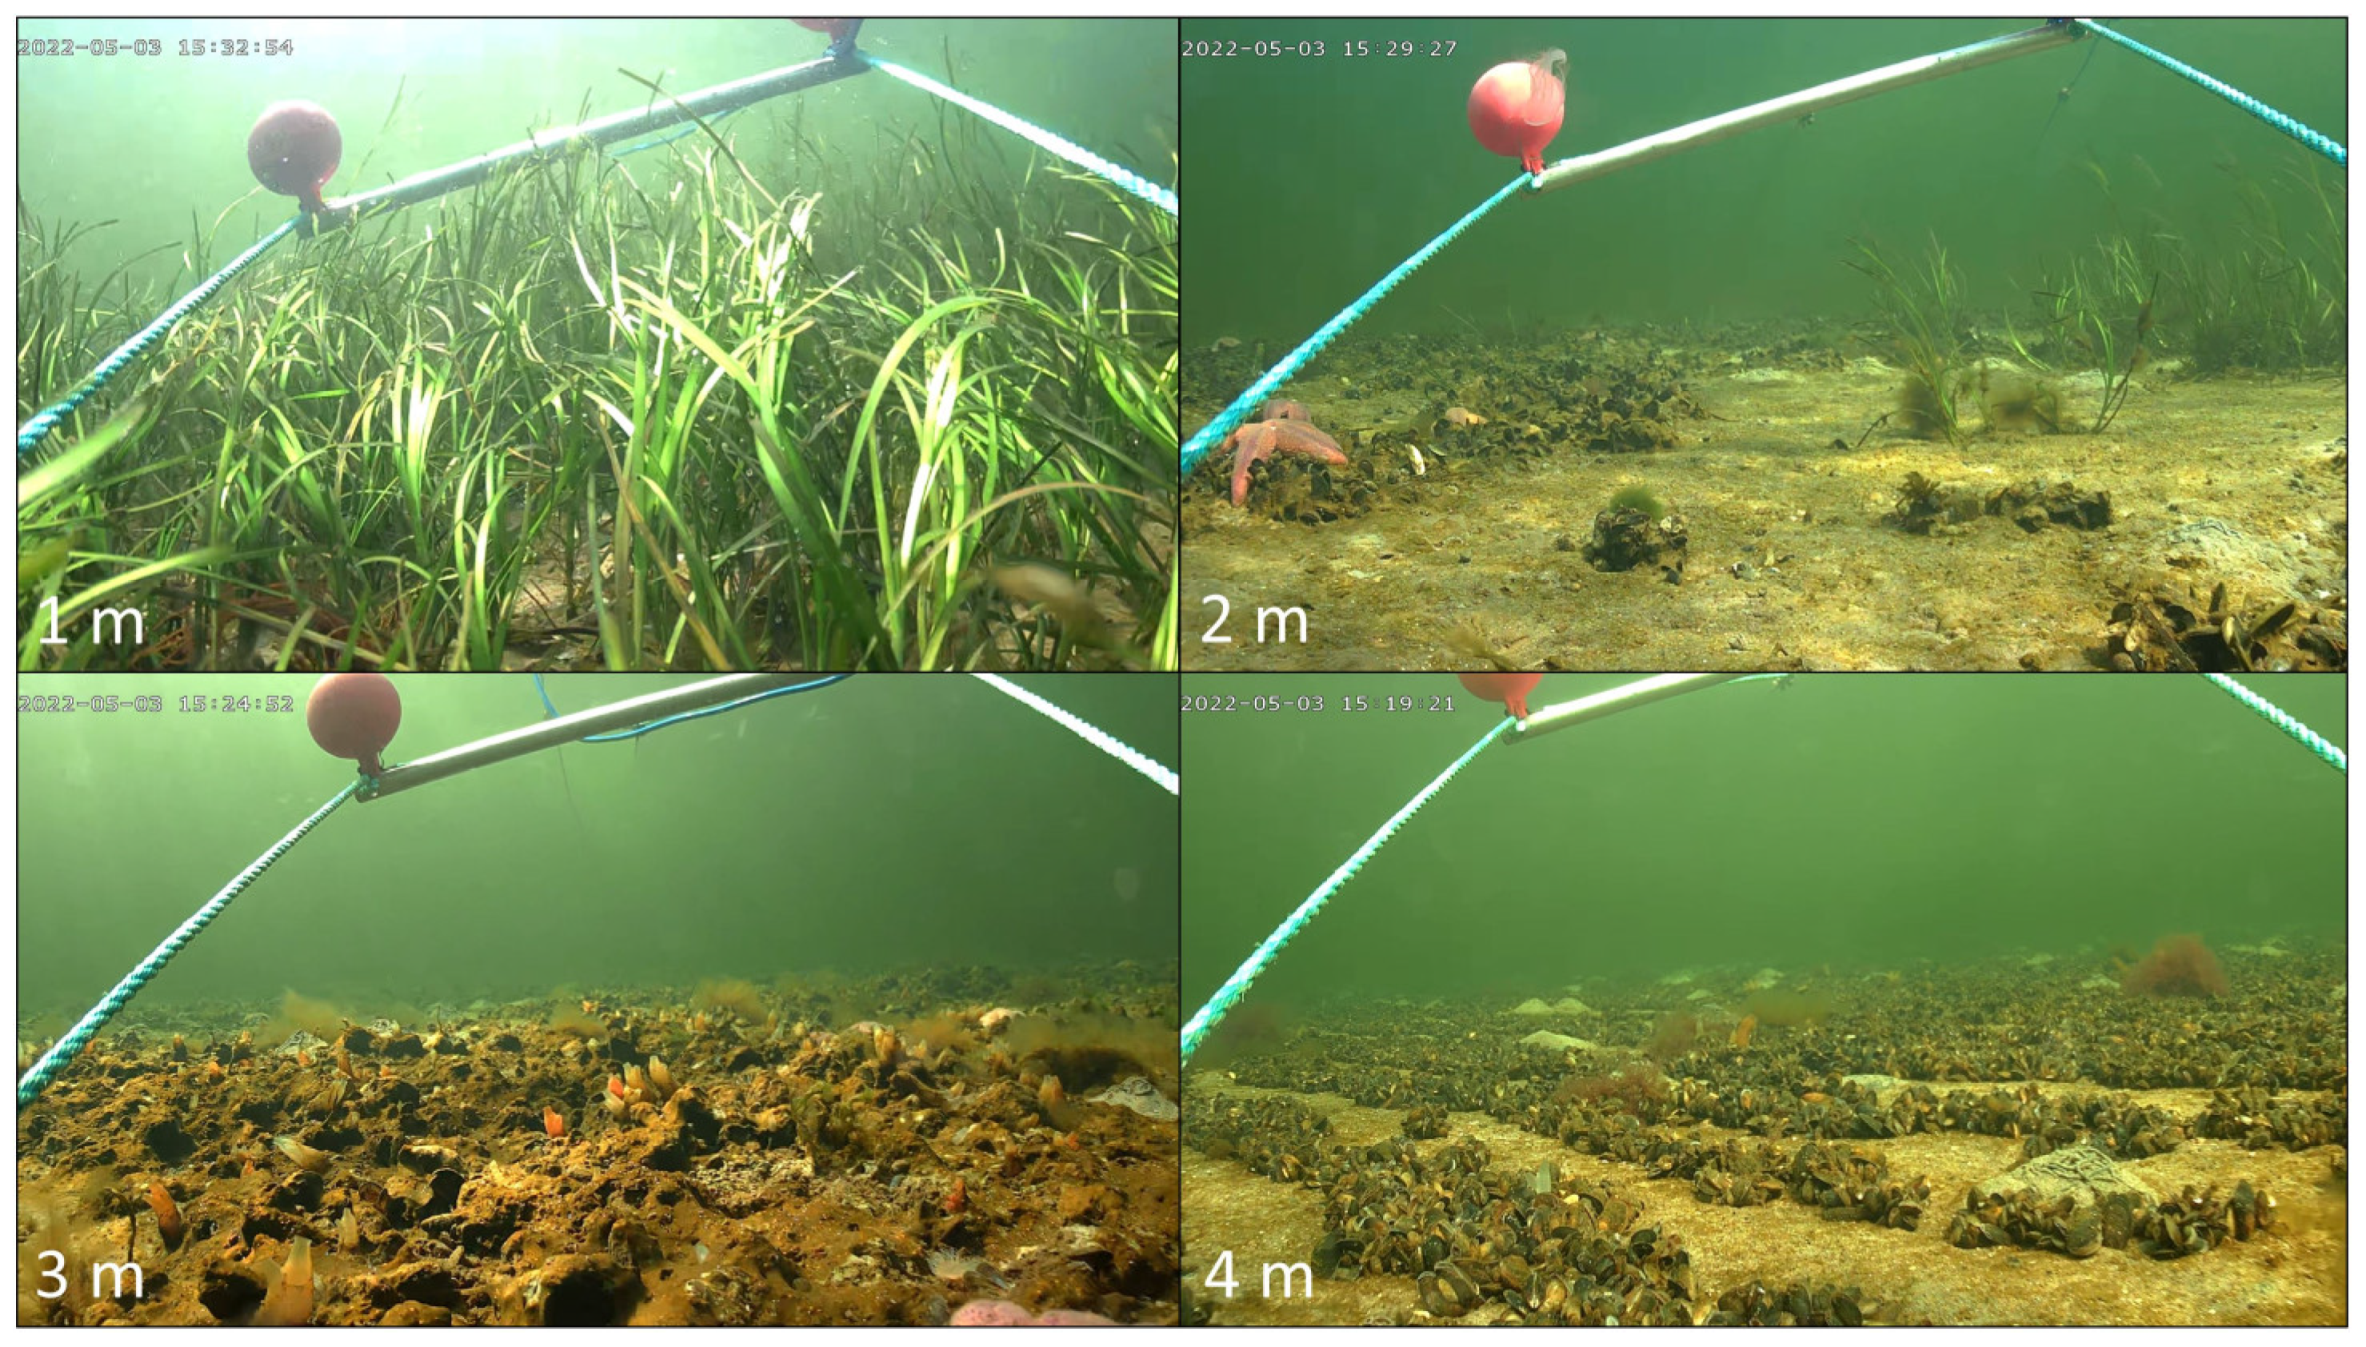
42]. The depth range in the study area was expected to be between 0 and 4 m. Video transects conducted at each 1-m depth interval in the study area in May 2022 recorded dense beds of the seagrass species
Zostera marina on the sandy bottom at a depth of 1 m. A mixed environment of
Z. marina patches, mussel patches (
Mytilus edulis) and sand was recorded at 2 m depth, while only a few single
Z. marina shoots were recorded at 3 m depth, which were sparsely distributed between agglomerations of
M. edulis shells. At a 4 m depth, no
Z. marina was recorded. Instead, dense beds of
M. edulis dominated the sea floor.
Figure 5 illustrates the benthic habitats at each 1-m depth interval, based on video recordings obtained in May 2022 as a part of an EIA for the area.
3.2. UAV Flights
Collection of underwater imagery and depth measurements using the developed payload system was conducted on 5 April 2023 at 1:00 p.m. at a zero tide height. A total of 136 sample points were distributed in a systematic grid over an area of 7 ha, with a 20 m distance between each point. The flight altitude was set to 15 m, leaving 5 m of distance between the lower end of the payload system and the water surface (
Figure 3). The flight speed between sample points was set to 2.5 m/s. Once reaching a sample point, the UAV was programmed to lower to 5 m altitude. In this way, a 5 m distance was kept between the UAV and the water surface during data collection (
Figure 3). The camera was programmed to start recording as soon as it entered the water. The UAV hovered for 5 s at a 5 m altitude, which allowed the underwater camera to stabilize in position at 1 m above the seafloor and record a clear sequence of the benthic habitat. Subsequently, the UAV returned to its flight altitude of 15 m. The ascent and descent speed over the sampling points were set to 1 m/s. The real-time kinematic (RTK) functionality of the UAV allowed for geotagging of the obtained videos with a spatial accuracy of ±0.02 m. The entire survey mission was planned, programmed and autonomously executed using the flight mission planning software UgCS
® ver. 4.7.685. Only battery changes required manual interaction.
After the subsurface data collection, an additional flight over the study area was conducted at 100 m altitude using the same UAV but without the ground-truthing payload system. This was done to create one georeferenced orthomosaic that could be used to test the potential of the obtained underwater imagery when used as training and validation data for the classification of UAV-derived imagery. Images were taken with the on-board 20 million effective pixels 1-inch CMOS sensor-equipped RGB camera, which has an 84° field of view, 8.8 mm/24 mm focal length, and f. 2.8–11 aperture. A total of 88 single images with dimensions of 150 × 100 m and a Ground Sample Distance (GSD) of 27.41 mm were obtained during the flight. All images were taken with a nadir viewing angle (90°). The image front and side overlaps were set to 75% and flight speed to 3.5 m/s. One pre-programmed flight path was used, which was planned and executed using the flight mission planning software UgCS
® ver. 4.7.685.
Figure 6 illustrates the flight routes of both flight missions, i.e., the low altitude subsurface ground-truth data collection, as well as the high-altitude flight for orthomosaic creation.
3.3. Data Processing
After subsurface data collection, the class labels “seagrass”, “mussels” or “sand” were assigned to each of the obtained 136 videos, based on visual interpretation and expert knowledge. In cases where two or more classes were present in the video, the data point received the label of the dominant class, while the information about the occurrence of additional classes was stored in the sublabel. Sublabels were also assigned when additional ecologically relevant observations were made, such as the occurrence of tunicates or the spatial co-existence of seagrass and mussels.
The location of the geotagged videos was saved as a vector file and combined with the assigned data labels and depth measurements. The images obtained from the high-altitude flight were stitched using the image processing software Agisoft Metashape Professional® ver. 1.7.4.
3.4. Classification with Generated Training and Validation Data
The 136 geotagged and labeled videos were alternating and assigned to one set of training samples (
n = 68) and one set of validation samples (
n = 68). The training samples were used to train a Support Vector Machine (SVM) algorithm within an object-based image analysis (OBIA) framework, using the eCognition developer software ver. 10.1 on a 64-bit operating system, with Intel
® Core™ i9-7900 CPU @ 3.30 GHz and 64 GB RAM. Segmentation algorithm, scale parameter as well as hyperparameter settings of the SVM and feature space were selected, following the OBIA workflow suggested by Thomasberger et al. [
43]. Thus, the multiresolution segmentation algorithm with a scale parameter value of 231 was used to create the image objects. The radial basis function (rbf) kernel was chosen for the SVM, with C and gamma values set to 1000 and 0.0001, respectively. The selected feature space dimension consisted of seven textural gray-level co-occurrence matrix (GLCM) features [
44] (homogeneity, entropy, ang. 2nd moment, mean, correlation, dissimilarity, standard deviation) and eight spectral features (mean red, mean green, mean blue, maximum difference, brightness, standard deviation red, standard deviation green, standard deviation blue).
The validation samples were used to calculate the producer, user and overall accuracy in a confusion error matrix by using the built-in accuracy assessment tool in the eCognition Developer software ver. 10.1. The polygons created in the segmentation process serve as an assessment unit, which is the most appropriate unit for the accuracy assessment of classification using an OBIA approach [
26].
3.5. Interpolation of Point Observations
The interpolation of point-specific depth measurements was performed using the spline interpolation algorithm in ArcGIS Pro, ver. 2.9.2., with a weight value of 20 and considering the 24 nearest input sample points. The interpolation of point-specific class observations was likewise performed using the spline interpolation algorithm in ArcGIS Pro, ver. 2.9.2., with a weight value of 0.1 and considering the 12 nearest input sample points. For comparison, the output of the interpolation was compared to the output of the classification performed using the OBIA approach described in
Section 3.3 by overlaying both maps and calculating the area of agreement and disagreement.
4. Results and Discussion
4.1. Data Collection
All 88 images obtained from the high altitude flight (100 m) could be stitched to an orthomosaic covering 7 ha. Subsurface data in the form of videos and depth measurements were successfully collected with the developed payload system at all 136 preselected sample stations. Simultaneously with the subsurface data collection, low-altitude (5 m) images were taken with the UAV-mounted camera. A comparison of both methods is illustrated in
Figure 7 and illustrates the limitations of using low-altitude imagery for ground-validation purposes in optically complex waters. While the targeted classes could be clearly identified using the underwater imagery, water properties as well as disturbances at the water surface prevented class identification using the low altitude imagery obtained during the data collection for this study.
The total survey time of the subsurface data collection was 1 h and 30 min, divided between 6 flights and including 15 min of time needed for battery changes. Throughout the survey, the camera-sensor cluster never became entangled during subsurface data collection, so the emergency release function did not need to be activated.
Of the 136 point observations, 52 were labeled as “seagrass”, 21 as “mussels” and 63 as “sand”.
Figure 8 shows the orthomosaic with locations of point observations, the distribution of labeled samples and depth measurements, as well as examples of still images from the underwater videos.
Table 1 shows the distribution of samples per class.
A total of 39 of the 136 point observations received sublabels. An example of this can be seen in
Figure 8, where sand and seagrass were visually detected. A manual delineation of the two classes in the still image was used to calculate the % cover, which resulted in 12.5% eelgrass cover and 87.5% sand cover. Consequently, the point observation was attributed to the class label “sand” and an additional sublabel “seagrass”.
4.2. Object-Based Image Analysis with Obtained Training and Validation Samples
The SVM classifier achieved an overall accuracy (OA) of 0.985, in combination with the collected training samples applied in an OBIA approach. The computational time required for the classification was 37 min and 26.3 s, including image segmentation (2 min and 2.3 s), sample creation (6.1 s), classifier training (2 min and 26.5 s) and classifier application (32 min and 51.5 s). The classified orthomosaic is shown in
Figure 9.
Table 2 shows the error matrix based on the collected validation sample set.
The classification resulted in 3.2 ha seagrass cover, 2.7 ha sand and 1.1 ha of mussels. Even though the number of samples that could be collected with the proposed method was limited, the results showed that UAV-based subsurface data could support the classification and validation process of shallow-water benthic habitats. Some visually detected misclassifications were not represented in the error matrix, especially of sand being misclassified as seagrass, which might have resulted from the relatively low number of available validation samples. While it is recommended to compute the appropriate validation sample size needed to create an error matrix for each project individually by using the multinomial distribution function [
45], a general “rule of thumb” suggests the collection of a minimum of 50 samples for each map class [
46]. In order to reach the suggested minimum sample size of 50 per class, the practitioner could add the remaining number of required samples manually, based on expert knowledge and visual inspection of the generated orthomosaic. This exercise was performed and repeated three times in this study, by manually adding 40 validation samples of the class “sand”, 18 samples of the class “mussels” and 24 samples of the class “seagrass”. The resulting OAs ranged from 0.976 over 0.984 to 0.988 and therefore supported the OA resulting from the error matrix based on the UAV-based validation samples only.
4.3. Classification Based on Point Observations
On occasion, environmental conditions above and/or below the water surface did not allow us to obtain UAV-based aerial imagery of submerged habitats of good enough quality needed to create an orthomosaic that covers the whole study area, i.e., preventing us from performing a classification based on UAV-derived aerial imagery. A solution for such “worst case” scenarios was tested by interpolating the 136 georeferenced and labeled point observations obtained with the payload device using the spline interpolation method. The interpolation could only be performed over 5.1 ha of the total 7 ha large study site due to the limitation of the method to the outer edges of the sampling grid. From the 5.1 ha, 2.1 ha were classified as seagrass, 2.4 ha as sand and 0.6 ha as mussels. A comparison of both classification methods, i.e., the interpolation of point observation and the classification based on OBIA (
Section 4.1), showed an agreement of 85.7%. Assuming that the classification output of the OBIA is the one closest to the actual class distribution in the study area, most misclassification of the interpolation method occurred along the class borders and in regions with patchy class distribution when the interpolation method was used.
Figure 10 illustrates the output of the interpolation methods, as well as a comparison of both methods.
The high agreement of 85.7% of both methods indicates that by applying the proposed UAV-based subsurface data collection method, shallow-water benthic habitat mapping is, at the expense of accuracy, possible even in scenarios where conditions do not allow for area-based classification of submerged habitats using aerial imagery. This method of interpolating UAV-based point observations could be especially useful when monitoring eutrophied water bodies with extended periods of low visibility or in high latitude regions, where the weather windows for obtaining good aerial imagery are narrow.
4.4. Interpolation of Depth Measurements
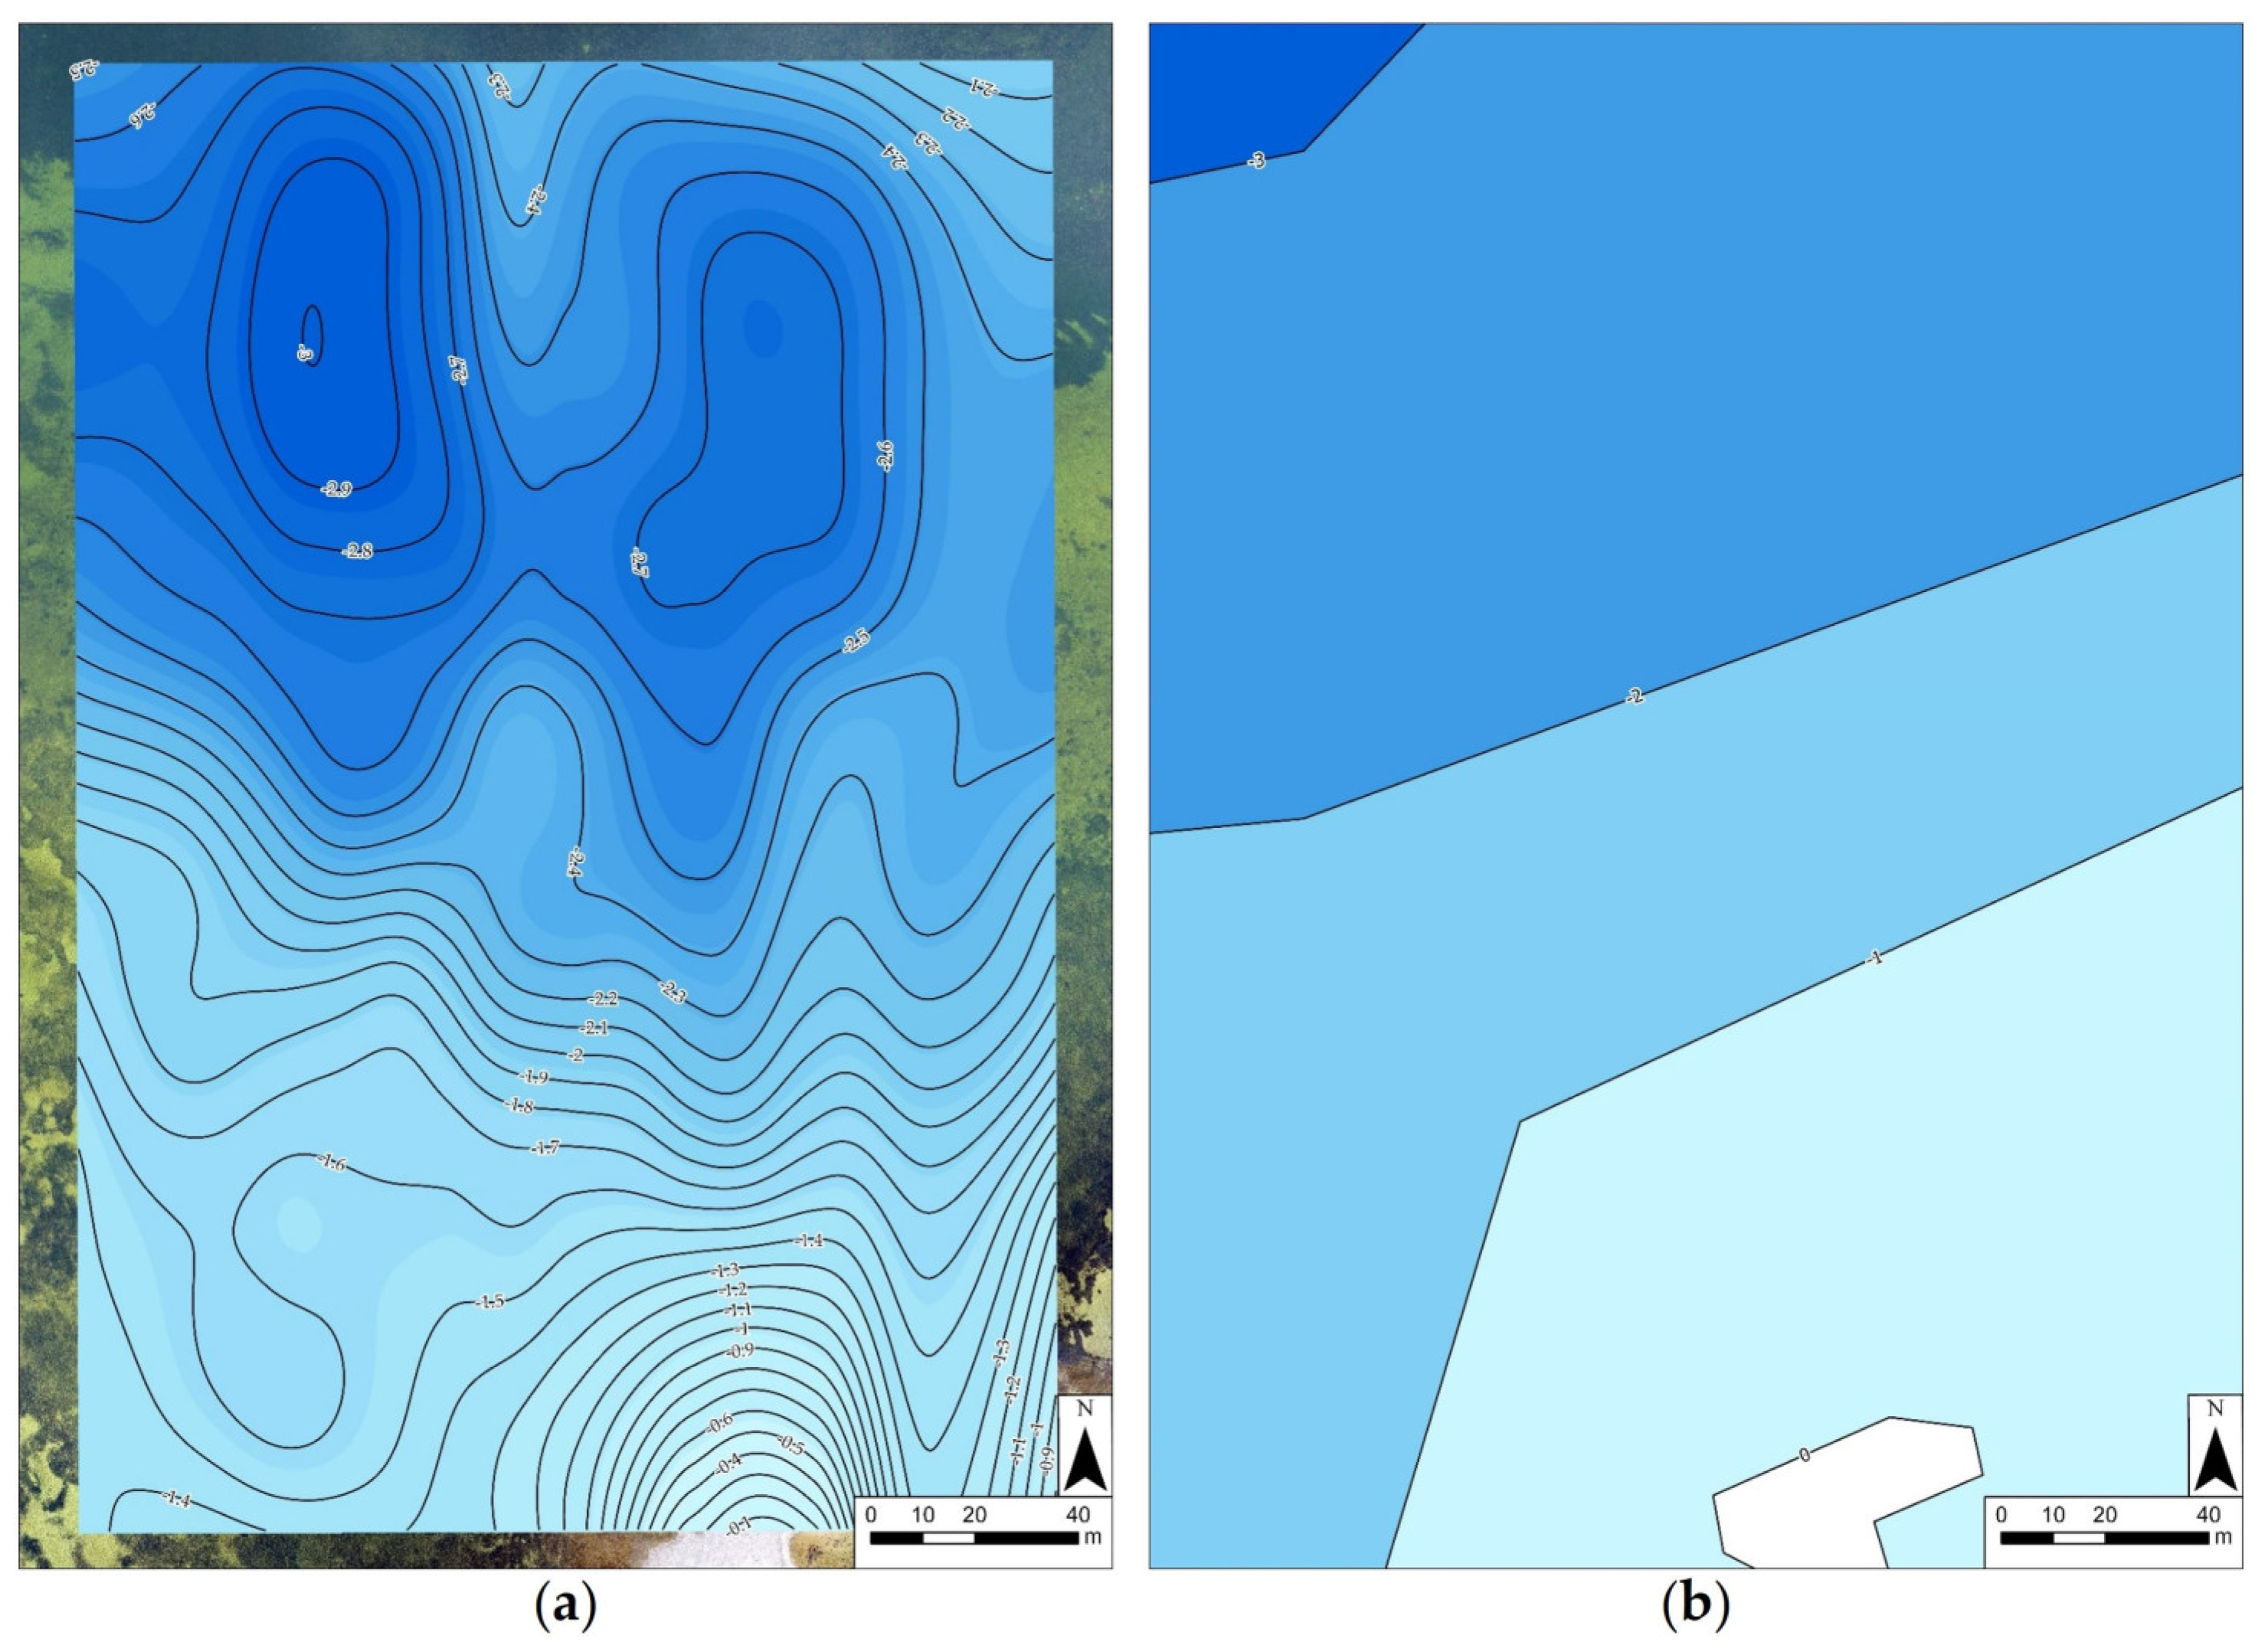
The depth measurements collected by the payload system (
Figure 8) could be interpolated to a detailed bathymetry map of the study area using the spline interpolation method (
Figure 11a).
Shallow-water bathymetry is an important factor that greatly influences environmental processes in the coastal zone and is therefore a crucial input parameter for many benthic habitat assessments [
47] and ecological models [
41], which in turn are used by coastal managers for policy making [
42]. Nevertheless, detailed bathymetry maps are often not available due to the ineffectiveness and limitation of traditional techniques, such as boat surveys, in shallow waters. An example of this is the bathymetry data available for the study area, which shows considerably less detail (
Figure 11b).
Promising UAV-based solutions involving bathymetry inversion techniques [
48] and towed tethered sonar systems [
35,
39] have recently been developed to address the issue of bathymetric data deficiency in shallow waters. While these methods can provide data of higher accuracy compared to the interpolation of point measurements, they are less user-friendly than the developed payload system. For instance, the necessary radiometric resolution needed for inversion techniques requires hyperspectral imagery [
49,
50] or at least multispectral imagery [
48,
51], which increases survey costs due to the advanced sensors needed. By relying on the bottom reflectance of multiple bands in the visible light spectrum, this method is also restricted to waters with sufficient transparency and known bottom types [
48,
49,
50]. Additional steps in the monitoring workflow, such as radiometric calibration, the recording of end-member seafloor cover spectra, and issues surrounding software availability or algorithm implementation, further complicate the survey mission and often require advanced skills.
The UAV-based towed sonar system [
35,
39] is another recently developed method used for shallow-water bathymetry mapping, which consists of a floating sonar unit that is dragged by a UAV via a tether. While providing preliminary but promising results, relative configurations of UAV and sonar units as well as delayed dynamics of the towed system have to be taken into consideration by computing and incorporating the displacement into the planning and control algorithm [
35,
39].
The proposed UAV-based subsurface data collection method is an alternative low-tech solution for bathymetry mapping with an easy data collection workflow that can be used for a multitude of survey missions such as sediment mobility studies or, when used in combination with the obtained underwater imagery, for the detection of habitats and species depth limits. Furthermore, the created bathymetry layer can be incorporated into object-based image analysis as an addition to the spectral information derived from the orthomosaic, potentially enhancing the accuracy of automatic habitat classification [
52].
4.5. Ecological Detail
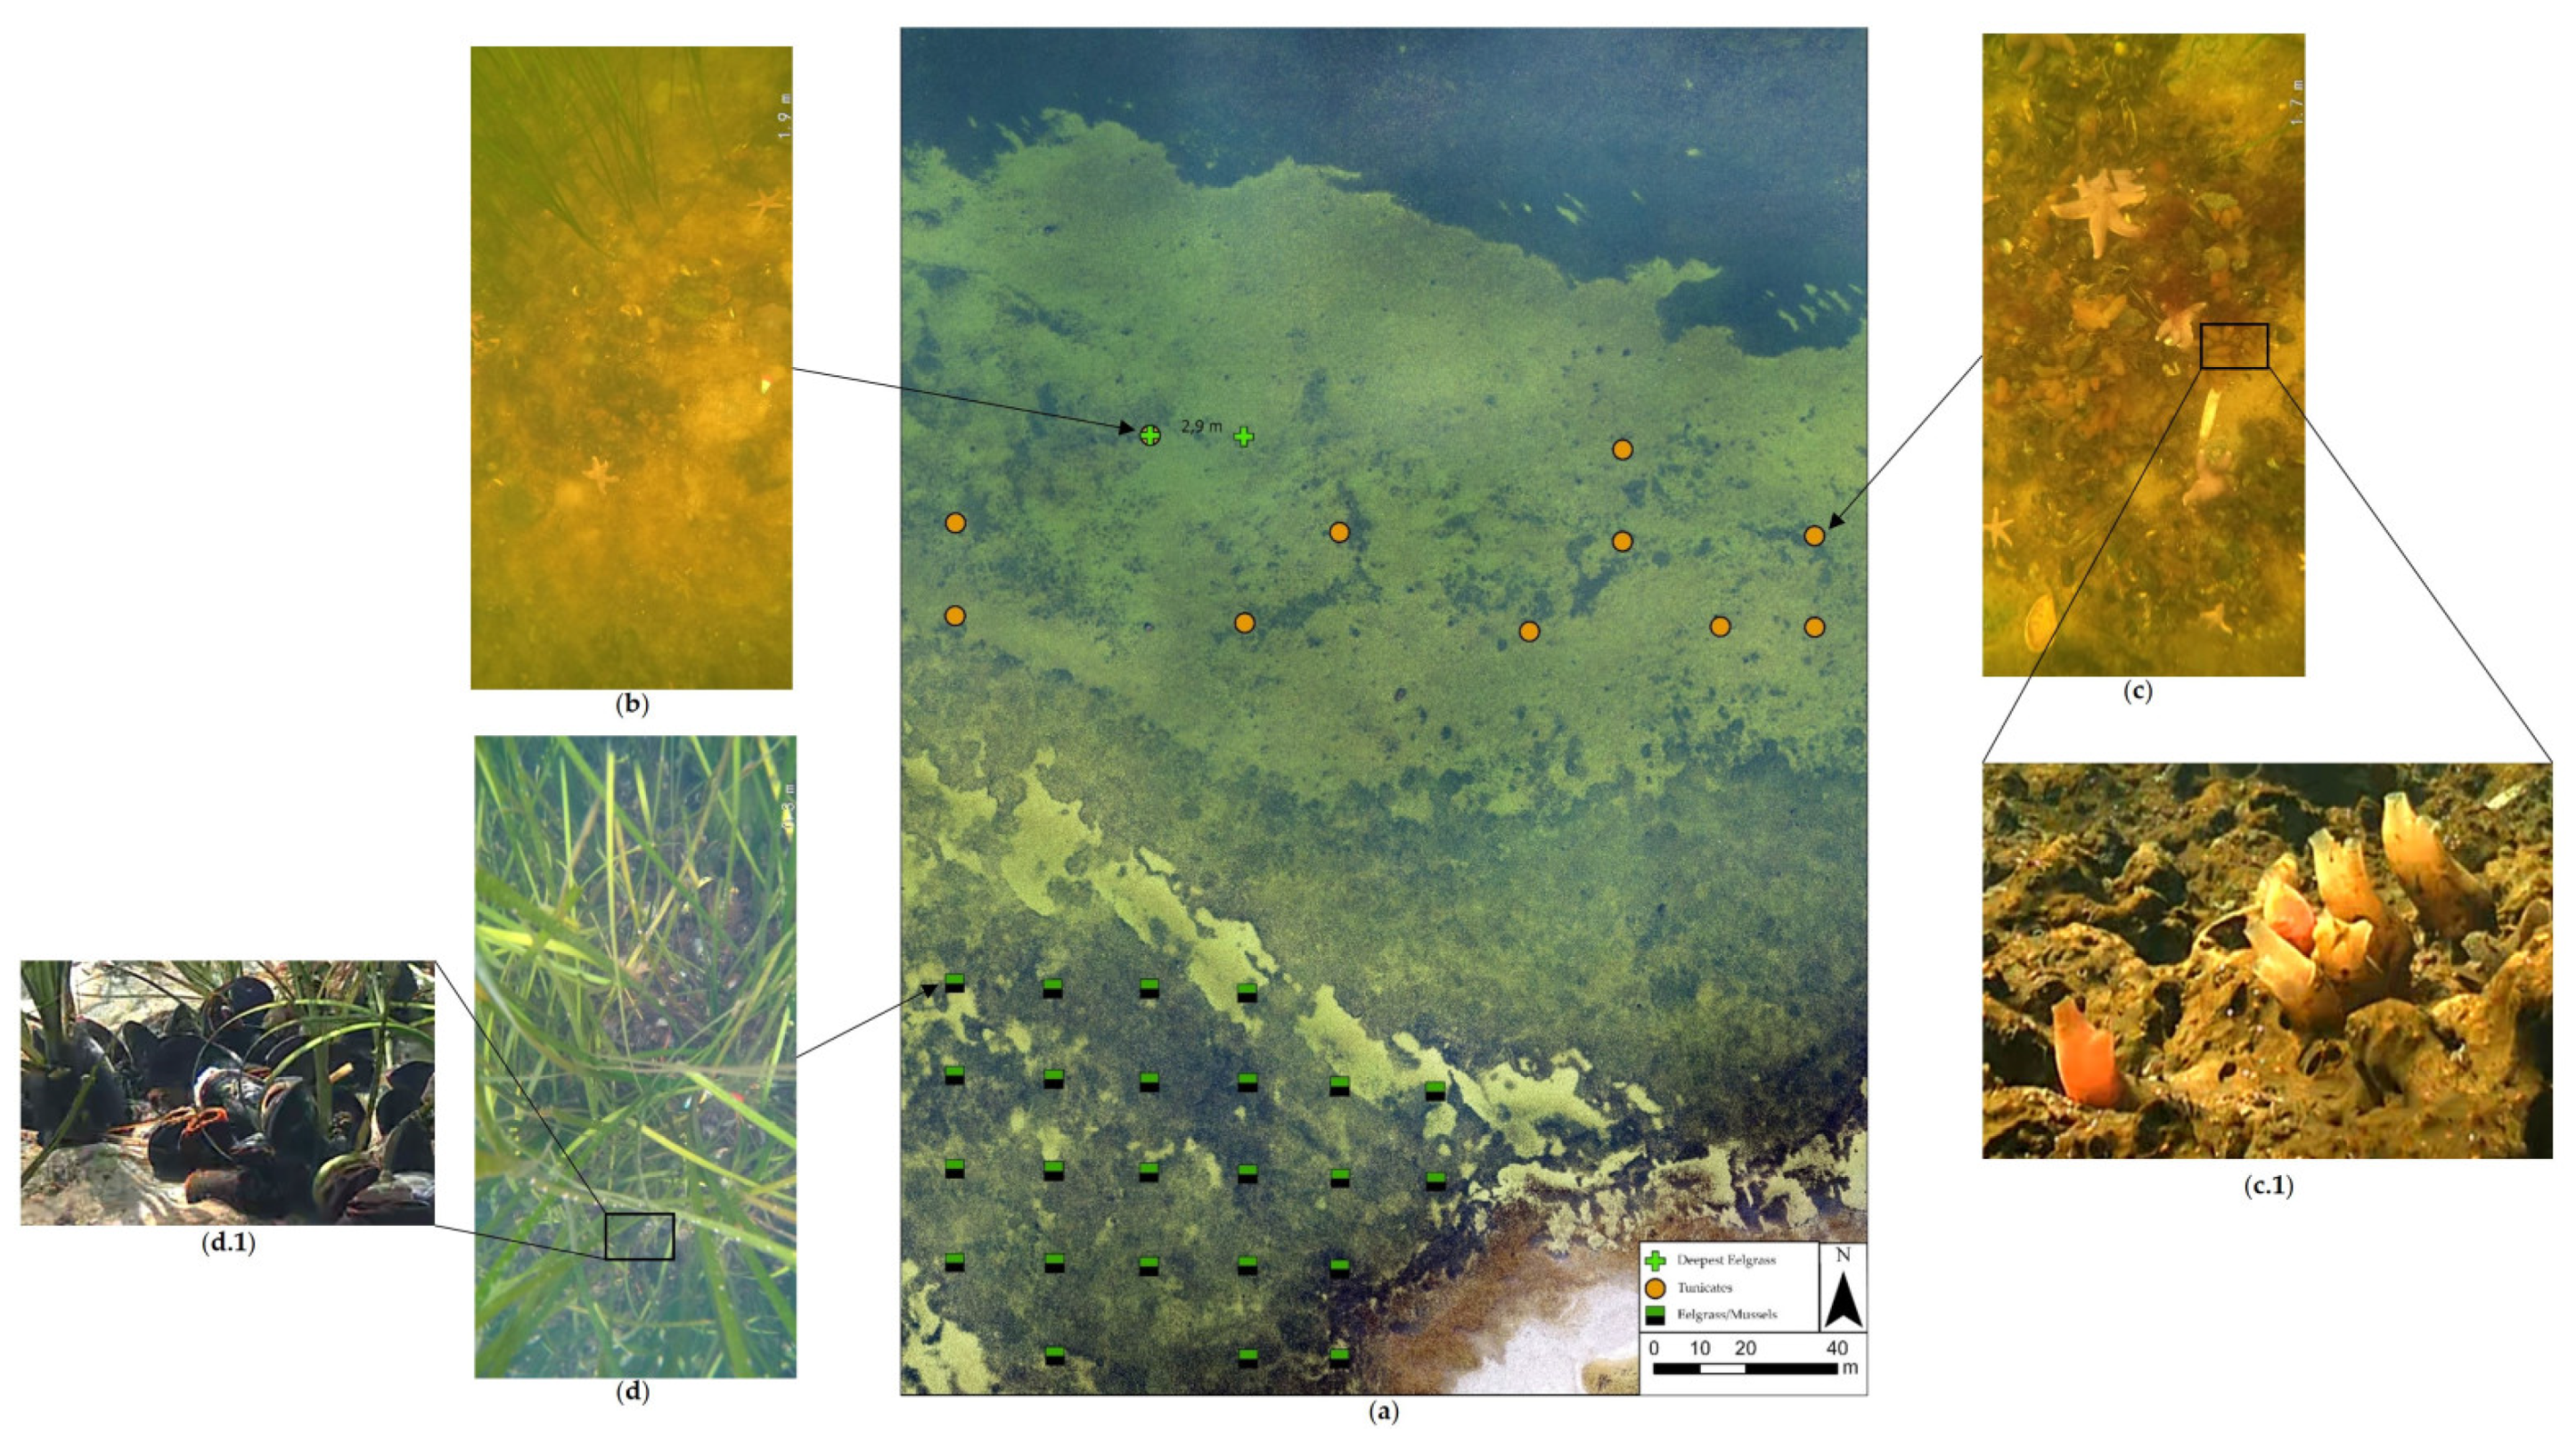
The potential of enhancing the UAV-derived dataset with more ecological information than the detection of the classes (i.e., “seagrass”, mussels” and “sand”) was tested by identifying and isolating the point observations with common sublabels. These were (1) the occurrence of tunicates, (2) a spatial co-existence of mussels and seagrass as well as (3) the occurrence of seagrass below 2 m depth. By isolating those point observations, specific patterns and details could be observed, which were not possible to detect from imagery obtained during UAV flight at 100 m altitude. These were (1) the exclusive occurrence of tunicates within a band of approximately 50 m in width at depths between 2.3 and 2.9 m, which aggregated around small patches of hard surfaces (mostly shells) on a sandy bottom (
Figure 12c), (2) a spatial co-existence of mussels and seagrass in the south-western region of the study site at depths between 1.2 and 1.7 m (
Figure 12d) and (3) the deepest growing seagrass at 2.9 m (
Figure 12b). The latter observation corresponded with the observations made during the vessel-based video monitoring conducted in the study area in May 2022, where the deepest seagrass was located at a 3 m depth [
42].
Figure 12 highlights the locations of the point observations with common sublabels.
While the sublabels chosen for this study served as examples, it was shown that the developed payload system could be used to address tasks that go beyond the mapping and monitoring of the most dominant habitats. For example, studies conducted to investigate seagrass health status [
53], coverage [
54], density [
55] or species composition [
56] in optically deep waters, as well as the ecological impact of invasive species [
57], could benefit from the proposed method by increasing the number of point observations while decreasing the need for diver surveys and other time, labor and cost intensive in-water monitoring methods. The ability to provide reliable information about the depth limit of seagrasses is another feature that has the potential to increase the efficiency of many monitoring campaigns if the proposed method of UAV-based subsurface data collection is applied. The depth limit of seagrasses is an important indicator for water quality [
28] and subject to reoccurring monitoring, currently only conducted using diver, vessel-based video and echo-sounding techniques [
10].
5. Limitations
The properties of the water column during the conducted field work allowed for a clear identification of the targeted classes from the obtained underwater videos. The automatic depth color correction of the applied underwater camera also helped to increase the contrast in the obtained imagery. However, higher turbidity levels or low light conditions could potentially adversely affect the quality of the data to such an extent that class discrimination becomes difficult or even impossible. On the other hand, all underwater videos could be used for further analysis, even though the data collection was performed in a eutrophied water body with high nutrient loads, highly organic sediments and low light conditions, which speaks for the method’s robustness against turbid and dark conditions. Alternatively, the distance between the underwater camera and the substrate could be minimized or additional light sources added to the set up.
The maximum operational depth of the developed payload system is another limitation that needs to be taken into consideration. While the lengths of the nylon string with the attached underwater camera vehicle can theoretically have any user-defined length, the authors suggest limiting the application to depths of a maximum of 10 m due to practicability reasons, which would require a nylon string length of 20 m with the proposed set up. When data need to be collected at greater depth, a line-spool vehicle is suggested instead of a free hanging camera vehicle.
6. Future Work
The presented payload system is a low-tech, inexpensive and easily applied lightweight tool, developed with the aim of exploring potential areas of application in shallow-water monitoring campaigns. While the results of this study showed promising results for all tested applications, some adjustments and recommendations for future work are given.
When upscaling the method, it is suggested, for example, to make use of a larger UAV platform. The limited flight time per battery of the consumer-grade, low-weight quadcopter used in this study required an interruption of the survey mission every 15 min, which roughly translates to 20 sample points covered per battery. A hexacopter model, such as the DJI
® Matrice 600, not only provides longer flight times of approximately 35 min, but also comes with a higher payload capacity. The latter would allow for the mount of more advanced camera systems, additional loggers (e.g., water quality measurement systems [
36], temperature profiling systems [
38] or water samplers [
33,
34,
58,
59,
60,
61]), and a line spool, which would eliminate the need for lowering the UAV flight altitude in order to submerge the camera-logger cluster.
A life-feed from the underwater camera to the UAV pilot would allow for adaptive manual flight adjustment based on the observations made in real time.
Of the entire data processing workflow, labeling the obtained point observation was the most time- and labor-intensive step. Methods of automatic classification of shallow water habitats from unlabeled video recordings have been developed and tested, showing promising results [
62,
63]. It is therefore suggested to integrate such methods into the workflow if the proposed collection of UAV-based subsurface data is performed on a larger scale.
On-board real-time computation and instant classification combined with direct communication between the UAV and the underwater camera system could further increase the efficiency of the survey mission by supporting an intelligent dynamic flight path adaptation and sample point distribution based on the observations made. This would be especially useful if the survey focuses on a specific depth or habitat type, such as a seagrass or mussel bed. Once the underwater camera stops detecting the habitat of interest in one direction or records a depth above or below a preset value, the flight path can automatically be adjusted to encircle the area of interest while saving valuable survey time, increasing the amount of class-specific point observations and reducing the amount of noise in the collected data set. This approach of dynamic and intelligent autonomous flight navigation and data collection has been tested in many applications [
64,
65,
66,
67] and could likewise increase the efficiency of area-based monitoring missions by, for example, limiting the data collection to areas where the UAV mounted sensor still receives useful information and at the same time indicating where subsurface data collection is required.
7. Conclusions
The developed UAV-based subsurface data collection tool is a novel method in terms of the multipurpose data it provides in a relatively labor- and cost-efficient way. An area of 7 ha was surveyed in 1 h and 30 min. Quickly mounted in the field after an area-based monitoring mission, the tool autonomously collected georeferenced point observations in the form of underwater videos and depth measurements. The obtained subsurface data was successfully used as training and validation data for the object-based classification of aerial imagery, the creation of a class distribution map based on the interpolation of point observations, the creation of a bathymetry map and the detection of additional potentially relevant information such as the seagrass depth limit. The results of the study show that the application of a low-tech tool already has great potential for adding valuable information to shallow-water monitoring campaigns. This should encourage researchers to apply, further develop, upscale and adapt the method to their specific needs by, for example, increasing the platform size, adding additional loggers and incorporating intelligent vehicles capable of real-time computation and dynamic flight path adaptation.
Author Contributions
Conceptualization, A.T. and M.M.N.; methodology, A.T.; validation, A.T. and M.M.N.; formal analysis, A.T.; investigation, A.T. and M.M.N.; resources, M.M.N.; data curation, A.T.; writing—original draft preparation, A.T.; writing—review and editing, A.T. and M.M.N.; visualization, A.T.; supervision, M.M.N.; project administration, M.M.N.; funding acquisition, M.M.N. All authors have read and agreed to the published version of the manuscript.
Funding
This research was conducted as part of the project “Development of tools for economically efficient mapping of seagrass in Natura 2000 areas” with journal no. 33113-B-19-141, funded by the European Maritime and Fisheries Fund and the Danish Fisheries Agency.
Data Availability Statement
Conflicts of Interest
The authors declare no conflict of interest. The funders had no role in the design of the study; in the collection, analyses, or interpretation of data; in the writing of the manuscript; or in the decision to publish the results.
References
- Anderson, K.; Gaston, K.J. Lightweight Unmanned Aerial Vehicles Will Revolutionize Spatial Ecology. Front. Ecol. Environ. 2013, 11, 138–146. [Google Scholar] [CrossRef] [PubMed]
- Manfreda, S.; McCabe, M.F.; Miller, P.E.; Lucas, R.; Madrigal, V.P.; Mallinis, G.; Ben Dor, E.; Helman, D.; Estes, L.; Ciraolo, G.; et al. On the Use of Unmanned Aerial Systems for Environmental Monitoring. Remote Sens. 2018, 10, 641. [Google Scholar] [CrossRef]
- Svane, N.; Lange, T.; Egemose, S.; Dalby, O.; Thomasberger, A.; Flindt, M.R. Unoccupied Aerial Vehicle-Assisted Monitoring of Benthic Vegetation in the Coastal Zone Enhances the Quality of Ecological Data. Prog. Phys. Geogr. 2022, 46, 232–249. [Google Scholar] [CrossRef]
- Hamad, I.Y.; Staehr, P.A.U.; Rasmussen, M.B.; Sheikh, M. Drone-Based Characterization of Seagrass Habitats in the Tropical Waters of Zanzibar. Remote Sens. 2022, 14, 680. [Google Scholar] [CrossRef]
- Nahirnick, N.K.; Reshitnyk, L.; Campbell, M.; Hessing-Lewis, M.; Costa, M.; Yakimishyn, J.; Lee, L. Mapping with Confidence; Delineating Seagrass Habitats Using Unoccupied Aerial Systems (UAS). Remote Sens. Ecol. Conserv. 2019, 5, 121–135. [Google Scholar] [CrossRef]
- Ridge, J.T.; Johnston, D.W. Unoccupied Aircraft Systems (UAS) for Marine Ecosystem Restoration. Front. Mar. Sci. 2020, 7, 438. [Google Scholar] [CrossRef]
- Oleksyn, S.; Tosetto, L.; Raoult, V.; Joyce, K.E.; Williamson, J.E. Going Batty: The Challenges and Opportunities of Using Drones to Monitor the Behaviour and Habitat Use of Rays. Drones 2021, 5, 12. [Google Scholar] [CrossRef]
- Kabiri, K.; Rezai, H.; Moradi, M. A Drone-Based Method for Mapping the Coral Reefs in the Shallow Coastal Waters–Case Study: Kish Island, Persian Gulf. Earth Sci. Inform. 2020, 13, 1265–1274. [Google Scholar] [CrossRef]
- Almeida, S.; Radeta, M.; Kataoka, T.; Canning-Clode, J.; Pessanha Pais, M.; Freitas, R.; Monteiro, J.G. Designing Unmanned Aerial Survey Monitoring Program to Assess Floating Litter Contamination. Remote Sens. 2023, 15, 84. [Google Scholar] [CrossRef]
- Lønborg, C.; Thomasberger, A.; Stæhr, P.A.U.; Stockmarr, A.; Sengupta, S.; Rasmussen, M.L.; Nielsen, L.T.; Hansen, L.B.; Timmermann, K. Submerged Aquatic Vegetation: Overview of Monitoring Techniques Used for the Identification and Determination of Spatial Distribution in European Coastal Waters. Integr. Environ. Assess. Manag. 2022, 18, 892–908. [Google Scholar] [CrossRef] [PubMed]
- Casella, E.; Collin, A.; Harris, D.; Ferse, S.; Bejarano, S.; Parravicini, V.; Hench, J.L.; Rovere, A. Mapping Coral Reefs Using Consumer-Grade Drones and Structure from Motion Photogrammetry Techniques. Coral Reefs 2017, 36, 269–275. [Google Scholar] [CrossRef]
- Peterson, E.A.; Carne, L.; Balderamos, J.; Faux, V.; Gleason, A.; Schill, S.R. The Use of Unoccupied Aerial Systems (UASs) for Quantifying Shallow Coral Reef Restoration Success in Belize. Drones 2023, 7, 221. [Google Scholar] [CrossRef]
- Giles, A.B.; Ren, K.; Davies, J.E.; Abrego, D.; Kelaher, B. Combining Drones and Deep Learning to Automate Coral Reef Assessment with RGB Imagery. Remote Sens. 2023, 15, 2238. [Google Scholar] [CrossRef]
- Ventura, D.; Grosso, L.; Pensa, D.; Casoli, E.; Mancini, G.; Valente, T.; Scardi, M.; Rakaj, A. Coastal Benthic Habitat Mapping and Monitoring by Integrating Aerial and Water Surface Low-Cost Drones. Front. Mar. Sci. 2023, 9, 1096594. [Google Scholar] [CrossRef]
- Price, D.M.; Felgate, S.L.; Huvenne, V.A.I.; Strong, J.; Carpenter, S.; Barry, C.; Lichtschlag, A.; Sanders, R.; Carrias, A.; Young, A.; et al. Quantifying the Intra-Habitat Variation of Seagrass Beds with Unoccupied Aerial Vehicles (UAVs). Remote Sens. 2022, 14, 480. [Google Scholar] [CrossRef]
- Kellaris, A.; Gil, A.; Faria, J.; Amaral, R.; Moreu-Badia, I.; Neto, A.; Yesson, C. Using Low-Cost Drones to Monitor Heterogeneous Submerged Seaweed Habitats: A Case Study in the Azores. Aquat. Conserv. Mar. Freshw. Ecosyst. 2019, 29, 1909–1922. [Google Scholar] [CrossRef]
- Flynn, K.F.; Chapra, S.C. Remote Sensing of Submerged Aquatic Vegetation in a Shallow Non-Turbid River Using an Unmanned Aerial Vehicle. Remote Sens. 2014, 6, 12815–12836. [Google Scholar] [CrossRef]
- Kislik, C.; Genzoli, L.; Lyons, A.; Kelly, M. Application of UAV Imagery to Detect and Quantify Submerged Filamentous Algae and Rooted Macrophytes in a Non-Wadeable River. Remote Sens. 2020, 12, 3332. [Google Scholar] [CrossRef]
- Brooks, C.; Grimm, A.; Marcarelli, A.M.; Marion, N.P.; Shuchman, R.; Sayers, M. Classification of Eurasian Watermilfoil (Myriophyllum spicatum) Using Drone-Enabled Multispectral Imagery Analysis. Remote Sens. 2022, 14, 2336. [Google Scholar] [CrossRef]
- Chabot, D.; Dillon, C.; Shemrock, A.; Weissflog, N.; Sager, E.P.S. An Object-Based Image Analysis Workflow for Monitoring Shallow-Water Aquatic Vegetation in Multispectral Drone Imagery. ISPRS Int. J. Geo-Inf. 2018, 7, 294. [Google Scholar] [CrossRef]
- Monteiro, J.G.; Jiménez, J.L.; Gizzi, F.; Přikryl, P.; Lefcheck, J.S.; Santos, R.S.; Canning-Clode, J. Novel Approach to Enhance Coastal Habitat and Biotope Mapping with Drone Aerial Imagery Analysis. Sci. Rep. 2021, 11, 574. [Google Scholar] [CrossRef] [PubMed]
- Woodget, A.S.; Austrums, R.; Maddock, I.P.; Habit, E. Drones and Digital Photogrammetry: From Classifications to Continuums for Monitoring River Habitat and Hydromorphology. Wiley Interdiscip. Rev. Water 2017, 4, e1222. [Google Scholar] [CrossRef]
- Nababan, B.; Mastu, L.O.K.; Idris, N.H.; Panjaitan, J.P. Shallow-Water Benthic Habitat Mapping Using Drone with Object Based Image Analyses. Remote Sens. 2021, 13, 4452. [Google Scholar] [CrossRef]
- Doukari, M.; Katsanevakis, S.; Soulakellis, N.; Topouzelis, K. The Effect of Environmental Conditions on the Quality of UAS Orthophoto-Maps in the Coastal Environment. ISPRS Int. J. Geo-Inf. 2021, 10, 18. [Google Scholar] [CrossRef]
- Doukari, M.; Batsaris, M.; Papakonstantinou, A.; Topouzelis, K. A Protocol for Aerial Survey in Coastal Areas Using UAS. Remote Sens. 2019, 11, 1913. [Google Scholar] [CrossRef]
- Congalton, R.G.; Green, K. Assessing the Accuracy of Remotely Sensed Data: Principles and Practices. Available online: https://books.google.dk/books?hl=en&lr=&id=yTmDDwAAQBAJ&oi=fnd&pg=PP1&dq=assessing+the+Accuracy+of+remotely+sensed+data&ots=1H9Zbtlffe&sig=iMImroJKLvFN5IvJ2_JtjCSc764&redir_esc=y#v=onepage&q=assessing%20the%20Accuracy%20of%20remotely%20sensed%20data&f=false (accessed on 16 March 2023).
- Rende, S.F.; Bosman, A.; Menna, F.; Lagudi, A.; Bruno, F.; Severino, U.; Montefalcone, M.; Irving, A.D.; Raimondi, V.; Calvo, S.; et al. Assessing Seagrass Restoration Actions through a Micro-Bathymetry Survey Approach (Italy, Mediterranean Sea). Water 2022, 14, 1285. [Google Scholar] [CrossRef]
- Krause-Jensen, D.; Greve, T.M.; Nielsen, K. Eelgrass as a Bioindicator under the European Water Framework Directive. Water Resour. Manag. 2005, 19, 63–75. [Google Scholar] [CrossRef]
- Marbà, N.; Krause-Jensen, D.; Alcoverro, T.; Birk, S.; Pedersen, A.; Neto, J.M.; Orfanidis, S.; Garmendia, J.M.; Muxika, I.; Borja, A.; et al. Diversity of European Seagrass Indicators: Patterns within and across Regions. Hydrobiologia 2013, 704, 265–278. [Google Scholar] [CrossRef]
- Krause-Jensen, D.; Sagert, S.; Schubert, H.; Boström, C. Empirical Relationships Linking Distribution and Abundance of Marine Vegetation to Eutrophication. Ecol. Indic. 2008, 8, 515–529. [Google Scholar] [CrossRef]
- Rasmussen, B.; Krause-Jensen, D.; Balsby, T.J.S. Udvikling Og Test Af Dronemetode Og Interkalibrering Af Eksisterende Metode Til Undersøgelse Af Ålegræs Og Anden Vegetation På Blød Bund; Technical Report nr. 174; Aarhus University, DCE—Danish Centre for Environment and Energy; 2020; p. 58. Available online: http://dce2.au.dk/pub/TR174.pdf (accessed on 16 March 2023).
- Stæhr, P.A.; Groom, G.B.; Krause-Jensen, D.; Hansen, L.B.; Huber, S.; Ø Jensen, L.; Rasmussen, M.B.; Upadhyay, S.; Ørberg, S.B. Brug Af Remote Sensing Teknologier Til Opgørelse Af Klorofyl-a Koncentrationer Og Vegetationsudbredels; Technical Report nr. 139; Aarhus University, DCE—Danish Centre for Environment and Energy; 2019; 62p. Available online: http://dce2.au.dk/pub/TR139.pdf (accessed on 16 March 2023).
- Terada, A.; Morita, Y.; Hashimoto, T.; Mori, T.; Ohba, T.; Yaguchi, M.; Kanda, W. Water Sampling Using a Drone at Yugama Crater Lake, Kusatsu-Shirane Volcano, Japan. Earth Planets Space 2018, 70, 64. [Google Scholar] [CrossRef]
- Benson, J.; Hanlon, R.; Seifried, T.M.; Baloh, P.; Powers, C.W.; Grothe, H.; Schmale, D.G. Microorganisms Collected from the Surface of Freshwater Lakes Using a Drone Water Sampling System (DOWSE). Water 2019, 11, 157. [Google Scholar] [CrossRef]
- Bandini, F.; Olesen, D.; Jakobsen, J.; Kittel, C.M.M.; Wang, S.; Garcia, M.; Bauer-Gottwein, P. Technical Note: Bathymetry Observations of Inland Water Bodies Using a Tethered Single-Beam Sonar Controlled by an Unmanned Aerial Vehicle. Hydrol. Earth Syst. Sci. 2018, 22, 4165–4181. [Google Scholar] [CrossRef]
- Koparan, C.; Koc, A.B.; Privette, C.V.; Sawyer, C.B. In Situ Water Quality Measurements Using an Unmanned Aerial Vehicle (UAV) System. Water 2018, 10, 264. [Google Scholar] [CrossRef]
- Koparan, C.; Koc, A.B.; Privette, C.V.; Sawyer, C.B. Autonomous in Situ Measurements of Noncontaminant Water Quality Indicators and Sample Collection with a UAV. Water 2019, 11, 604. [Google Scholar] [CrossRef]
- Koparan, C.; Koc, A.B.; Sawyer, C.; Privette, C. Temperature Profiling of Waterbodies with a UAV-Integrated Sensor Subsystem. Drones 2020, 4, 35. [Google Scholar] [CrossRef]
- Diaz, A.L.; Ortega, A.E.; Tingle, H.; Pulido, A.; Cordero, O.; Nelson, M.; Cocoves, N.E.; Shin, J.; Carthy, R.R.; Wilkinson, B.E.; et al. The Bathy-Drone: An Autonomous Unmanned Drone-Tethered Sonar System. Drones 2022, 6, 220. [Google Scholar] [CrossRef]
- Graham, C.T.; O’Connor, I.; Broderick, L.; Broderick, M.; Jensen, O.; Lally, H.T. Drones Can Reliably, Accurately and with High Levels of Precision, Collect Large Volume Water Samples and Physio-Chemical Data from Lakes. Sci. Total Environ. 2022, 824, 153875. [Google Scholar] [CrossRef]
- Sanim, K.R.I.; Kalaitzakis, M.; Kosaraju, B.; Kitzhaber, Z.; English, C.; Vitzilaios, N.; Myrick, M.; Hodgson, M.; Richardson, T. Development of an Aerial Drone System for Water Analysis and Sampling. In Proceedings of the 2022 International Conference on Unmanned Aircraft Systems, ICUAS 2022, Dubrovnik, Croatia, 21–24 June 2022. [Google Scholar] [CrossRef]
- Castendyk, D.; Voorhis, J.; Kucera, B. A Validated Method for Pit Lake Water Sampling Using Aerial Drones and Sampling Devices. Mine Water Environ. 2020, 39, 440–454. [Google Scholar] [CrossRef]
- Hanlon, R.; Jacquemin, S.J.; Birbeck, J.A.; Westrick, J.A.; Harb, C.; Gruszewski, H.; Ault, A.P.; Scott, D.; Foroutan, H.; Ross, S.D.; et al. Drone-Based Water Sampling and Characterization of Three Freshwater Harmful Algal Blooms in the United States. Front. Remote Sens. 2022, 3, 80. [Google Scholar] [CrossRef]
- Borrelli, M.; Smith, T.L.; Mague, S.T. Vessel-Based, Shallow Water Mapping with a Phase-Measuring Sidescan Sonar. Estuaries Coasts 2021, 45, 961–979. [Google Scholar] [CrossRef]
- Canal-Vergés, P.; Petersen, J.K.; Rasmussen, E.K.; Erichsen, A.; Flindt, M.R. Validating GIS Tool to Assess Eelgrass Potential Recovery in the Limfjorden (Denmark). Ecol. Model. 2016, 24, 135–148. [Google Scholar] [CrossRef]
- Nielsen, P.; Nielsen, M.M.; McLaverty, C.; Kristensen, K.; Geitner, K.; Olsen, J.; Saurel, C.; Petersen, J.K. Management of Bivalve Fisheries in Marine Protected Areas. Mar. Policy 2021, 124, 104357. [Google Scholar] [CrossRef]
- Thomasberger, A.; Nielsen, M.M.; Flindt, M.R.; Pawar, S.; Svane, N. Comparative Assessment of Five Machine Learning Algorithms for Supervised Object-Based Classification of Submerged Seagrass Beds Using High-Resolution UAS Imagery. Remote Sens. 2023, 15, 3600. [Google Scholar] [CrossRef]
- Haralick, R.M.; Dinstein, I.; Shanmugam, K. Textural Features for Image Classification. IEEE Trans. Syst. Man Cybern. 1973, 3, 610–621. [Google Scholar] [CrossRef]
- Tortora, R.D. The Teacher’s Corner: A Note on Sample Size Estimation for Multinomial Populations. Am. Stat. 1978, 32, 100–102. [Google Scholar] [CrossRef]
- Congalton, R.G. A Comparison of Sampling Schemes Used in Generating Error Matrices for Assessing the Accuracy of Maps Generated from Remotely Sensed Data. Photogramm. Eng. Remote Sens. 1988, 54, 1249. [Google Scholar]
- Diaz, R.J.; Solan, M.; Valente, R.M. A Review of Approaches for Classifying Benthic Habitats and Evaluating Habitat Quality. J. Environ. Manag. 2004, 73, 165–181. [Google Scholar] [CrossRef]
- Alevizos, E.; Oikonomou, D.; Argyriou, A.V.; Alexakis, D.D. Fusion of Drone-Based RGB and Multi-Spectral Imagery for Shallow Water Bathymetry Inversion. Remote Sens. 2022, 14, 1127. [Google Scholar] [CrossRef]
- Kwon, S.; Gwon, Y.; Kim, D.; Seo, I.W.; You, H. Unsupervised Classification of Riverbed Types for Bathymetry Mapping in Shallow Rivers Using UAV-Based Hyperspectral Imagery. Remote Sens. 2023, 15, 2803. [Google Scholar] [CrossRef]
- Gwon, Y.; Kwon, S.; Kim, D.; Seo, I.W.; You, H. Estimation of Shallow Stream Bathymetry under Varying Suspended Sediment Concentrations and Compositions Using Hyperspectral Imagery. Geomorphology 2023, 433, 108722. [Google Scholar] [CrossRef]
- Alevizos, E.; Alexakis, D.D. Monitoring Short-Term Morphobathymetric Change of Nearshore Seafloor Using Drone-Based Multispectral Imagery. Remote Sens. 2022, 14, 6035. [Google Scholar] [CrossRef]
- Nieuwenhuis, B.O.; Marchese, F.; Casartelli, M.; Sabino, A.; van der Meij, S.E.T.; Benzoni, F. Integrating a UAV-Derived DEM in Object-Based Image Analysis Increases Habitat Classification Accuracy on Coral Reefs. Remote Sens. 2022, 14, 5017. [Google Scholar] [CrossRef]
- Graham, O.J.; Stephens, T.; Rappazzo, B.; Klohmann, C.; Dayal, S.; Adamczyk, E.M.; Olson, A.; Hessing-Lewis, M.; Eisenlord, M.; Yang, B.; et al. Deeper Habitats and Cooler Temperatures Moderate a Climate-Driven Seagrass Disease. Philos. Trans. R. Soc. B Biol. Sci. 2023, 378, 20220016. [Google Scholar] [CrossRef]
- Reus, G.; Möller, T.; Jager, J.; Schultz, S.T.; Kruschel, C.; Hasenauer, J.; Wolff, V.; Fricke-Neuderth, K. Looking for Seagrass: Deep Learning for Visual Coverage Estimation. In Proceedings of the 2018 OCEANS-MTS/IEEE Kobe Techno-Oceans, OCEANS-Kobe 2018, Kobe, Japan, 28–31 May 2018. [Google Scholar] [CrossRef]
- Langlois, L.A.; Collier, C.J.; McKenzie, L.J. Subtidal Seagrass Detector: Development of a Deep Learning Seagrass Detection and Classification Model for Seagrass Presence and Density in Diverse Habitats from Underwater Photoquadrats. Front. Mar. Sci. 2023, 10, 1197695. [Google Scholar] [CrossRef]
- Mohamed, H.; Nadaoka, K.; Nakamura, T. Semiautomated Mapping of Benthic Habitats and Seagrass Species Using a Convolutional Neural Network Framework in Shallow Water Environments. Remote Sens. 2020, 12, 4002. [Google Scholar] [CrossRef]
- Colarusso, P.; Nelson, E.; Ayvazian, S.; Carman, M.R.; Chintala, M.; Grabbert, S.; Grunden, D. Quantifying the Ecological Impact of Invasive Tunicates to Shallow Coastal Water Systems. Manag. Biol. Invasions 2016, 7, 33–42. [Google Scholar] [CrossRef]
- Sengupta, S.; Ersbøll, B.K.; Stockmarr, A. SeaGrassDetect: A Novel Method for the Detection of Seagrass from Unlabelled Underwater Videos. Ecol. Inform. 2020, 57, 101083. [Google Scholar] [CrossRef]
- Raine, S.; Marchant, R.; Moghadam, P.; Maire, F.; Kettle, B.; Kusy, B. Multi-Species Seagrass Detection and Classification from Underwater Images. In Proceedings of the 2020 Digital Image Computing: Techniques and Applications, DICTA 2020, Melbourne, Australia, 29 November–2 December 2020. [Google Scholar] [CrossRef]
- Pinto, M.F.; Honorio, L.M.; Melo, A.; Marcato, A.L.M. A Robotic Cognitive Architecture for Slope and Dam Inspections. Sensors 2020, 20, 4579. [Google Scholar] [CrossRef]
- Panetsos, F.; Rousseas, P.; Karras, G.; Bechlioulis, C.; Kyriakopoulos, K.J. A Vision-Based Motion Control Framework for Water Quality Monitoring Using an Unmanned Aerial Vehicle. Sustainability 2022, 14, 6502. [Google Scholar] [CrossRef]
- Bukin, O.; Proschenko, D.; Korovetskiy, D.; Chekhlenok, A.; Yurchik, V.; Bukin, I. Development of the Artificial Intelligence and Optical Sensing Methods for Oil Pollution Monitoring of the Sea by Drones. Appl. Sci. 2021, 11, 3642. [Google Scholar] [CrossRef]
- Schedl, D.C.; Kurmi, I.; Bimber, O. An Autonomous Drone for Search and Rescue in Forests Using Airborne Optical Sectioning. Sci. Robot. 2021, 6, eabg1188. [Google Scholar] [CrossRef] [PubMed]
Figure 1.
Payload system attached to a DJI® Phantom 4 RTK. View from left (a) and view from behind (b).
Figure 1.
Payload system attached to a DJI® Phantom 4 RTK. View from left (a) and view from behind (b).
Figure 2.
Close up image of the release system with emergency release mechanism, power supply and receiver. View from above (a) and view from behind (b).
Figure 2.
Close up image of the release system with emergency release mechanism, power supply and receiver. View from above (a) and view from behind (b).
Figure 3.
UAV with underwater camera set up in flight (a) and during data collection (b).
Figure 3.
UAV with underwater camera set up in flight (a) and during data collection (b).
Figure 4.
Study area (a) situated along the southern coast of Lovns Broad in Limfjorden (b), Denmark (c).
Figure 4.
Study area (a) situated along the southern coast of Lovns Broad in Limfjorden (b), Denmark (c).
Figure 5.
Benthic habitats at each 1 m depth interval (1–4 m), obtained from vessel-based video recordings in May 2022.
Figure 5.
Benthic habitats at each 1 m depth interval (1–4 m), obtained from vessel-based video recordings in May 2022.
Figure 6.
Flight routes of both flight missions, i.e., the low altitude subsurface data collection with sample points indicated with orange dots, as well as the following high-altitude flight for orthomosaic creation.
Figure 6.
Flight routes of both flight missions, i.e., the low altitude subsurface data collection with sample points indicated with orange dots, as well as the following high-altitude flight for orthomosaic creation.
Figure 7.
Images of the targeted classes, mussels (a), seagrass (b) and sand (c), obtained by the UAV-mounted camera at 5 m altitude (upper row) and by the underwater camera system (bottom row).
Figure 7.
Images of the targeted classes, mussels (a), seagrass (b) and sand (c), obtained by the UAV-mounted camera at 5 m altitude (upper row) and by the underwater camera system (bottom row).
Figure 8.
Orthomosaic with examples of still images from the obtained underwater videos (a), as well as training and validation samples of the classes “sand” (c,e), “mussels” (b) and “seagrass” (d).
Figure 8.
Orthomosaic with examples of still images from the obtained underwater videos (a), as well as training and validation samples of the classes “sand” (c,e), “mussels” (b) and “seagrass” (d).
Figure 9.
Orthomosaic with enhanced class borders (a); orthomosaic with the classification result of a SVM classifier, trained with samples that were collected with the developed payload system (b).
Figure 9.
Orthomosaic with enhanced class borders (a); orthomosaic with the classification result of a SVM classifier, trained with samples that were collected with the developed payload system (b).
Figure 10.
Interpolation of point observations (a) and comparison with the OBIA method (b).
Figure 10.
Interpolation of point observations (a) and comparison with the OBIA method (b).
Figure 11.
A comparison of the details of the bathymetry maps based on the interpolation of point observations from this study (a) and a general map available for the area by DHI GRAS A/S (b).
Figure 11.
A comparison of the details of the bathymetry maps based on the interpolation of point observations from this study (a) and a general map available for the area by DHI GRAS A/S (b).
Figure 12.
Locations of potentially relevant additional ecological detail in the study area (a): Deepest growing seagrass at 2.9 m (b), aggregations of tunicates (c,c.1), spatial co-existence of mussels and seagrass (d,d.1).
Figure 12.
Locations of potentially relevant additional ecological detail in the study area (a): Deepest growing seagrass at 2.9 m (b), aggregations of tunicates (c,c.1), spatial co-existence of mussels and seagrass (d,d.1).
Table 1.
Distribution of training and validation samples per class.
Table 1.
Distribution of training and validation samples per class.
| | Seagrass | Mussels | Sand | Total |
|---|
| All Samples | 52 | 21 | 63 | 136 |
| Training | 26 | 11 | 31 | 68 |
| Validation | 26 | 10 | 32 | 68 |
Table 2.
Error matrix based on the collected validation sample set.
Table 2.
Error matrix based on the collected validation sample set.
| | Class | Seagrass | Mussels | Sand | Sum |
|---|
| Accuracy | Seagrass | 26 | 1 | 0 | 27 |
| Mussels | 0 | 31 | 0 | 31 |
| Sand | 0 | 0 | 10 | 10 |
| Sum | 26 | 32 | 10 | 68 |
| Producer | 1 | 0.969 | 1 | |
| User | 0.963 | 1 | 1 | |
| Overall | 0.985 | | | |
| KIA | 0.976 | | | |
| Disclaimer/Publisher’s Note: The statements, opinions and data contained in all publications are solely those of the individual author(s) and contributor(s) and not of MDPI and/or the editor(s). MDPI and/or the editor(s) disclaim responsibility for any injury to people or property resulting from any ideas, methods, instructions or products referred to in the content. |
© 2023 by the authors. Licensee MDPI, Basel, Switzerland. This article is an open access article distributed under the terms and conditions of the Creative Commons Attribution (CC BY) license (https://creativecommons.org/licenses/by/4.0/).


