Article

Intrinsically Safe Drone Propulsion System for Underground Coal Mining Applications: Computational and Experimental Studies

1
Department of Mechanical Engineering, New Mexico Tech, Socorro, NM 87801, USA
2
Department of Electrical Engineering, The University of Texas at Arlington, Arlington, TX 76019, USA
3
Department of Electrical and Computer Engineering, University of New Mexico, Albuquerque, NM 87131, USA
4
Department of Mineral Engineering, New Mexico Tech, Socorro, NM 87801, USA
*
Author to whom correspondence should be addressed.
Drones 2023, 7(1), 44; https://doi.org/10.3390/drones7010044
Submission received: 27 December 2022 / Accepted: 6 January 2023 / Published: 8 January 2023
(This article belongs to the Section Drone Design and Development)

Abstract

:
The mining industry has recently shown increased interest in drones for routine activities in underground and surface mines. Designing a drone for coal mines is extremely complicated since the Mine Safety and Health Administration (MSHA) has tight guidelines for any equipment that can be used in underground coal mines. Due to these criteria, designing a drone for underground coal mining is exceedingly difficult. This paper explores the challenges of creating an intrinsically safe drone propulsion system. To address the challenges of designing an intrinsically safe drone’s propulsion system for an underground coal mine, this work aims to investigate the potential approaches to enhance efficiency and mitigate the heat. The study begins with the drone’s sizing approach before moving on to the experimental setup that is utilized to test the drone’s propulsion system. Finally, answers to numerous issues arising during the inquiry are offered, and these solutions are empirically explored.

1. Introduction

The use of drones for operations in underground and surface mines has recently increased [1,2,3]. In 2020, Shahmoradi et al. provided a broad review of the applications of drones in the mining industry. Their study presented configurations and specifications of available off-the-shelf drones for applications in the mining industry [1]. Zimroz et al. investigated the possibility of applying drones in search and rescue missions in a deep underground mine [4]. In their study, a drone searches for an injured or lost person who can call for help but cannot move or use any communication device [4]. Jones et al. discussed using Hovermap autonomous flight systems in GPS-denied underground spaces [5]. Drones can be incredibly adaptable when navigating challenging terrain and carrying various payloads. When LIDAR is used with simultaneous localization and mapping software (SLAM), the unit is a very affordable instrument for monitoring and decision-making [6].
Shahmoradi et al. explored potential concepts for creating a fully autonomous enclosed drone to monitor the inaccessible parts of underground mines [2]. Freire and Cota discussed image captures and the challenges of using drones in an underground mine inaccessible areas [7]. Ilieva-Obretenova presented the management of a ground station and a drone for the aerial surveillance of subsurface processes [8]. Mirzaeinia et al. explored algorithms to find the quickest and safest route for drone navigation systems in applications for underground mines [9]. Li et al. outlined a technique for utilizing an autonomous flying robot to investigate and create a 3D map of a tunnel environment [10]. Zimroz et al. described a method using drones to detect a specified acoustic pattern to assist rescue teams in determining the location of people inside an underground mine [11]. Furthermore, Wang et al. studied the use of a truck–drone to expand the benefits of this hybrid system in underground coal mines [12].
The Mine Safety and Health Administration (MSHA) has not set particular guidelines for flying vehicle testing and approval in underground mines. As a result, drones that will be used in underground mines should be designed and prototyped based on the general MSHA recommendations. These designs should satisfy the intrinsic safety-level requirements for hazardous-area classifications Class 1–Division 1 and Class 2–Division 1. It should be emphasized that creating intrinsically safe electrical components and an allowable power system must undergo a systematic feasibility analysis during the drone sizing process to ensure flyability.
Harsh conditions, such as reduced visibility, dust concentration, confined space, air velocity, and the lack of wireless communication systems, pose many obstacles for a flying drone in underground coal mines. Besides these challenges, due to the lack of an available intrinsically safe and permissible drone platform, MSHA prohibits using such a system. Moreover, coal dust and methane gas are other potential substances that can create fire hazards/explosion in underground coal mines. Therefore, it is required that the electrical components and battery must meet the MSHA’s permissibility/safety requirements defined in Title 30 of the Code of Federal Regulations and related criteria [13]. MSHA currently provides details of the requirements for the mechanical, electrical, and general safety of mining products; however, these requirements for a flying machine are not yet developed.
Generally, the amount of intrinsic safety to be achieved is determined by standard and regulatory requirements. A permissible or inherently safe drone should not generate a spark in a coal mine, even through static discharge. The drone structure must be explosive-proof and capable of keeping the blast while ensuring that no flame, spark, or hot gases are released into the environment. The ability of drones to fly, hover, and navigate in confined spaces is influenced mainly by their size and weight. Encapsulating an inherently safe drone that can satisfy the MSHA’s requirements would add significant weight to the drone due to the added weight to the electrical components, including motors, Electrical Speed Controllers (ESCs), and batteries. Fortunately, material improvements have resulted in robust and lightweight materials for selection.
An intrinsically safe drone will be substantially heavier than a non-permissible or safe drone. Generally, the efficiency of flying vehicles like drones is dramatically affected by their weight [14,15]. As a result, the two key issues in creating an inherently safe drone platform for use in confined spaces are (1) demonstrating the vehicle’s intrinsic safety and permissibility and (2) designing a propulsion system that can generate enough thrust force and provide reasonable endurance. To this end, designing and prototyping a drone platform with suitable size and flight characteristics is challenging.
Currently, there is no data regarding drone design for underground coal mines; therefore, this paper presents an effort and contribution to designing an intrinsically safe drone. As there has been no previous effort in this area, any output from this study would be novel. The unique problems that appeared in the research and their solution should be an addition to the body of knowledge.
The rest of the paper is organized as follows: in Section 2, the design strategy of an intrinsically safe multi-rotor drone and its propulsion system for underground mine applications are discussed. The experimental setup for propulsion system performance measurement and mechanical couplers are presented in Section 3 and Section 4, respectively. Section 5 shows the thermal effects of the motor’s enclosure. The motor’s enclosure flow blockage and spinner design are indicated in Section 6. The summary and conclusions are given in Section 7.

2. Design Strategy of an Intrinsically Safe Drone

Sizing is one of the critical steps in the design process of different types of aerial vehicles, which results in the optimum values of their size and weights, and it consists of five steps [16,17,18], including (1) mission definition, (2) flight modes, (3) configuration and shape, (4) weight estimation, and (5) propulsion system design [19]. In the mission definition, initially, the needs analyses are carried out. Considering the drone’s permissibility, safety, durability, functionality, and objectives, the kinematic requirements, flight time, cruise speed, etc., will be determined. After that, flight modes (hovering and forward flights) and the shape of the drone are determined based on application requirements. Then, analyses are conducted to extract the flight’s kinematic and dynamic equations, which result in the appropriate thrust loading of the drone. In parallel, different weight estimation methods can be employed. The outcome of the sizing process will be the geometry and dimensions of an intrinsically safe drone and the calculation of aerodynamic parameters. The optimum weight and dimensions of the drone and the components of the propulsion system, such as the battery, motors, propellers, and ESCs, will be specified during the sizing process [20]. In Figure 1, the proposed sizing process for the mono/multi-rotor drone with applications in underground coal mines is shown.
Designing a propulsion system is one of the most challenging steps in the overall design process of an intrinsically safe/permissible drone. A propulsion system of a drone is made up of motors, propellers, and ESCs. The drone’s propellers are defined by three primary parameters: pitch, diameter, and blade number. Increasing the values of these parameters would generate higher values of thrust, resulting in higher torque on the motors. Generally, two-bladed, long, slowly spinning propellers in multirotors, compared to multibladed, compact, fast-spinning ones, are more aerodynamically efficient. Propeller properties are mainly determined by incoming air speed and rotating speed.
Furthermore, the mass and materials of the propellers are crucial factors that need to be taken into consideration during propeller selection or design. The motors of multirotor drones are the propellers’ driving force and can change speeds quickly. A brushless DC electric motor’s principal limits are speed and current. Although speed controllers (ESCs) play an essential part in multirotor drones, they play a lesser function in the propulsion chain concept. ESCs deliver current from the battery to the motor while maintaining a steady voltage. When constructing a multirotor drone, speed controllers must still be defined based on the maximum current flowing to the motors. Figure 2 and Figure 3 depict a view of the multirotor propulsion chain diagram and the multirotor propulsion system sizing approach, respectively.
Flight time and range are also important aspects in determining the effectiveness of a flying system which are determined by the defined mission and the drone’s design specifications [21,22,23]. Analytical and empirical tests need to be carried out to specify the flight range and endurance and assess the propulsion system’s performance (i.e., battery, motors, propeller, and ESCs). The results of these analyses can be utilized to optimize and improve the system.
Figure 2. Multirotor propulsion chain diagram [24].
Drones 07 00044 g002
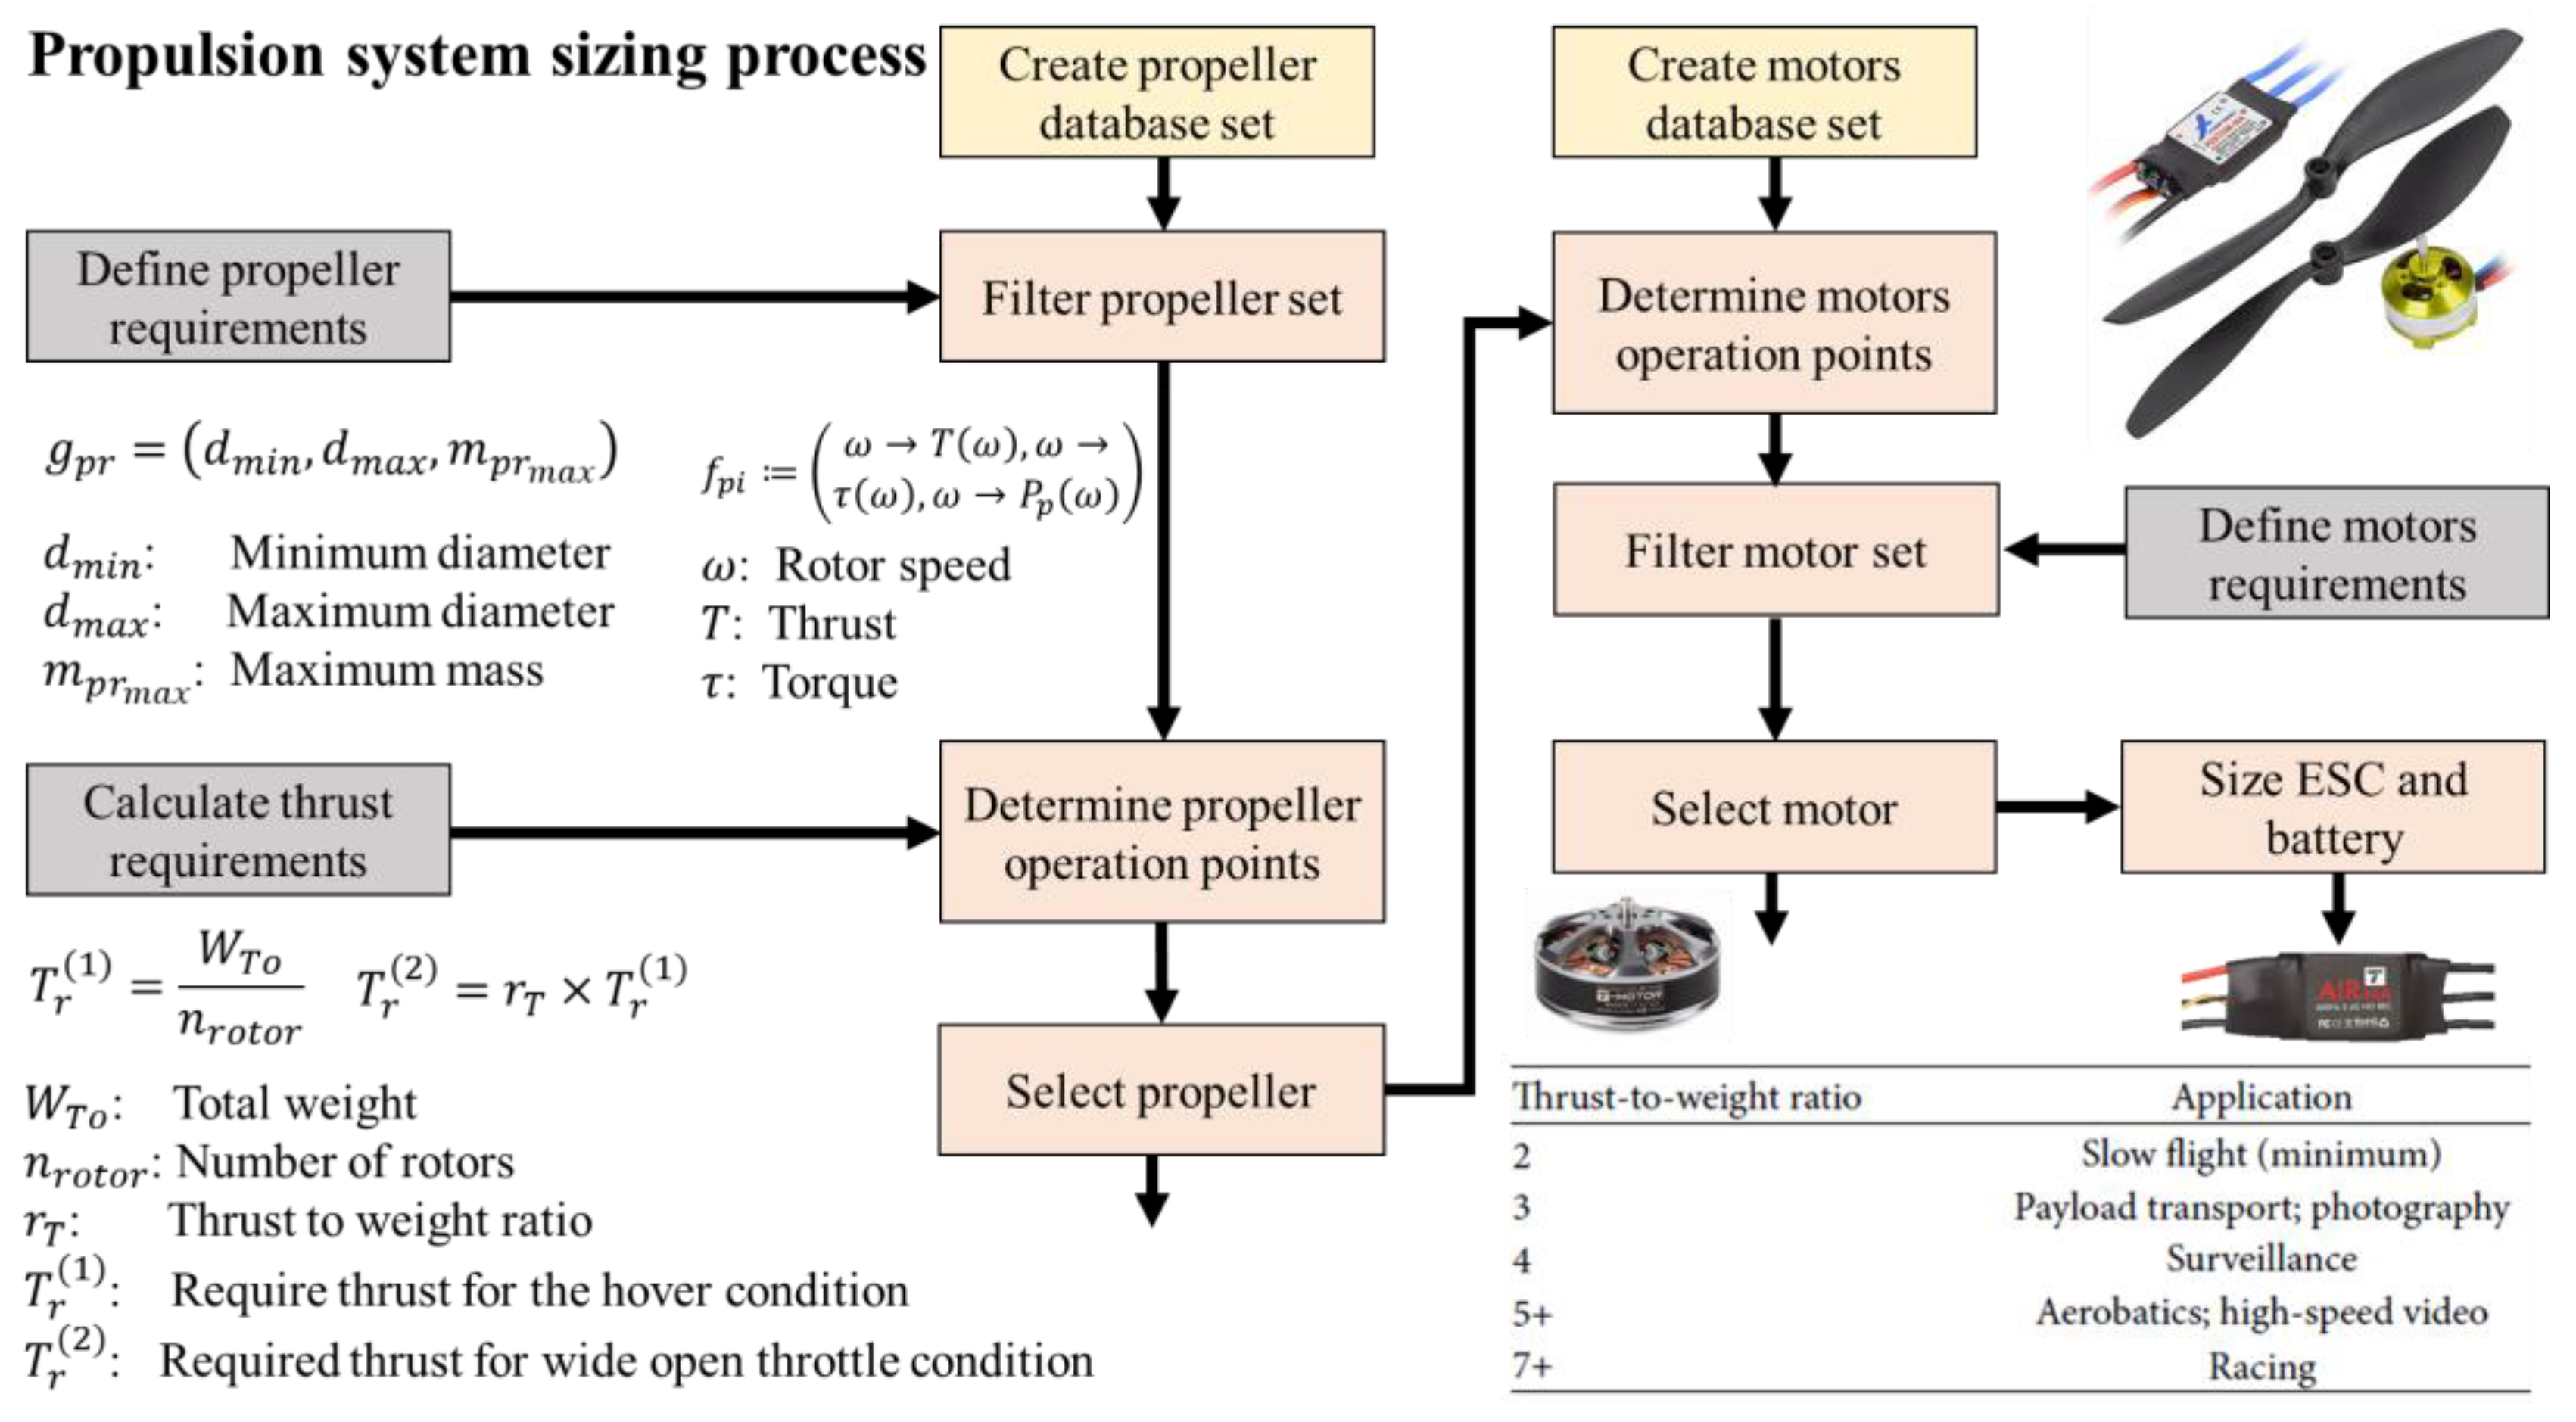
The propulsion system sizing methodology in Figure 3 shows the sizing of the motors depends on the speed controller, propeller, and battery specifications.
Figure 3. Propulsion system design methodology.
Drones 07 00044 g003
The primary goal of this paper is to create an acceptable near-permissible (inherently safe) drone propulsion system that will allow the drone to fly in underground coal mines. The motors will be housed inside a composite-made casing with the same thickness as all drone sections in the basic design. The thickness is chosen to resist a 150 PSI explosive force. Consequently, this requirement will increase the drone’s overall weight, which, as mentioned above, is a critical parameter during the sizing process. Therefore, an alternative concept for lowering drone weight is being investigated. As shown in Figure 4, the proposed approach divides the drone’s assembly into two portions. The red areas (motor and battery casing) have a greater armor thickness to withstand a 150 PSI explosion, while the green sections (connecting rods between the motor and battery casings) have a lower danger probability and are designed to manage propulsion system stresses due to torque and thrust. This proposed design will decrease the overall drone’s weight. Figure 5 depicts the whole procedure, as well as the current state of the drone propulsion system design and performance data.
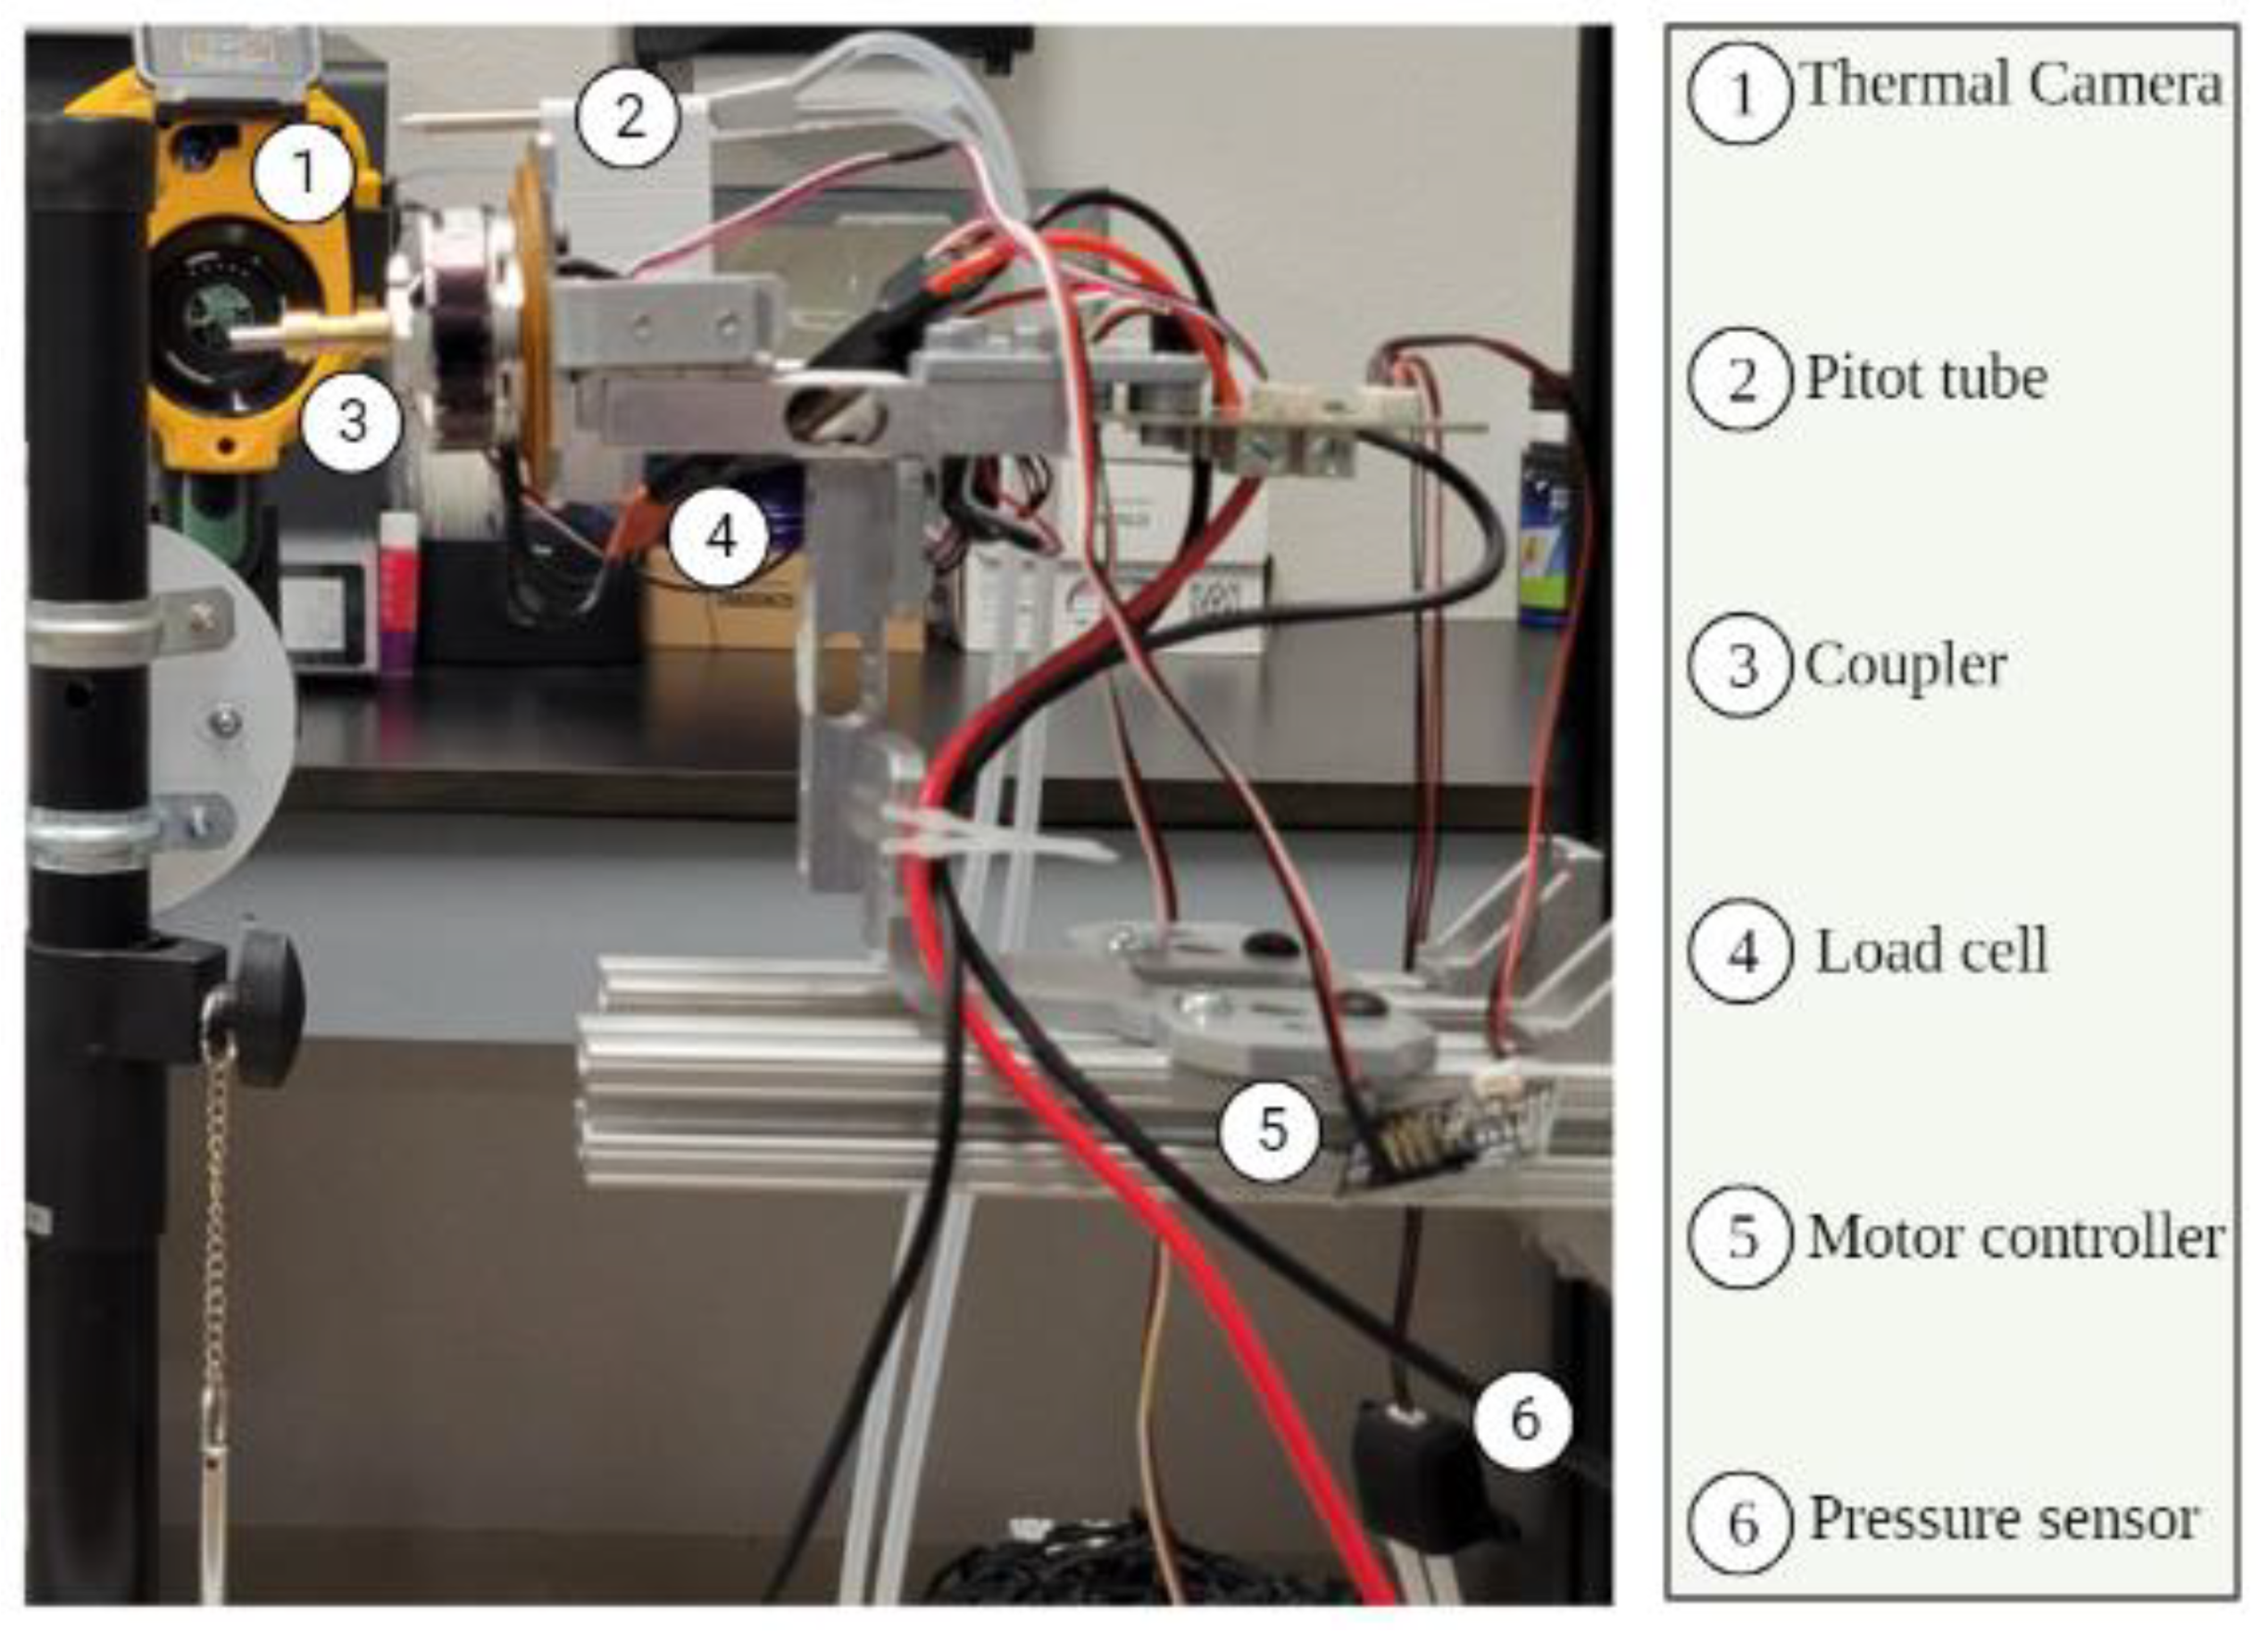
The current paper’s research began with the creation of a testing setup. A performance test rig for propulsion systems was built from scratch. The flow surrounding the drone propulsion system is visualized using a smoke generator and a laser generator. Furthermore, a thermal camera is utilized to visualize the thermal effect of the motor housing on the motor itself. After the trials are set up, the first research will look into the coupling effect on the propulsion system’s performance. After that, the thermal effects of the motor enclosure on the motor temperature and how this affects the motor’s temperature are investigated. In addition, a thermal problem solution is provided and evaluated. Finally, because the motor enclosure causes airflow obstruction, a motor spinner is created and tested experimentally.
A test rig to measure the propulsion system’s performance is designed and manufactured. With some additions to the test rig, it is possible to conduct flow visualization using a laser and smoke generator. Furthermore, applying a thermal camera makes it possible to capture the thermal images of the propulsion system. The measurement system was used to evaluate the coupling system of the propulsion system. Furthermore, the motor enclosure’s thermal and aerodynamic effect on the propulsion is investigated, which will be discussed in the following sections.

3. Propulsion System Performance Measurement Setup

As illustrated in Figure 6, a test rig is being created to allow the testing of the drone propulsion system. A load cell measures torque and thrust; an accelerometer measures vibrations; a thermocouple measures motor temperature, and a pressure sensor with a pitot tube measures the propulsion system slipstream air velocity. Tyto Robotics’ signal processing board is also used to handle sensor signals and connect them to a PC. The measuring system was added to the construction to support the vibrations of the motor and propeller. All sensors have been calibrated and certified. The test stand’s design specifications include a thrust of 10 kgf, a torque of 4 Nm, a voltage of 50 V, a current of 55 A, and an angler speed of 160k RPM.

4. Mechanical Coupler Design and Testing

Since the motor is placed inside a casing, the shaft of the motor should be coupled due to having the propeller outside of the casing. Therefore, a mechanical coupler with an extended shaft is needed, as shown in Figure 7. The experiments showed that the torque could successfully transmit through the added mechanical coupler. However, there is a clearness between the motor casing and shaft, which must be tested to ensure no gas leakage through the orifice.
The test rig is used to compare the coupled and uncoupled propulsion systems, as depicted in Figure 8. Because the motor is not covered by its housing in this setup, only the coupling effect is evaluated. There is essentially little change in torque and thrust, as demonstrated in Figure 8. As shown, the uncoupled system has roughly 3% higher efficiency in the 2000 to 4000 RPM range, and the coupled system has around 66% more vibration. As the propeller moves away from the motor’s base, this rise is to be expected. Solutions to decrease these vibrations will be researched.

5. Motor’s Enclosure Thermal Effects

5.1. Casing Thermal Effects on the Propulsion System Performance

One of the most important tests is to explore the thermal effects due to having a motor casing on its performance. The motor could be destroyed if it exceeds a certain temperature. Therefore, the motor performance is tested in two conditions, one for the motor without a casing and the other with a casing, as shown in Figure 9. In this experiment, in both scenarios, the motor is operated at 50% (left) and 75% (right) of the maximum RPM, and the motor temperature is limited to 120 °C (based on the manufacturer data). During the testing, the motor without a casing reached 60 °C in about 425 s, while the motor with a casing reached this temperature in about 75 s for 75% of the motor RPM. Furthermore, the motor without a casing has smooth transition heating with almost a constant temperature of around 60 °C. Continuing this experiment without limiting the motor’s temperature could cause failure in the motor. Besides the safety point regarding the motor failure, the motor performance changes as the temperature increases, as shown in Figure 9, which illustrates the thrust and torque changes with increasing temperature.
The motor casing will increase the temperature of the motors, which initially were cooled down by airflow generated by propellers. Typically, each electric motor has a maximum working temperature. As the temperature of the motor increases, its efficiency decreases.

5.2. Radial Heat Sink for Propulsion System Cooling

Based on the previous section, it is crucial to design a cooling system for the motor. It would be a good idea to make use of the accelerated air behind the propeller. Therefore, a redial heat sink shown in Figure 10 is proposed. The fins will be extended outside the motor casing to be cooled down by forced heat convection from the propeller slipstream air. Based on the results in Section 5.1, the amount of heat generated from the motor with enclosure can be calculated by Equation (1), where m is the motor mass, c is the specific heat coefficient, ∇T is the temperature difference, and t is the time. Based on this equation and the 75% throttle case, the heat generated is about 12 watts.
Q = m × c × T t
It is found that the heat sink shown in Figure 10 is available with multiple diameters; therefore, it is needed to calculate the required heat-sink geometry. The thermal resistance is calculated by Equation (2). Based on this equation and the data sheet of the heatsink, a heat sink with a 15 mm fin and 10 mm height is considered. It should be noted that the heat-sink core will cover the motor base. It is desired to calculate the heat-sink fin temperature distribution; Therefore, one fin is considered, as shown in Figure 10. To evaluate the fin length, a 30 mm fin is also assessed and compared with the basic fin. The boundary conditions, forced convection for fin faces, and wall temperature for the fin base are shown in Figure 10. It is assumed the fin base has a uniform temperature, which is 120 °C based on the previous motor temperature measurements.
R = T Q
The following equations are provided from [25], assuming dx = dy. The energy equation for points (1,2,6–8) can be presented by:
T m ,   n = 2 T m + 1 ,   n + T m ,   n 1 + T m ,   n + 1 + 2 h Δ y k T 2 ( h Δ y k + 2 )
The energy equation for points (4,5) can be presented by
T m ,   n = T m 1 ,   n + T m + 1 ,   n + T m ,   n 1 + T m ,   n + 1 4
The energy equation for points (3,9) can be presented by
T m ,   n = T m 1 ,   n + T m ,   n 1 + 2 h Δ x k T 2 ( 2 h Δ x k + 1 )
Using the previous equations gives a set of equations that can be written in the form of:
[ A ] [ T ] = [ C ]
where A is the coefficient matrix, T is the Temperature vector, and C is the constant vector. Solving this equation gives the temperature at each point on the fin.
The Reynolds number (Re) for the flow over the fin can be calculated by Equation (7) and is about 288.
R e = ρ × u × y μ
where ρ is the air density, u is the freestream velocity, μ is the dynamic viscosity, and y is the length characteristic.
The Nussle number (Nu) can be calculated by:
N u = 0.664 R e 0.5 p r 1 / 3
where pr is the Prandtl number.
Finally, the convection heat coefficient (h) can be determined by:
h = N u × k y
where k is the heat conduction transfer coefficient.
The results from the numerical analysis are shown in Figure 11 and Figure 12. The fin’s heat distribution for wall temperature Tw = 393.15 K and various Tinf are shown in Figure 11. Figure 13 shows the heat-sink fin temperature distribution for air temperature Tinf = 298.15 K and various wall temperatures, Tw. Fins of 15 mm and 30 mm are included in the results. Generally, changing the boundary condition changes the temperature distribution. The 15 mm fin is more efficient than the 30 mm, as the temperature is reduced smoothly until the tip of the fin. For the 30 mm fin, it can be seen that most of the fin is not doing any role in heat reduction, and also, it is more weight to be added with less efficiency. Therefore, the 15 mm fin will be installed on the motor, and its performance will be investigated.
The motor base is attached to the heat-sink surface, as shown in Figure 13, in order to experimentally investigate the performance of the heat sink with the motor. The performance is measured for the system without a heat sink (motor with casing), a system with a heat sink while the fins are in the propeller rotation direction (PD), and a system with a heat sink while the fins are counter to the propeller rotation direction (CPD). Also, as shown in the previous section, the motor is operated with two RPMs: 50% (left) and 75% (right). The results in Figure 14 show the effectiveness of the heat sink in cooling the motor and making use of the slipstream air. In both cases (PD and CPD), it could reduce the motor temperature. Placing the heat sink in the PD position significantly reduced the motor temperature. It is believed that putting the sink in this position makes the airflow take longer time as shown in Figure 15. The heat sink could improve the thrust, torque, and efficiency; however, it is not possible to observe the difference between the PD and CPD cases, as the difference is less than the measurement-system resolution.

5.3. Thermal Imaging of the Propulsion System

In addition to the propulsion-system measurement in the previous section, a thermal imaging experiment is also conducted. A time ratio of τ is introduced to compare the different test scenarios, as shown in Table 1. The time ratio is the ratio between steady-state or final temperature and instantaneous time. Four scenarios are investigated in the thermal imaging experiment, the motor without casing, the motor with a casing, the system with the heat sink PD, and the system with the heat-sink CPD. The motor tip is on the right, and the motor base is on the left. The red color in the thermal contours was set as the maximum limit of the motor temperature. For the motor without a casing, the temperature of the motor base increases a little bit with the 50% RPM, and it is higher for the 75% RPM case. It also can be seen that the propeller is cooling the motor tip, which includes the coals and makes it cooler than the motor base. For the motor with a case, the motor tip is hotter. The heat sink could give the motor tip and base a similar temperature. Furthermore, it can be seen that the motor with PD heat sink had a lower temperature than the motor with CPD.

6. Motor Enclosure Flow Blockage and Spinner Design

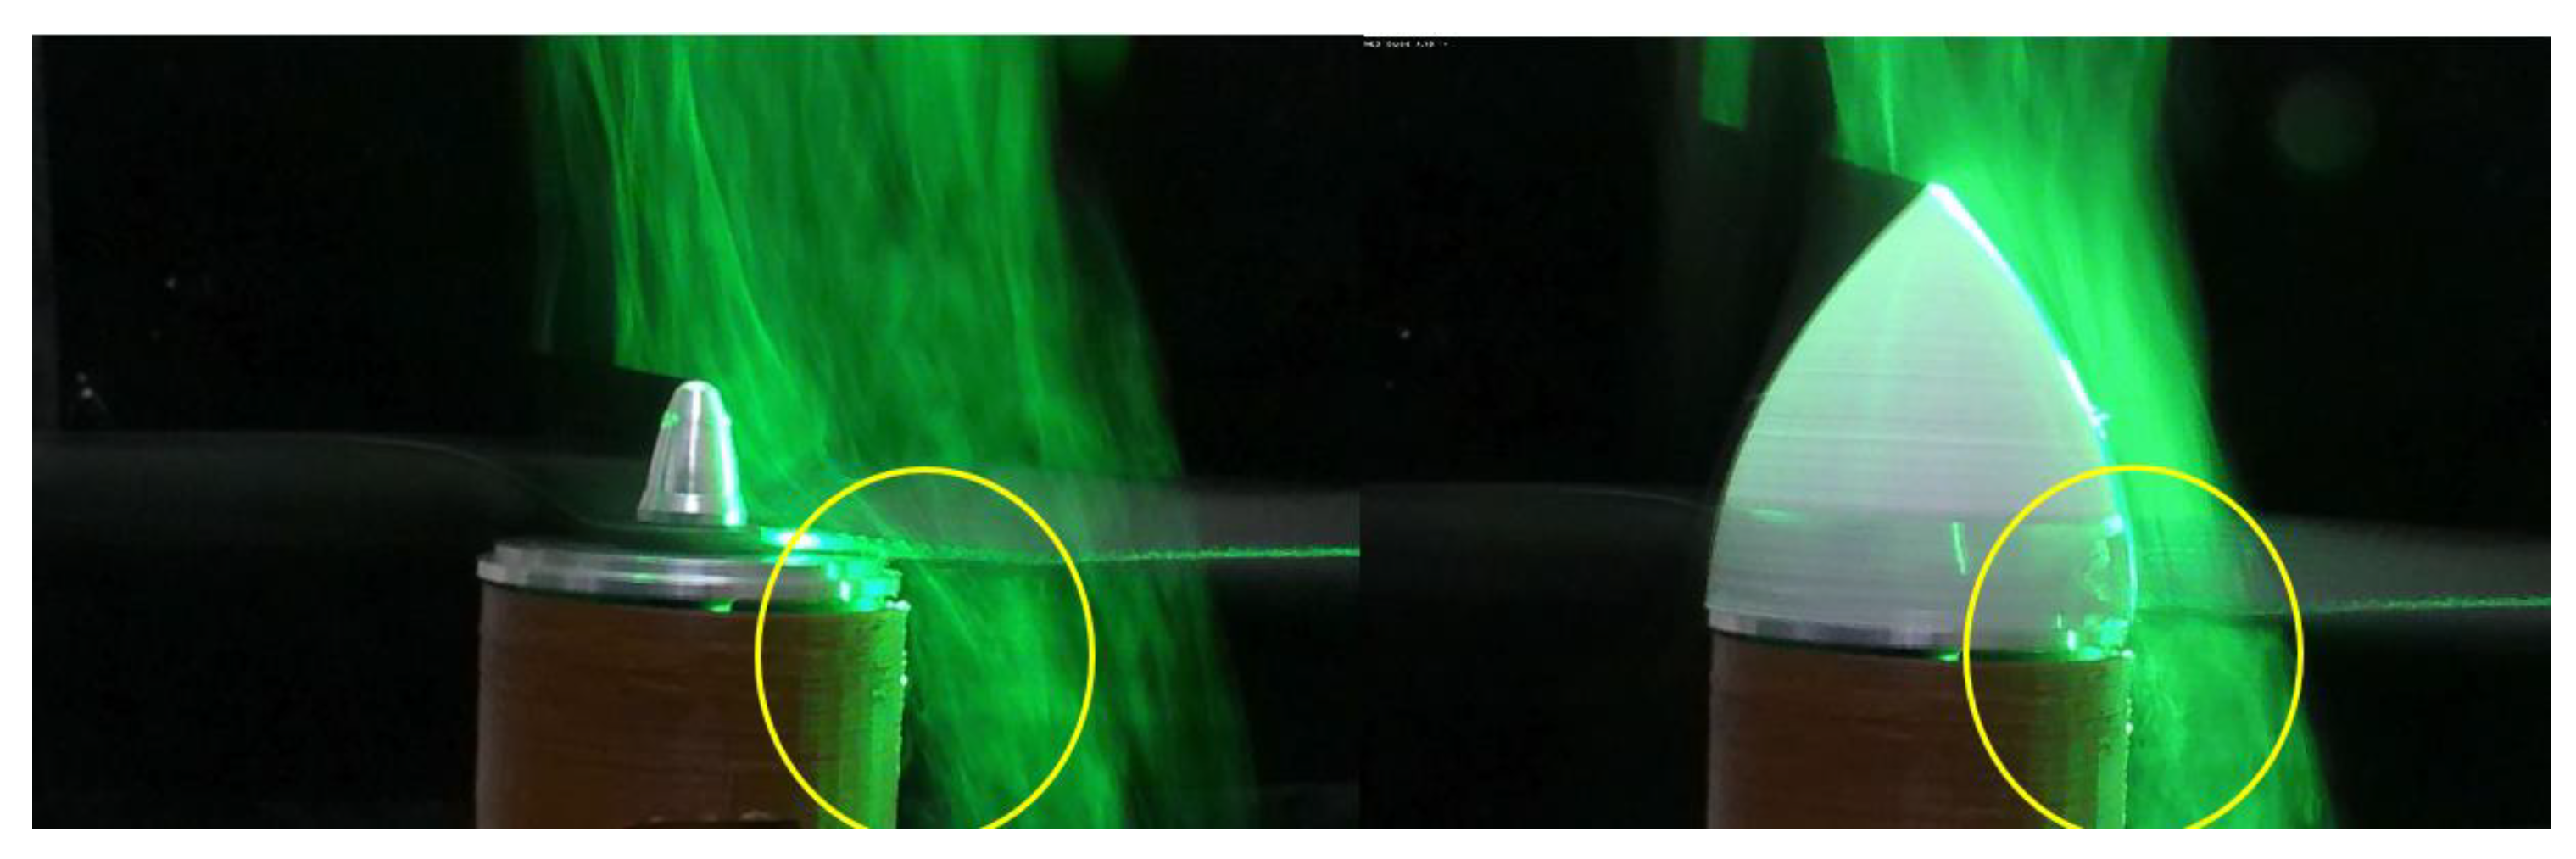
A smoke-visualization setup that applies a fog generator and laser is made to visualize the flow around the propulsion system, as shown in Figure 16. As can be seen, the flow is bent around the motor enclosure corner (the yellow circle), and that could reduce the system’s efficacy. To solve this problem, nine motor spinners, shown in 
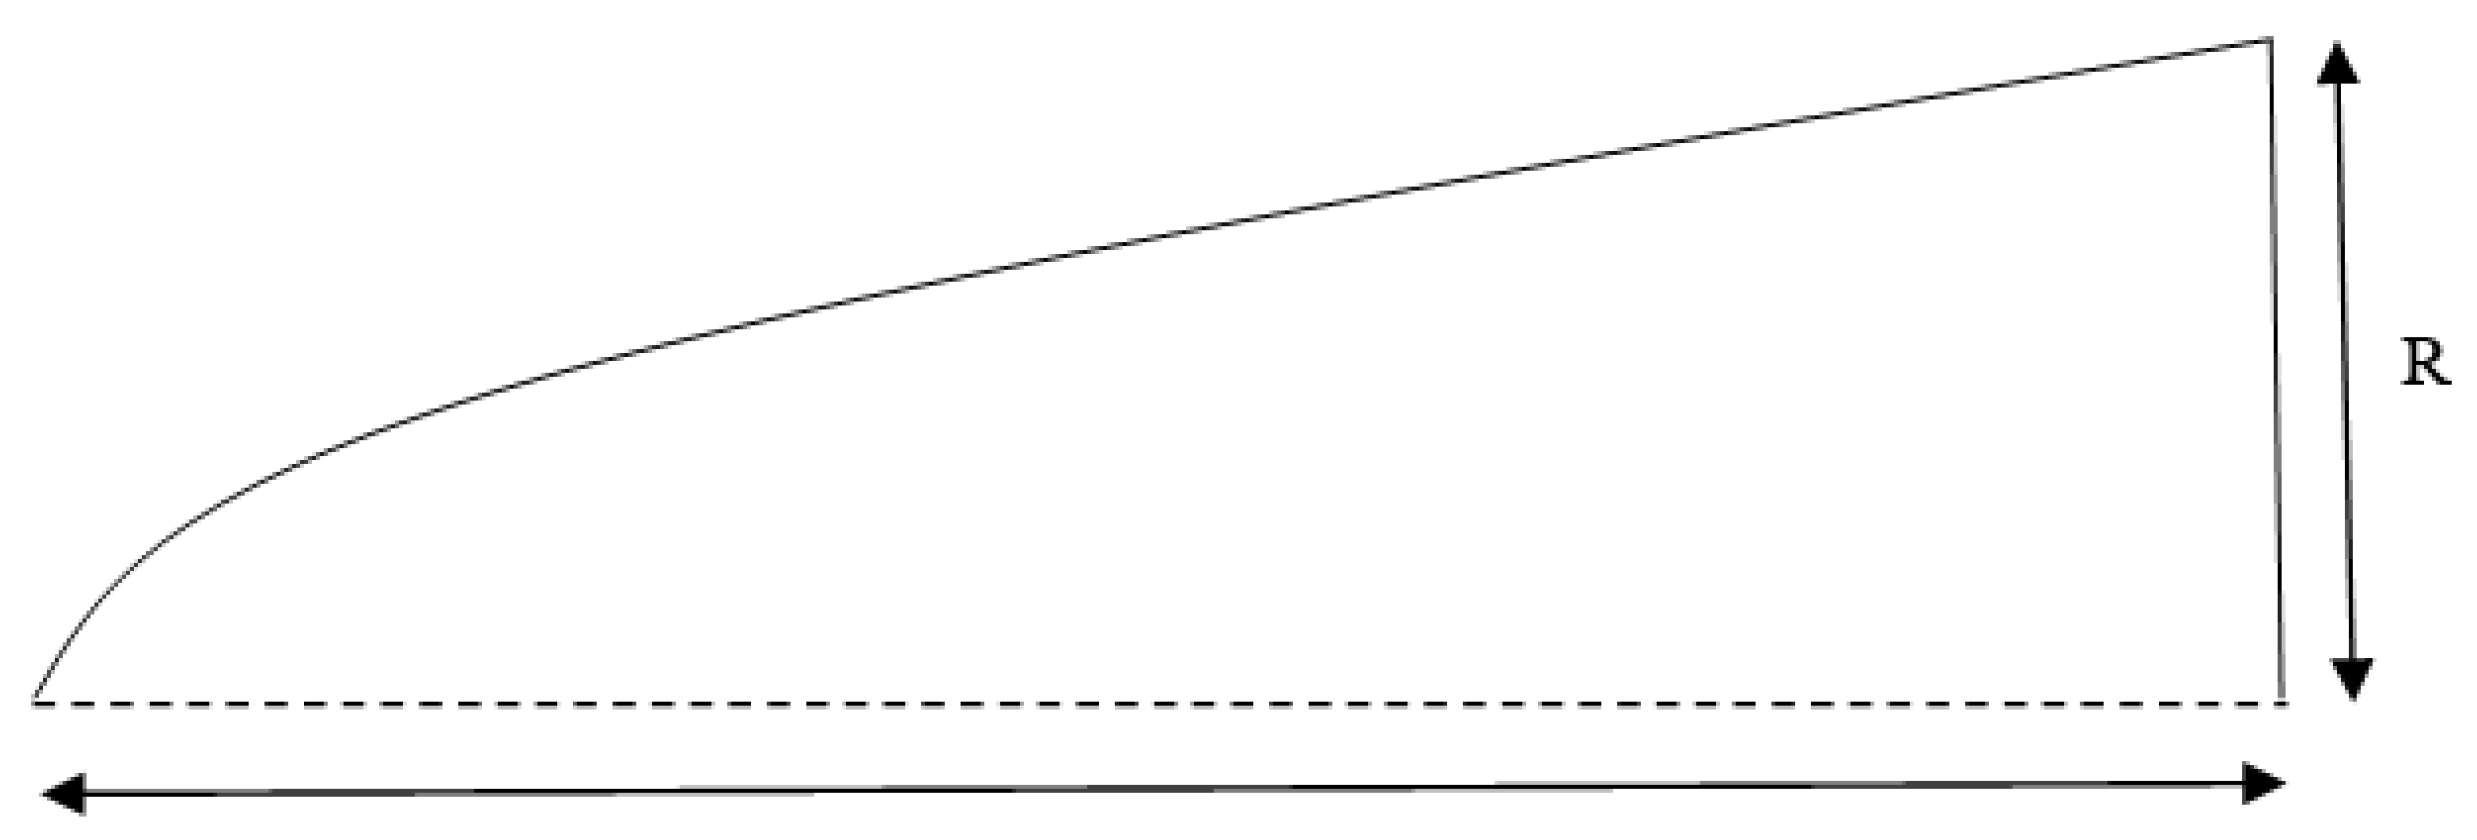
Figure 17, are designed and prototyped. The spinners are tested using the performance test rig, and the performance of each one of them is evaluated. The spinner weight should be taken into consideration; however, for the current research, only the aerodynamic effects are considered. The spinner geometry is shown in Figure 18, and Equation (10) is used to design the spinner. In Table 2, the summary of different spinner equations, which all have the same diameter with different lengths and curve equations, are shown. Figure 19 compares the different spinners, and Figure 20 shows the 3d-printed spinners.
y = R ( 2 x L ) K ( x L ) 2 ( 2 K )
A balancing system shown in Figure 21 is used to balance the spinners before testing and reduce the operation vibration. Increasing the vibration could lead to breaking the motor’s shaft. Figure 22 presents the difference in airflow between the casing without a spinner and the casing with a spinner case.
Each spinner is installed on the propeller, and the thrust from each of them is shown in Figure 22. From the thrust perspective, the K3L2 is the best choice. For the torque case in Figure 23, the difference is much smaller and will not considered in the selection. The slipstream velocity for K3L2 is the highest, as shown in Figure 24. Furthermore, from a propeller-efficiency point of view, K3L2, as indicated in Figure 25, has the highest efficiency. For the overall system efficiency, K3L1 is the highest, and K3L2 is in second place. Overall system efficiency for the different spinners is shown in Figure 26. The vibration results in Figure 27 indicate the success in balancing the spinners, but the spinners K2L1 need to be rebalanced if it will be used further, as it shows a higher level of vibration compared with the other spinners. Based on the previous analysis, K3L2 is selected.
The smoke-visualization experiment for the case with and without a spinner is shown in Figure 28. As shown, the flow field with yellow is different in the two cases, especially the region with a yellow circle. Further measurements should be considered to evaluate the effect of these spinners on the thrust and torque. Moreover, the added weight should be taken into consideration.

7. Conclusions

Experimental research was done to determine a permissible drone propulsion mechanism. The motor shaft needs to be connected because the propeller will be outside the casing due to the motor being enclosed in a housing. A mechanical coupler with an extended shaft was designed. The torque might be successfully transmitted by this mechanical coupler. The performance of the propulsion system was tested under two different circumstances, one for the motor without a casing and the other for the motor with a casing. In contrast to the usual situation, when the propellers cool the motors down, the motor housing heats the motors. As a result, an experimental investigation and heat-sink calculation was carried out. The performance of the propulsion system was tested under two different circumstances, one for the motor without a casing and the other for the motor with a casing. The most important advantage of the heat sink is that it reduces motor temperature, which can boost thrust, torque, and efficiency. Based on the numerical calculations, the heat sink has a fin with a length of 15 mm.
During the experimental investigation, the motor was operated with two RPMs: 50% and 75%. With the help of the heat sink, the motor temperature could be reduced from 70 °C to 40 °C in the case of 50% RPM. In comparison, The motor’s temperature could be reduced from 120 °C to 70 °C in the case of 75% RPM. This improvement in cooling the motor could increase the thrust by about 5%. The most crucial benefit of the heat sink is the reduction in motor’s temperature, which can also increase thrust, torque, and efficiency. To visualize the flow surrounding the propulsion system, a smoke-visualization experiment was conducted. It was shown through this experiment that the flow is bent around the corner of the motor enclosure, and spinners were prototyped and experimentally tested to study this effect. Based on the experiment results, a spinner with a height-to-diameter ratio (L/D) equal to 3/2 should be used. The spinner could increase the thrust by 2.6%. The work described in this paper may lead to the development of a drone propulsion system suitable for use in underground coal mines. However, since numerous pieces were added to the system, additional optimization is required to decrease the increased weight of the drone and increase its durability.

Author Contributions

Conceptualization, A.A. and M.H.; methodology, A.A.; software, A.A.; validation, J.L., D.W., P.R. and M.H.; formal analysis, A.A.; investigation, A.A. and M.H.; resources, M.H., and P.R.; writing—original draft preparation, A.A. and M.H.; writing—review and editing, A.A., J.L., D.W., P.R. and M.H.; visualization, A.A.; supervision, J.L., D.W., P.R. and M.H.; project administration, J.L., D.W., P.R. and M.H.; funding acquisition, J.L., D.W., P.R. and M.H. All authors have read and agreed to the published version of the manuscript.

Funding

This research was funded by Alpha Foundations: grant number [AFCRFP20-130].

Institutional Review Board Statement

Not applicable.

Informed Consent Statement

Not applicable.

Data Availability Statement

The datasets generated during and/or analyzed during the current study are available from the corresponding author on reasonable request.

Acknowledgments

This study was sponsored by the Alpha Foundation for the Improvement of Mine Safety and Health, Inc. (ALPHA FOUNDATION). The views, opinions, and recommendations expressed herein are solely those of the authors and do not imply any endorsement by the ALPHA FOUNDATION, its directors, and staff.

Conflicts of Interest

The authors declare no conflict of interest.

References

  1. Shahmoradi, J.; Talebi, E.; Roghanchi, P.; Hassanalian, M. A comprehensive review of applications of drone technology in the mining industry. Drones 2020, 4, 34. [Google Scholar] [CrossRef]
  2. Shahmoradi, J.; Roghanchi, P.; Hassanalian, M. Design, analysis and prototyping of a spherical drone for underground mines. Int. J. Theor. Appl. Multiscale Mech. 2022, 4, 58–82. [Google Scholar] [CrossRef]
  3. Shahmoradi, J.; Martinez-Ponce, J.; Cross, R.; Olivas, M.; Malburg, A.; Roghanchi, P.; Hassanalian, M. Design and Optimization of an Encased Drone for Underground Mining Applications. In Proceedings of the AIAA SciTech 2021 Forum, Virtual Event, 11–15 & 19–21 January 2021. [Google Scholar]
  4. Zimroz, P.; Trybała, P.; Wróblewski, A.; Góralczyk, M.; Szrek, J.; Wójcik, A.; Zimroz, R. Application of UAV in search and rescue actions in underground mine—A specific sound detection in noisy acoustic signal. Energies 2021, 14, 3725. [Google Scholar] [CrossRef]
  5. Jones, E.; Sofonia, J.; Canales, C.; Hrabar, S.; Kendoul, F. Advances and applications for automated drones in underground mining operations. In Proceedings of the Deep Mining 2019: Proceedings of the Ninth International Conference on Deep and High Stress Mining, The Southern African Institute of Mining and Metallurgy, Muldersdrift, South Africa, 24–25 June 2019; pp. 323–334. [Google Scholar]
  6. Ahmed, S.N. 3D Scanning and Mapping of Underground Mine Workings Using Aerial Drones. Phys. Can. 2018, 74, 3–4. [Google Scholar]
  7. Freire, G.R.; Cota, R.F. Capture of images in inaccessible areas in an underground mine using an unmanned aerial vehicle. In Proceedings of the UMT 2017: Proceedings of the First International Conference on Underground Mining Technology, Australian Centre for Geomechanics, Perth, Australia, 11–13 October 2017. [Google Scholar]
  8. Ilieva-Obretenova, M. Drone Management in Underground Mine Workings. J. Mech. Eng. Autom. 2021, 11, 171–179. [Google Scholar] [CrossRef]
  9. Shahmoradi, J.; Mirzaeinia, A.; Hassanalian, M.; Roghanchi, P. Monitoring of Inaccessible Areas in GPS-Denied Underground Mines Using a Fully Autonomous Encased Safety Inspection Drone. In Proceedings of the AIAA SciTech 2020, Orlando, FL, USA, 6–10 January 2020. [Google Scholar]
  10. Li, H.; Savkin, A.V.; Vucetic, B. Autonomous area exploration and mapping in underground mine environments by unmanned aerial vehicles. Robotica 2020, 38, 442–456. [Google Scholar] [CrossRef]
  11. Zimroz, P.; Wróblewski, A.; Trybała, P. Detection of a predefined acoustic pattern by a measurement system on a drone and its application to search for a missing man in an underground mine. IOP Conf. Ser. Earth Environ. Sci. 2021, 942, 012018. [Google Scholar] [CrossRef]
  12. Wang, Y.; Wang, Z.; Hu, X.; Xue, G.; Guan, X. Truck–drone hybrid routing problem with time-dependent road travel time. Transp. Res. Part C Emerg. Technol. 2022, 144, 103901. [Google Scholar] [CrossRef]
  13. MSHA. Criteria for the Evaluation and Test of Intrinsically Safe Apparatus and Associated Apparatus (ACRI2001). Version: 2008-11-04. Available online: https://arlweb.msha.gov/techsupp/acc/application/acri2001.pdf (accessed on 5 August 2022).
  14. Hassanalian, M.; Abdelkefi, A. Methodologies for weight estimation of fixed and flapping wing micro air vehicles. Meccanica 2017, 52, 2047–2068. [Google Scholar] [CrossRef]
  15. Hassanalian, M.; Radmanesh, M.; Sedaghat, A. Increasing flight endurance of MAVs using multiple quantum well solar cells. Int. J. Aeronaut. Space Sci. 2014, 15, 212–217. [Google Scholar] [CrossRef] [Green Version]
  16. Aboelezz, A.; Hassanalian, M.; Desoki, A.; Elhadidi, B.; El-Bayoumi, G. Design, experimental investigation, and nonlinear flight dynamics with atmospheric disturbances of a fixed-wing micro air vehicle. Aerosp. Sci. Technol. 2020, 97, 105636. [Google Scholar] [CrossRef]
  17. Hassanalian, M.; Quintana, A.; Abdelkefi, A. Morphing micro unmanned air vehicle: Sizing process and stability. Aerosp. Sci. Technol. 2018, 78, 130–146. [Google Scholar] [CrossRef]
  18. Hassanalian, M.; Abdelkefi, A.; Wei, M.; Ziaei-Rad, S. A novel methodology for wing sizing of bio-inspired flapping wing micro air vehicles: Theory and prototype. Acta Mech. 2017, 228, 1097–1113. [Google Scholar] [CrossRef]
  19. Hassanalian, M.; Khaki, H.; Khosrawi, M. A new method for design of fixed wing micro air vehicle. Proc. Inst. Mech. Eng. Part G 2014, 229, 837–850. [Google Scholar] [CrossRef]
  20. Hassanalian, M.; Abdelkefi, A. Classifications, applications, and design challenges of drones: A review. Prog. Aerosp. Sci. 2017, 91, 99–131. [Google Scholar] [CrossRef]
  21. Gammill, M.; Sherman, M.; Raissi, A.; Hassanalian, M. Energy Harvesting Mechanisms for a Solar Photovoltaic Plant Monitoring Drone: Thermal Soaring and Bioinspiration. In Proceedings of the 2021 AIAA SciTech Forum, Virtual Event, 11–15 & 19–21 January 2021. [Google Scholar]
  22. Sherman, M.; Gammill, M.; Raissi, A.; Hassanalian, M. Solar UAV for the Inspection and Monitoring of Photovoltaic (PV) Systems in Solar Power Plants. In Proceedings of the 2021 AIAA SciTech Forum, Virtual Event, 11–15 & 19–21 January 2021. [Google Scholar]
  23. Hassanalian, M.; Mohammadi, S.; Acosta, G.; Guido, N.; Bakhtiyarov, S. Surface temperature effects of solar panels of fixed-wing drones on drag reduction and energy consumption. Meccanica 2020, 56, 2–22. [Google Scholar] [CrossRef]
  24. Biczyski, M.; Sehab, R.; Whidborne, J.F.; Krebs, G.; Luk, P. Multirotor sizing methodology with flight time estimation. J. Adv. Transp. 2020, 2020, 9689604. [Google Scholar] [CrossRef]
  25. Bergman, T.L.; Bergman, T.L.; Incropera, F.P.; Dewitt, D.P.; Lavine, A.S. Fundamentals of Heat and Mass Transfer; John Wiley & Sons: Hoboken, NJ, USA, 2011. [Google Scholar]
Figure 1. Sizing procedure of an intrinsically safe/permissible drone for underground mines.
Drones 07 00044 g001
Figure 4. The permissible drone design and its propulsion system.
Drones 07 00044 g004
Figure 5. Drone propulsion system design and performance measurements flowchart.
Drones 07 00044 g005
Figure 6. Drone propulsion system performance test rig.
Drones 07 00044 g006
Figure 7. Mechanical coupler installation.
Drones 07 00044 g007
Figure 8. Performance measurements for the system with and without the mechanical coupler.
Drones 07 00044 g008
Figure 9. Performance measurements for the system with and without motor casings.
Drones 07 00044 g009
Figure 10. Heat-sink coordinates.
Drones 07 00044 g010
Figure 11. Heat-sink fin temperature distribution for Tw = 393.15 K and various Tinf, 15 mm fin (left) and 30 mm fin (right).
Drones 07 00044 g011aDrones 07 00044 g011b
Figure 12. Heat-sink fin temperature distribution for Tinf = 298.15 K and various Tw, 15 mm fin (left) and 30 mm fin (right).
Drones 07 00044 g012aDrones 07 00044 g012b
Figure 13. Heat-sink installation.
Drones 07 00044 g013
Figure 14. Performance measurements for the system with and without a heat sink.
Drones 07 00044 g014aDrones 07 00044 g014b
Figure 15. Heat-sink cooling air direction.
Drones 07 00044 g015
Figure 16. Smoke-visualization setup.
Drones 07 00044 g016
Figure 17. Spinner added to the propulsion system.
Drones 07 00044 g017
Figure 18. Spinner geometry.
Drones 07 00044 g018
Figure 19. View of spinners’ different geometry.
Drones 07 00044 g019
Figure 20. Views of 3d-printed spinners.
Drones 07 00044 g020
Figure 21. View of balancing system.
Drones 07 00044 g021
Figure 22. Thrust for the different spinners.
Drones 07 00044 g022
Figure 23. Torque for the different spinners.
Drones 07 00044 g023
Figure 24. Slipstream airspeed for the different spinners.
Drones 07 00044 g024
Figure 25. Propeller efficiency for the different spinners.
Drones 07 00044 g025
Figure 26. System efficiency for the different spinners.
Drones 07 00044 g026
Figure 27. System vibration for the different spinners.
Drones 07 00044 g027
Figure 28. View of flow visualization for the system with spinner and without a spinner.
Drones 07 00044 g028
Table 1. Thermal images of a motor without and with casings.
τ0.130.270.420.570.720.82
Motor without casing
50% RPM
Drones 07 00044 i001Drones 07 00044 i002Drones 07 00044 i003Drones 07 00044 i004Drones 07 00044 i005Drones 07 00044 i006
Motor without casing
75% RPM
Drones 07 00044 i007Drones 07 00044 i008Drones 07 00044 i009Drones 07 00044 i010Drones 07 00044 i011Drones 07 00044 i012
Motor with casing
50% RPM
Drones 07 00044 i013Drones 07 00044 i014Drones 07 00044 i015Drones 07 00044 i016Drones 07 00044 i017Drones 07 00044 i018
Motor with casing
75% RPM
Drones 07 00044 i019Drones 07 00044 i020Drones 07 00044 i021Drones 07 00044 i022Drones 07 00044 i023Drones 07 00044 i024
Motor with casing and heat sink CPD
50% RPM
Drones 07 00044 i025Drones 07 00044 i026Drones 07 00044 i027Drones 07 00044 i028Drones 07 00044 i029Drones 07 00044 i030
Motor with casing and heat sink CPD
75% RPM
Drones 07 00044 i031Drones 07 00044 i032Drones 07 00044 i033Drones 07 00044 i034Drones 07 00044 i035Drones 07 00044 i036
Motor with casing and heat sink PD
50% RPM
Drones 07 00044 i037Drones 07 00044 i038Drones 07 00044 i039Drones 07 00044 i040Drones 07 00044 i041Drones 07 00044 i042
Motor with casing and heat sink PD
75% RPM
Drones 07 00044 i043Drones 07 00044 i044Drones 07 00044 i045Drones 07 00044 i046Drones 07 00044 i047Drones 07 00044 i048
Table 2. Different spinners’ equations.
L1 (55 mm)L2 (36.6 mm)L3 (27.5 mm)
K1 (1) x 2 110 + x   3 × x 2   9 × x 2 440   2 × x 2 × x 2 55
K2 (0.8) x 2 165 + 5 × x 6 5 × x 4 3 × x 2 220 5 × x 3 4 × x 2 165
K3 (0.6) 5 × x 7 3 × x 2 770 15 × x 14 27 × x 2 3080 10 × x 7 6 × x 2 385
Disclaimer/Publisher’s Note: The statements, opinions and data contained in all publications are solely those of the individual author(s) and contributor(s) and not of MDPI and/or the editor(s). MDPI and/or the editor(s) disclaim responsibility for any injury to people or property resulting from any ideas, methods, instructions or products referred to in the content.

