Article

Insights into Sensitivity of Wing Shape and Kinematic Parameters Relative to Aerodynamic Performance of Flapping Wing Nano Air Vehicles

1
Department of Mechanical and Aerospace Engineering, New Mexico State University, Las Cruces, NM 88003, USA
2
Department of Mechanical Engineering, New Mexico Institute of Mining and Technology, Socorro, NM 87801, USA
*
Author to whom correspondence should be addressed.
Drones 2019, 3(2), 49; https://doi.org/10.3390/drones3020049
Submission received: 16 May 2019 / Revised: 14 June 2019 / Accepted: 15 June 2019 / Published: 19 June 2019
(This article belongs to the Special Issue Bio-Inspired Drones)

Abstract

:
In this work, seven wings inspired from insects’ wings, including those inspired by the bumblebee, cicada, cranefly, fruitfly, hawkmoth, honeybee, and twisted parasite, are patterned and analyzed in FlapSim software in forward and hovering flight modes for two scenarios, namely, similar wingspan (20 cm) and wing surface (0.005 m2). Considering their similar kinematics, the time histories of the aerodynamic forces of lift, thrust, and required mechanical power of the inspired wings are calculated, shown, and compared for both scenarios. The results obtained from FlapSim show that wing shape strongly impacts the performance and aerodynamic characteristics of the chosen seven wings. To study the effects of different geometrical and physical factors including flapping frequency, elevation amplitude, pronation amplitude, stroke-plane angle, flight speed, wing material, and wingspan, several analyses are carried out on the honeybee-inspired shape, which had a 20 cm wingspan. This study can be used to evaluate the efficiency of different bio-inspired wing shapes and may provide a guideline for comparing the performance of flapping wing nano air vehicles with forward flight and hovering capabilities.

1. Introduction

Advancements in drone technologies have guided drone researchers to design, manufacture, and implement small size drones in order to perform complicated missions which larger drones are unable to perform efficiently [1,2,3,4,5]. Recently, new types of small drones have been introduced in various configurations, with these being classified as Micro, Nano, and Pico Air Vehicles (MAV, NAV, and PAV) [1]. It should be noted that NAVs were considered as having a wingspan of 20 cm to 2.5 cm in this work. Since flapping wings are the best configuration with which to perform missions in very low Reynolds number environments, a number of researchers are focusing on this field. Flapping wing drones have advantages which include maneuverability, implementing different flight modes, and flexibility, etc.; they therefore often show better performance than other configurations such as fixed and rotary wings [6,7]. Flapping wings have become available for a wide spectrum of applications including civilian missions, which include search and rescue operations during natural disasters, and in military operations for suspect monitoring, reconnaissance, and planning attack strategies [8]. For example, these small drones with hovering capabilities can be used for search and rescue missions and can be carried by individual soldiers for reconnaissance operations while they are carrying various technologies [9].
One of the main challenges in the design process of tiny flapping wing drones is to increase their performance or endurance as much as possible. To this end, biological inspiration can be considered a sophisticated solution involving biology being able to inspire optimal designs during the design process. Nowadays, nearly a million species of flying insects and birds are recognized by biologists which can be investigated by researchers and designers in order to design and fabricate more applicable flapping wings [10]. Thus, a new trend in the drone community is to take inspiration from natural flying insects or birds to achieve improved flight capabilities and maneuverability [1,11].
Recently, flapping wing aerodynamics has generated a great deal of interest due to its potential application in micro drones [12]. One of the main components of flapping wing drones is the wing and its corresponding kinematics, which have important roles in the drone’s efficiency and performance [13,14,15]. Optimizing the wing shape and flapping kinematics allows for higher endurance during flight due to a reduction in the needed aerodynamic power [16,17]. There are various research projects focused on flapping wings with hovering and forward flight capabilities. A detailed understanding of avian wing shapes and kinematics is an essential step in tracing the evolution of the flight of natural flyers [18].
Brown [19] and Pennycuick [20] have studied bird and insect flight based on the measurements of wing kinematics. Pennycuick [21], Rayner [22], and Norberg [23] have also developed different theoretical models based on the experimental data of avian flapping wings [24]. More recently, Jenkins et al. [25], Tobalske and Dial [26], and Hedrick et al. [27] have made significant progress in understanding avian kinematics and Spedding et al. [28] have studied the effect of wake on the performance of these systems.
As mentioned above, various models have been used extensively to simulate locomotion and kinematics of flapping wings, with applications in biomechanics research [19,20,21,22,23,24,25,26,27,28], robotics [29], and computer animation [30]. These research studies have demonstrated the capability of the applied methods in simulating the kinematics, wake, and aerodynamic forces of flapping wings. Perhaps the most common application is the optimization of kinematics of two-dimensional flapping airfoils or three-dimensional wings in both hovering and forward flight modes [30,31]. In the hovering mode of flapping wings, Taha et al. [32], Berman and Wang [33], and Kurdi et al. [34] have applied different optimization methods for wing kinematics in order to minimize aerodynamic power using a quasi-steady method. In addition, in forward flight analysis, strip theory has been used to model the flapping motion of flapping wings in order to measure the aerodynamic forces involved [17]. Many researchers [35,36,37,38,39,40,41] have applied strip theory to determine the performance of flapping wing drones and natural flapping fliers. None of the mentioned studies have investigated the effects of wing shape on flight performance. In this work, seven insect wings, including those of the bumblebee, cranefly, fruitfly, hawk moth, honeybee, twisted parasite, and cicada, are patterned to investigate which wing shape requires the least aerodynamic power in order to select the optimal wing shape for forward and hovering flight.
In previous works performed by Hassanalian et al. [16,17], different methods were applied to select the best wing shapes between the aforementioned inspired wing shapes in two different cases, namely, the same wingspan and the same wing surface. For the forward flight study, a modified strip theory was employed and verified for two types of birds, the jackdaw and mew gull, and then applied for the seven wings, with a particular focus on the impacts of the dynamic twist on the performance of bio-inspired NAVs [17]. In this strip theory analysis, to determine the aerodynamic loads on the wing, each wingspan half was divided into 12 equal sections and then the aerodynamic properties were calculated as an integral over the full wingspan. For the similar wing surface investigation, the bumblebee and fruitfly wings were the optimal wing shapes from an aerodynamic point of view. When considering the same wingspan scenario, it was determined that the honeybee and bumblebee were the two optimal wing shapes for forward flight purposes. For the hovering flight study by Hassanalian et al. [17], a quasi-steady theory was implemented to select the optimal wing shapes for the two mentioned scenarios. In [17], the optimal flapping and pitch angles for the minimum required power were simultaneously determined. It was found that when considering the same wingspan, the twisted parasite and cicada require the least amount of power, while for the same surface, the twisted parasite and cranefly require less power than the other considered wing shapes.
In this work, in order to compare the wing shapes of the aforementioned insect-inspired wings and to investigate the kinematics and effects of different parameters on the aerodynamic forces and power in forward and hovering flight modes, predictive simulation methods in FlapSim software were used. Through FlapSim, the wing motion of the seven wing shapes was simulated and the corresponding aerodynamic forces, torques, and mechanical power were calculated. FlapSim uses a coupled blade-element momentum theory. The inclusion of momentum theory in the model accounts for the induced velocity in the flapping motion. The inclusion of this parameter enhances the accuracy of the model while maintaining a lower computational cost than unsteady aerodynamic models. Although some unsteady models may yield better aerodynamic performance predictions, such as Phan et al. [42], Parslew et al. [43] have shown that the model being used provides sufficient predictions at lower computational costs. In addition, Ghommem et al. [44] have validated FlapSim predications with experimental data for a flapping wing NAV (FWNAV), as can be seen in Figure 1. The FlapSim predictions agree with the experimental results obtained here but underpredict the thrust/power at higher flapping frequencies. The experiment was carried out for four wing configurations that differed in the location of the carbon spars that act as stiffeners for the wing.
The rest of this study is organized as follows: the wing shapes, kinematics, and kinetics in FlapSim are presented in Section 2. In Section 3, the moments of inertia for the wings are calculated and discussed. Aerodynamic analyses for the wings with the same wingspan and wing surface are shown in Section 4 and Section 5, respectively. The effects of different parameters on flight performance, forces, and required power are presented and discussed in Section 6. Finally, summary and conclusions are presented in Section 7.

2. Modeling of Bioinspired Wing Shapes in FlapSim

The generation of aerodynamic forces for weight support (lift) and for propulsion (thrust) is the main objective of the flight apparatus under forward and hovering flight conditions. Flapping wing drones generate these aerodynamic forces by using their wings [45]. Thus, wing shape plays an important role in their flight performance. To this end, the wing shapes of seven insects including the bumblebee, cicada, cranefly, fruitfly, hawkmoth, honeybee, and twisted parasite were extracted and patterned to investigate their performance in forward flight and hovering flight modes. In Figure 2, schematic views of the modeled wings in FlapSim are presented.
Applying the inverse dynamic insect model in FlapSim, the mechanical loads, torque, and power consumption for a wing with pre-defined kinematics are predicted. FlapSim employs a coupled blade-element momentum theory model to calculate the aerodynamic forces needed for weight support, propulsion, and consumed power [30,43,46]. Blade-element theory is a quasi-steady method similar to strip theory in which the wing is divided into multiple strips and the aerodynamic loads are integrated along the span of the wing. The wing is separated into twelve segments along the wingspan. The number of elements for the wing is determined using a convergence analysis. The inclusion of momentum theory predicts the induced velocity on the wing subjected to specific aerodynamic loads. It should be mentioned that this aerodynamic model considers a rigid wing. Due to the low values of reduced frequencies which are presented in Table 1 and Table 2, the use of a quasi-steady method is justified [47,48]. Although the low Reynolds numbers indicate an impact from the viscous effects, the low reduced frequencies justify the use of a quasi-steady approach. It has been shown that the aerodynamic response of a moving airfoil in flapping flight is close to the response predicted using potential flow-based approaches, such as Theodorsen, at low reduced frequencies [49,50]. More modeling details are discussed in the Appendix A. The dynamic model has some similarities to models of flight performance previously applied by Pennycuick [21] and Rayner [22]. The wings for a flapping wing NAV considered in this study have low moments of inertia, which can be seen in Table 1 and Table 2, and therefore the aerodynamic loads are much higher than the inertial loads and the torque applied to the wing root is approximately equal to the aerodynamic torque through each strip of the wing. The mechanical power presented in this work is the required power for the flapping motion. It is the product of the required torque (T) and the angular velocity of the wing root joint. It should be noted that mechanical power is different from aerodynamic power. The power that is calculated is always positive since the inertia effects are smaller than aerodynamic effects and the average values are calculated over the wingspan. Typically, for flapping wing robots with a no storage assumption, the negative part is usually eliminated and only the positive contribution is used. To model the dynamics of a flapping wing, first of all the reference systems which are used in this study should be defined. In order to model the kinematics of the inspired wings, it is essential to consider the movement of individual segments; therefore, three Euler angles relative to the freestream wind axes are defined and depicted in Figure 3, namely, the stroke-plane angle (γ), the wing elevation–depression angle (φ), and the wing pronation–supination angle (θ) [16]. Defining the stroke plane axes as (x1, y1, z1), the wing elevation axes as (x2, y2, z2), and the wing axes as (x3, y3, z3), which are all right handed systems with respect to the defined origin of the modeled flapping wing, schematic views of the system are shown for the stroke plane, wing elevation–depression, and wing pronation–supination, respectively.

3. Calculating the Moment of Inertia for the Wings

To calculate the moment of inertia for the wings of birds, insects, and flapping wing drones, it is assumed that the center of mass of the wing is close to the wing leading edge in the spanwise axis, where the majority of the skeletal and muscle structures are located [51,52]. Considering the shown coordinate system in Figure 2, Ixx and Izz, which are the moments of inertia associated with the wing rotation about the x and z axes, respectively, can be calculated as
I x x = I z z = m w r g 2
where rg and mw are the wing radii of gyration and mass, respectively. It should be mentioned that Iyy is equal to zero. The gyration radius is calculated as follows [30]:
r g = I / m w
If the wing is assumed as the summation of the strips, the moment of inertia of the semi wing can be calculated as [30]
I = i = 1 n ( m i d i 2 + 1 12 m i w 2 )
where the mi is the mass of each strip, di is the distance from the center of each strip to the center of the body, w is the width of each strip, and n is the number of the strips. By specifying the type of material used for the wings, the mass of each strip can be calculated as
m i = ρ w × s i = ρ w × w × c i
where ρw, si, and ci are the wing surface density, strip surface, and mean chord length, respectively [53]. Substituting Equation (4) into Equation (3), one obtains:
I = ρ w w i = 1 n c i ( d i 2 + 1 12 w 2 )
For the seven insects-inspired wing shapes, the moment of inertia can be calculated as a function of the wing material [54]. For different materials, the moment of inertia will be changed for each insect-inspired wing shape. Because just a comparison between different wing shapes was carried out, a specific type of material with 1 kg/m2 surface density was considered for all of the wings. In Table 1 and Table 2, the characteristics of each wing in both flight modes are shown. The Reynolds number and reduced frequency in forward flight were calculated using the mean aerodynamic chord for each of the wings. The effect of the material on the performance of a flapping wing nano air vehicle will be discussed in the following sections of this paper.
The kinematics of the inspired flapping wings are shown in Table 3 for both considered scenarios, that is, the hovering and forward flight modes. The kinematics for the analysis were chosen based on typical values for flapping wings of the same size [7]. It should be noted that as the size of a flapping wing is reduced, the flapping frequency must increase in order to maintain flight. Hassanalian et al. [7] has presented an empirical equation for flapping frequency estimation. In addition, Ghommem et al. [44] have recently published a work on the design and fabrication of a flapping wing NAV and have estimated a flapping frequency of 20–47 Hz. Their experimental verification of the flapping wing NAV was also carried out for 20–47 Hz.

4. Role of Wing Shape on Flight Performance of Flapping Wing Air Vehicles with Same Wingspan

Considering the defined kinematics in Table 3, an aerodynamic analysis was performed through FlapSim for the insect-inspired wing shapes in hovering and forward flight modes. The main purpose was to determine the most efficient design for the wings when considering the same values of elevation amplitude, pronation amplitude, and stroke plane. The plotted curves in Figure 4a–c show the flight performance of the insect-inspired wing shapes during forward flight when an equal wingspan is considered. Table 4 shows the average values that are depicted in the figures. In Figure 4a it can be seen that the twisted parasite wing shape generated a much higher lift force than the other wing shapes for the majority of the time. This was expected due to the much larger area of the twisted parasite wing. As seen in Table 4, for an equal wingspan during forward flight, the twisted parasite wing shape generated about double the lift force of the honeybee, which was the second highest of the insect-inspired wing shapes. Similarly, the twisted parasite shape generated much more thrust than the other wing shapes. It generated about three times the thrust of the honeybee, which was again the second highest. Although the twisted parasite generated the most lift and thrust, it can be seen in Figure 4c and Table 4 that it also required the most mechanical power. This could be due to the higher value of the wing area (lower aspect ratio) of the twisted parasite when the same wingspan is considered. It could be argued that when considering the same lift and thrust for the seven inspired wing shapes, the twisted parasite wing shape’s required mechanical power would be greatly reduced and be lower than the other wing shapes.
The plotted curves in Figure 5a–c show the aerodynamic performance of the seven insect-inspired wing shapes considered with an equal wingspan in hovering flight mode. Similar to the forward flight mode discussed previously, the twisted parasite wing shape generated much higher lift forces and a higher and more erratic thrust force due to the higher value of the wing area (lower aspect ratio) when considering the same wingspan. The twisted parasite wing shape generated about three times the lift force of the other wing shapes and a much greater thrust force. It also required much more mechanical power, but the same argument could be made that when considering an equal lift force, it would require less power than the six remaining wing shapes.

5. Role of Wing Shape on Flight Performance of Flapping Wings with Same Wing Surface

Next, the influence of the shape of the flapping wing on the lift, drag, and mechanical power for both forward flight and hovering was determined when considering the same wing surface. The plots in Figure 6 and Figure 7 compare the performance of the seven inspired wing shapes when all wing shapes are considered to have an equal wing surface. Aspect ratios were kept constant as to what is presented in Table 4 and wingspans were adjusted so all wings had an equal wing surface. Figure 6a–c show the performance of the seven wing shapes during forward flight. It can be seen from these figures that the twisted parasite exhibited lower lift and thrust forces; this was due to the lower value of the aspect ratio compared to the other insect-inspired wing shapes. This contrasts what was seen when all wings were considered to have an equal wingspan. While exhibiting lower average values for lift and thrust, as seen in Table 5, the twisted parasite wing shape also required a lower amount of mechanical power.
The plotted curves in Figure 7a–c compare normal force, axial force, and mechanical power of the seven inspired wing shapes in hovering flight mode. Unlike in forward flight mode, the twisted parasite showed higher values for both lift and thrust while requiring less mechanical power. This shows that in hovering flight mode the twisted parasite wing shape is optimal compared to other wing shapes studied. This result is similar to what was found by Hassanalian et al. [16] when using a quasi-steady approximation to model the aerodynamic loads.

6. Role of Kinematic Parameters on Flight Performance of Flapping Wing Air Vehicles

In order to show the sensitivity of the flapping wing air vehicle to the kinematic parameters, the effects of different factors, including flapping frequency, elevation amplitude, pronation amplitude, stroke-plane angle, flight speed, wing material, and wingspan, were investigated. This experiment, which was carried out on a honeybee planform as an example wing shape, was able to help to examine the effectiveness of each parameter in the design and consequently the performance of the flapping wing. In Table 6, the considered values for these analyses are shown. As can be seen in Table 6, in each analysis, one factor was changed and the other factors remained constant.
One of the important factors that needs to be analyzed carefully during the design process of the flapping wing is the flapping frequency, which is defined as the complete number of flapping cycles per second. In the kinematic design of flapping wings, the flapping frequency should be sufficient to allow the wings to provide the required lift and thrust to achieve takeoff and the required propulsion. Depending on the size of the flapping wing, different methods have been proposed, based on allometric data, to suggest the appropriate values for the frequencies of these drones. In the suggested methods, the required frequencies for flapping wings are usually expressed as a function of the other parameters, such as mass, wingspan, wing area, air density, and gravity acceleration of the drone [7]. In this part of the study, the impact of the flapping frequency on flight performance of flapping wings is examined. It can be seen in Figure 8a–d that as the flapping frequency increases, there is a sharp increase in lift, thrust, required mechanical power, and tip speed for the considered range of frequency. These figures show that flapping frequency is a parameter that needs to be considered throughout the design of a FWNAV. Although an increase in the flapping frequency results in an increase in the aerodynamic forces, the increase in required power is also significant. There are clearly trade-offs between an increase in the aerodynamic forcing and the corresponding required power that needs to be evaluated throughout the design phase. Table 7 and Figure 9 show the percent deviations in lift, thrust, and power from the base case shown in Table 3. The grey highlighted portion of Table 7 signifies the base case, previously presented in Table 3. As the frequency is increased, the required power is affected the most, followed by the thrust, and lastly the lift. The effect of frequency on the lift is almost linear when compared to the thrust and power. The obtained results are qualitatively similar to those of previous studies carried out by Djojodihardjo and Ramli [55], Srigrarom and Chan [56], and Mueller et al. [57].
Similarly, Figure 10a–d show that an increase in the elevation angle (flapping angle) generates an increase in the four parameters, normal and axial loads, mechanical power, and tip speed. These four parameters show a very rapid increase with an increase in the elevation angle. As elevation angle shows similar trends to flapping frequency, the same point can be made about the selection of the elevation angle. From a design point of view, it is important to consider and carefully select the elevation angle to meet the needs of the FWNAV for hovering or forward flight purposes. It should be noted that these two factors (flapping frequency and elevation angle) are generally constrained and engaged by the other physical and structural characteristics of the flapping wings, like the actuation mechanism. It is clear that an increase in the value of these parameters will require higher mechanical power, as shown in Figure 7c and Figure 8c, which should be provided by an actuation mechanism and propulsion system and generate higher values of tip speed, as indicated in Figure 8d and Figure 9d. Table 8 and Figure 11 show the lift, thrust, and power percent deviations from the base case as the elevation angle is changed. The grey highlighted portion of Table 8 signifies the base case, previously presented in Table 3. After a certain value, near 40 degrees, the trends are similar to the previous case. Lift increases nearly linearly with an increase in elevation angle, whereas thrust and power increase in a parabolic trend and are very close to one another. The discontinuity of lift and thrust seen in the graph matches that which is shown in Figure 10a. The percent deviation values are not as high as in the increasing frequency case, which is easy to see in Figure 11.
Another factor studied in this work was the pronation angle, which plays an important role in thrust generation during forward flight. An increase in pronation angle affected each of the four studied parameters differently, as depicted in Figure 12a–d. As the pronation angle increases, a decrease in the lift force can be observed. Alternatively, as the pronation angle increases, thrust increases to a certain point and then begins to decrease. This peak point is the pronation angle value that delivers the maximum thrust. As for the variation in mechanical power as a function of the pronation angle, it shows a decrease with the increase in pronation angle for one part of the flapping cycle and an increase for the other stroke. On the other hand, the tip speed is not affected by the change in pronation angle and stays steady throughout. Typically, drone designers do not deeply investigate the effects of the pronation angle in their design but the plots show that it is a parameter that needs to be taken into consideration. Usually, flapping wing drones are designed with only in-plane motion, that is, with no rotation in the wings. These graphs show that for thrust, the pronation angle has an optimal point near 30 degrees, with negligible changes in mechanical power and tip speed. Table 9 and Figure 13 show the percent deviations from the base case with an increase in pronation angle. The grey highlighted portion of Table 9 signifies the base case, previously presented in Table 3. The power is not greatly affected by the change in pronation angle and the lift sees a nearly linear decrease as the pronation angle is increased. The thrust increases until it reaches a peak value and then it decreases as the pronation angle increases. This matches what is seen in Figure 12b, but it is now clear to see that the optimum value is around 20 degrees.
To study the influences of the stroke angle (the angle of attack of the flapping wing with respect to the body with negative sign), we plotted, as seen in Figure 14a–d, the variations in normal force, axial force, mechanical power, and tip speed as a function of time and stroke angle. Clearly, as the stroke angle increases, there is a sharp decrease in the lift force. However, the thrust increases rapidly during the beginning of the change in stroke angle but eventually reaches a more stable value and remains nearly constant. Similarly, in the case of a change in pronation angle, as stroke angle increases, mechanical power shows a decrease for one part of the flapping cycle and an increase for the other half of the flapping cycle. With regard to tip speed, it is not affected by the increase in stroke angle. The results obtained from this analysis indicate the need to evaluate the stroke plane angle during the design phase. There is clearly a trade-off between lift and thrust with an increase in stroke angle that must be evaluated. It should be mentioned that the defined stroke angle is the negative sign of the angle of attack. Therefore, it can be concluded that as the angle of attack of the flapping wing increases, lift force is increases. It is seen in Figure 14b that the maximum thrust can be obtained at a stroke angle of zero degrees. The percent deviations for a change in stroke angle are shown in Table 10 and Figure 15. The grey highlighted portion of Table 10 signifies the base case, previously presented in Table 3. It is easy to see that an increase in the stroke angle (a decrease in the angle of attack) results in a steep decrease in lift force. The required power remains nearly unchanged and the thrust again has a distinct peak at the optimum stroke angle value, 0 degrees.
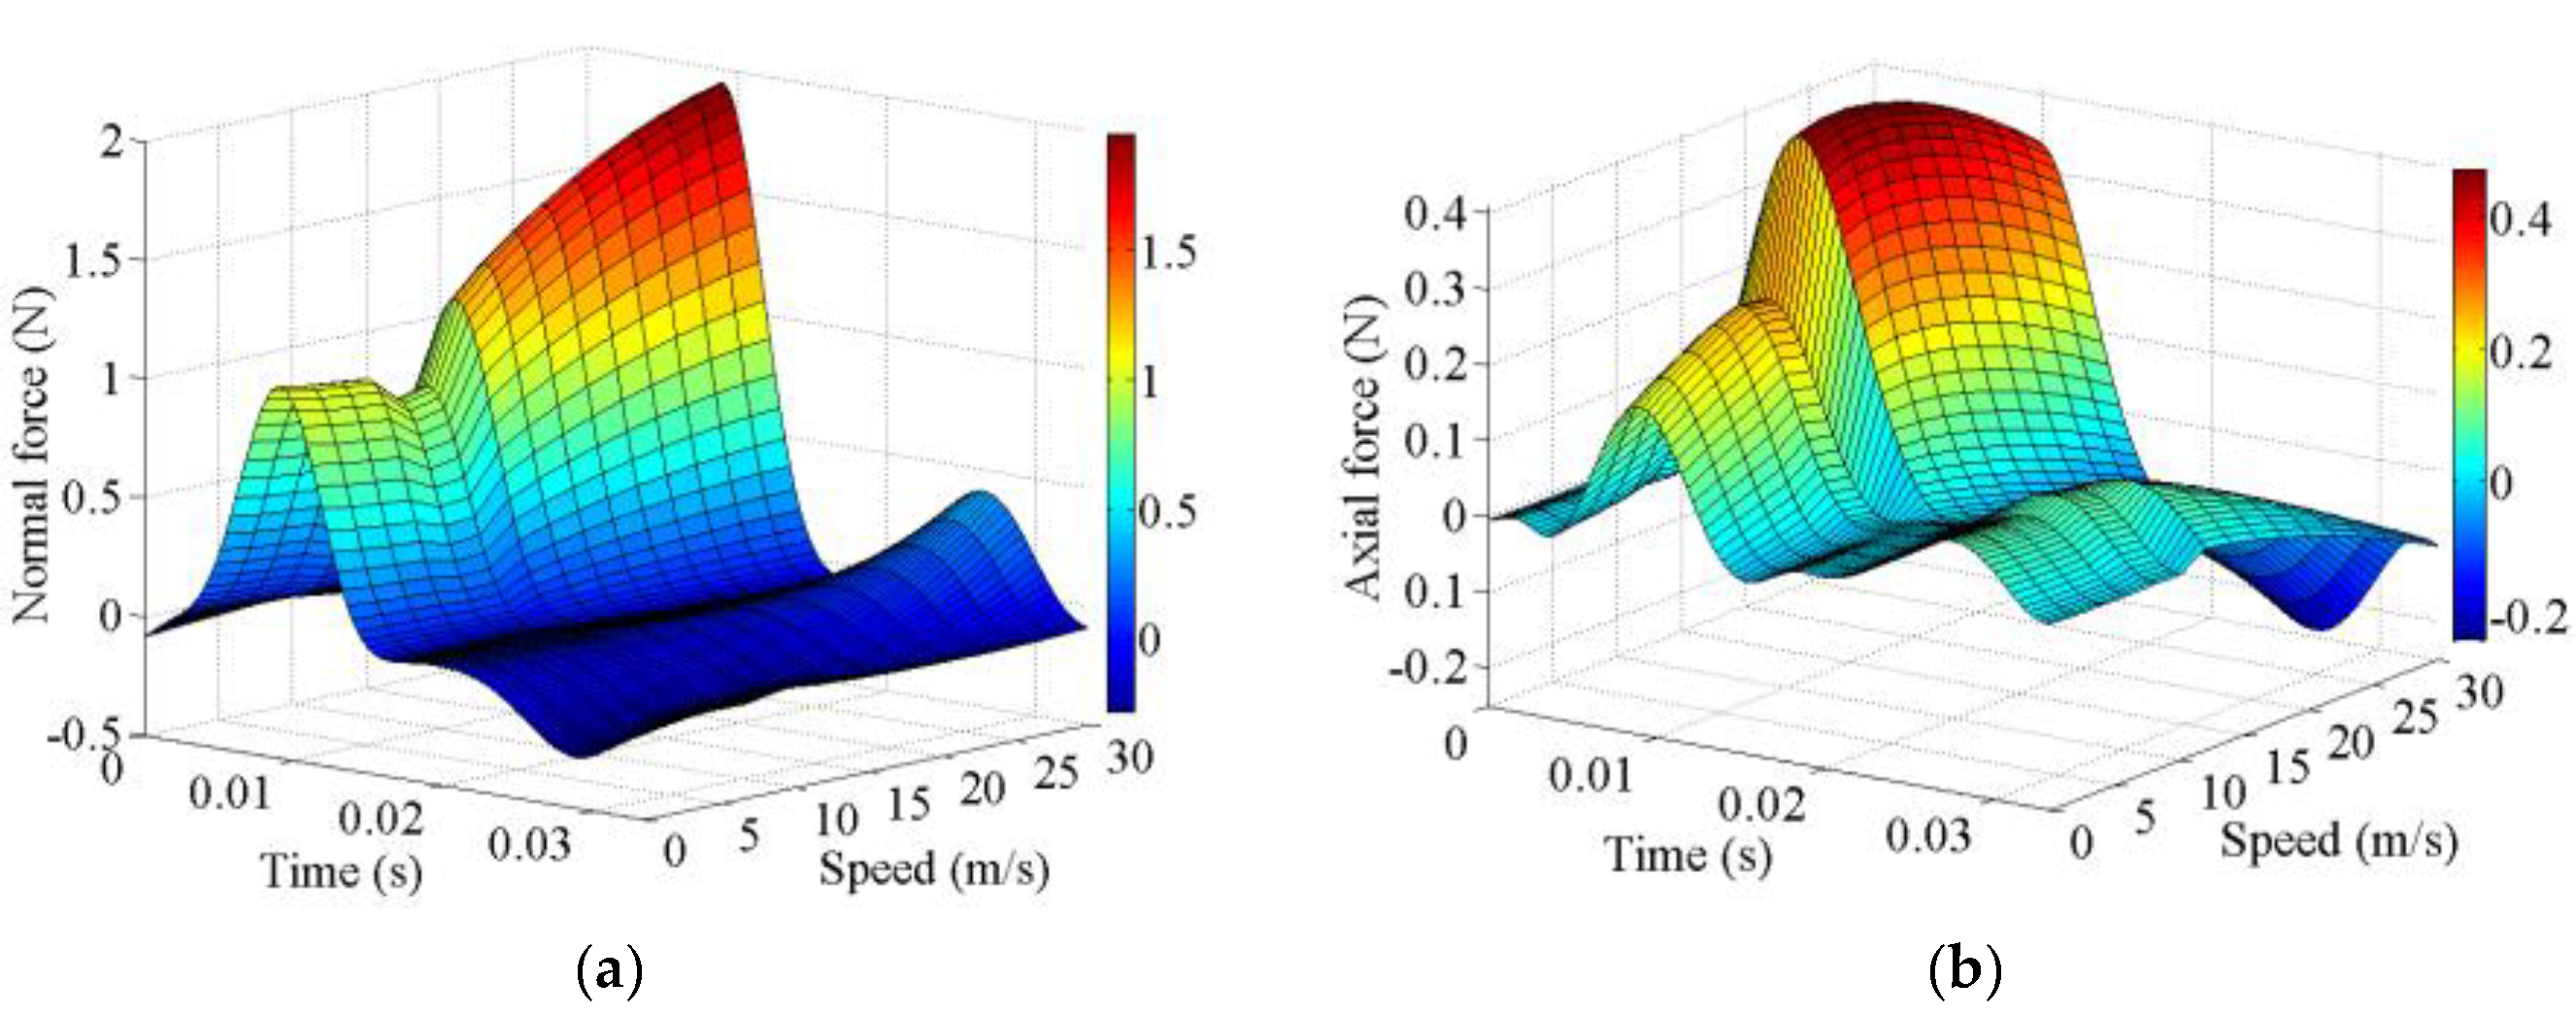
In Figure 16a–d the impact of flight speed on aerodynamic loads and tip speed is displayed. Clearly, an increase in flight speed leads to an increase in lift, thrust, and required mechanical power. Again, tip speed is not affected by an increase in flight speed since it is a function of the flapping frequency and wingspan only. Of course, flight speed must be considered throughout the design phase and it can be seen that it has a large impact on the performance of the air vehicle. Figure 16a–c show that there are clear optimum values for the flight speed for lift, thrust, and mechanical power. This shows that flight speed should be carefully selected for each flapping wing NAV to enhance the vehicle’s performance. Figure 17 depicts the percent deviations for an increase in speed. Power is not affected by the increase in speed but lift and thrust show similar trends until about 12 m/s, after which they are nearly inverses of each other. Lift increases while thrust decreases with an increase in speed. Although they show similar trends, the thrust is affected by an increase in speed more than lift, as shown by the value of the percent deviations.
Lastly, Figure 18a–c show that as wingspan increases, lift, thrust, and mechanical power all increase. It should be noted that the shown wingspan in Figure 18c is for a semi-wing. Wingspan should be carefully selected during the design process because although a large wingspan gives high aerodynamic forces, it also greatly increases the needed mechanical power. The graphs show a parabolic trend for lift, thrust, and power with wingspan because the scale of the wingspan will remain constant. To this end, with an increase in wingspan, the wing area will increase by the square of the wingspan and all of the generated forces are a function of the wing area ( L , T , P S S b 2 ). Figure 19 illustrates the percent deviation for an increase in wingspan. The lift, thrust, and mechanical power are all affected similarly. The thrust is affected by the increase in wingspan the most, followed by lift, and lastly the required power. A similar study can be carried out for other inspired wing shapes and also in hovering flight modes. The plots give visual representations of the tradeoffs arising from changing different flight parameters. They gives the designer the ability to understand the optimal values of various parameters and the corresponding effects. This study has also shown that using in-plane motion and neglecting pronation/supination is not beneficial because there is clearly an optimal value of the pronation angle. At the optimal pronation angle, thrust is greatly increased.

7. Conclusions

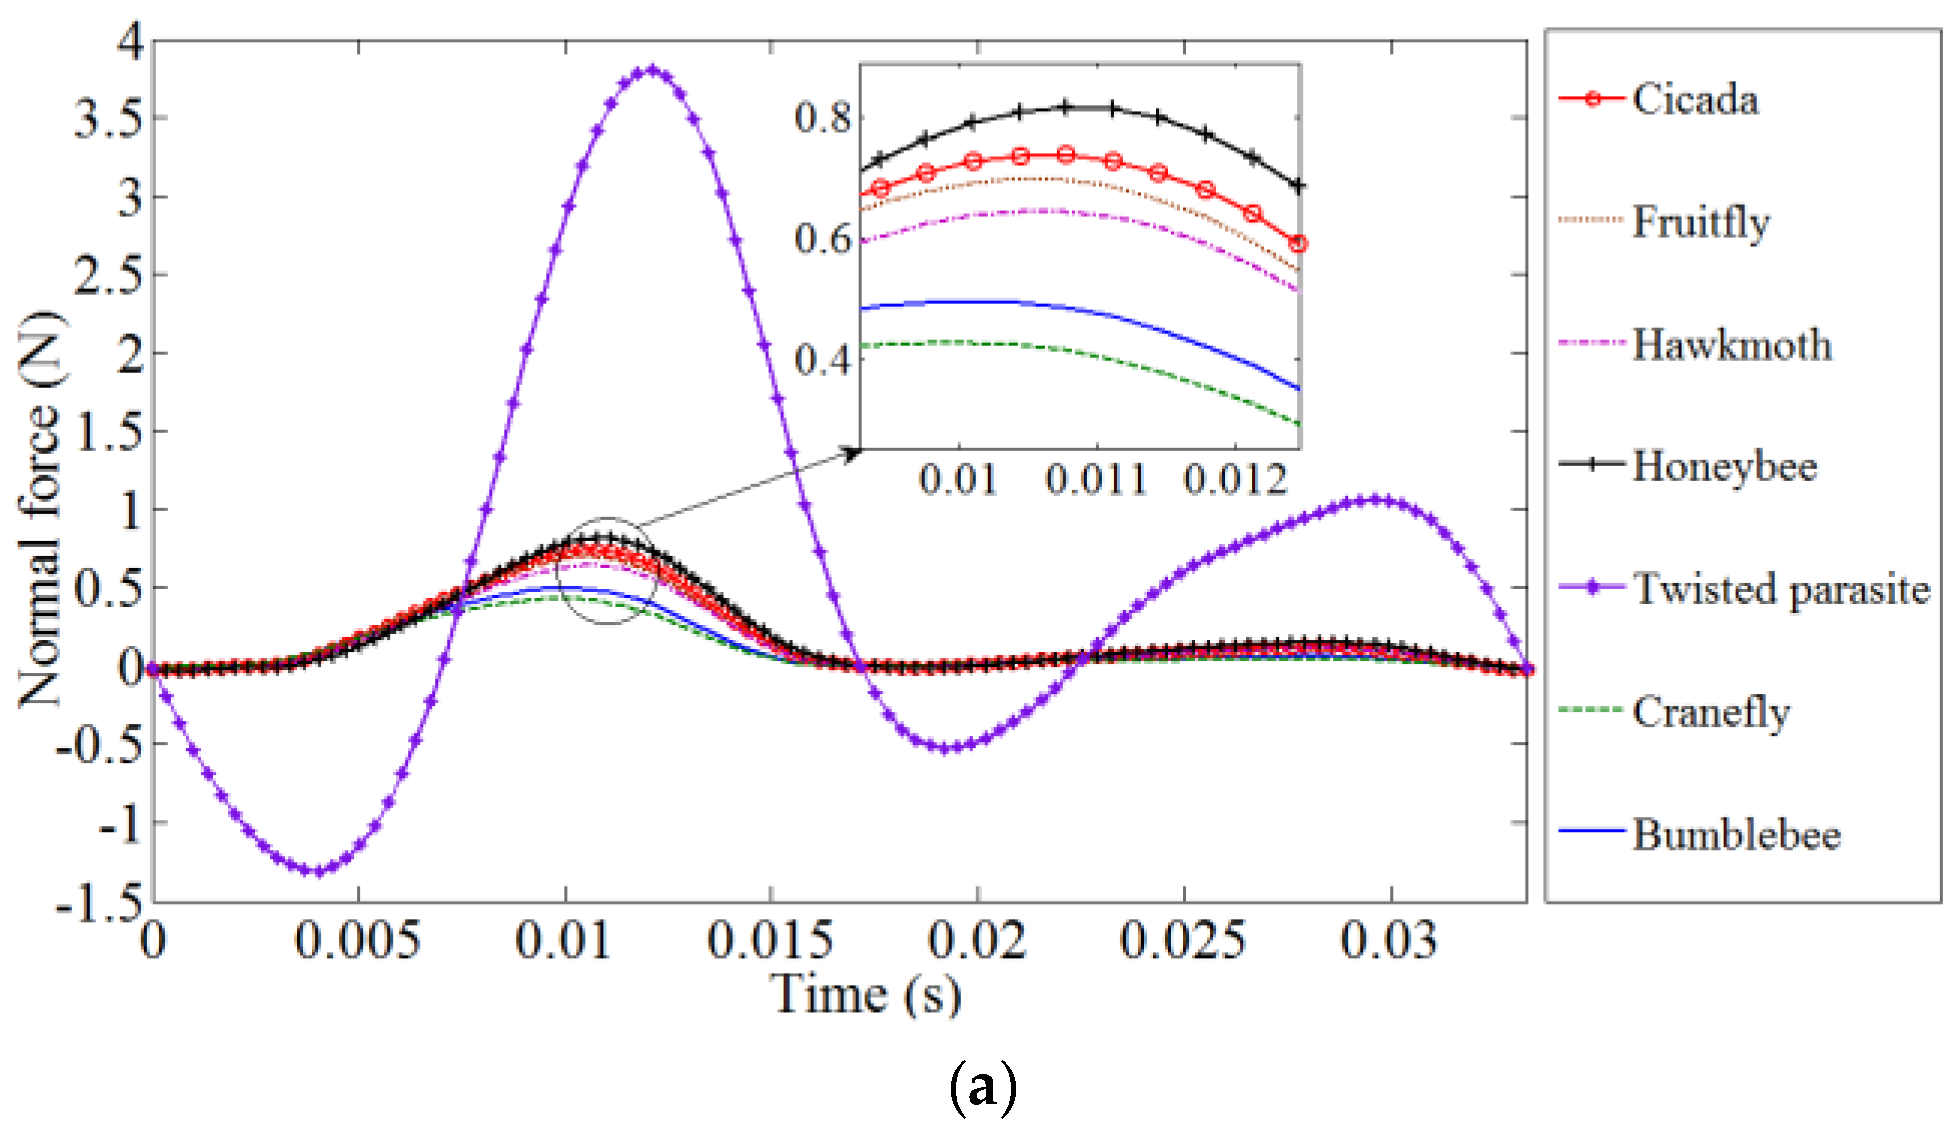
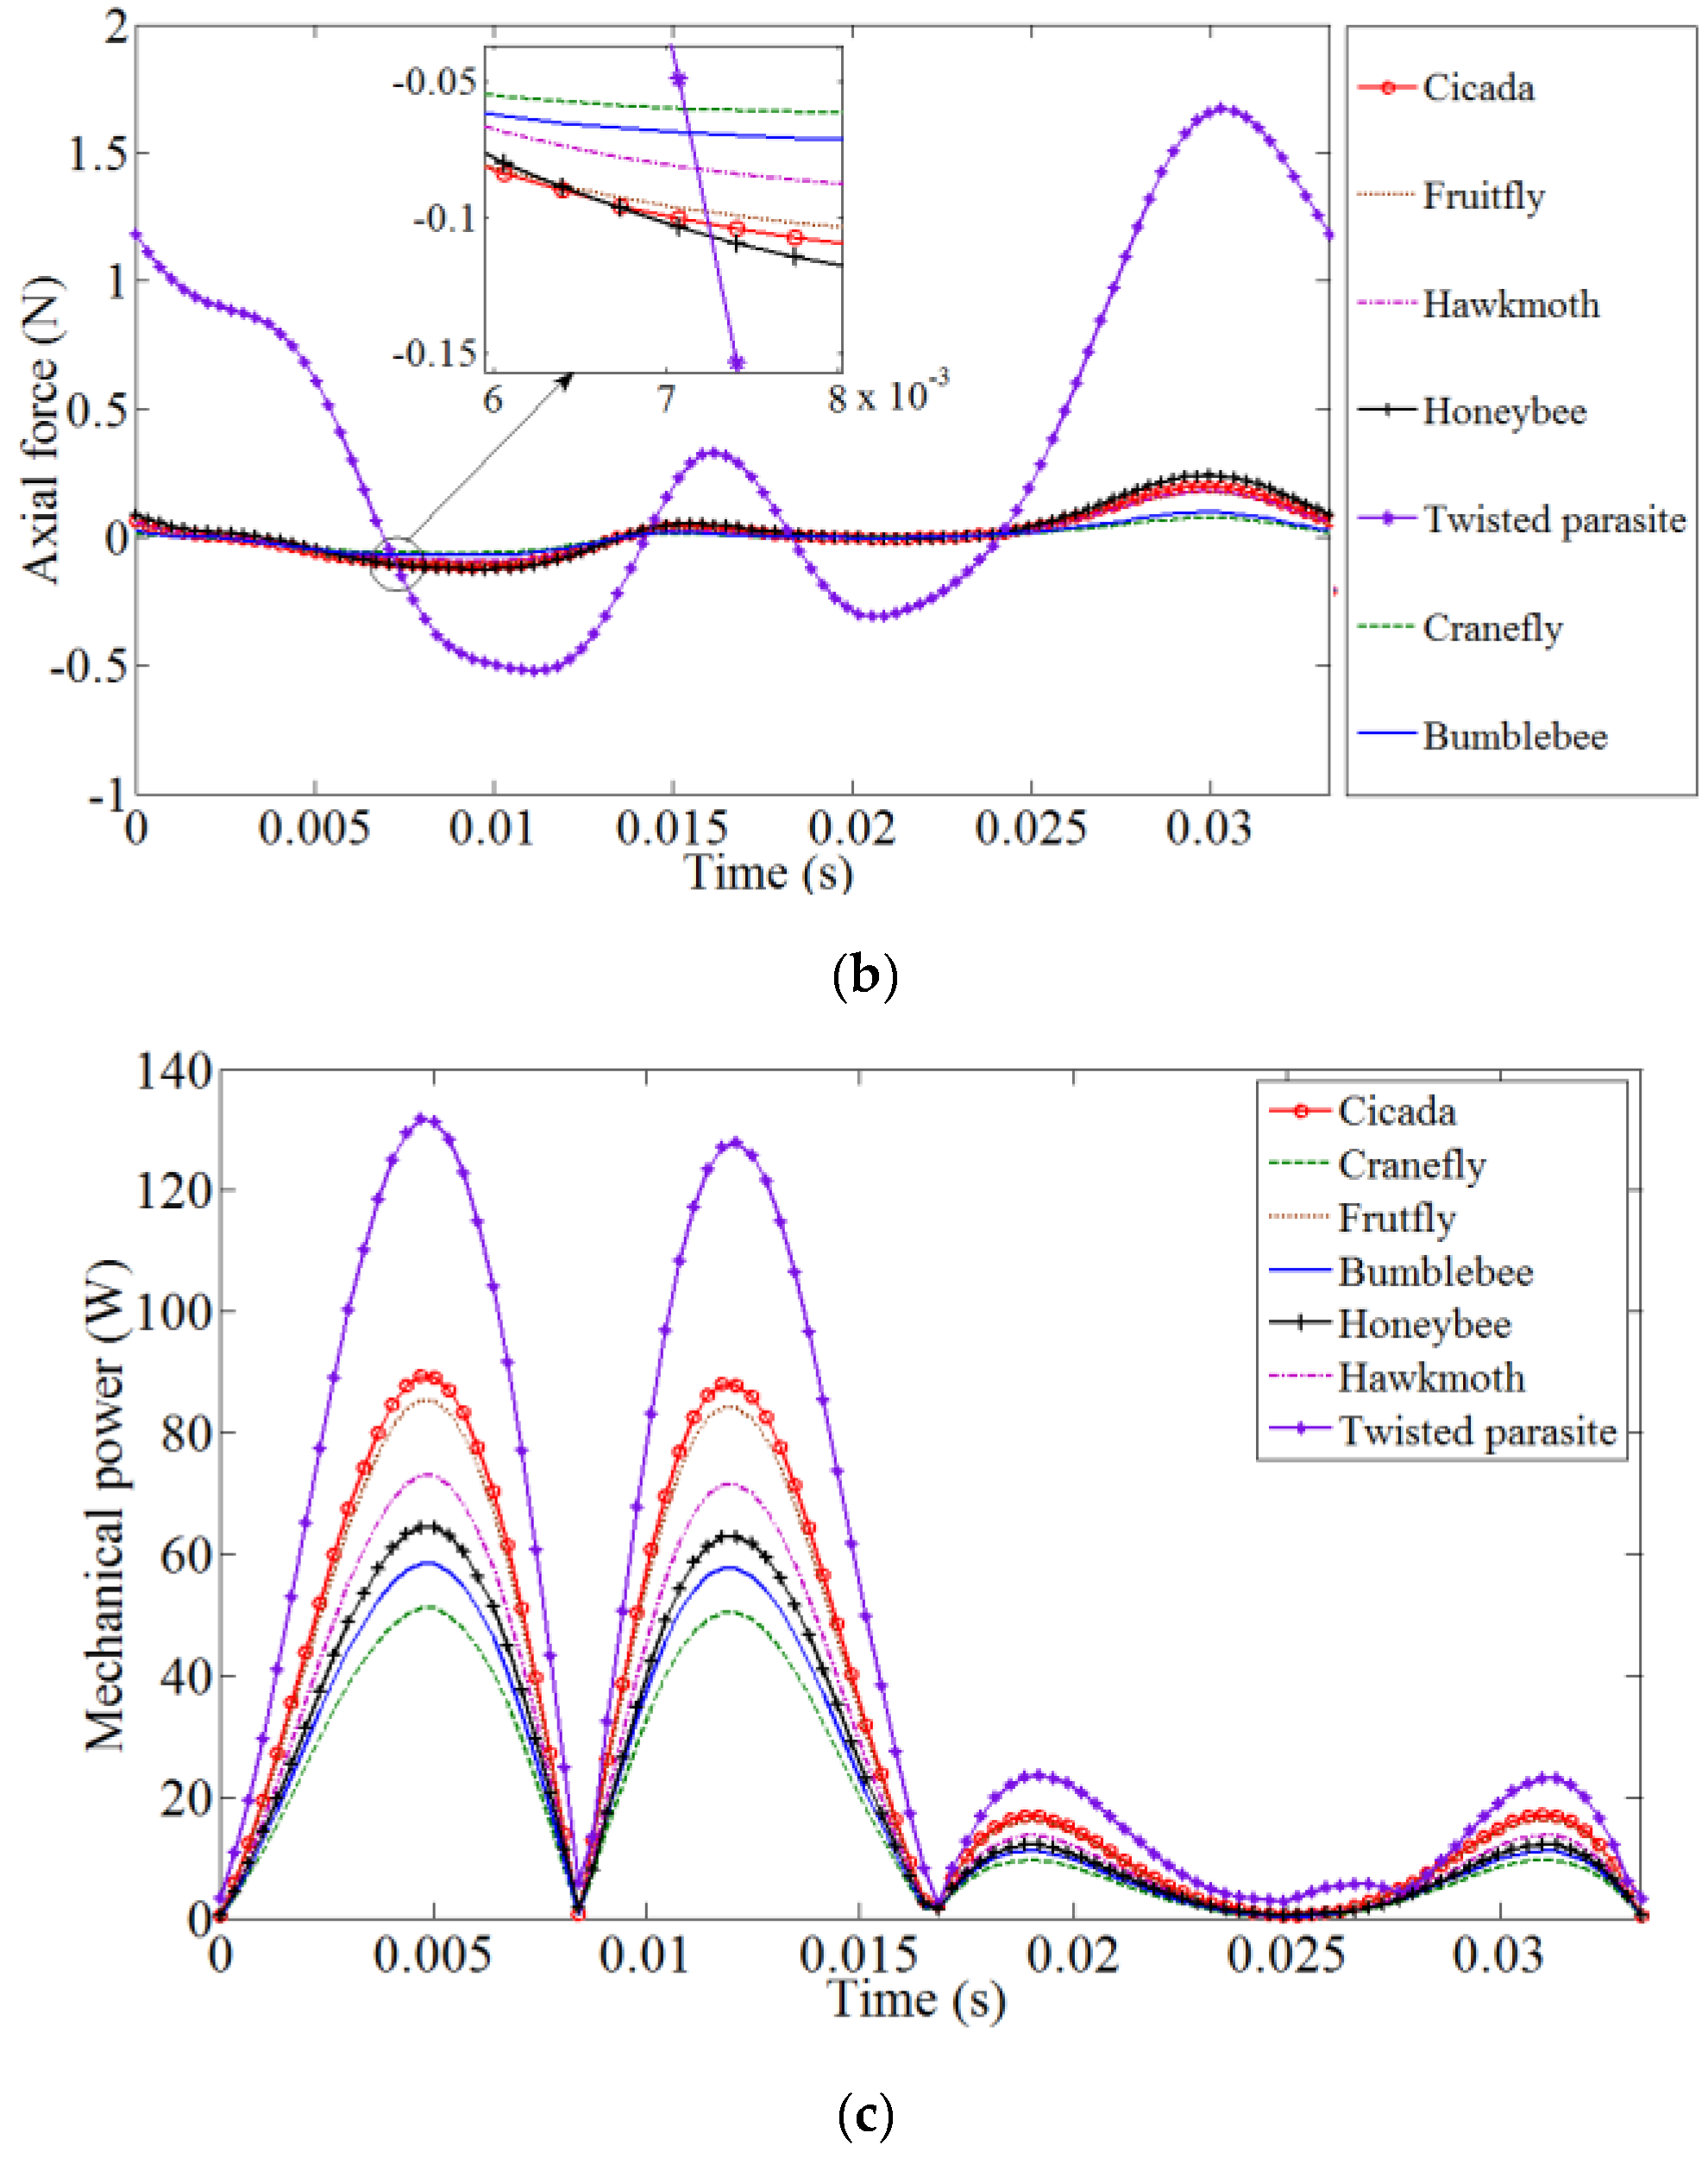
In this work, an aerodynamic analysis was performed for seven insect-inspired wings in FlapSim in order to investigate the role of wing geometry and kinematic parameters on the performance of flapping wing air vehicles. Two scenarios, namely, equal wingspan and equal wing surface, were considered for all wings and the wings were analyzed in hovering and forward flight modes. For a similar wingspan, it was shown that in hovering and forward flight modes, the twisted parasite wings, followed, in order, by the honeybee, cicada, fruitfly, hawkmoth, bumblebee, and cranefly wings generate a higher normal force. For the same wingspan, in forward flight, the twisted parasite wings generated the highest thrust, followed by the honeybee, cicada, fruitfly, hawkmoth, bumblebee, and lastly, the cranefly wings. Also, in hovering and forward modes, the twisted parasite wings, followed by the cicada, fruitfly, hawkmoth, honeybee, bumblebee, and cranefly wings were shown to require more mechanical power in similar defined kinematics, respectively. In the second scenario, for flapping wing NAVs with the same wing surface, it was shown that the honeybee, fruitfly, cranefly, hawkmoth, bumblebee, cicada, and twisted parasite wings, respectively, are able to generate higher lift and thrust forces during forward flight, while the fruitfly wings, followed by the cicada, hawkmoth, honeybee, bumblebee, cranefly, and twisted parasite wings, require higher values of mechanical power. In hovering mode, flapping wings with inspired wing shapes from the bumblebee, twisted parasite, cranefly, cicada, fruitfly, honeybee, and hawkmoth were observed to provide a higher lift force, while cranefly, bumblebee, fruitfly, cicada, hawkmoth, honeybee, and twisted parasite wings needed a higher value of mechanical power.
The inspired honeybee wing was analyzed for different values of flapping frequency, elevation amplitude, pronation amplitude, stroke-plane angle, flight speed, and wingspan. This study showed that the effect of the pronation angle is significant and should be considered in the design process. Typically, designers consider only in-plane motion and not the pronation angle. In this work it was proven that there exists an optimal value of the pronation angle to maximize thrust force.

Author Contributions

Writing—original draft, G.T.; Writing—review & editing, M.H. and A.A.

Funding

This research received no external funding.

Acknowledgments

The author, A. Abdelkefi, gratefully acknowledges the financial support provided by the New Mexico Consortium and Los Alamos National Laboratory.

Conflicts of Interest

The authors declare no conflict of interest.

Appendix A

A coordinate transformation is needed to transform the velocity vector in the freestream axes, V, to the freestream velocity vector in the wing axes, V∞3 [29]. This relationship is given by
V 3 = R θ R ϕ R γ V
where Rθ, Rφ, and Rγ are the rotation matrices with respect to the pronation-supination, elevation-depression, and stroke-plane angles, which are defined as follows [29]:
R γ = [ cos γ 0 sin γ 0 1 0 sin γ 0 cos γ ] , R ϕ = [ 1 0 0 0 cos φ sin φ 0 sin φ cos φ ] , R θ = [ cos θ 0 sin θ 0 1 0 sin θ 0 cos θ ]
To define the position of any point on the insect-inspired wings in the freestream axes following rotation of the root chord of the wing (shoulder), these matrices can be used. It should be noted that for both hovering and forward flight modes, the three mentioned Euler angles are applicable in the kinematics of flight. Considering a freestream wind axis system (x0, y0, z0) that translates to the movement of the flapping wing with respect to the Earth, the aerodynamic loads on the bird can be described as shown in Figure A1.
Figure A1. Free body diagram of modeled flapping wing.
Drones 03 00049 g0a1
A rotation of the flapping wing with respect to the Earth axes about yF,e by the angle of β yields axes that are aligned with the freestream wind axes, as shown in Figure A1. The equations of motion that describe the flight in any direction are defined as
F x 0 m g sin β D b = m a x 0
F z 0 m g cos β = 0
where F x 0 , F z 0 , D b , a x 0 , and m are axial and normal aerodynamic loads, body drag, and acceleration of the birds in the x0 direction, respectively. For forward flight with cruise speed and hovering flight, the equations can be expressed as shown in Table A1.
Table A1. The equations of motion for hovering and forward flight.
LoadsHovering FlightForward Flight
Axial F x 0 = D b + m g sin β 0 F x 0 = D b + m g sin β
Normal F z 0 = m g cos β F z 0 = m g cos β
Since the flapping wing drones have wings with a low moment of inertia, the aerodynamic loads are much higher than the inertial loads; therefore, the torque applied to the wing root is approximately equal to the aerodynamic torque which is transmitted through each strip of the wing. Thus, for stroke-plane axes, we have
T = i = 1 r i × F i
where T, ri, and Fi represent the torque, distance from the wing root to the ith control point, and the aerodynamic force acting on the ith control point, respectively. The mean mechanical power output at the wing root can be expressed as [30]
P = T · φ ˙ = 1 τ 0 τ i = 1 ( r i × F i ) · φ ˙ d t
where φ ˙ is the angular velocity of the wing root joint and τ is the flapping time period. In FlapSim, for aerodynamic modeling, a quasi-steady model (blade-element theory) is used which neglects the unsteady aerodynamic effects [30,44,45]. In this model, the aerodynamic force coefficients are the trigonometric functions of the angle of attack (α), which are independent of airfoil geometry [30]. The lift and drag coefficient in 2D are described as
c l = A sin ( 2 α )
c d = B + C cos ( 2 α )
where A, based on the recent experimental data from Usherwood [50], is 1.64, and values for B and C are equal to 1.135 and −1.05, respectively, for an arbitrary airfoil [50].
The instantaneous lift and drag forces can be expressed on the corresponding aerodynamic wing surface and are time averaged over a wingbeat, i.e.,
L = 1 τ 0 τ 1 2 ρ V 2 S c l d t
D = 1 τ 0 τ 1 2 ρ V 2 S c d d t
where L and D are the lift and drag forces, and S and ρ denote wing area and air density, respectively.

References

  1. Hassanalian, M.; Abdelkefi, A. Classifications, applications, and design challenges of drones: A review. Prog. Aerosp. Sci. 2017, 91, 99–131. [Google Scholar] [CrossRef]
  2. Meguid, S.A.; Su, Y.; Wang, Y. Complete morphing wing design using flexible-rib system. Int. J. Mech. Mater. Des. 2017, 13, 159–171. [Google Scholar] [CrossRef]
  3. Galantai, V.P.; Sofla, A.Y.N.; Meguid, S.A.; Tan, K.T.; Yeo, W.K. Bio-inspired wing morphing for unmanned aerial vehicles using intelligent materials. Int. J. Mech. Mater. Des. 2012, 8, 71–79. [Google Scholar] [CrossRef]
  4. Hassanalian, M.; Rice, D.; Abdelkefi, A. Evolution of space drones for planetary exploration: A review. Prog. Aerosp. Sci. 2018, 97, 61–105. [Google Scholar] [CrossRef]
  5. Pushpangathan, J.V.; Kandath, H.; Bhat, M.S. 75-mm Wingspan Fixed-Wing Nano Air Vehicle with a Novel Aircraft Configuration. IEEE Access 2018, 6, 74521–74535. [Google Scholar] [CrossRef]
  6. Wood, R.J. Liftoff of a 60mg flapping-wing MAV. In Proceedings of the 2007 IEEE/RSJ International Conference on Intelligent Robots and Systems, San Diego, CA, USA, 29 October–2 November 2007. [Google Scholar]
  7. Hassanalian, M.; Abdelkefi, A.; Wei, M.; Ziaei-Rad, S. A novel methodology for wing sizing of bio-inspired flapping wing micro air vehicles: Theory and prototype. Acta Mech. 2017, 228, 1097–1113. [Google Scholar] [CrossRef]
  8. Nonami, K.; Kendoul, F.; Suzuki, S.; Wang, W.; Nakazawa, D. Introduction. In Autonomous Flying Robots; Springer: Tokyo, Japan, 2010; pp. 1–29. [Google Scholar]
  9. Cai, G.; Dias, J.; Seneviratne, L. A survey of small-scale unmanned aerial vehicles: Recent advances and future development trends. Unmanned Syst. 2014, 2, 175–199. [Google Scholar] [CrossRef]
  10. Ho, S.; Nassef, H.; Pornsinsirirak, N.; Tai, Y.C.; Ho, C.M. Unsteady aerodynamics and flow control for flapping wing flyers. Prog. Aerosp. Sci. 2003, 39, 635–681. [Google Scholar] [CrossRef]
  11. Sabri, F.; Meguid, S.A. Flutter boundary prediction of an adaptive morphing wing for unmanned aerial vehicle. Int. J. Mech. Mater. Des. 2011, 7, 307. [Google Scholar] [CrossRef]
  12. Ke, X.; Zhang, W.; Cai, X.; Chen, W. Wing geometry and kinematic parameters optimization of flapping wing hovering flight for minimum energy. Aerosp. Sci. Technol. 2017, 64, 192–203. [Google Scholar] [CrossRef]
  13. Shyy, W.; Aono, H.; Chimakurthi, S.K.; Trizila, P.; Kang, C.K.; Cesnik, C.E.; Liu, H. Recent progress in flapping wing aerodynamics and aeroelasticity. Prog. Aerosp. Sci. 2010, 46, 284–327. [Google Scholar] [CrossRef]
  14. Ansari, S.A.; Knowles, K.; Zbikowski, R. Insectlike flapping wings in the hover part I: Effect of wing kinematics. J. Aircr. 2008, 45, 1945–1954. [Google Scholar] [CrossRef]
  15. De Margerie, E.; Mouret, J.B.; Doncieux, S.; Meyer, J.A. Artificial evolution of the morphology and kinematics in a flapping-wing mini-UAV. Bioinspir. Biomim. 2007, 2, 65. [Google Scholar] [CrossRef] [PubMed]
  16. Hassanalian, M.; Throneberry, G.; Abdelkefi, A. Investigation on the planform and kinematic optimization of bio-inspired nano air vehicles for hovering applications. Meccanica 2018, 53, 2273–2286. [Google Scholar] [CrossRef]
  17. Hassanalian, M.; Throneberry, G.; Abdelkefi, A. Wing shape and dynamic twist design of bio-inspired nano air vehicles for forward flight purposes. Aerosp. Sci. Technol. 2017, 68, 518–529. [Google Scholar] [CrossRef]
  18. Wang, X.; Clarke, J.A. The evolution of avian wing shape and previously unrecognized trends in covert feathering. Proc. R. Soc. B 2015, 282, 20151935. [Google Scholar] [CrossRef] [PubMed]
  19. Brown, R.H.J. The flight of birds. Biol. Rev. 1963, 38, 460–489. [Google Scholar] [CrossRef]
  20. Pennycuick, C.J. Mechanics of flight. In Avian Biology; Prentice Hall: Upper Saddle River, NJ, USA, 1975; Volume 5, pp. 1–75. [Google Scholar]
  21. Pennycuick, C.J. Bird Flight Performance; Oxford University Press: Oxford, UK, 1989. [Google Scholar]
  22. Rayner, J.M. Form and function in avian flight. In Current Ornithology; Springer: Boston, MA, USA, 1988; pp. 1–66. [Google Scholar]
  23. Norberg, U.M. Vertebrate Flight: Mechanics, Physiology, Morphology, Ecology and Evolution; Springer Science & Business Media: Berlin/Heidelberg, Germany, 2012; Volume 27. [Google Scholar]
  24. Tobalske, B.W. Biomechanics of bird flight. J. Exp. Biol. 2007, 210, 3135–3146. [Google Scholar] [CrossRef] [Green Version]
  25. Jenkins, F.A.; Dial, K.P.; Goslow, G.E. A cineradiographic analysis of bird flight: The wishbone in starlings is a spring. Science 1988, 241, 1495–1498. [Google Scholar] [CrossRef]
  26. Tobalske, B.; Dial, K. Flight kinematics of black-billed magpies and pigeons over a wide range of speeds. J. Exp. Biol. 1996, 199, 263–280. [Google Scholar]
  27. Hedrick, T.L.; Tobalske, B.W.; Biewener, A.A. Estimates of circulation and gait change based on a three-dimensional kinematic analysis of flight in cockatiels (Nymphicus hollandicus) and ringed turtle-doves (Streptopelia risoria). J. Exp. Biol. 2002, 205, 1389–1409. [Google Scholar] [PubMed]
  28. Spedding, G.R.; Hedenström, A.; Rosén, M. Quantitative studies of the wakes of freely flying birds in a low-turbulence wind tunnel. Exp. Fluids 2003, 34, 291. [Google Scholar] [CrossRef]
  29. Platzer, M.F.; Jones, K.D.; Young, J.; SLai, J.C. Flapping wing aerodynamics: Progress and challenges. AIAA J. 2008, 46, 2136–2149. [Google Scholar] [CrossRef]
  30. Parslew, B.; Crowther, W.J. Simulating avian wingbeat kinematics. J. Biomech. 2010, 43, 3191–3198. [Google Scholar] [CrossRef] [PubMed]
  31. Young, J. Numerical Simulation of the Unsteady Aerodynamics of Flapping Airfoils. Ph.D. Thesis, University of New South Wales, Sydney, Australia, 2005. [Google Scholar]
  32. Taha, H.E.; Hajj, M.R.; Nayfeh, A.H. Wing kinematics optimization for hovering micro air vehicles using calculus of variation. J. Aircr. 2013, 50, 610–614. [Google Scholar] [CrossRef]
  33. Berman, G.J.; Wang, Z.J. Energy-minimizing kinematics in hovering insect flight. J. Fluid Mech. 2007, 582, 153–168. [Google Scholar] [CrossRef] [Green Version]
  34. Kurdi, M.; Stanford, B.; Beran, P. Kinematic optimization of insect flight for minimum mechanical power. AIAA Pap. 2010, 1420. [Google Scholar] [CrossRef]
  35. Beng, T.W. Dynamics and Control of a Flapping Wing Aircraft. Master’s Thesis, National University of Singapore, Singapore, 2003. [Google Scholar]
  36. Kamakoti, R.; Berg, M.; Ljungqvist, D.; Shyy, W. A computational study for biologi-cal flapping wing flight. Trans. Aeronaut. Astronaut. Soc. 2000, 32, 265–279. [Google Scholar]
  37. Benedict, M.; Sudhakar, K.; Issac, K.K. Aeroelastic Design and Manufacture of an Efficient Ornithopter Wing; Department of Aerospace Engineering, Indian Institute of Technology: Bombay, Mumbai, 2004. [Google Scholar]
  38. Zakaria, M.Y.; Elshabka, A.M.; Bayoumy, A.M.; AbdElhamid, O.E. Numerical aero-dynamic characteristics of flapping wings. In Proceedings of the 13th International Conference on Aerospace Sciences & Aviation Technology, ASAT-13, Cairo, Egypt, 26–28 May 2009. [Google Scholar]
  39. DeLaurier, J.D. An aerodynamic model for flapping-wing flight. Aeronaut. J. 1993, 97, 125–130. [Google Scholar]
  40. Kim, D.K.; Lee, J.S.; Lee, J.Y.; Han, J.H. An aeroelastic analysis of a flexible flapping wing using modified strip theory. Int. Soc. Opt. Photon. 2008. [Google Scholar] [CrossRef]
  41. Djojodihardjo, H.; Ramli, A.S.S.; Wiriadidjaja, S. Kinematic and aerodynamic modelling of flapping wing ornithopter. Procedia Eng. 2012, 50, 848–863. [Google Scholar]
  42. Phan, H.; Truong, Q.; Au, T.; Park, H. Optimal flapping wing for maximum vertical aerodynamic force in hover: Twisted or flat? Bioinspir. Biomim. 2016, 11, 4. [Google Scholar] [CrossRef] [PubMed]
  43. Parslew, B. Simulating Avian Wingbeats and Wakes. Ph.D. Thesis, University of Manchester, Manchester, UK, 2012. [Google Scholar]
  44. Ghommem, M.; Hassanalian, M.; Al-Marzooqi, M.; Throneberry, G.; Abdelkefi, A. Sizing process, aerodynamic analysis, and experimental assessment of a biplane flapping wing nano air vehicle. J. Aerosp. Eng. 2019. [Google Scholar] [CrossRef]
  45. Hassanalian, M.; Abdelkefi, A. Effective design of flapping wing actuation mechanisms: Theory and experiments. In Proceedings of the 54th AIAA Aerospace Sciences Meeting, San Diego, CA, USA, 4–8 January 2016; p. 1745. [Google Scholar]
  46. Parslew, B.; Crowther, W.J. Theoretical modelling of wakes from retractable flapping wings in forward flight. PeerJ 2013, 1, e105. [Google Scholar] [CrossRef] [PubMed] [Green Version]
  47. Murua, J.; Palacios, R.; Graham, J.M.R. Applications of the unsteady vortex-lattice method in aircraft aeroelasticity and flight dynamics. Prog. Aerosp. Sci. 2012, 55, 46–72. [Google Scholar] [CrossRef] [Green Version]
  48. Poling, D.R.; Telionis, D.P. The response of airfoils to periodic disturbances-The unsteady Kutta condition. AIAA J. 1986, 24, 193–199. [Google Scholar] [CrossRef]
  49. Taha, H.; Rezaei, A.S. Viscous extension of potential-flow unsteady aerodynamics: The lift frequency response problem. J. Fluid Mech. 2019, 868, 141–175. [Google Scholar] [CrossRef]
  50. Brunton, S.L.; Rowley, C.W.; Williams, D.R. Reduced-order unsteady aerodynamic models at low Reynolds numbers. J. Fluid Mech. 2013, 724, 203–233. [Google Scholar] [CrossRef]
  51. Whitney, J.P. Design and Performance of Insect-Scale Flapping-Wing Vehicles. Ph.D. Thesis, Harvard University, Cambridge, CA, USA, 2012. [Google Scholar]
  52. Berg, C.; Rayner, J. The moment of inertia of bird wings and the inertial power requirement for flapping flight. J. Exp. Biol. 1995, 198, 1655–1664. [Google Scholar]
  53. Usherwood, J.R. The aerodynamic forces and pressure distribution of a revolving pigeon wing. Exp. Fluids 2009, 46, 991–1003. [Google Scholar] [CrossRef]
  54. Hassanalian, M.; Abdelkefi, A. Methodologies for weight estimation of fixed and flapping wing micro air vehicles. Meccanica 2017, 52, 2047–2068. [Google Scholar] [CrossRef]
  55. Djojodihardjo, H.; Ramli, A.S.S. Modeling studies of bi-and quad-wing flapping ornithopter kinematics and aerodynamics. Int. J. Autom. Mech. Eng. 2014, 9, 1669. [Google Scholar] [CrossRef]
  56. Srigrarom, S.; Chan, W.L. Ornithopter type flapping wings for autonomous micro air vehicles. Aerospace 2015, 2, 235–278. [Google Scholar] [CrossRef]
  57. Mueller, D.; Bruck, H.A.; Gupta, S.K. Measurement of thrust and lift forces associated with drag of compliant flapping wing for micro air vehicles using a new test stand design. Exp. Mech. 2010, 50, 725–735. [Google Scholar] [CrossRef]
Figure 1. Views of (a) power consumption and (b) thrust to power ratio versus flapping frequency [44].
Drones 03 00049 g001
Figure 2. Schematic views of insect-inspired wing shapes in FlapSim.
Drones 03 00049 g002
Figure 3. Schematic views of defined coordinate systems for (a) stroke-plane, (b) elevation-depression, and (c) pronation-supination.
Drones 03 00049 g003
Figure 4. The time history of (a) normal force, (b) axial force, and (c) mechanical power for inspired wings with the same wingspan (20 cm) in forward flight for one flapping cycle.
Drones 03 00049 g004aDrones 03 00049 g004b
Figure 5. The time history of (a) normal force, (b) axial force, and (c) mechanical power for inspired wings with the same wingspan (20 cm) in hovering flight for one flapping cycle.
Drones 03 00049 g005aDrones 03 00049 g005b
Figure 6. The time history of (a) normal force, (b) axial force, and (c) mechanical power for inspired wings with the same wing surface (S = 0.005 m2) in forward flight for one flapping cycle.
Drones 03 00049 g006aDrones 03 00049 g006b
Figure 7. The time history of (a) normal force, (b) axial force, and (c) mechanical power for inspired wings with the same wing surface (S = 0.005 m2) in hovering flight for one flapping cycle.
Drones 03 00049 g007aDrones 03 00049 g007b
Figure 8. The effects of the flapping frequency on (a) normal force, (b) axial force, (c) mechanical power, and (d) tip speed.
Drones 03 00049 g008
Figure 9. Percent deviations in lift, thrust, and power for frequency.
Drones 03 00049 g009
Figure 10. The effects of elevation angle on (a) normal force, (b) axial force, (c) mechanical power, and (d) tip speed.
Drones 03 00049 g010aDrones 03 00049 g010b
Figure 11. Percent deviations in lift, thrust, and power for elevation angle.
Drones 03 00049 g011
Figure 12. The effects of pronation angle on (a) normal force, (b) axial force, (c) mechanical power, and (d) tip speed.
Drones 03 00049 g012
Figure 13. Percent deviations in lift, thrust, and power for pronation angle.
Drones 03 00049 g013
Figure 14. The effects of stroke angle on (a) normal force, (b) axial force, (c) mechanical power, and (d) tip speed.
Drones 03 00049 g014
Figure 15. Percent deviations in lift, thrust, and power for stroke angle.
Drones 03 00049 g015
Figure 16. The effects of flight speed on (a) normal force, (b) axial force, (c) mechanical power, and (d) tip speed.
Drones 03 00049 g016aDrones 03 00049 g016b
Figure 17. Percent deviations in lift, thrust, and power for speed.
Drones 03 00049 g017
Figure 18. The effects of semi-wingspan on (a) normal force, (b) axial force, and (c) tip speed.
Drones 03 00049 g018
Figure 19. Percent deviations in lift, thrust, and power for wingspan.
Drones 03 00049 g019
Table 1. Wing parameters for wings with an equal wingspan of b = 20 cm (wing length of 10 cm).
Inspired WingMoment of Inertia (ρw × 10−6) m4Semi Wing Surface (10−4 × m2)Mass of the Semi Wing (10−4 × kg)Gyration Radius (m)Reynolds Number (×104)Reduced Frequency
Honeybee7.83137.39337.3930.04574.17930.0819
Bumblebee7.08425.52125.5210.05272.76650.0542
Cicada10.84335.41735.4170.05534.00900.0785
Fruitfly10.34833.98233.9820.05523.81280.0747
Hawkmoth8.84535.40835.4080.05003.73930.0733
Cranefly6.19820.45920.4590.05502.24180.0439
Twisted Parasite16.36858.18658.1860.05306.76400.1325
Table 2. Wing parameters for wings with an equal wing surface of S = 0.005 m2 (a semi wing surface of 0.0025 m2).
Inspired WingMoment of Inertia (ρw × 10−6) m4Wingspan (m)Mass of the Semi Wing (10−4 × kg)Gyration Radius (m)Reynolds Number (×104)Reduced Frequency
Honeybee3.55949 0.1639250.03773.43000.0672
Bumblebee6.93822 0.1985250.05272.75630.0540
Cicada5.94784 0.1718250.04883.44020.0674
Fruitfly6.197 0.1729250.04983.29730.0646
Hawkmoth4.3797 0.1674250.04193.13400.0614
Cranefly9.41891 0.2216250.06142.48060.0486
Twisted Parasite2.87916 0.1292250.03394.36920.0856
Table 3. The kinematics of the inspired flapping wing in hover and forward modes.
Parameter SymbolHoveringForward
MassW15 g15 g
Freestream velocityU0 m/s15 m/s
Flapping frequencyF30 Hz30 Hz
Wingspanb20 cm20 cm
Elevation amplitudeΦ80 deg75 deg
Pronation amplitudeΘ60 deg15 deg
Stroke planeΓ−80 deg−10 deg
Table 4. Aerodynamic loads and power of wings with 20 cm wingspan (wing length of 10 cm).
Parameter ForwardHovering
Aerodynamic LoadsAspect RatioLift (N)Thrust (N)Mechanical Power (W)Lift (N)Thrust (N)Mechanical Power (W)
Honeybee5.370.2440.109819.290.1950.026021.98
Bumblebee7.880.1650.058217.580.1250.001620.01
Cicada5.900.2390.103726.760.1820.016630.57
Fruitfly5.980.2320.097825.620.1740.012129.25
Hawkmoth5.640.2040.076221.810.1600.014224.92
Cranefly9.820.1410.051415.370.1080.000017.48
Twisted Parasite3.340.4890.347839.110.6530.376444.97
Table 5. Aerodynamic loads and power of wings with a wing surface of S = 0.005 m2.
Parameter ForwardHovering
Aerodynamic LoadsAspect RatioLift (N)Thrust (N)Mechanical Power (W)Lift (N)Thrust (N)Mechanical Power (W)
Honeybee5.370.24420.1098017.230.10990.013929.982
Bumblebee7.880.16350.0598914.710.18070.0168419.65
Cicada5.900.14060.0561323.430.11800.0098716.79
Fruitfly5.980.23220.0978025.620.11400.0071317.49
Hawkmoth5.640.20430.0761821.840.09080.0076212.35
Cranefly9.820.20510.0837912.290.1504−0.000426.63
Twisted Parasite3.340.00980.033216.9440.16550.060697.969
Table 6. The kinematics and geometrics of a honeybee planform in forward flight mode.
Parameter f (Hz)φ (deg)θ (deg)γ (deg)U (m/s)mw (g)b (m)
Frequency5–407515−10150.003740.2
Elevation angle3025–8515−10150.003740.2
Pronation30750–60−10150.003740.2
Stroke angle307515−20–20150.003740.2
Speed307515−105–300.003740.2
Semi wing mass307515−10150.0002–0.0050.2
Wingspan307515−10150.003740.1–0.5
Table 7. Percent deviations (PD) in lift, thrust, and power for frequency.
FrequencyLiftPD for LiftThrustPD for ThrustPowerPD for Power
50.0438−82.0492−0.0366−133.3330.1254−99.3499
100.0726−70.2459−0.0211−119.2170.7531−96.0959
150.1064−56.39340.0019−98.26962.437−87.3665
200.1461−40.1230.0317−71.12935.7176−70.3598
250.1919−21.35250.0678−38.251411.1678−42.1058
300.244200.1098019.28990
350.302924.139340.157343.2604730.605358.65889
400.367950.778690.2191.2568345.6401136.5998
450.439380.040980.2678143.89864.9202236.5485
500.5168111.80330.3305201.001888.9971361.3639
550.6004146.06560.3979262.3862118.4174513.8797
600.6898182.70490.47328.051153.6862696.7144
Table 8. PD in lift, thrust, and power for elevation angle.
Elevation AngleLiftPD for LiftThrustPD for ThrustPowerPD for Power
250.1028−57.86890.0056−94.89982.9928−84.4852
30−0.0011−100.4510.0064−94.17123.8806−79.8828
350.0239−90.20490.0053−95.1734.8886−74.6573
400.124−49.18030.0333−69.67216.046−68.6573
450.1477−39.46720.036−67.21317.3867−61.7071
500.1658−32.04920.0435−60.38258.9168−53.775
550.1822−25.32790.0534−51.366110.6252−44.9186
600.198−18.85250.0653−40.528212.519−35.1011
650.2135−12.50.0787−28.324214.596−24.3339
700.2288−6.229510.0936−14.754116.8528−12.6345
750.244200.1098019.28990
800.25966.3934430.127215.8469921.907913.57128
850.275212.786890.145832.7868924.707528.0845
Table 9. PD in lift, thrust, and power for pronation angle.
PronationLiftPD for LiftThrustPD for ThrustPowerPD for Power
00.312327.99180.0528−51.912619.87843.050285
50.294320.614750.0789−28.142119.67011.970451
100.271411.229510.098−10.746819.4810.99015
150.244200.1098019.28990
200.2129−12.74590.1143.82513719.0975−0.99793
250.1781−27.00820.11040.54644818.9483−1.77138
300.1406−42.3770.0991−9.7449918.83−2.38466
350.101−58.60660.0803−26.86718.7274−2.91654
400.0601−75.36890.0543−50.546418.7028−3.04406
450.0189−92.25410.0216−80.327918.7081−3.01659
50−0.0216−108.852−0.0171−115.57418.7295−2.90565
55−0.0606−124.836−0.061−155.55618.8118−2.479
60−0.0969−139.713−0.1093−199.54518.908−1.9803
Table 10. PD in lift, thrust, and power for stroke angle.
Stroke AngleLiftPD for LiftThrustPD for ThrustPowerP.D. for Power
−200.362648.606560.0679−38.160319.58611.534992
−150.304324.713110.0926−15.664819.43130.732504
−100.244200.1098019.28990
−50.1837−24.71310.11989.10746819.1579−0.68481
00.1239−49.22130.122611.6575619.0569−1.2084
50.066−72.95080.11898.28779618.9938−1.53551
100.0108−95.57380.109−0.728618.9399−1.81493
15−0.0408−116.7210.0935−14.845218.9019−2.01192
20−0.0879−136.0250.0733−33.242318.8943−2.05132

