
Web-Based Parametric Effort Estimation for Mobile Application Development †

 , and
, and
Abstract
:1. Introduction
2. Related Works
2.1. Mobile Application Estimation Models and Systems
2.2. Comparison of Cost Drivers
3. Proposed System
3.1. Cost Drivers
3.2. System Interface
4. Result and Discussion
5. Conclusions
Author Contributions
Funding
Institutional Review Board Statement
Informed Consent Statement
Data Availability Statement
Acknowledgments
Conflicts of Interest
References
- Shahwaiz, S.; Malik, A.; Sabahat, N. A parametric effort estimation model for mobile apps. In Proceedings of the 19th International Multi-Topic Conference (INMIC), Islamad, Pakistan, 5–6 December 2016; pp. 1–6. [Google Scholar]
- Finnie, G.; Wittig, G.; Desharnais, J.M. A comparison of software effort estimation techniques: Using function points with neural networks, case-based reasoning and regression models. J. Syst. Softw. 1997, 39, 281–289. [Google Scholar] [CrossRef]
- Albrecht, A.J. Measuring application development productivity. In Proceedings of the Joint Share/Guide/IBM Application Development Symposium, Monterey, CA, USA, 14–17 October 1979; pp. 83–92. [Google Scholar]
- Banker, R.D.; Kauffman, R.J.; Wright, C.; Zweig, D. Automating output size and reuse metrics in a Repository-Based Computer-Aided Software Engineering (CASE) environment. IEEE Trans. Softw. Eng. 1994, 20, 169–187. [Google Scholar] [CrossRef]
- Meli, R.; Abran, A.; Ho, V.T.; Oligny, S. On the applicability of COSMIC-FFP for measuring software throughout its life cycle. In Proceedings of the 11th European Software Control and Metrics Conference, Munich, Germany, 18–20 April 2000. [Google Scholar]
- Altaleb, A.R.; Gravell, A.M. Effort estimation across Mobile app platforms using Agile processes: A systematic literature review. J. Softw. 2018, 13, 242–259. [Google Scholar] [CrossRef]
- Oozou. Estimate My App. Available online: https://estimatemyapp.com/ (accessed on 28 October 2020).
- Crew. How Much to Make an App? Available online: http://howmuchtomakeanapp.com/ (accessed on 28 October 2020).
- VenturePact. Looking to Build an App? Available online: https://venturepact.com/mobile_app_price_calculator (accessed on 28 October 2020).
- BuildFire. How Much Will Your Mobile App Project Cost You? Available online: https://buildfire.com/how-much-to-make-a-mobile-app-calculator/# (accessed on 28 October 2020).
- Otreva. How Much Does It Cost to Build an App? Available online: https://www.otreva.com/calculator/# (accessed on 28 October 2020).
- Cleveroad. How Much Does It Cost to Make an App? Available online: https://www.cleveroad.com/mobile-app-development-cost-calculator (accessed on 28 October 2020).
- Ley, A. Cost Calculator for Mobile App Development. Available online: https://www.andreasley.ch/en/costcalculator/ (accessed on 28 October 2020).
- Iida, N. New Technique for estimating development scale: Implementing the function scale method. Fujitsu Sci. Tech. J. 2010, 46, 149–157. [Google Scholar]
- Rijwani, P.; Jain, S.; Santani, D. Software effort estimation: A comparison-based perspective. Int. J. Appl. Innov. Eng. Manag. 2014, 3, 18–29. [Google Scholar]
- Hebig, R.; Derehag, J.; Chaudron, M.R. Identifying metrics’ biases when measuring or approximating size in heterogeneous languages. In Proceedings of the ACM/IEEE International Symposium on Empirical Software Engineering and Measurement, Beijing, China, 22–23 October 2015; pp. 1–4. [Google Scholar]
- Gomes, J.V.; Inácio, P.R.; Freire, M.M.; Pereira, M.; Monteiro, P.P. Analysis of peer-to-peer traffic using a behavioural method based on entropy. In Proceedings of the IEEE International Performance, Computing and Communications Conference, Austin, TX, USA, 7–9 December 2008; pp. 201–208. [Google Scholar]
- Mendes, E.; Mosley, N.; Counsell, S. Investigating web size metrics for early web cost estimation. J. Syst. Softw. 2005, 77, 157–172. [Google Scholar] [CrossRef]
- Van Den Berg, K.; Dekkers, T.; Oudshoorn, R. Functional size measurement applied to UML-based user requirements. In Proceedings of the 2nd Software Measurement European Forum (SMEF), Rome, Italy, 16–18 March 2005; pp. 69–80. [Google Scholar]
- Lavazza, L.; Del Bianco, V. A case study in COSMIC functional size measurement: The rice cooker revisited. In International Workshop on Software Measurement; Springer: Berlin/Heidelberg, Germany, 2000; pp. 101–121. [Google Scholar]


| Characteristics | Estimate My App | How Much to Make an App | Venture Pact | BuildFire | Otreva | Cleveroad | Andreas Ley Cost Calculator | Total |
|---|---|---|---|---|---|---|---|---|
| Function point size | / | - | - | - | - | - | - | 1/7 |
| UML diagram | - | - | - | - | - | - | - | 0/7 |
| Supported platform type | / | / | / | / | / | / | / | 7/7 |
| Supported device | - | - | - | - | - | - | / | 1/7 |
| Supported device | - | - | - | - | - | - | / | 1/7 |
| Back-end system availability and server config. flexibility | - | - | - | / | - | - | - | 1/7 |
| Development team skills | - | - | - | - | - | - | - | 0//7 |
| App development flexibility and complexity | - | - | - | - | - | - | - | 0//7 |
| Team communication, process, complexity and experience | - | - | - | - | - | - | - | 0/7 |
| Push notification | / | - | - | / | / | / | / | 5/7 |
| Landscape and portrait mode | - | - | - | - | - | - | - | 0/7 |
| Data storage and memory opt. complexity | - | - | / | / | - | - | - | 2/7 |
| Number of screens | - | - | / | - | - | / | / | 3/7 |
| Number of API parties | / | / | - | / | / | - | - | 4/7 |
| Support code reusability | - | - | - | - | - | / | / | 2/7 |
| Technology maturity | - | - | - | - | - | - | - | 0/7 |
| Battery and optimisation | - | - | - | - | - | - | - | 0/7 |
| Connection | - | / | - | / | - | - | / | 3/7 |
| Booking and reservation | / | - | - | - | / | - | - | 2/7 |
| Calendar and time | / | - | - | / | / | / | - | 4/7 |
| Map and localisation | / | - | / | / | / | / | / | 6/7 |
| Social sharing | / | / | - | / | / | / | - | 5/7 |
| Searching contents | / | - | / | - | / | - | - | 3/7 |
| Messaging | / | - | - | / | / | / | - | 4/7 |
| Deadline date | / | - | - | - | - | / | - | 2/7 |
| Number of functionalities | / | - | - | - | - | - | - | 1/7 |
| Registration and login | / | / | / | / | / | / | / | 7/7 |
| Chronological list | - | - | - | - | - | - | - | 0/7 |
| Number of files, classes, methods, statements, and LOC | - | - | - | - | - | - | - | 0/7 |
| Chronological list | - | - | - | - | - | - | - | 0/7 |
| File upload | / | - | - | - | - | / | - | 2/7 |
| Comment feature | / | / | - | - | - | - | - | 2/7 |
| Navigation | - | - | - | - | - | - | / | 1/7 |
| Interrupt handling | - | - | - | - | - | - | - | 0/7 |
| Security analysis support | / | - | / | / | - | - | / | 4/7 |
| Budget for the project | - | - | - | - | - | - | - | 0/7 |
| Compatibility with previous version | - | - | - | - | - | - | / | 1/7 |
| Multi language support | / | - | - | - | - | - | / | 2/7 |
| Media support | / | - | / | / | / | - | / | 6/7 |
| Pay process user feedback | / | / | / | / | / | / | / | 7/7 |
| Cost Driver (Proposed System) | Description | Estimated Cost (USD) |
|---|---|---|
| Function Point Size | Small (has around 2–3 key features); | Small (USD 4500); |
| Medium (has around 4–7 key features); | Medium (USD 13,500); | |
| Large (has around 8–12 key features). | Large (USD 22,500) | |
| Supported Platform | iOS (iPhone/iPad app); | USD 1200–USD 9600 |
| Android (Android phone/Tablet app) | ||
| User Interface Quality and Complexity | MVP (Minimum Viable Product. Very raw but functional); | MVP (USD 400–USD 5850); Basic (USD 1200–USD 6750); Polished (USD 2400–USD 9600) |
| Basic (Still quite basic but pleasing to the eye); | ||
| Polished (Professional bespoke UI design. May also have some animations and transitions etc.) | ||
| Push Notification | Real-time notifications between users, e.g., unread message counts, notifications of editing, etc. | Yes (USD 1350–USD 5000); No (USD 0) |
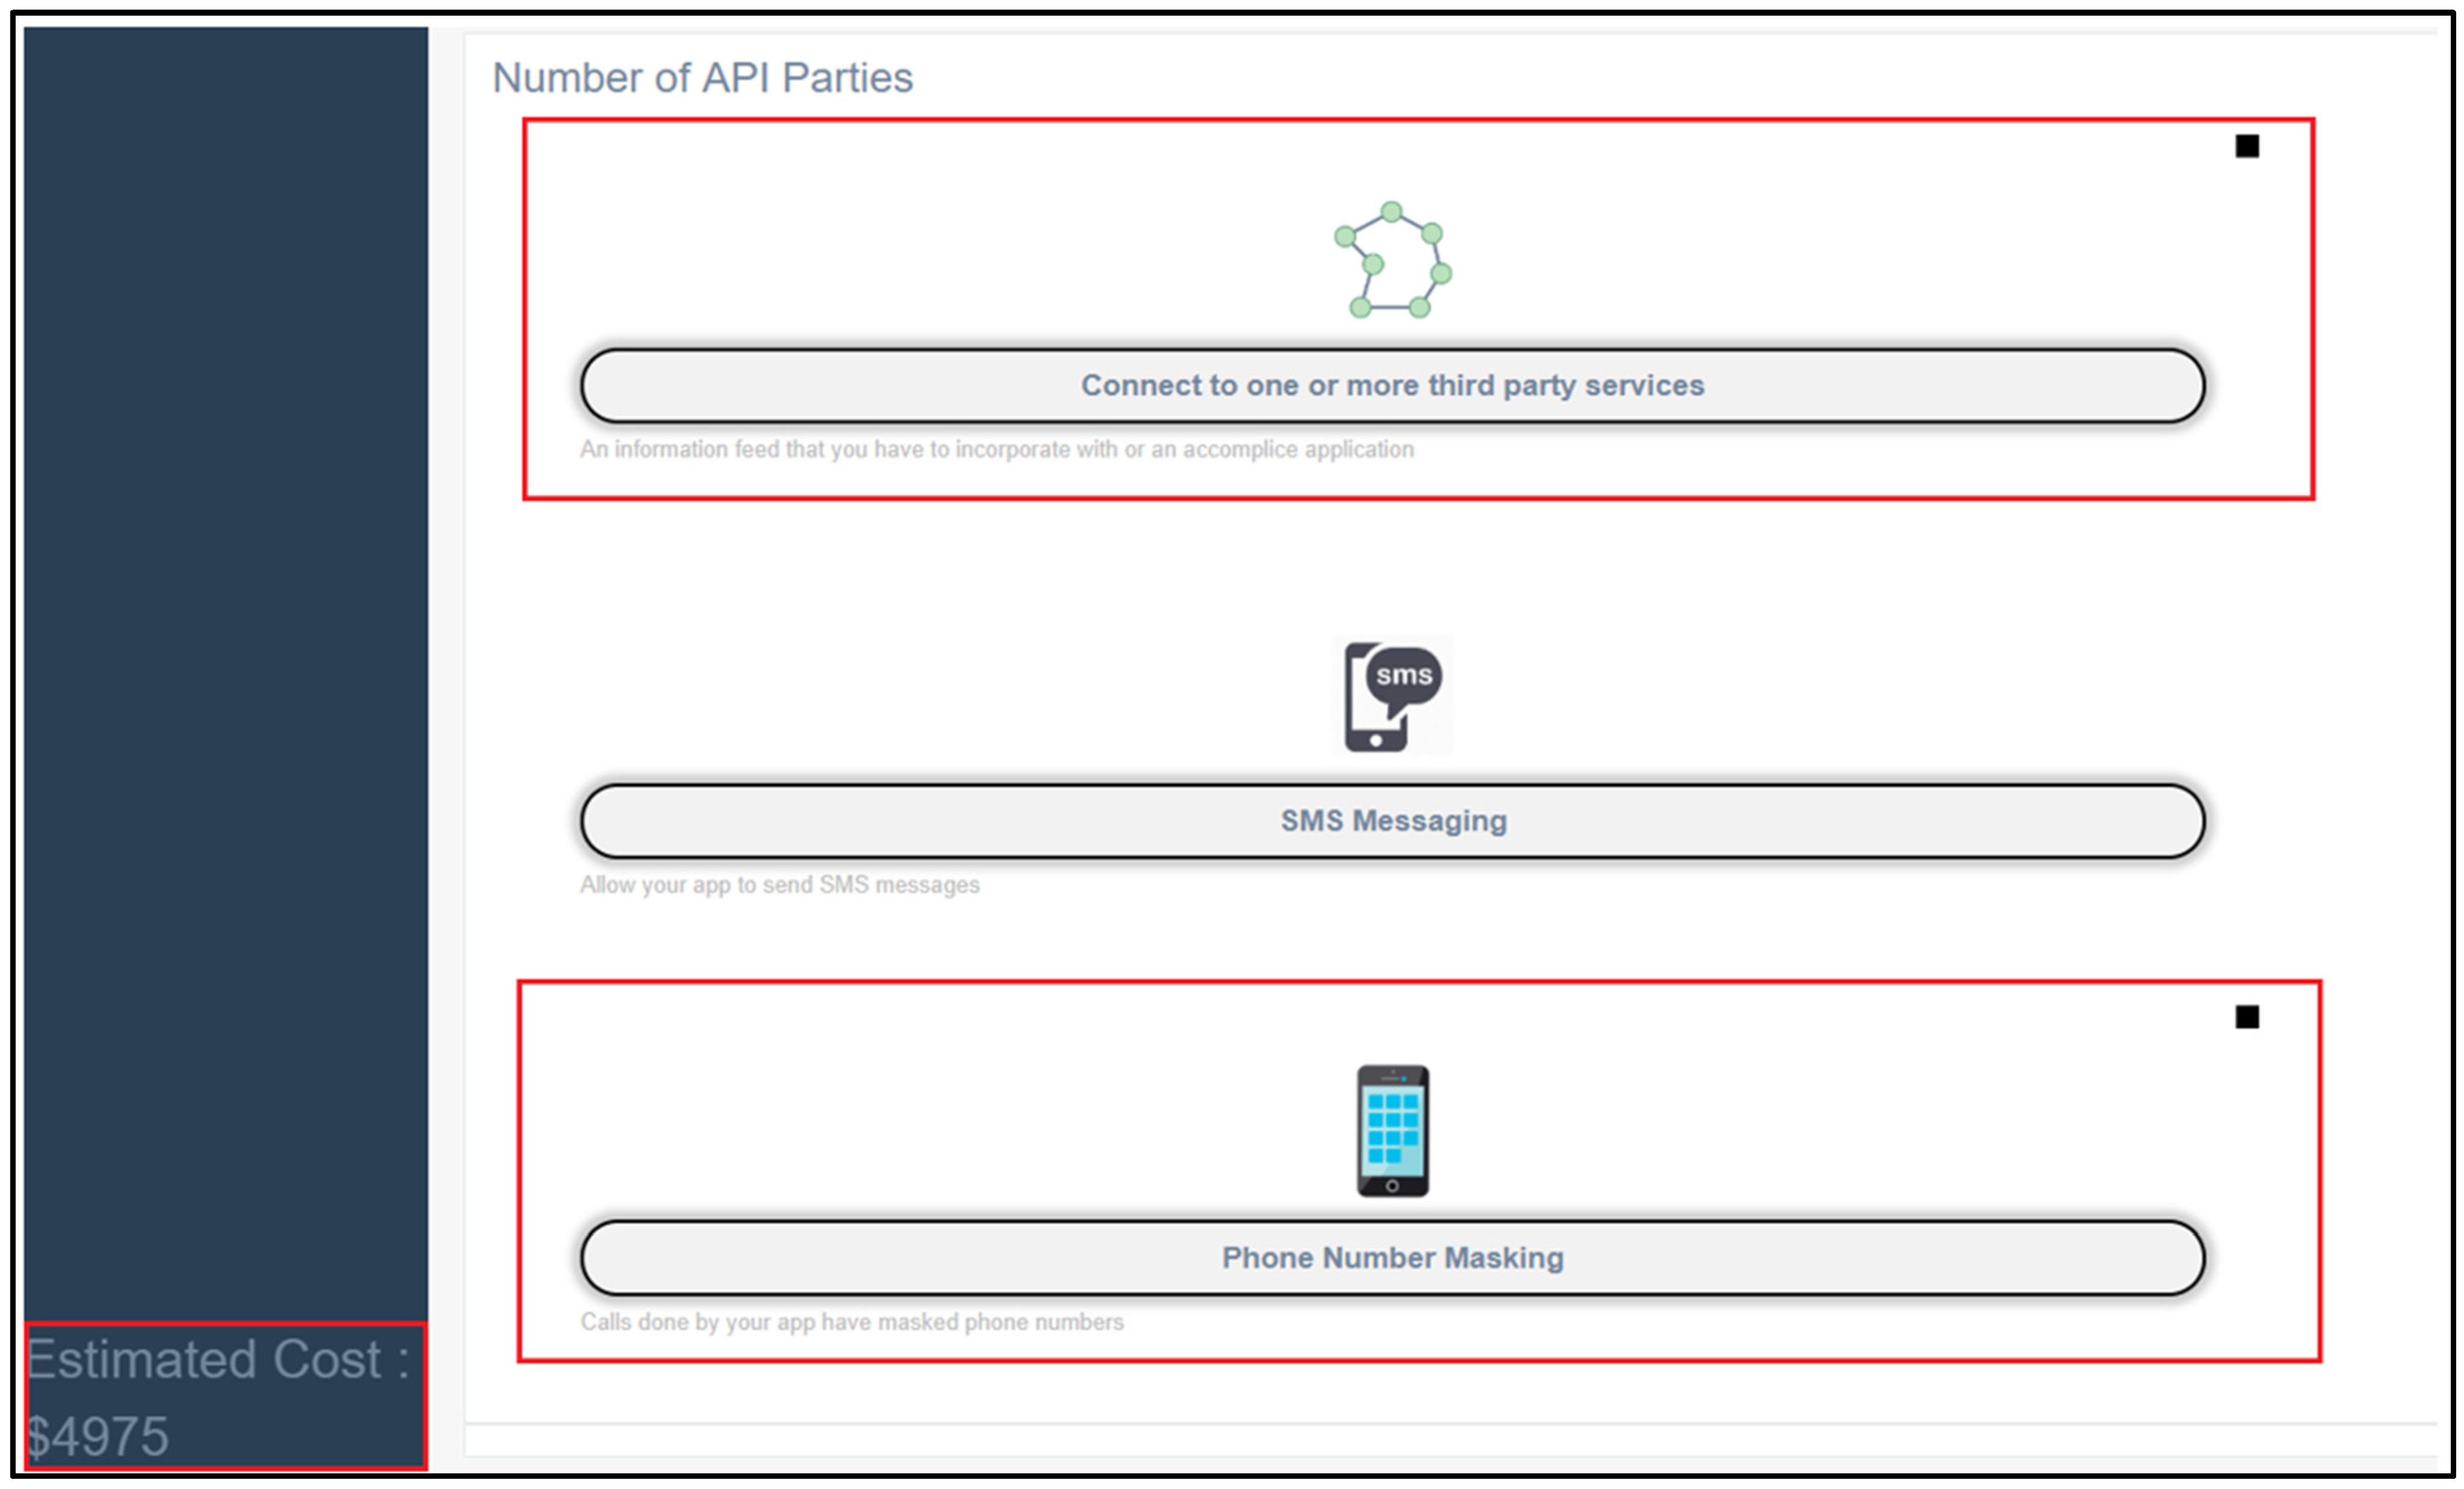
| Number of API Parties | Connect to one or more third party services (An information feed that you must incorporate with or an accomplice application); | Connect to one or more third party services (USD 1350–USD 5000); SMS Message (USD 1800); Phone Number Masking (USD 1800) |
| SMS Messaging; (Allow your app to send SMS messages); | ||
| Phone Number Masking (Calls conducted by your app have masked phone numbers). | ||
| Connection | Bluetooth (Use Bluetooth to communicate and transfer data between devices); | Bluetooth (USD 3840–USD 10,000); Wireless (USD 0); |
| Wireless (App does not need to connect via internet) | ||
| Booking and Reservation | Managing capacity, choosing the start and end dates etc. | Yes (USD 2250–USD 5250); No (USD 0) |
| Calendar and Time | Display data in a calendar format | USD 2700–USD 3000; |
| Map and Localisation | Showing a map with data point e.g., driver locations, venue locations, etc. | Yes (USD 1350–USD 5000); No (USD 0) |
| Social Sharing | Ability to share pieces of information in a controlled way on social media account to drive engagement | Yes (USD 450–USD 3000); No (USD 0); |
| Searching and Contents | Users would be able to search content | Yes (USD 1350–USD 4500); No (USD 0); |
| Messaging | Allowing users within the app to send message to other Account users or group of users | Yes (USD 2250–USD 3750); No (USD 0); |
| File Upload | Users can upload video, photo content or audio | Yes (USD 1800); No (USD 0); |
| Registration and Login | Email/Password; Facebook; Twitter; | Email/Password (USD 320–USD 9600); Facebook (USD 800–USD 4000) Twitter (USD 800–USD 4000) Google (USD 800–USD 4000) |
| Comment Feature | Classic forum functionality for account users or simple commenting on information | Yes (USD 2250–USD 3000); No (USD 0); |
| Security Analysis Support | Security not important (Use Bluetooth to communicate and transfer); Basic Security Measures; Complete Protection (Protection against XSS & SQL Injection) | Security not important (USD 0); Basic Security Measures (USD 400–USD 1300); Complete Protection (USD 2400–USD 7800); |
| Multi-language Support | Provide support for multiple languages for your app | Yes (USD 1800); No (USD 0) |
| Media Support | Users are able to modify video, photo content or audio on their gadget (e.g., Filters). | Yes (USD 1800–USD 3770); No (USD 0) |
| Paying Process User Feedback | You will process ad-hoc or regular payments from users and manage refunds, etc. | Yes (USD 1440–USD 6000); No (USD 0); |
| Title 1 | Estimate MyApp | How Much to Make an App | VenturePact | BuildFire | Otreva | Andreas Ley Cost Calculator |
|---|---|---|---|---|---|---|
| USD 49,500 | USD 30,600 | USD 24,180 | USD 164,868 | USD 66,003 | USD 31,000 | |
| Proposed System | USD 55,300 | USD 35,340 | USD 18,025 | USD 48,550 | USD 44,080 | USD 36,350 |
| Difference in USD | USD 5800 | USD 5340 | USD −6155 | USD −116,318 | USD −21,923 | USD 5350 |
| Percentage of Difference | +11.72% | +17.80% | −25.45% | −70.55% | −33.22% | +17.26% |
Publisher’s Note: MDPI stays neutral with regard to jurisdictional claims in published maps and institutional affiliations. |
© 2022 by the authors. Licensee MDPI, Basel, Switzerland. This article is an open access article distributed under the terms and conditions of the Creative Commons Attribution (CC BY) license (https://creativecommons.org/licenses/by/4.0/).
Share and Cite
Rusli, N.I.A.; Abdullah, N.A.S.; Abd Razak, F.N.; Mufriz, N.M. Web-Based Parametric Effort Estimation for Mobile Application Development. Proceedings 2022, 82, 69. https://doi.org/10.3390/proceedings2022082069
Rusli NIA, Abdullah NAS, Abd Razak FN, Mufriz NM. Web-Based Parametric Effort Estimation for Mobile Application Development. Proceedings. 2022; 82(1):69. https://doi.org/10.3390/proceedings2022082069
Chicago/Turabian StyleRusli, Nur Ida Aniza, Nur Atiqah Sia Abdullah, Fatin Nabila Abd Razak, and Nemo Menton Mufriz. 2022. "Web-Based Parametric Effort Estimation for Mobile Application Development" Proceedings 82, no. 1: 69. https://doi.org/10.3390/proceedings2022082069