1. Introduction
We are currently living in a very challenging world. The Fourth Industrial Revolution and the COVID-19 pandemic have really affected human life during this century. Digital technologies and the Internet have effected tremendous changes in various areas of human life. It has changed the way of communication, working, doing business and transaction, get a medical treatment, teaching and learning in schools and universities. It has also affected the way investors analyze the stock market and make investment decisions. These situations have put investors in uncertain environments. Making investment decisions in a vague and uncertain environment is not an easy task. Investors need to take into account many considerations that influence assets’ returns [
1].
Uncertainty in a stock market is an issue that has long been raised by many scholars. In the current scenario characterized by the COVID-19 pandemic and the advent of disruptive technologies, the situation has been worsened. Business operations and social life have been influenced by digital technologies. Technology changes very quickly and frequently. It has changed the way people communicate, how businesses operate, marketing media, the banking process, the transaction system, etc. These changes have influenced the state of volatility in business sales and turnover since the environment has become more uncertain, and businesses are operating in a more complicated environment. Decisions must be made in an environment of ambiguity. Stock market movements have become more unpredictable, uncertain, and volatile. The environment can be simplified as one characterized by volatility, uncertainty, complexity, and ambiguity (VUCA).
In portfolio investment, stock market fluctuation is a normal situation. Investors need to manage the stock market’s risks well. Stock market risks can be classified into systematic and unsystematic risks. A VUCA business environment can be classified as a systematic risk which cannot be eliminated but which can be reduced. Systematic risk can be minimized by using portfolio diversification. By using an appropriate approach of portfolio diversification, investors can minimize their portfolio risk, and at the same time, they can maximize their portfolios’ rates of return. This can be proven using a complicated mathematical approach. Therefore, this study proposes a simplified method for developing understanding in investors and students for managing a portfolio’s risk.
2. Literature Review
Investment plays very important roles in asset management. It cannot be managed by siloing, and it requires an expert to manage it for the purpose of obtaining diversification benefits. According to Stewart, Piros & Heisler, portfolio management is becoming increasingly more sophisticated due to the ongoing advancement of theory and the growing complexity of practice led by a number of trends, including:
- i.
Advances in modern portfolio theory,
- ii.
More complexity in instruments,
- iii.
Increased demands on performance,
- iv.
Increased client sophistication,
- v.
Rising retirement costs, and the growing trend toward individual responsibility for those costs, and
- vi.
Dramatic growth in assets under management.
For the past few decades, most investors have concentrated their money in single-quality stock investments [
2]. Now, however, due to the above-mentioned changes, portfolio diversification is one of the strategies used to minimize investment risks. Investing in the stock market has become an important medium for retail and institutional investors, either to create additional wealth or to protect themselves from inflation. In today’s fast-changing environment, it is difficult for investors to make investment decisions, especially when in conjunction with volatile supply and demand, an uncertain business environment, complex data, and ambiguous information. The utilization of technology has become a requirement for any investment decision. This situation is consistent with that which [
2] mentioned—that today’s uncertain and volatile market conditions require investors to utilize information technology (IT) to drive future investment decisions through correct analysis and judgment.
Through the application of the appropriate investment management and diversification strategies, investment risk can be minimized. Asset allocation between risky assets and risk-free assets can be utilized in order to manage a portfolio’s risk level. According to [
3], studies of stocks on the US stock market have found that the correlation structure of return is largely explained by the ‘single index’ model. That is, there is one dominant, causal agent that operates as a single factor or “market factor” in the correlation structure of a stock return. Other factors, such as the industry group, are present, but they have been found to be of relatively minor importance.
In modern portfolio theory, asset correlation is very important in determining a portfolio’s risk level. Negative correlation assets are needed in order to minimize the portfolio’s risk. Moreover, investors also can use risk-free assets in their portfolios in order to minimize the portfolio’s risk. Inclusion of risk-free assets in a portfolio is able to reduce the amount of total risk since the asset variance is zero.
In this exploration, the study sample was taken from Bursa Malaysia. The data were obtained from the web-based DataStream, which is composed of a huge number of companies which Bursa Malaysia prepared for selection. The following steps can guide students in the process of determining efficient frontiers and capital-allocation lines.
3. Methodology
To simplify the discussion, this study only focuses on a two-company investment portfolio scenario. The study included 30 companies listed in the FTSE Bursa Malaysia Kuala Lumpur Composite Index as the sample. The companies selected for the study were Top Glove Corporation Berhad and Genting Malaysia Berhad. The two companies were chosen because their combination had the lowest correlation value (−0.12) of any of the sample companies’ combinations. A low correlation value is the main selection criterion as it can theoretically provide the optimum diversification strategy. The study covers 13 years of monthly data, ranging from 24 May 2009 to 24 May 2022. The data-analysis technique is broken down into three stages: First, calculating the efficient frontier, then calculating the capital allocation line, and finally, determining the optimal portfolio construction by looking at the tangent between the efficient frontier line and the capital allocation line. The formulas below were taken from [
4,
5].
3.1. Efficient Frontier Line
The portfolio return and portfolio standard deviation must be computed before the efficient frontier can be constructed.
3.1.1. Portfolio Return
To calculate the portfolio return, one must start with the calculation of a single stock return:
The average return (mean) is then calculated:
The following is the final step in determining the portfolio return:
3.1.2. Portfolio Standard Deviation
The process of calculating the portfolio standard deviation begins with calculating the single-asset standard deviation:
The next step is calculating the covariance between the two assets:
The last step is calculating the portfolio standard deviation
Various combinations of percentage capital allocation (weightage) between Top Glove Corporation Berhad and Genting Malaysia Berhad have been considered in constructing the efficient frontier.
3.2. Capital Allocation Line (CAL)
The second process is calculating the capital allocation line. The capital allocation line can be calculated based on the following formula below:
is also known as the Sharpe ratio
3.3. Combining the Efficient Frontier and CAL
The final step is to determine the optimum portfolio. The efficient frontier and CAL are plotted on the same graph with the portfolio standard deviation as the x-axis and the portfolio return as the y-axis. The model suggests that the optimum portfolio is achieved at a point where the CAL line intersects with the efficient frontier line, and at this point, the Sharpe ratio is at the maximum level.
Investors can follow the above-presented steps in order to develop an understanding of the efficient frontier and optimum portfolio, which will provide them with the lowest portfolio risk and the highest return at any point of risk and return.
4. Results and Discussion
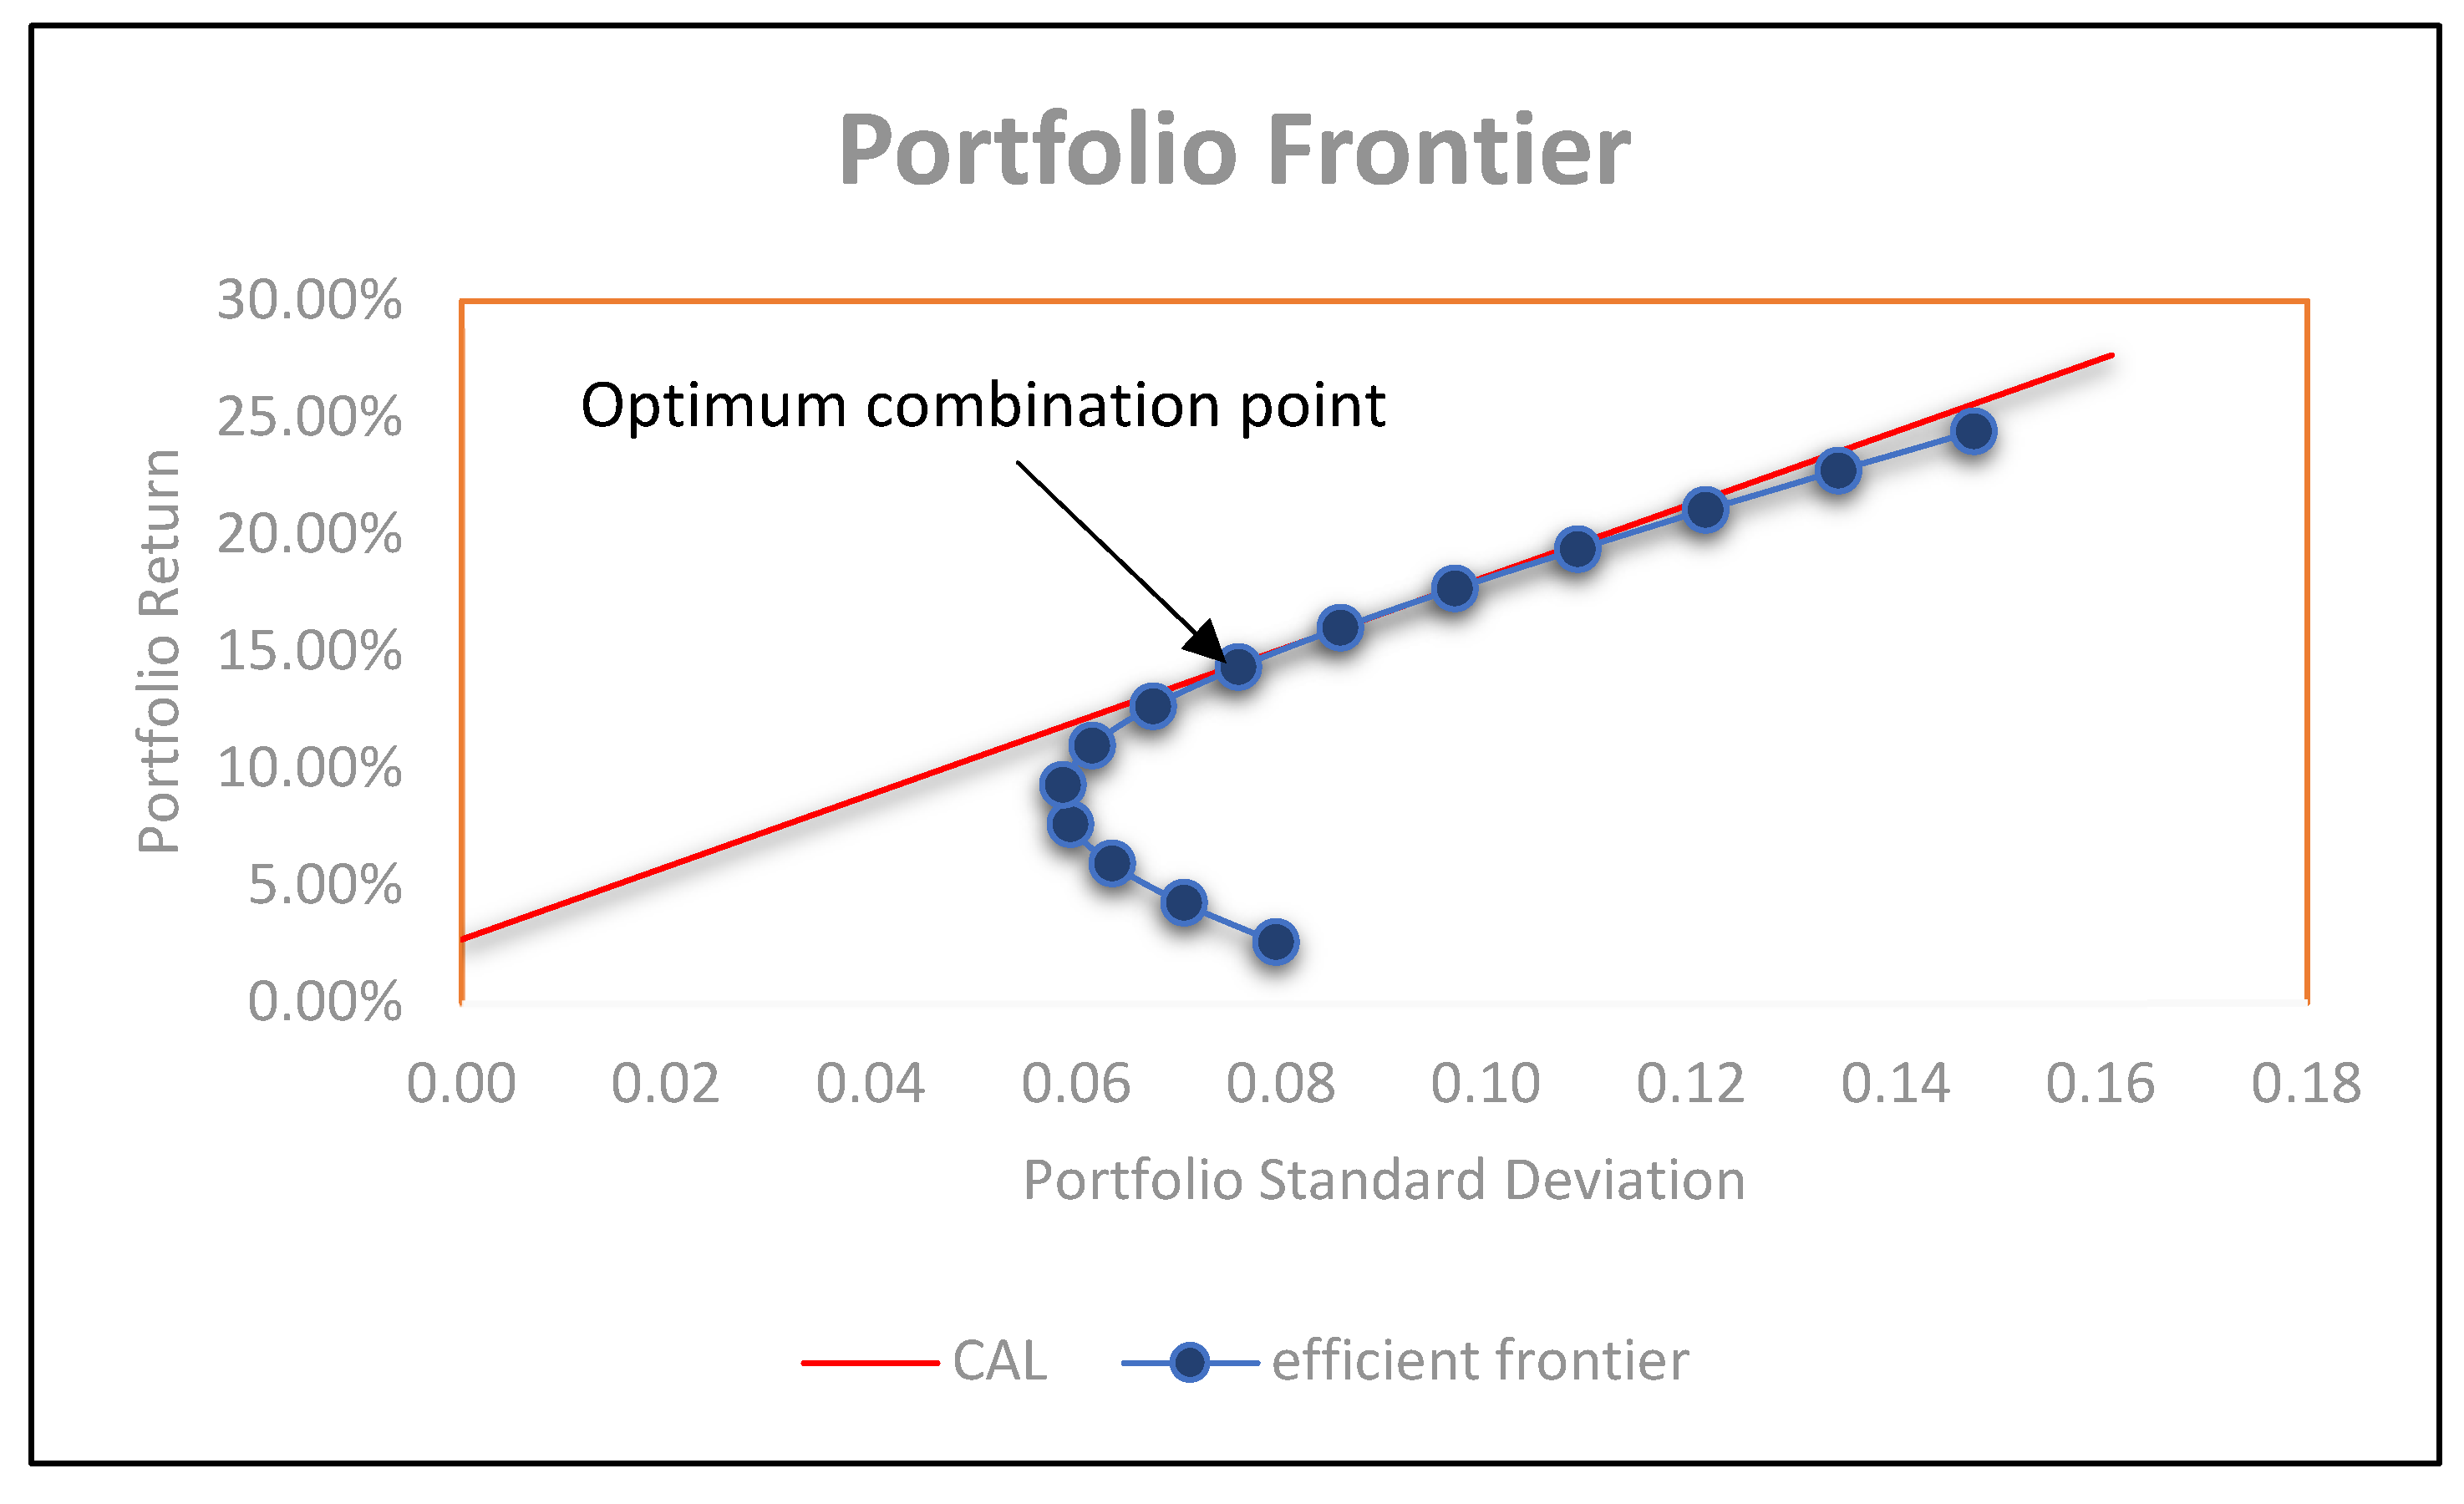
As a result, the efficient frontier for the two-asset portfolio was derived as presented in
Figure 1, which shows the efficient frontier line and CAL plotted on the same graph.
Figure 1 shows the optimum combination for an investment portfolio containing Top Glove Corporation Berhad and Genting Malaysia Berhad. The optimum combination is found at the tangent where the efficient frontier line and the CAL intersect. At this point, the Sharpe ratio is also at the maximum value. At the optimum combination point, the model proposes that 70% of the capital should be invested in Top Glove Corporation Berhad and 30% should be allocated to Genting Malaysia Berhad. At this level, the return of the proposed portfolio will 16%, while the risk faced by investors is at 8.6%.
Although this study proposed a 70% capital allocation to Top Glove Berhad and a 30% allocation to Genting Malaysia Berhad, it should be read with extra care. First, the study used historical data based on 13 years of market performance. However, since the emergence of the COVID-19 pandemic in December 2019 and the beginning of the Russian invasion of Ukraine on 24 February 2022, the economy and the market have been very volatile. Many profit-making industries have been faced with a gloomy future. Second, the model only looking at and is restricted to the Markowitz model, and the reader should also look into other investment models. Third, one of the objectives of this study is to show how students can use complex theory and turn it into something practical; therefore, the discussion is confined to the Markowitz model alone.
5. Conclusions
Portfolio management is very important, and it requires careful asset selection in order to minimize the portfolio’s risk. The aim of the asset selection in portfolio management is to minimize the investment and maximize the portfolio return. Portfolio optimization is achieved when all of the portfolio lies on the efficient frontier curve. In the case of risk-free assets present in the portfolio, the capital allocation line was used. By using this approach, investors are guided in the construction of the most efficient portfolio for their investments.
Author Contributions
Conceptualization, Z.M.; methodology, A.B.M.Y.; software, K.A.I.; validation, Z.M., A.B.M.Y. and K.A.I.; formal analysis, A.B.M.Y.; investigation, K.A.I.; resources, Z.M.; data curation, A.B.M.Y.; writing—original draft preparation, Z.M.; writing—review and editing, K.A.I.; visualization, A.B.M.Y.; supervision, Z.M.; project administration, Z.M. All authors have read and agreed to the published version of the manuscript.
Funding
This research received partial funding from General Training Allocation, Universiti Teknologi MARA, Kelantan Branch.
Institutional Review Board Statement
Not applicable.
Informed Consent Statement
Not applicable.
Data Availability Statement
Not applicable.
Acknowledgments
Great appreciation goes to the Universiti Teknologi MARA Kelantan Branch Administration Team for the coorporation and support the research project. Thank you, and congratulations to the organizing committee of the International Annual Social Science Conference (IASSC) 2022.
Conflicts of Interest
The authors declare no conflict of interest.
References
- Mohamed, Z.; Mohamad, D.; Samat, O. A fuzzy approach to portfolio selection. Sains Malays. 2009, 38, 895–899. [Google Scholar]
- Zulkifli, M.; Basaruddin Shah, B.; Norzaidi, M.D.; Chong, S.C. Portfolio diversification: The role of information technology in future investment decision-making. Int. J. Electron. Financ. 2008, 2, 451–468. [Google Scholar] [CrossRef]
- Hunter, J.E.; Coggin, T.D. An analysis of the diversification benefit from international equity investment. J. Portf. Manag. 1990, 17, 33. [Google Scholar] [CrossRef]
- Reilly, F.K.; Brown, K.C. Investment Analysis and Portfolio Management, 10th ed.; South-Western Cangage Learning: Mason, OH, USA, 2011. [Google Scholar]
- Scott, D.S.; Christopher, D.P.; Jeffrey, C.H. Portfolio Management: Theory and Practice, 2nd ed.; John Wiley & Sons, Inc.: Hoboken, NJ, USA, 2011. [Google Scholar]
| Publisher’s Note: MDPI stays neutral with regard to jurisdictional claims in published maps and institutional affiliations. |
© 2022 by the authors. Licensee MDPI, Basel, Switzerland. This article is an open access article distributed under the terms and conditions of the Creative Commons Attribution (CC BY) license (https://creativecommons.org/licenses/by/4.0/).


