Proceeding Paper

In-Vitro Antidiabetic Propensities, Phytochemical Analysis, and Mechanism of Action of Commercial Antidiabetic Polyherbal Formulation “Mehon” †

Department of Biotechnology, School of Sciences, Jain (Deemed-to be University), Bangalore 560011, India
*
Author to whom correspondence should be addressed.
Presented at the 1st International Electronic Conference on Biomolecules: Natural and Bio-Inspired Therapeutics for Human Diseases, 1–13 December 2020; Available online: https://iecbm2020.sciforum.net/.
Proceedings 2021, 79(1), 7; https://doi.org/10.3390/IECBM2020-08805
Published: 1 December 2020

Abstract

:
Present investigation assessed the hypoglycemic potential of hydro-alcoholic (HAE) and aqueous (AQE) extracts of Mehon, a commercial antidiabetic polyherbal formulation using various in vitro techniques. HAE and AQE were analyzed for α-amylase and α-glucosidase inhibition, glucose adsorption, diffusion, and transport across yeast cells membrane. HAE showed higher α-glucosidase (IC50:156.95 μg/mL) inhibition. Glucose adsorption increased with increment in glucose concentration (5–100 mM/L). The rate of glucose uptake into yeast cells was linear. Both extracts exhibited time-dependent glucose diffusion. Calculated GDRI was 27.44% (HAE) and 17.43% (AQE) at 30 min, which reduced over time, thereby confirming the antihyperglycemic propensities of Mehon.

1. Introduction

Diabetes mellitus is a disorder of multiple etiologies characterized by high blood glucose with abnormal carbohydrate, protein, and lipid metabolism [1]. Absence or/and insensitivity of insulin leads to accumulation of glucose in the blood, causing various secondary macro-vascular and micro-vascular complications [2]. The prevalence of diabetes mellitus is predominantly increasing due to sedentary lifestyles and the consequential upsurge in obesity. It has been estimated that about 171 million people worldwide suffer from diabetes mellitus [3]. Oral hypoglycemic agents, insulin, and combinatorial approach are presently available pharmacotherapies for management of diabetes mellitus. Drawbacks of present therapies include toxic side effects and prolonged use leading to diminution [4]. With the associated side effects and limitations of present therapies, continuous research on natural sources is being carried out to develop new formulations for effective management of diabetes and its related complications [3,4]. Plant bioactive compounds have shown digestive enzyme inhibition abilities with their capability to bind to enzyme protein [5,6]. Additionally, dietary fibers and their gelatinous polysaccharides play a major role in the reduction of postprandial plasma glucose levels in diabetes mellitus. Various previous reports have shown that appropriate glycemic control reduced the prevalence of retinopathy, nephropathy, and neuropathy, etc. [7,8,9,10].
Hence, herbal sources are considered an alternative for effective management of diabetes mellitus and its associated complications. Various commercial antidiabetic polyherbal formulations, with claimed antidiabetic effects, are available in the Indian market. However, only a few have received equitable scientific and medical scrutiny in terms of their mode of action, in attaining glucose homeostasis [5,6]. Thus, systematic scientific studies to explore the mechanism of action for commercial antidiabetic polyherbal formulation are needed. Further advances in understanding the activities of chief carbohydrate metabolizing enzymes, such as 𝛼-amylase and α-glucosidase, and the role of dietary fibers have led to the development of new pharmacologic agents, therefore, leading to an innovative area and target of research for attaining glucose homeostasis [9,11].
Since there are various polyherbal antidiabetic formulations existing in the Indian market, they are rarely studied for their in-vitro mode of action, and hence, limited data on the same are available. Therefore, the present study is aimed to explore the systematic in-vitro mechanism of action of the commercial Antidiabetic Polyherbal formulation, Mehon, for its antidiabetic potential.

2. Material and Methods

2.1. Chemicals and Reagents

Glucose oxidase peroxidase reagent was procured from Agappe Diagnostic Ltd., (Bengaluru, Karnataka, India). Dialysis bags (12,000 MW cut-off) were used from Himedia laboratories, (Bengaluru, Karnataka, India). Antidiabetic polyherbal formulation, Mehon was obtained from Local market, (Karnataka, India). All the other chemicals used in the study were of analytical grade.

2.2. Preparation of Extract

Mehon (5 g) was extracted with 150 mL of 70% methanol and distilled water by cold maceration for 24 h. The hydro-alcoholic (HAE) and aqueous (AQE) extracts were filtered using Whatman filter paper #1. The filtrate was concentrated with a rotary evaporator and lyophilizer, respectively, further stored at 4 °C for analysis [12].

2.3. Estimation of Total Phenol Content (TPC)

Mehon extract of 1 ml was pre-incubated with 1.5 mL of Folin ciocalteu (FC) reagent for 15 min followed by addition of 2 mL Na2Co3 (7.5%), incubated in dark for 30 min. Absorbance was read at 765 nm, and Gallic acid was used as standard [6].

2.4. Estimation of Total Flavonoid Content (TFC)

TFC was measured by adding 0.5 mL of tested extracts (1 mg/mL), 0.5 mL of NaNO3 (5%), incubated for 5 min followed by addition of AlCl3 (10%) and absorbance was read at 430 nm. Quercetin was used as standard [6].

2.5. α-Amylase Inhibition Assay

DNSA method was used to determine the α-amylase inhibition activity with slight modification [6]. The reaction mixture composed of 250 µL of extracts (200–1000 µg/mL) with 250 µL of porcine pancreatic α-amylase enzyme (1 unit) was pre-incubated for 20 min at 37 °C. The reaction was initiated by the addition of 250 µL of 1% potato soluble starch followed by incubated for 10 min at 37 ˚C. The reaction was stopped with the addition of 0.5 µL of DNS reagent, incubated in boiling water bath for 10 min, the tubes were cooled, and absorbance was taken at 540 nm, acarbose was considered a positive control. The percentage of inhibition was calculated with the following equation.
%   Inhibition : Absorbance   of   control Absorbance   of   extract Absorbance   of   control × 100

2.6. α-Glucosidase Inhibition Activity

α-glucosidase inhibitory activity was assessed [6] with slight modifications. The reaction mixture containing 50 µL of tested extracts (200–1000 µg/mL) and 240 µL of yeast α-glucosidase enzyme (1 Unit/mL) was pre-incubated for 20 min at 37 °C. The reaction was initiated with the addition of 40µl PNPG (5 mM) incubated for 10 min followed by the addition of 750 µL Na2CO3 (0.2 M). Absorbance was recorded at 405 nm, and acarbose was considered a positive control. The percentage of inhibition was calculated.
%   Inhibition : Absorbance   of   control Absorbance   of   extract Absorbance   of   control × 100

2.7. Effect of Tested Extracts on Glucose Adsorption Capacity

HAE and AQE (250 mg) were separately added to 25 mL of glucose solution of increasing concentrations (5, 10, 20, 50, and 100 mM). The reaction mixture was agitated and incubated in a shaker incubator at 37 °C for 6 h, centrifuged at 4000× g for 20 min. Glucose content in the supernatant solution was determined by the glucose oxidase-peroxidase method. Absorbance was read at 520 nm, and acarbose was taken as a positive control. Glucose adsorption capacity was determined according to the following formula [12].
Glucose   Bound = ( Glucose 1 Glucose 6 ) Weight   of   the   extracts × Volume   of   solution
Glucose1: Concentration of glucose original solution.
Glucose 6: Concentration of glucose after 6 hrs.

2.8. Effect of Tested Extracts on In-Vitro Glucose Diffusion

Twenty mM glucose solution (25 mL) and 0.25 g of Mehon extracts and acarbose were dialyzed against 200 mL of distilled water at 37 °C [12]. Further, glucose concentration in the dialysate was determined at time intervals, i.e., 30, 60, 120, and 180 min, using a glucose oxidase-peroxidase kit. A control test without the addition of the extract was also performed. Glucose dialysis retardation index (GDRI) was calculated according to the following formula.
GDRI   ( % ) = ( 100 Glucose   content   with   the   addition   of   extract ) Glucose   content   of   the   control × 100

2.9. Effect of Tested Extracts on In-Vitro Amylolysis Kinetics

Twenty-five milliliters of 4% starch solution with 0.4% of α-amylase and 1% of Mehon extracts were dialyzed against 200 mL of distilled water at 37 °C (pH-7). The concentration of glucose in the dialysate was determined at various time intervals 30, 60, 120, and 180 min, and a control test without the addition of the extract was also performed [12].

2.10. Effect of Tested Extracts on Glucose Uptake by Yeast Cells

Commercial baker’s yeast (EasyGrow Baker’s) was washed in distilled water with repeated centrifugation (3,000 × g, 5 min) till a clear supernatant was obtained. Further, 10% (v/v) suspension was prepared with the same. Different concentrations of both the extracts (1–5 mg) were added to 1 mL of glucose solution (5–25 mM), the mixture was incubated for 10 min at 37 °C. The reaction was initiated by adding 100 μL of yeast suspension, vortexed, and incubated at 37 °C. After 60 min, tubes were centrifuged (2500× g, 5 min), and glucose was estimated in the supernatant. The percentage increase in glucose uptake by yeast cells was calculated using the following formula [12].
% Increase   glucose   uptake = Absorbance   control   Absorbance   sample Absorbance   control × 100

2.11. Statistical Analysis

All the experimental works were carried out in triplicates and the obtained data were analyzed by ANOVA. Graphs were plotted using Graph Pad Prism 8 software.

3. Results

3.1. Phytochemical Analysis

In the present study, both the extracts, i.e., HAE and AQE of plant-based formulation were analyzed for their phytochemical composition (Table 1). The data revealed HAE exhibited higher TPC (95.44 ± 0.22 GAE/mg) and TFC (86 ± 0.15 QE/mg) when compared to AQE.

3.2. Bioactivity Assays

𝛼-Amylase inhibitory activity data from the present study showed the variable inhibitory effect of HAE and AQE extracts, IC50 values of extracts are summarized in Table 1. HAE exhibited significant comparable α-amylase inhibition (IC50 581.5 μg/mL) compared to standard drug acarbose (IC 50 523.12 μg/mL).
𝛼-Glucosidase activity was assessed by the release of p-nitrophenol from PNPG in vitro. IC50 (μg/mL) values of active extracts are presented in Table 1. Among the extracts, Mehon HAE (IC50 156.95 μg/mL) showed potent inhibitors of 𝛼-glucosidase compared to acarbose (476.64 μg/mL).

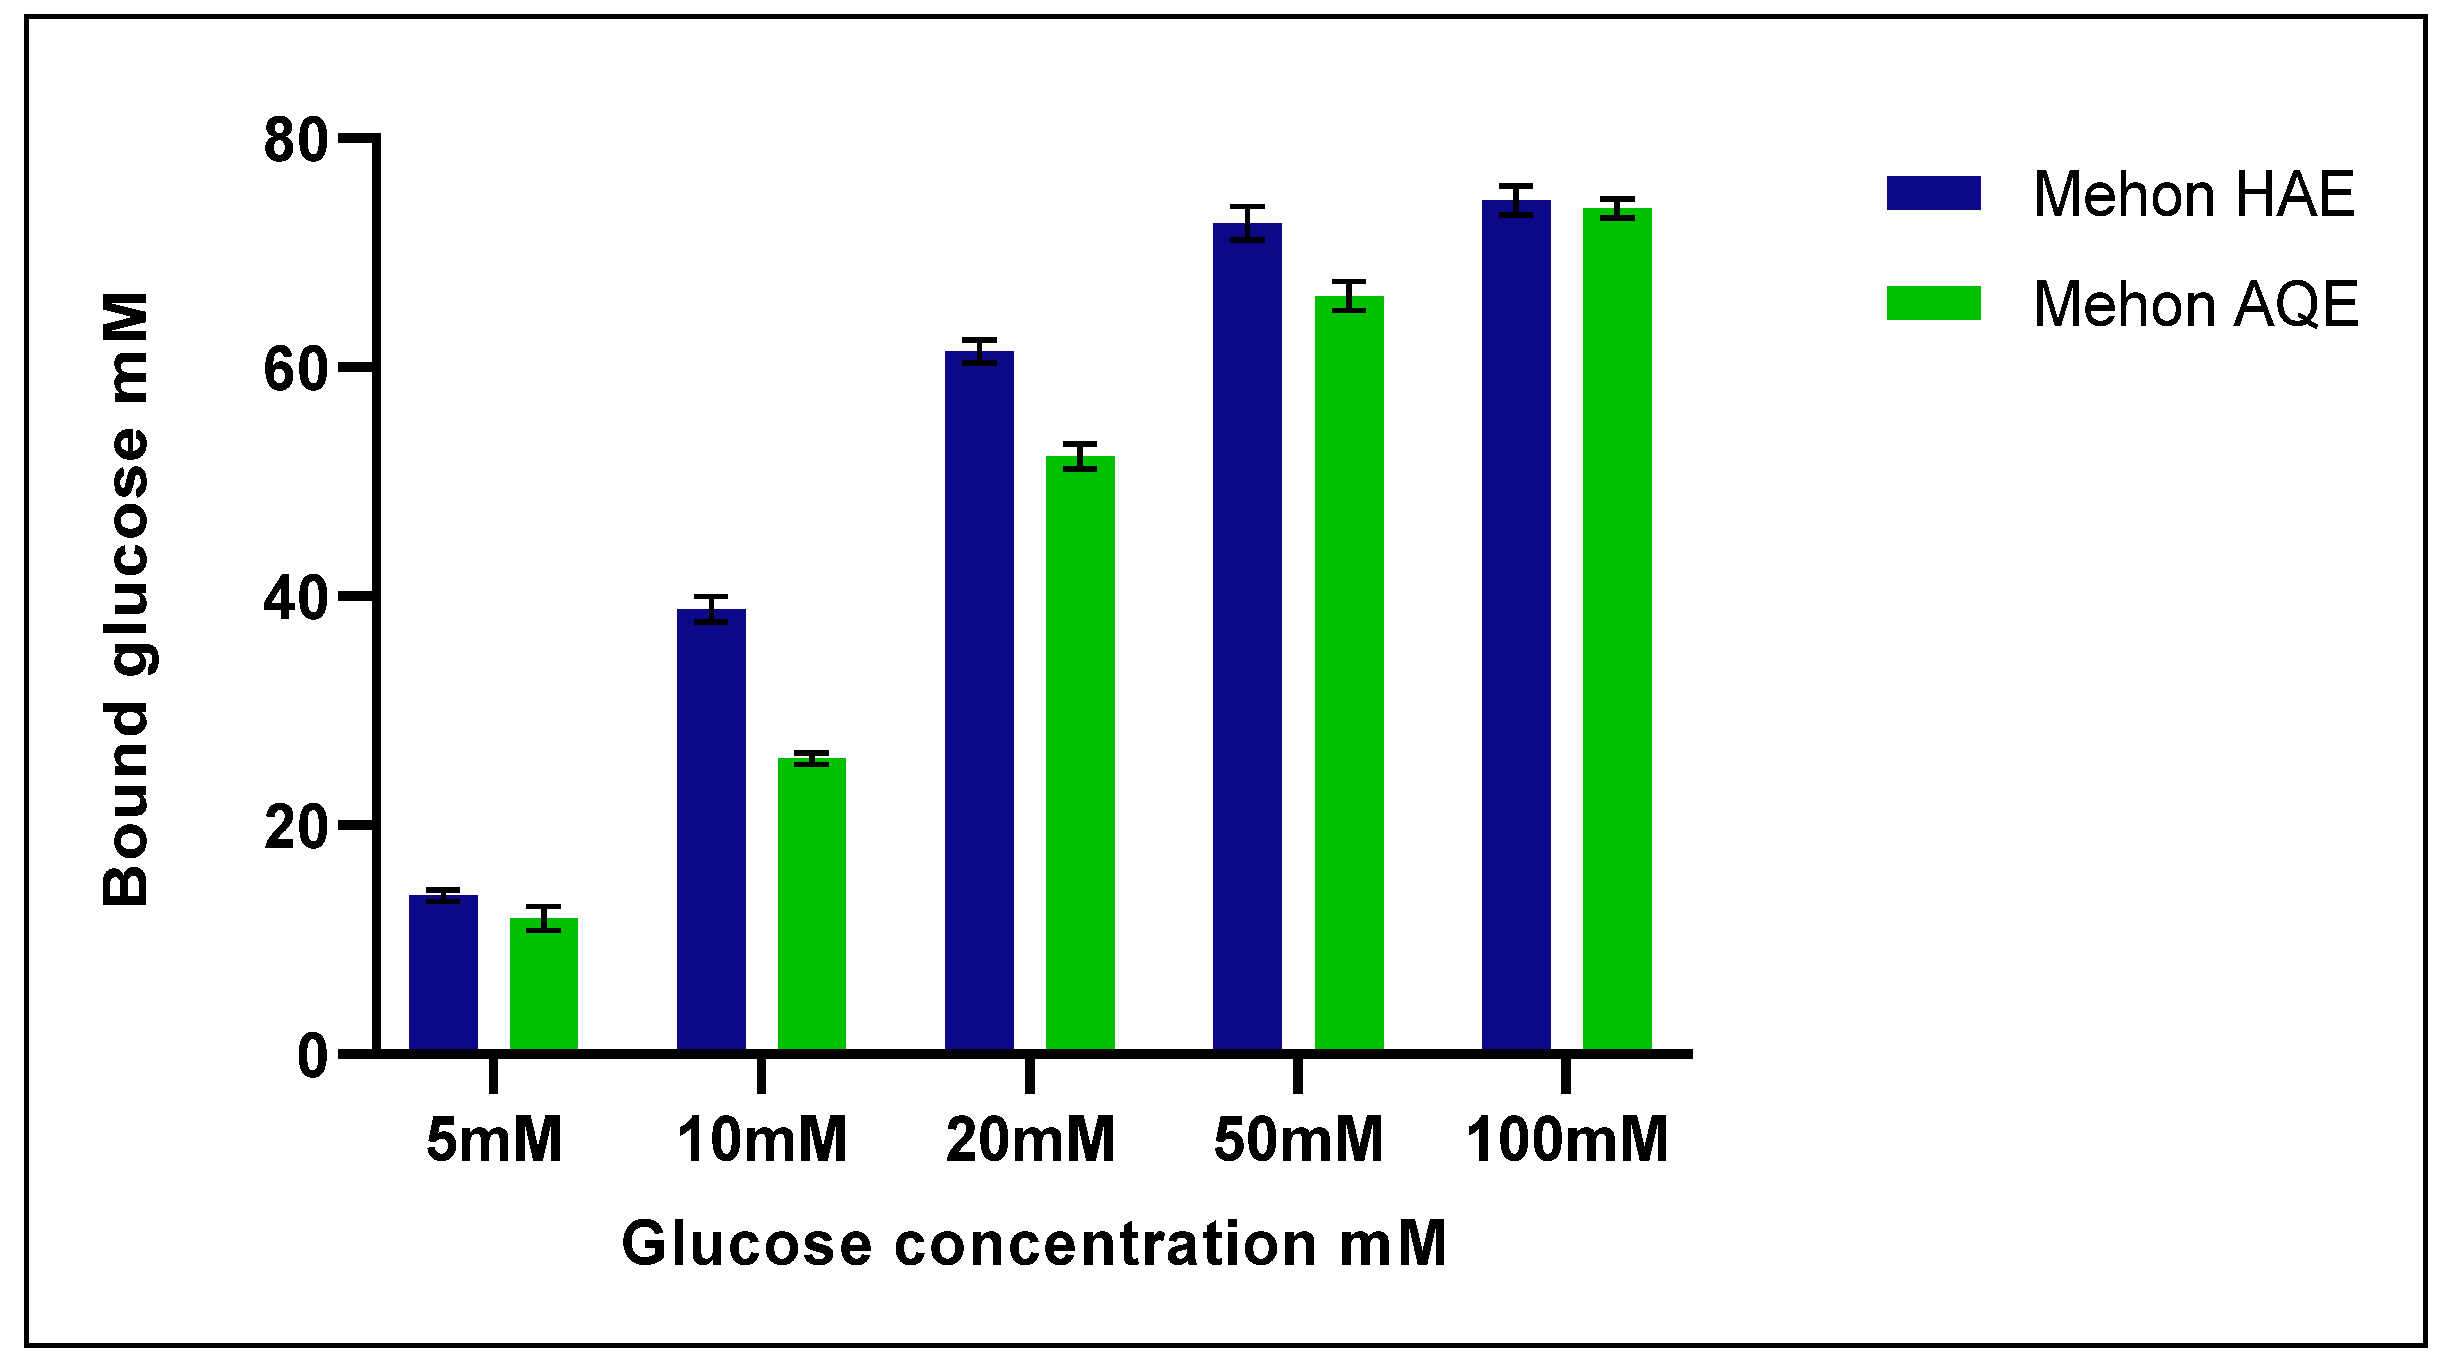
3.3. Effect of Tested Extracts on Glucose Adsorption Capacity

HAE and AQE extracts of Mehon were assessed for their glucose adsorption capacity. A directly proportional relationship between glucose concentration and increase in bound glucose concentration was established (Figure 1). Greater adsorption capacity was observed with HAE (74.56 ± 1.26) as compared to AQE (73.86 ± 0.816). Acarbose (83.75 ± 0.95 mM) was considered a positive control.

3.4. Effect of Tested Extracts on In-Vitro Glucose Diffusion

Both HAE and AQE extracts exhibited significant inhibitory effects on the movement of glucose into external solution when compared to control. The rate of glucose diffusion across the dialysis membrane was found to be directly proportional with time. The GRDI reduced over time for both the extracts, with the highest values observed at 180 min (Table 2).

3.5. Effect of Tested Extracts on In-Vitro Amylolysis Kinetics

Effect of tested extracts on starch digestibility and glucose dialysis retardation index were presented in Table 3. The rate of glucose diffusion was analysed at every 30 min interval, diffusion rate proliferated with an increase in time, maximum GDRI was observed at 180 min for both the extracts. The present investigation showed GRDI value reduced steadily as time increases.

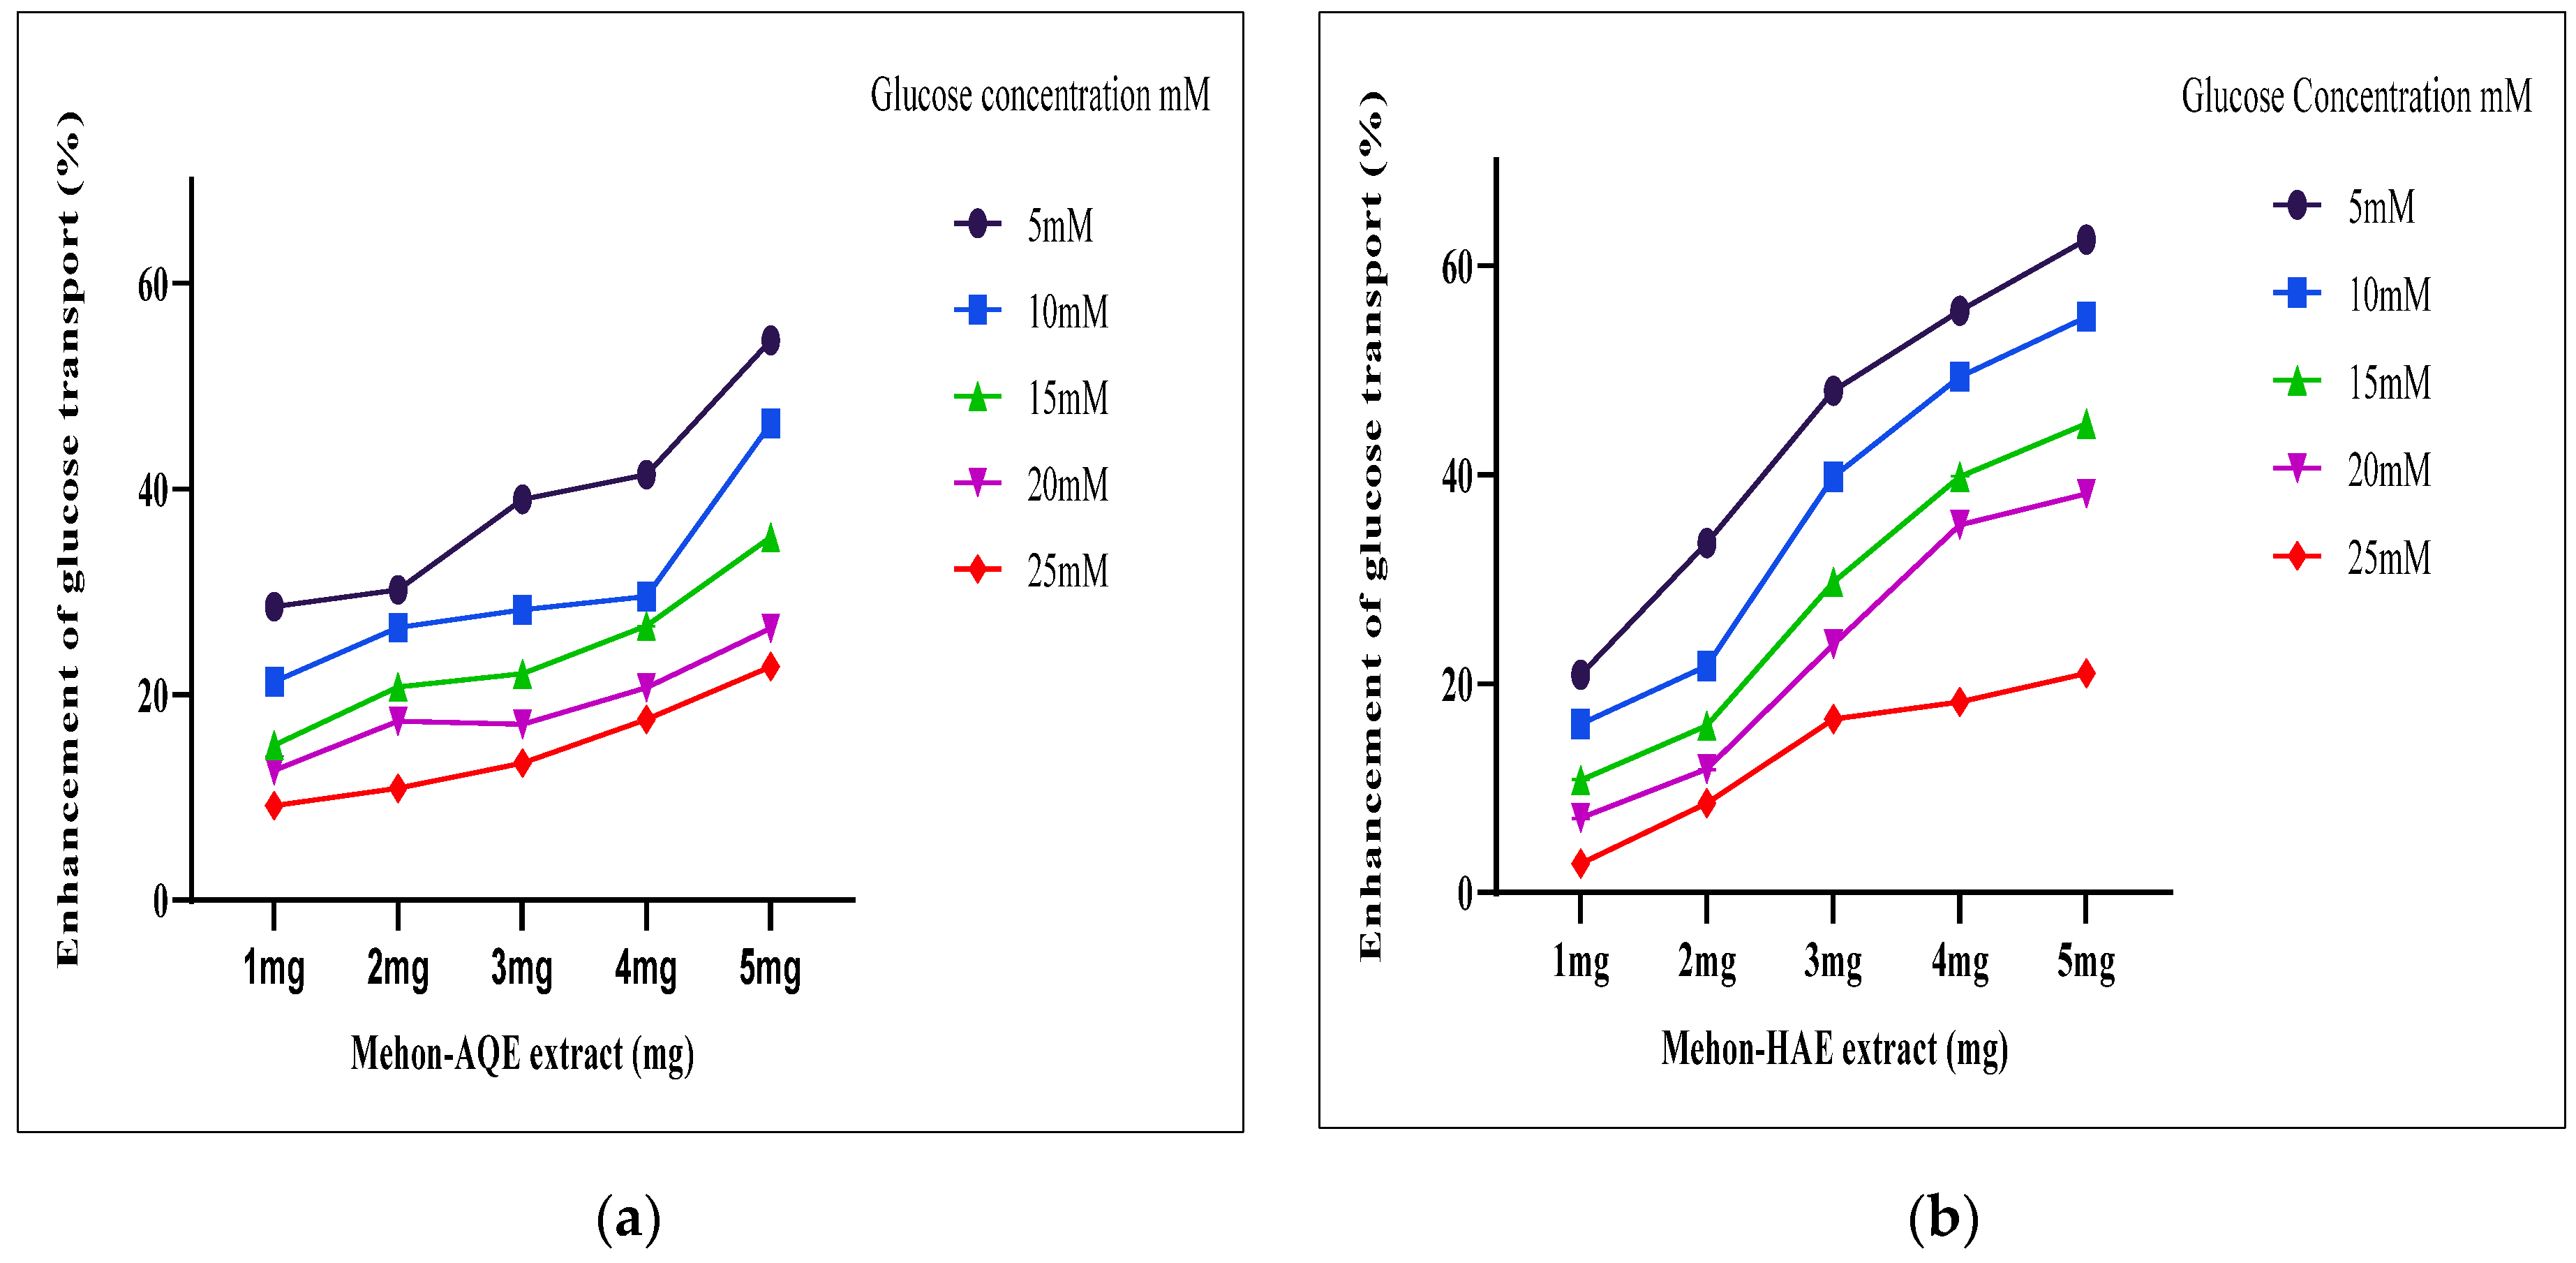
3.6. Effect of Tested Extracts on Glucose Uptake by Yeast Cells

Glucose transport across yeast cell membrane system is depicted (Figure 2a,b). A linear uptake of glucose was observed for both the extracts, where HAE exhibited higher uptake activity (Figure 2a) when compared to AQE. The percentage increase in glucose uptake by the yeast cells was found to be inversely proportional to glucose concentration.

4. Discussion

The present study was focused towards investigating the potential effects of selected commercial antidiabetic polyherbal formulation, Mehon, for total phenolic and total flavonoid contents and ability to inhibit key carbohydrate hydrolyzing enzymes, namely, 𝛼- amylase and 𝛼-glucosidase. Furthermore, the ability of the extracts to adsorb, entrap, transport glucose, and amylolysis kinetics were also evaluated by in-vitro methods.
Quantitative phytochemical analysis showed HAE exhibited higher TPC and TFC. TPC was measured with FC reagent, i.e., initially not specific for phenol as it is grounded on color formation, therefore, 90 min incubation assures color change and measures the existence of phenolic compounds. Total flavonoid content was determined using aluminum chloride method. Aluminum chloride will form a stable complex with carbonyl group at C4 and hydroxyls at C3 (flavonols) and C5 in flavonols and flavones [13,14]. Our results are in accordance with previous studies on Caesalpinia bonduc (L.) Roxb [14,15].
𝛼-Amylase and 𝛼-glucosidase are key carbohydrate hydrolyzing enzymes responsible for breaking 𝛼,1-4 bonds in disaccharides and polysaccharides, liberating glucose [16,17,18]. Hyperglycemia, the hallmark of DM can be maintained by inhibition of these chief enzymes where it was observed that both the extracts of Mehon showed satisfactory inhibitory activities. α-glucosidase is the vital enzyme involved in the digestion of polysaccharides or disaccharides to monosaccharides, increasing the blood glucose level [19,20,21]. Hence, delay in digestion of polysaccharides can be considered one of the primary mechanisms to control hyperglycemia, which can be achieved by inhibition of α-glucosidase [22,23,24]. Several previous scientific reports have shed light on the inhibition of these key enzymes [14,17].
The results of the study revealed a higher adsorption capacity of the Mehon extracts (HAE and AQE). Both insoluble and soluble constituents, such as fibers and bioactive compounds, might have attributed to the adsorption capacity. Earlier reports have confirmed constituents from different sources to adsorb glucose. The results also showed that the AQE and HAE extracts of Mehon can bind glucose at lower glucose concentrations (5 mM), thereby decreasing the volume of accessible glucose for transport across the intestinal lumen, therefore, reducing the postprandial glucose level [18].
Glucose dialysis retardation index (GDRI) is a suitable in-vitro criterion to evaluate glucose absorption in the gastrointestinal tract [19]. A higher GDRI indicates a higher retardation index of glucose by the sample. α- amylase inhibition can be considered an important step in glucose diffusion retardation by the extracts under study, thus gradually controlling the release of glucose from the starch [19,20,22]. Previous reports have mentioned several possible factors that may be responsible for GDRI, i.e., inhibition of α- amylase enzyme, fiber concentration, the presence of inhibitors on fibers, encapsulation of starch/enzyme by the fibers present in the sample, thereby, reducing the accessibility of starch to the enzyme, and direct adsorption of the enzyme on fibers, leading to decreased amylase activity [18,20].
The mechanism of glucose transport across the yeast cell membrane has been receiving attention as an important method for in vitro screening of the hypoglycemic effect of various compounds/medicinal plants [18,21]. It was observed that both extracts of Mehon promoted glucose transport across the membrane of yeast cells. The rate of glucose uptake into the yeast cells was linear in all the five glucose concentrations considered in the study. Our results are in accordance with previous reports [21,22].

5. Conclusions

The observed results in the present study validate the antidiabetic activities of HAE and AQE of Mehon by several in-vitro methods viz. Total phenolic, total flavonoid contents, α-amylase and α-glucosidase inhibitory activities, glucose adsorption, glucose diffusion and glucose uptake at cellular levels by in-vitro yeast cells model. Thus, our study primarily emphasizes various mechanisms for the hypoglycemic activity by which an antidiabetic polyherbal formulation, Mehon, might be managing blood glucose levels, thus authenticating claims for the same.

Funding

This research received no external funding.

Acknowledgments

The authors are thankful to School of Sciences. Block 1, Jain (deemed to be University), Bangalore for infrastructural support.

Conflicts of Interest

The authors declare no conflict of interest.

Institutional Review Board Statement

Not applicable.

Informed Consent Statement

Not applicable.

Data Availability Statement

The data presented in this study are available in the article.

References

  1. Dey, L.; Anoja, S.; Attele, Y.C.S. Type two diabetes; Alternative medicine review. Thorne Res. 2002, 7, 45–58. [Google Scholar]
  2. Srivastava, A.K.; Maurya, R. Antihyperglycemic activity of compounds isolated from Indian medicinal plants. Indian J. Exp. Biol. 2010, 48, 294–298. [Google Scholar]
  3. Roglic, G.; Wild, S.; Green, A.; Sicree, R.; King, H. Global prevalence of diabetes: Estimates for the year 2000 and projections for 2030. Diabetes Care. 2004, 27, 1047–1053. [Google Scholar]
  4. Chattopadhyay, R.R. A comparative evaluation of some blood sugar lowering agents of plant origin. J. Ethnopharmacol. 1999, 67, 367–372. [Google Scholar] [CrossRef]
  5. Ojo, C.M.; Osunsanmi, O.F.; Zaharare, E.G.; Mosa, A.R.; Cele, D.N.; Oboh, M.O.; Opoku, A.R. In-vitro Anti-diabetic and Antioxidant Efficacy of Methanolic Extract of Encephalartos ferox leaves. Pharm. J. 2019, 11, 455–460. [Google Scholar] [CrossRef]
  6. Thengya, S.; Thiantongin, P.; Sontimuang, C.; Ovatlarnporn, C.; Puttarak, P. α-glucosidase and α-amylase inhibitory activities of medicinal plants in Thai antidiabetic recipes and bioactive compounds from Vitex glabrata R.Br. stem bark. J. Herb. Med. 2019, 19, 1–8. [Google Scholar] [CrossRef]
  7. Mayur, B.; Sandesh, S.; Shruti, S.; Sung-Yum, S. Antioxidant and 𝛼-glucosidase inhibitory properties of Carpesium abrotanoides L. J. Med. Plants Res. 2010, 4, 1547–1553. [Google Scholar]
  8. Pennathur, S.; Heinecke, W.J. Mechanisms of oxidative stress in diabetes: Implications for the pathogenesis of vascular disease and antioxidant therapy. Front. Biosci. 2004, 9, 565–574. [Google Scholar] [CrossRef]
  9. Gurudeeban, S.; Satyavani, K.; Ramanathan, T. Alpha glucosidase inhibitory effect and enzyme kinetics of coastal medicinal plants. Bangladesh J. Pharmacol. 2012, 7, 186–191. [Google Scholar] [CrossRef]
  10. Thilagam, E.; Parimaladevi, B.; Kumarappan, C.; Mandal, C.S. 𝛼-glucosidase and 𝛼-amylase inhibitory activity of Senna surattensis. J. Acupunct. 2013, 6, 24–30. [Google Scholar]
  11. Edwards, C.A.; Blackburn, A.N.; Craigen, L. Viscosity of food gums determined in vitro related to their hypoglycemic actions. Am. J. Clin. Nutr 1987, 46, 72–77. [Google Scholar] [CrossRef]
  12. Harish, M.; Ahmed, F.; Urooj, A. In vitro hypoglycemic effects of Butea monosperma Lam. leaves and bark M. J. Food Sci. Technol 2011, 51, 308–314. [Google Scholar] [CrossRef]
  13. Chang, CH.; Yang, M.H.; Wen, H.M.; Chern, J.C. Estimation of total flavonoid content in propolis by two complementary colorimetric methods. J. Food Drug Anal. 2002, 10, 178–182. [Google Scholar]
  14. Sembiring, N.E.; Elya, B.; Sauriasari, R. Phytochemical Screening, Total Flavonoid and Total Phenolic Content and Antioxidant Activity of Different Parts of Caesalpinia bonduc (L.) Roxb. Pharm. J. 2018, 10, 123–127. [Google Scholar] [CrossRef]
  15. Gropper, S.S.; Smith, J.L. Advanced Nutrition and Human Metabolism; Cengage Learning: Hampshire, UK, 2012. [Google Scholar]
  16. Rolfes, S.R.; Pinna, K.; Whitney, E. Understanding Normal and Clinical Nutrition; Cengage Learning Inc.: Belmont, CA, USA, 2008. [Google Scholar]
  17. Carene, M.N.; Picot, A.; Subratty, H.; Mahomoodally, F.M. Inhibitory Potential of Five Traditionally Used Native Antidiabetic Medicinal Plants on 𝛼-Amylase, 𝛼-Glucosidase, Glucose Entrapment, and Amylolysis Kinetics In Vitro. Adv. Pharmacol. Sci. 2014, 2014, 739834. [Google Scholar]
  18. Bhutkar, M.A.; Bhise, SB. In vitro assay of alpha amylase inhibitory activity of some indigenous plants. Int. J. Chem. Sci. 2012, 10, 457–462. [Google Scholar]
  19. Lopez, G.; Ros, G.; Rincon, F.; Periago, M.J.; Martinez, M.C.; Ortuno, J. Relationship between physical and hydration properties of soluble and insoluble fiber of artichoke. J. Agric. Food Chem. 1996, 44, 2773–2778. [Google Scholar] [CrossRef]
  20. Ou, S.; Kwok, K.C.; Li, Y.; Fu, L. In vitro study of possible role of dietary fiber in lowering postprandial serum glucose. J. Agr. Food Chem. 2001, 49, 1026–1029. [Google Scholar] [CrossRef]
  21. Illiano, G.; Cuatrecasas, P. Glucose transport in fat cell membranes. J. Biochem. 1971, 246, 2472–2479. [Google Scholar] [CrossRef]
  22. Teusink, B.; Diderich, J.A.; Westerhoff, H.V.; Van Dam, K.; Walsh, MC. Intracellular glucose concentration in derepressed yeast cells consuming glucose is high enough to reduce the glucose transport rate by 50%. J. Bacteriol. 1998, 180, 556–562. [Google Scholar] [CrossRef]
  23. Eichler, H.G.; Korn, A.; Gasic, S.; Pirson, W.; Businger, J. The effect of a new specific α-amylase inhibitor on post prandial glucose and insulin excursions in normal subjects and type 2 (non-insulin-dependent) diabetic patient. Diabetologia 1984, 26, 278–281. [Google Scholar] [CrossRef]
  24. Chiba, S. Molecular mechanism in alpha glucosidase and glucoamylase. Biosci. Biotechnol. Biochem. 1997, 61, 1233–1239. [Google Scholar] [CrossRef]
Figure 1. Glucose-binding capacity of HAE and AQE at different glucose concentrations. Values are mean ± SE of triplicate determinations. Significant values (p ≤ 0.0001).
Proceedings 79 00007 g001
Figure 2. Effect of Mehon extract on the uptake of glucose by yeast cells. Values are mean of triplicate determinations. (a) AQE—Aqueous extract, (b) HAQ—Hydro-alcoholic extract.
Proceedings 79 00007 g002
Table 1. TPC and TFC values are represented as Mean ± SE, IC50 values of HAE and AQE against 𝛼-amylase and α-glucosidase inhibition
Mehon ExtractsTPC GAE/mgTFC QE/mgα-Amylase
Inhibition IC50 μg/mL
α-Glucosidase
Inhibition IC50 μg/mL
HAE95.44 ± 0.2286 ± 0.15581.5 156.95
AQE47.87 ± 0.2938.82 ± 0.15872.88800.63
Table 2. Effect of Mehon extracts on glucose diffusion and glucose dialysis retardation index (GDRI).
SampleGlucose Content in Dialysate (mM)
30 min60 min120 min180 min
Control0.929 ± 0.0811.31 ± 0.0431.503 ± 0.041.744 ± 0.13
AQE0.767 ± 0.05(17.44)1.21 ± 0.053 (7.66)1.398 ± 0.07 (7)1.502 ± 0.014(13.87)
HAE0.674 ± 0.05 (27.48)1.062 ± 0.05(19.08)1.283 ± 0.043 (14.63)1.488 ± 0.04(14.67)
Values in parenthesis indicate GDRI. Represented as Mean ± SD (n = 3).
Table 3. Effect of Mehon extracts on extracts on starch digestibility and GDRI.
Glucose content in dialysate (mM)
30 min60 min120 min180 min
Control0.00.28 ± 0.0050.354 ± 0.0030.446 ± 0.009
AQE0.0 (100)0.134 ± 0.03 (52.5%)0.228 ± 0.027 (34.19%)0.38 ± 0.07 (14.25%)
HAE0.0 (100)0.152 ± 0.06 (45.7%)0.24 ± 0.047 (30.86%)0.364 ± 0.049(18.59%)
Values in parenthesis indicate GDRI. Represented as Mean ± SD (n = 3).
Publisher’s Note: MDPI stays neutral with regard to jurisdictional claims in published maps and institutional affiliations.

