Proceeding Paper

Assessment of NF-κB-SN50’s Effect on Adipose Tumor Necrosis Factor-Alpha and Angiotensinogen Secretion and Expression †

by
Lotfi S. Bin Dahman
1,2,3,*,
Nasser M. Al-Daghri
1,*,
Assim A. Alfadda
2,
Reem M. Sallam
4 and
Philip G. McTernan
5
1
Department of Biochemistry, College of Science, King Saud University, Riyadh 11451, Saudi Arabia
2
Obesity Research Center, College of Medicine, King Saud University, Riyadh 11461, Saudi Arabia
3
Medical Biochemistry Department, College of Medicine and Health Sciences, Hadhramout University, Mukalla 50511, Yemen
4
Medical Biochemistry & Molecular Biology Department, Faculty of Medicine, Ain Shams University, Abbaseya, Cairo 11381, Egypt
5
School of Science and Technology, Department of Biosciences, Nottingham Trent University, Nottingham NG1 8NS, UK
*
Authors to whom correspondence should be addressed.
Presented at the 1st International Electronic Conference on Biomolecules: Natural and Bio-Inspired Therapeutics for Human Diseases, 1–13 December 2020; Available online: https://iecbm2020.sciforum.net/.
Proceedings 2021, 79(1), 15; https://doi.org/10.3390/IECBM2020-08579
Published: 30 November 2020

Abstract

:
Central adiposity is one of the significant determinants of obesity-related hypertension risk, which may arise because of the pathogenic inflammatory nature of the abdominal fat depot. Pro-inflammatory cytokine and adipokine upregulation through nuclear factor-kappa B (NF-κB) activation in adipose tissue has been considered to have an important function in the pathogenesis of obesity-related hypertension. This study aimed to ascertain the effect of an NF-κB inhibitor (SN50) on TNF-α and angiotensinogen (AGT) secretion and expression in mediating the anti-inflammatory effect through its effects on NF-κB activity in human adipose tissue. Primary human adipocytes were isolated from 20 subjects among 10 overweight subjects and 10 obese subjects with and without hypertension and treated with 10 ng/mL of lipopolysaccharides (LPS) in the presence and absence of NF-κB inhibitor SN50 (50 μg/mL). TNF-α secretion and NF-κB p65 activity were detected in supernatants extracted from cultured cells treated and untreated with LPS (10 ng/mL) and SN50 (50 μg/mL) using commercially available assays. The NF-κB p65 protein and AGT were detected by the western blot technique. Gene expression of TNF-α and AGT were detected in cells and performed using quantitative real-time polymerase chain reaction (RT-PCR). Treatment of abdominal subcutaneous (AbdSc) adipocytes with LPS (10 ng/mL) caused a significant increase in NF-κB p65 in overweight subjects and obese subjects with and without hypertension (p = 0.001) at 24 h of incubation, whereas, SN50-NF-κB inhibitor caused a reduction in NF-κB p65 in overweight subjects (p < 0.001) and obese subjects with and without hypertension (p = 0.001) at 24 h of incubation. Treatment of AbdSc adipocytes with 10 ng/mL LPS caused a significant increase in TNF-α secretion in overweight subjects and obese subjects at all time points (p < 0.001), whereas SN50 led to a decrease in TNF-α secretion at 3 and 12 h of incubation. Treatment of AbdSc adipocytes with LPS (10 ng/mL) caused a twofold increase in TNF-α and AGT gene expression compared with untreated cells, whereas, in the presence of SN50, it reduced mRNA AGT levels in both groups. Taken together, these adipokines with NF-κB activation may represent important biomarkers to evaluate hypertension risk and may provide insight into the pathogenesis of obesity-related hypertension.

1. Introduction

Abdominal adipose tissue is considered to be particularly pathogenic in nature with increasing obesity [1]. Adipose tissue is an endocrine organ that secretes numerous bioactive peptides often referred to as adipocytokines, which have been proposed to participate in the development of hypertension [2]. From a basic physiological perspective, adipose tissue growth is tightly coupled to angiogenesis and microcirculation development. Tumor necrosis factor-alpha (TNF-α) is known to regulate angiotensinogen (AGT) in hepatocytes, as the AGT promoter contains a cytokine-inducible enhancer known as the acute phase response element [3].
Pro-inflammatory adipocytokine secretion from adipose tissue is coordinated through the activation of the nuclear factor-kappa B (NF-κB) transcription factor [4], which regulates the transcription of genes involved in inflammatory responses, cell growth control, and apoptosis. Thus, additional pathways in the development of hypertension may emanate from NF-κB activation. In resting cells, NF-κB is bound to I kappa B (IκB) inhibitors, which prevent NF-κB from entering the nucleus.
Extracellular stimuli such as pro-inflammatory cytokines, chemokines, and lipopolysaccharides (LPS) activate a set of proteins termed IκB kinases (IKKs), which phosphorylate IκB leading to an altered conformation of IκB, which releases NF-κB to enter the nucleus and activates transcription of target genes [5]. Lipopolysaccharides increase the secretion of cytokines such as TNF-α via NF-κB activation [6]. TNF-α also induces the transcription of AGT via NF-κB [7]. Moreover, there is accumulating evidence that indicates angiotensin (ANG) II is capable of inducing an inflammatory response in the cardiac tissue through the activation of NF-κB [8].
However, the study of NF-κB has, to some extent, been hampered by the lack of selective and specific inhibitory compounds. Our study, therefore, investigated the role of a cell-permeable peptide, SN50, as an NF-κB inhibitor. This peptide consists in the nuclear localization sequence of NF-κB subunit (p50) fused with the hydrophobic region of the signal sequence of Kaposi’s fibroblast growth factor. Lin et al. [9] demonstrated that SN50 is capable of inhibiting the nuclear import of NF-κB in human monocytic cells and murine endothelial cells stimulated with LPS and TNF-α.
We hypothesized that the activation of NF-κB, and the subsequent secretion and expression of TNF-α, and AGT from human adipose tissue may play an important role in the development of arterial hypertension in obese subjects. The results may enable us to understand the role of various pro-inflammatory agents upregulated by activated NF-κB in the development of arterial hypertension. Our study was aimed to ascertain the effect of the NF-κB inhibitor, SN50, on reducing TNF-α and AGT secretion and expression in mediating the anti-inflammatory effect through its effects on the NF-κB inflammatory pathway in human adipose tissue.

2. Materials and Methods

2.1. Subjects and Adipose Tissue

Abdominal subcutaneous adipose tissue (AbdScAT) samples were obtained from 10 overweight (mean age: 30.71 ± 9.69; and a mean BMI: 27.92 ± 0.66) and 10 obese subjects with and without hypertension (mean age: 41.6 ± 12.62; and a mean BMI: 36.245 ± 6.95). They were undergoing abdominal adipose tissue liposuction for cosmetic reasons. No subject on any regular medication was taken. Subjects with chronic debilitating diseases were excluded from the study. All subjects gave their informed consent. Personal information and anthropometric measurements were taken from each subject. The previous history of diabetes, hypertension, and/or any risk factors were mentioned. All subjects fasted overnight before surgery, and only normal saline was administered intravenously until the tissue liposuction was taken. The study was carried out at the Chair for Biomarkers of Chronic Diseases and Obesity Research Center, King Saud University, Riyadh, KSA. Ethical approval was granted by the ethics committee of the King Khalid University Hospital, College of Medicine, King Saud University, Riyadh, KSA.

2.2. Isolation and Culture of Mature Adipocytes

Adipose tissue liposuction samples were digested for 30 min at 37 °C in Hank’s balanced salt solution (HBSS) containing 2 mg/mL collagenase under intermittent shaking as described by [10]. The mixture was then centrifuged at 2000 rpm for 5 min at room temperature. After centrifugation, the tubes were tilted, allowing the densely packed adipocytes layer (cake of fat cell) to flow gently into a clean falcon tube. Mature fat cells were then washed by pouring in 10–15 mL of Dulbecco’s Modified Eagle Medium/Nutrient Mixture (DMEM) F-12 phenol-red free (1 mL containing 15 mmol/L glucose, supplemented with 100 U/mL of penicillin and 100 µg/mL streptomycin). Fat cells were centrifuged at 1000 rpm for 1 min. Once the adipocytes had been washed, the liquid was removed from beneath and the cake was collected into a new falcon tube. Following isolation of these cells, cells (0.2 mL, 100,000 adipocytes) were plated in 6-well tissue culture plates with a culture medium (1 mL containing 15 mmol/L of glucose and supplemented with 100 U/mL of penicillin, 100 µg/mL streptomycin, and 100 µg/mL transferrin). The cells were preincubated with SN50 and SN50M peptides (50 µg/mL) before the initiation of stimulation to enable efficient membrane translocation at 37 °C in 95% air and 5% CO2 for 2 h. After preincubation, the cells were treated with 10 ng/mL LPS for 03, 12, 24, and 48 h before the experiments. Initial experiments were undertaken to evaluate the optimum concentration of NF-κB inhibitor (concentration range: 1, 10, 50, and 100 µg/mL SN50) and LPS (concentration range: 1, 10, and 100 ng/mL) without causing cellular death; these were deemed as 50 µg/mL SN50 and 10 ng/mL LPS. Following treatment, conditioned media and adipocytes were separated by centrifugation at 1000 rpm for 1 min. After centrifugation, the infranatant was separated and stored at −80 °C until adipokine measurement, whereas fat cells were used for protein expression (NF-kB p65 activity assay and western blot) and gene expression of TNF-α and ANG.

2.3. NF-κB p65 Activity Assay

NF-κB p65 activity was assessed using the transcription factor assay kit according to the manufacturer’s instructions (TransAM NF-κB p65 kit, Active Motif, Rixenart, Belgium; cat. no. 40096), as described by [11]. In brief, 20 µg of total protein were used to detect NF-κB p65 activity. Jurkat cell nuclear extract (2.5 µg) was used as a positive control for NF-κB p65 activation. This extract is optimized to give a strong signal when used at 2.5 µg/well. Wild-type consensus oligonucleotides were used in the assay as a competitor for NF-κB binding to monitor the specificity of the assay. Twenty picomoles per well of used oligonucleotides was enough to prevent NF-κB binding to the probe immobilized on the plate. Conversely, the mutated consensus oligonucleotides were used as an noncompetitor for NF-κB binding.

2.4. Isolation and Protein Quantification

The total protein amount was quantified using the Bradford DC (detergent compatible) protein assay kit (Bio-Rad, USA, cat. no. 500-0111) as described by Bradford [12]. Equal amounts of protein from each sample (20 µg) and pertained markers were heated for 5 min at 95 °C in a loading sample buffer, loaded, and separated by 12% sodium dodecyl sulphate-polyacrylamide (SDS-PAGE) running gel and 4% SDS-PAGE stacking gel. Gels were run for 2 h at 120 volts and then blotted and transferred onto polyvinylidene fluoride (PVDF) membrane for 25 min at 15 volts using a liquid transfer system. After transfer, the membrane was washed with 1X tris-buffered solution (TBS) for 5 min. The membrane was blocked for 1 h at room temperature in a blocking buffer containing TBS with 0.1% Tween20, 5% nonfat dried milk, and 1% bovine serum albumin (BSA). The membrane was then incubated using gentle agitation overnight at 4 °C with antibodies against the following: polyclonal rabbit IgG NF-kB p65 (1:1000) (Cell Signaling Technology), polyclonal rabbit IgG angiotensinogen (1:200) (Phoenix Pharmaceuticals Industries, Riyadh, Saudi Arabia), and polyclonal goat IgG TNF-α (1:1000) (R&D Systems, Minneapolis, MN, USA). After incubation, the membrane was then washed three times with TBS/T for 5 min each wash. The membrane was then incubated with the appropriate horse radish peroxidase (HRP)-conjugated secondary antibody with gentle agitation for one hour and washed five times for 5 min with TBS/T. The membrane was incubated with chemiluminescent development (luminol and peroxide substrate) with gentle agitation for 1 min in a dark room, and the membrane was drained, wrapped in plastic wrap, and exposed on the X-ray image.

2.5. Isolation and Purification of Total RNA

Cells from 6 wells were extracted with 200 μL of RNA (for RNA stabilization). Total RNA was isolated using the RNeasy mini kit according to the manufacturer’s instructions (Qiagen, GmBH, Hilden, Germany). RNA concentration and purity were performed using the Nanodrop ND-1000 spectrophotometer (Thermo Fisher Scientific, Waltham, MA, USA).

2.6. cDNA Synthesis

The reverse transcription step was conducted on 200 ng RNA using the QuantiTect reverse transcription kit (Qiagen, Valencia, CA, USA) as described by Heller et al. [13]. In brief, purified RNA samples (200 ng/µL) were incubated with 2 µL of genomic DNA wipeout buffer at 42 °C for 2 min to effectively remove contaminating genomic DNA. After genomic DNA elimination, the RNA samples were reverse-transcribed using a master mix prepared from Quantiscript reverse transcriptase (1 µL), RT primer mix (1 µL), and Quantiscript RT buffer (4 µL) at 42 °C for 15 min.

2.7. Quantitative Real-Time PCR

All the experiments were performed in 96 well plates with the CFX96 Real-Time PCR detection system (Bio-Rad, Hercules, CA, USA) using a premade TaqMan probe (for AGT: Hs01586213_m1 and TNF-α Hs00174128_m1). Real-time relative expression experiments were performed according to the manufacturer’s instructions. In brief, 1 µL of cDNA was used in a final PCR volume of 20 µL, containing 10 µL of the TaqMan Master Mix (AB Applied Biosystems, Warrington, UK), 8 µL of RNA-free water, and 1 µL of the TaqMan probe. Polymerase chain reaction cycles were as follows: 10 min at 42 °C followed by 40 cycles for 15 s at 95 °C and 1 min at 60 °C. All reactions were multiplexed with the housekeeping gene human 18S ribosomal RNA (AB Applied Biosystems, Warrington, UK), which was used as a reference, enabling data to be expressed as delta cycle threshold (∆CT) values (where ∆CT = CT18s − CTgene of interest). Quantification of target mRNA was carried out by comparison of the number of cycles required reaching the reference and target threshold values (ΔΔCT method). Reactions were performed in triplicate for each sample. All statistics were performed at the ∆CT stage to exclude potential bias due to the averaging of data transformed through a 2-∆∆CT equation.

2.8. Statistical Analysis

Data were analyzed using the Statistical Package for Social Sciences (SPSS) for Windows (version 16.0 SPSS Inc., Chicago, IL, USA). Data are expressed as means ± standard errors (SEs). An independent sample t-test was done for delta CT (∆CT) among untreated and various treatment groups. p < 0.05 was considered as a significant value.

3. Results

3.1. Inhibitory Effect of SN50 on NF-kB Translocation and Activity in Cultured Human AbdSc Adipocytes

Figure 1 shows the effect of SN50 on NF-κB translocation and activity in untreated and LPS-treated cells taken from overweight and obese subjects with and without hypertension at different time points. Treatment of adipocytes with 10 ng/mL LPS resulted a significant increase in NF-κB activity in obese subjects with and without hypertension compared with overweight subjects at 3 and 12 h, respectively (controls: 0.32 ± 0.06 vs. LPS: 0.54 ± 0.06; p = 0.005; 0.34 ± 0.02 vs. 0.57 ± 0.04; p = 0.001) and a significant increase in both groups at 24 h (overweight group: controls: 0.21 ± 0.07 vs. LPS: 0.46 ± 0.02; p = 0.002; obese with or without hypertension group: controls: 0.33 ± 0.04 vs. 0.54 ± 0.04; p = 0.005). Coincubation with SN50 (50 µg/mL) effectively abrogated LPS-stimulated NF-κB activity in the obese with or without hypertension group at 3, 12, and 24 h (3 h, LPS: 0.54 ± 0.06 vs. SN50 + LPS: 0.35 ± 0.06; p = 0.01; 12 h, LPS: 0.57 ± 0.04 vs. SN50 + LPS: 0.31 ± 0.05; p < 0.001; 24 h, LPS: 0.54 ± 0.05 vs. SN50 + LPS: 0.41 ± 0.11; p < 0.001), respectively and in the overweight group only at 24 h (LPS: 0.46 ± 0.02 vs. SN50 + LPS: 0.24 ± 0.03; p < 0.001). In contrast, SN50M (inactive peptide) did not affect the ability of LPS to activate and translocate NF-κB. Incubation with SN50 alone did not influence NF-κB activity in both groups (overweight group: 3 h; controls: 0.38 ± 0.04 vs. SN50: 0.36 ± 0.04; p = not significant (NS); obese with or without hypertension group; 3 h; controls: 0.32 ± 0.06 vs. SN50: 0.41 ± 0.06; p = NS; A 12 h; controls: 0.33 ± 0.07 vs. 0.29 ± 0.1; p = NS; B 12 h; controls: 0.34 ± 0.02 vs. SN50: 0.29 ± 0.04; p = NS; overweight group, 24 h; controls: 0.21 ± 0.07 vs. SN50: 0.14 ± 0.09; p = NS; obese with or without hypertension group, 24 h; controls: 0.33 ± 0.04 vs. SN50: 0.32 ± 0.08; p = NS). Values are expressed as means ± SEs using the sample student t-test.

3.2. SN50 Reduces NF-κB p65 Protein in LPS-Stimulated Adipocytes

To explore whether inhibition of the NF-κB p65 protein reduces LPS-stimulated adipocytes, we isolated protein from adipocytes treated with 10 ng/mL LPS for 3, 12, and 24 h with or without SN50 (50 µg/mL). LPS alone increased NF-κB protein levels compared with those in control cells (Figure 2). In contrast, coincubation with LPS and SN50 resulted in a marked reduction in NF-κB p65 protein levels at 3 and 12 h but did not affect protein levels at 24 h.

3.3. LPS-Induced TNF-α Secretion Is Linked to the Activation of NF-kB Pathway in Cultured Human AbdSc Adipocytes

The role of the NF-κB pathway in the gene expression and secretion of TNF-α was determined through the use of a specific inhibitor to this pathway: cell-permeable inhibitor peptide, SN50. Figure 3 shows that the use of SN50 (50 μg/mL) caused a dose-dependent reduction in the LPS- (10 ng/mL) induced activation of TNF-α secretion in both groups at different time points (overweight group, 3 h; LPS: 31.1 ± 3.4 vs. SN50 + LPS: 12.6 ± 2.6 pg/mL; p = 0.008; obese ± hypertension group: LPS: 82.2 ± 4 vs. SN50 + LPS: 54.4 ± 3.1 pg/mL; p < 0.001; overweight group, 12 h; LPS: 140 ± 7 vs. SN50 + LPS: 124.7 ± 5.1 pg/mL; p = 0.09; obese ± hypertension group: LPS: 177.3 ± 6.7 vs. SN5 + LPS: 93.3 ± 5.3 pg/mL; p < 0.001; overweight group, 24 h; LPS: 80.3 ± 4.3 vs. SN50 + LPS: 47.3 ± 5.9 pg/mL; p = 0.02; obese ± hypertension group: LPS: 123.2 ± 6.2 vs. SN50 + LPS: 59 ± 5.2 pg/mL; p < 0.001). The maximum inhibition of TNF-α secretion (around 50%) was obtained with a concentration of 50 μg/mL. TNF-α secretion was increased in LPS-treated cells compared with untreated cells (controls) in both groups (overweight group, 3 h; controls: 7.1 ± 1.5 vs. LPS: 31.1 ± 3.4 pg/mL; p < 0.001; obese ± hypertension group: controls: 5.7 ± 1.3 vs. LPS: 82.2 ± 4 pg/mL; p < 0.001; overweight group, 12 h; controls: 2.0 ± 0.62 vs. LPS: 140 ± 7 pg/mL; p < 0.001; obese ± hypertension group: controls: 8.1 ± 1.2 vs. LPS: 177.3 ± 6.7 pg/mL; p < 0.001; overweight subjects, 24 h; controls: 32.2 ± 2.3 vs. LPS: 80.3 ± 4.3 pg/mL; p < 0.001; obese ± hypertension group: controls: 5.9 ± 2.1 vs. LPS: 123.2 ± 6.2 pg/mL; p < 0.001). Moreover, the maximum effect of LPS was shown at 12 h and gradually significantly decreased after 24 h. TNF-α secretion was also significantly higher in the obese with and without hypertension group than in the overweight group. In contrast, there was no change observed in TNF-α secretion in the presence of SN50 alone compared with untreated cells in both groups (Figure 3), ((overweight group, 3 h; controls: 7.1 ± 1.5 vs. SN50: 4.3 ± 1.2 pg/mL; p = 0.16; 12 h; controls: 2.0 ± 0.62 vs. SN50: 9.5 ± 1.2 pg/mL; p = NS; 24 h; controls: 32.2 ± 3.2 vs. SN50: 3.2 ± 1.1 pg/mL; p < 0.001), (obese ± hypertension group, 3 h; controls: 5.7 ± 1.3 vs. SN50: 6.0 ± 1.1 pg/mL; p = 0.86; 12 h; controls: 8.1 ± 1.2 vs. SN50: 7.6 ± 1.1 pg/mL; p = 0.76; 24 h; controls: 5.9 ± 2.1 vs. SN50: 5.4 ± 1.5 pg/mL; p = 0.92)). Values are expressed as means ± SEs.

3.4. mRNA Expression of TNF-α in Cultured Human AbdSc Adipocytes

Figure 4 shows the mRNA TNF-α level in cultured human adipocytes treated with LPS and SN50 for 12 h taken from the overweight group (n = 10) and the obese with and without hypertension group (n = 10). Treatment of AbdSc adipocytes with LPS (10 ng/mL) increased the expression of the TNF-α gene twofold compared with untreated cells (controls) in both groups (controls: 1 vs. LPS: 1.87, p = 0.005 and controls: 1 vs. LPS: 2, p = 0.02, respectively). In contrast, the treatment of AbdSc adipocytes with LPS in the presence of SN50 (50 μg/mL) reduced the expression of the TNF-α gene compared with treated cells in the overweight group (LPS: 1.87 vs. SN50 + LPS: 1.15; p = 0.02), whereas, no significant change was observed in the expression of TNF-α mRNA level in the obese ± hypertension group (LPS: 2 vs. SN50 + LPS: 1.48; p = 0.14). Moreover, there was no effect for SN50 alone on TNF-α mRNA level in both groups (controls: 1 vs. SN50: 0.88, p = 0.51 and controls: 1 vs. SN50: 1.39, p = 0.11, respectively). No effect was shown for the inactive peptide, SN50M (data not shown). In contrast, expression of the TNF-α gene was increased twofold in the LPS-treated cell compared with controls in the combined groups studied (Figure 5) (controls: 1 vs. LPS: 1.96; p = 0.001) and significantly reduced in the presence of SN50 (LPS: 1.96 vs. SN50 + LPS: 1.20; p = 0.02).

3.5. mRNA Expression of AGT in Cultured Human AbdSc Adipocytes

Figure 6 shows mRNA AGT levels in human adipocytes treated with LPS and SN50 for 12 h taken from overweight patients (n = 10) and obese patients with and without hypertension (n = 10). Treatment of AbdSc adipocytes with LPS (10 ng/mL) caused a twofold increase in the expression of the AGT gene compared with untreated cells (controls) in both groups (controls: 1 vs. LPS: 2, p = 0.002 and controls: 1 vs. LPS: 2.23, p < 0.001, respectively). In contrast, the treatment of AbdSc adipocytes with LPS in the presence of SN50 (50 μg/mL) reduced the expression of the AGT gene compared with the treated cell in both groups (LPS: 2 vs. SN50 + LPS: 1.23, p = 0.02 and LPS: 2.23 vs. SN50 + LPS: 0.87, p < 0.001, respectively). Moreover, there was a significant change observed in the AGT mRNA level in the presence of SN50 alone in the overweight group but not in the obese ± hypertension group (controls: 1 vs. SN50: 0.5, p < 0.001 and controls: 1 vs. SN50: 0.81, p = 0.32, respectively). On the other hand, the expression of the AGT gene was increased by twofold in the LPS-treated cells and reduced in the presence of SN50 alone compared with untreated cells in the combined groups studied (Figure 7) (controls: 1 vs. LPS: 2.10, SN50: 0.65; p < 0.001, p = 0.04, respectively). The expression of the AGT gene was reduced twofold in the presence of SN50 compared with the treated cells (LPS: 2.10 vs. SN50 + LPS: 1.20; p = 0.02).

3.6. SN50 Reduces ANG Protein in LPS-Stimulated Adipocytes

LPS alone slightly increased AGT protein levels compared with those in the control cells. Coincubation with LPS and SN50 resulted in a slight reduction in AGT protein levels at 24 h (Figure 8).

4. Discussion

Despite the high prevalence of obesity and hypertension in Saudi Arabia, to date, no study has examined the relationships between pro-inflammatory adipokines and blood pressure in the obese, hypertensive phenotype as well as the role of signaling pathways in the development of hypertension in human adipose tissue. As obesity and hypertension are increasingly considered to develop through subclinical chronic inflammation, the role of the pro-inflammatory adipokines becomes increasingly important to understand [14]. Our study, focused on the NF-κB pathway as one signaling pathway contributing to the upregulation of pro-inflammatory adipokines such as TNF-α as well as RAS components like AGT in human adipose tissue, whose secretions in adipose tissue are coordinated through NF-κB activation. Harvested and isolated abdominal subcutaneous adipose tissue was used for this study.
Adipose tissue plays an important role in the secretion of certain pro-inflammatory adipokines and activation of these adipokines is coordinated through the NF-κB-dependent pathway [4,15,16,17]. The present study examined, in vitro, the effect of an NF-κB blocker (SN50) on TNF-α secretion as well as mRNA, TNF-α protein, and AGT expression in primary human adipocytes, which were isolated from overweight subjects and obese subjects with and without hypertension and treated with 10 ng/mL LPS as a potent stimulant pathogen at different concentrations and time points.
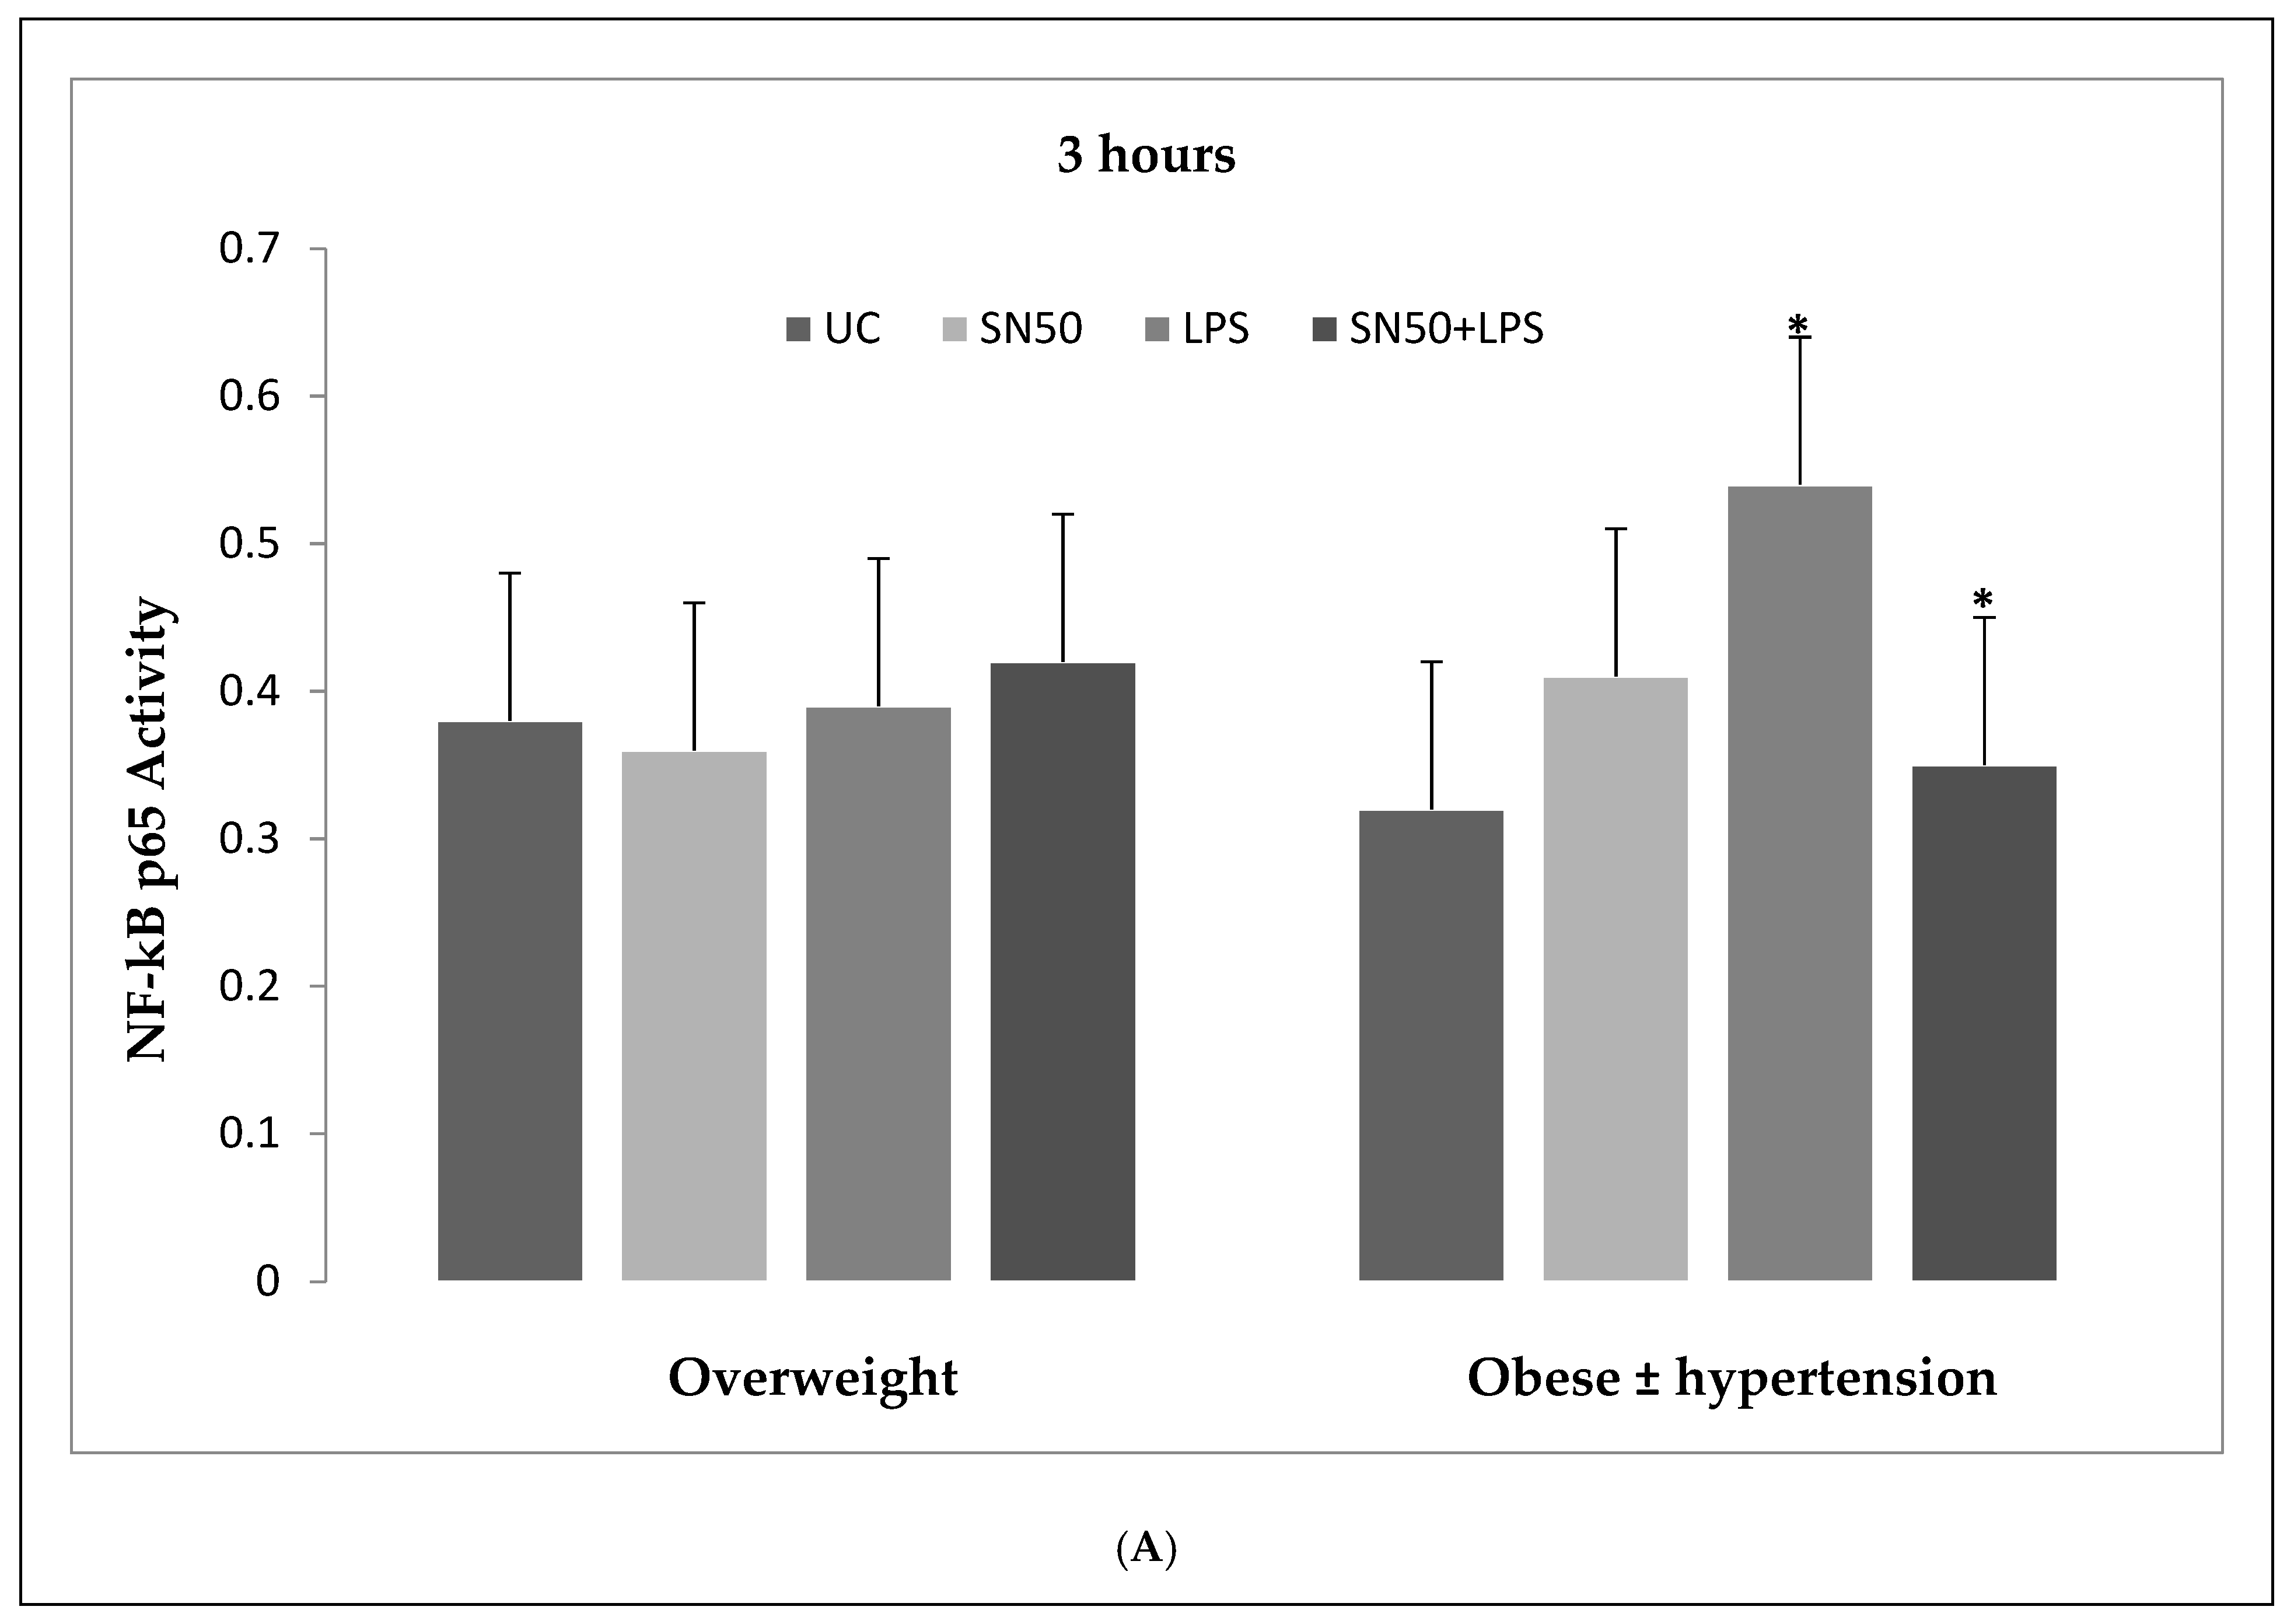
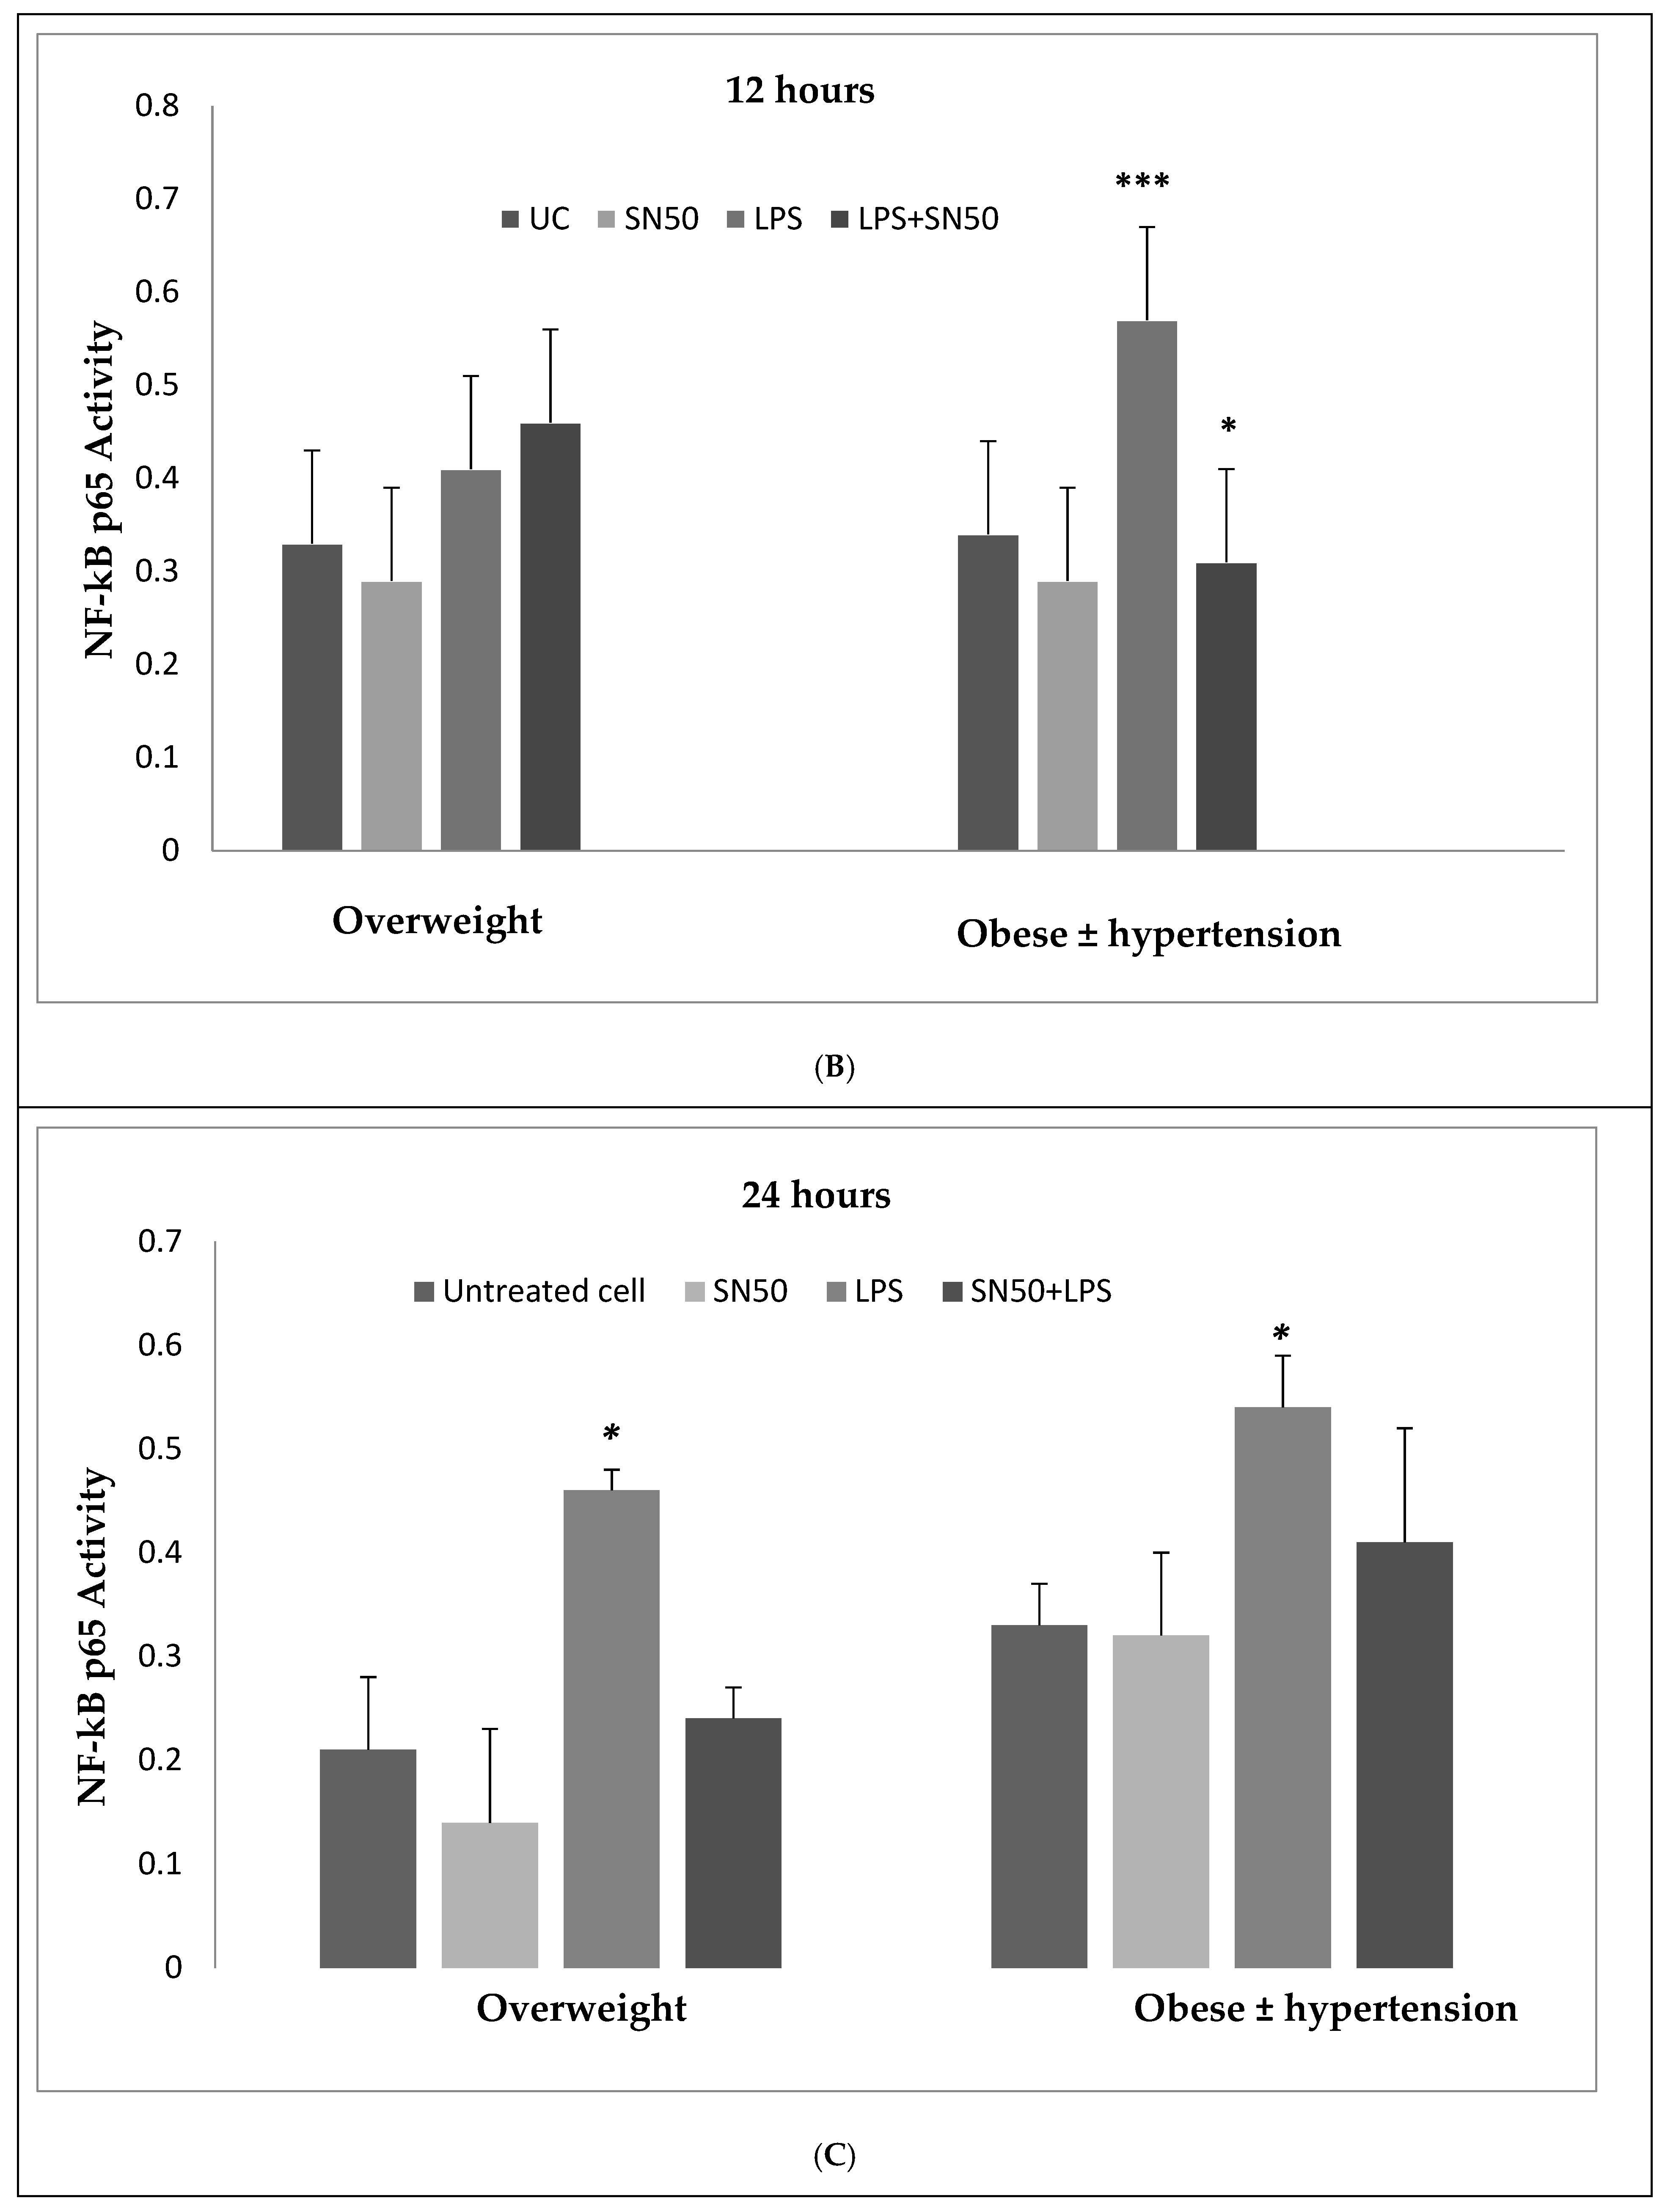
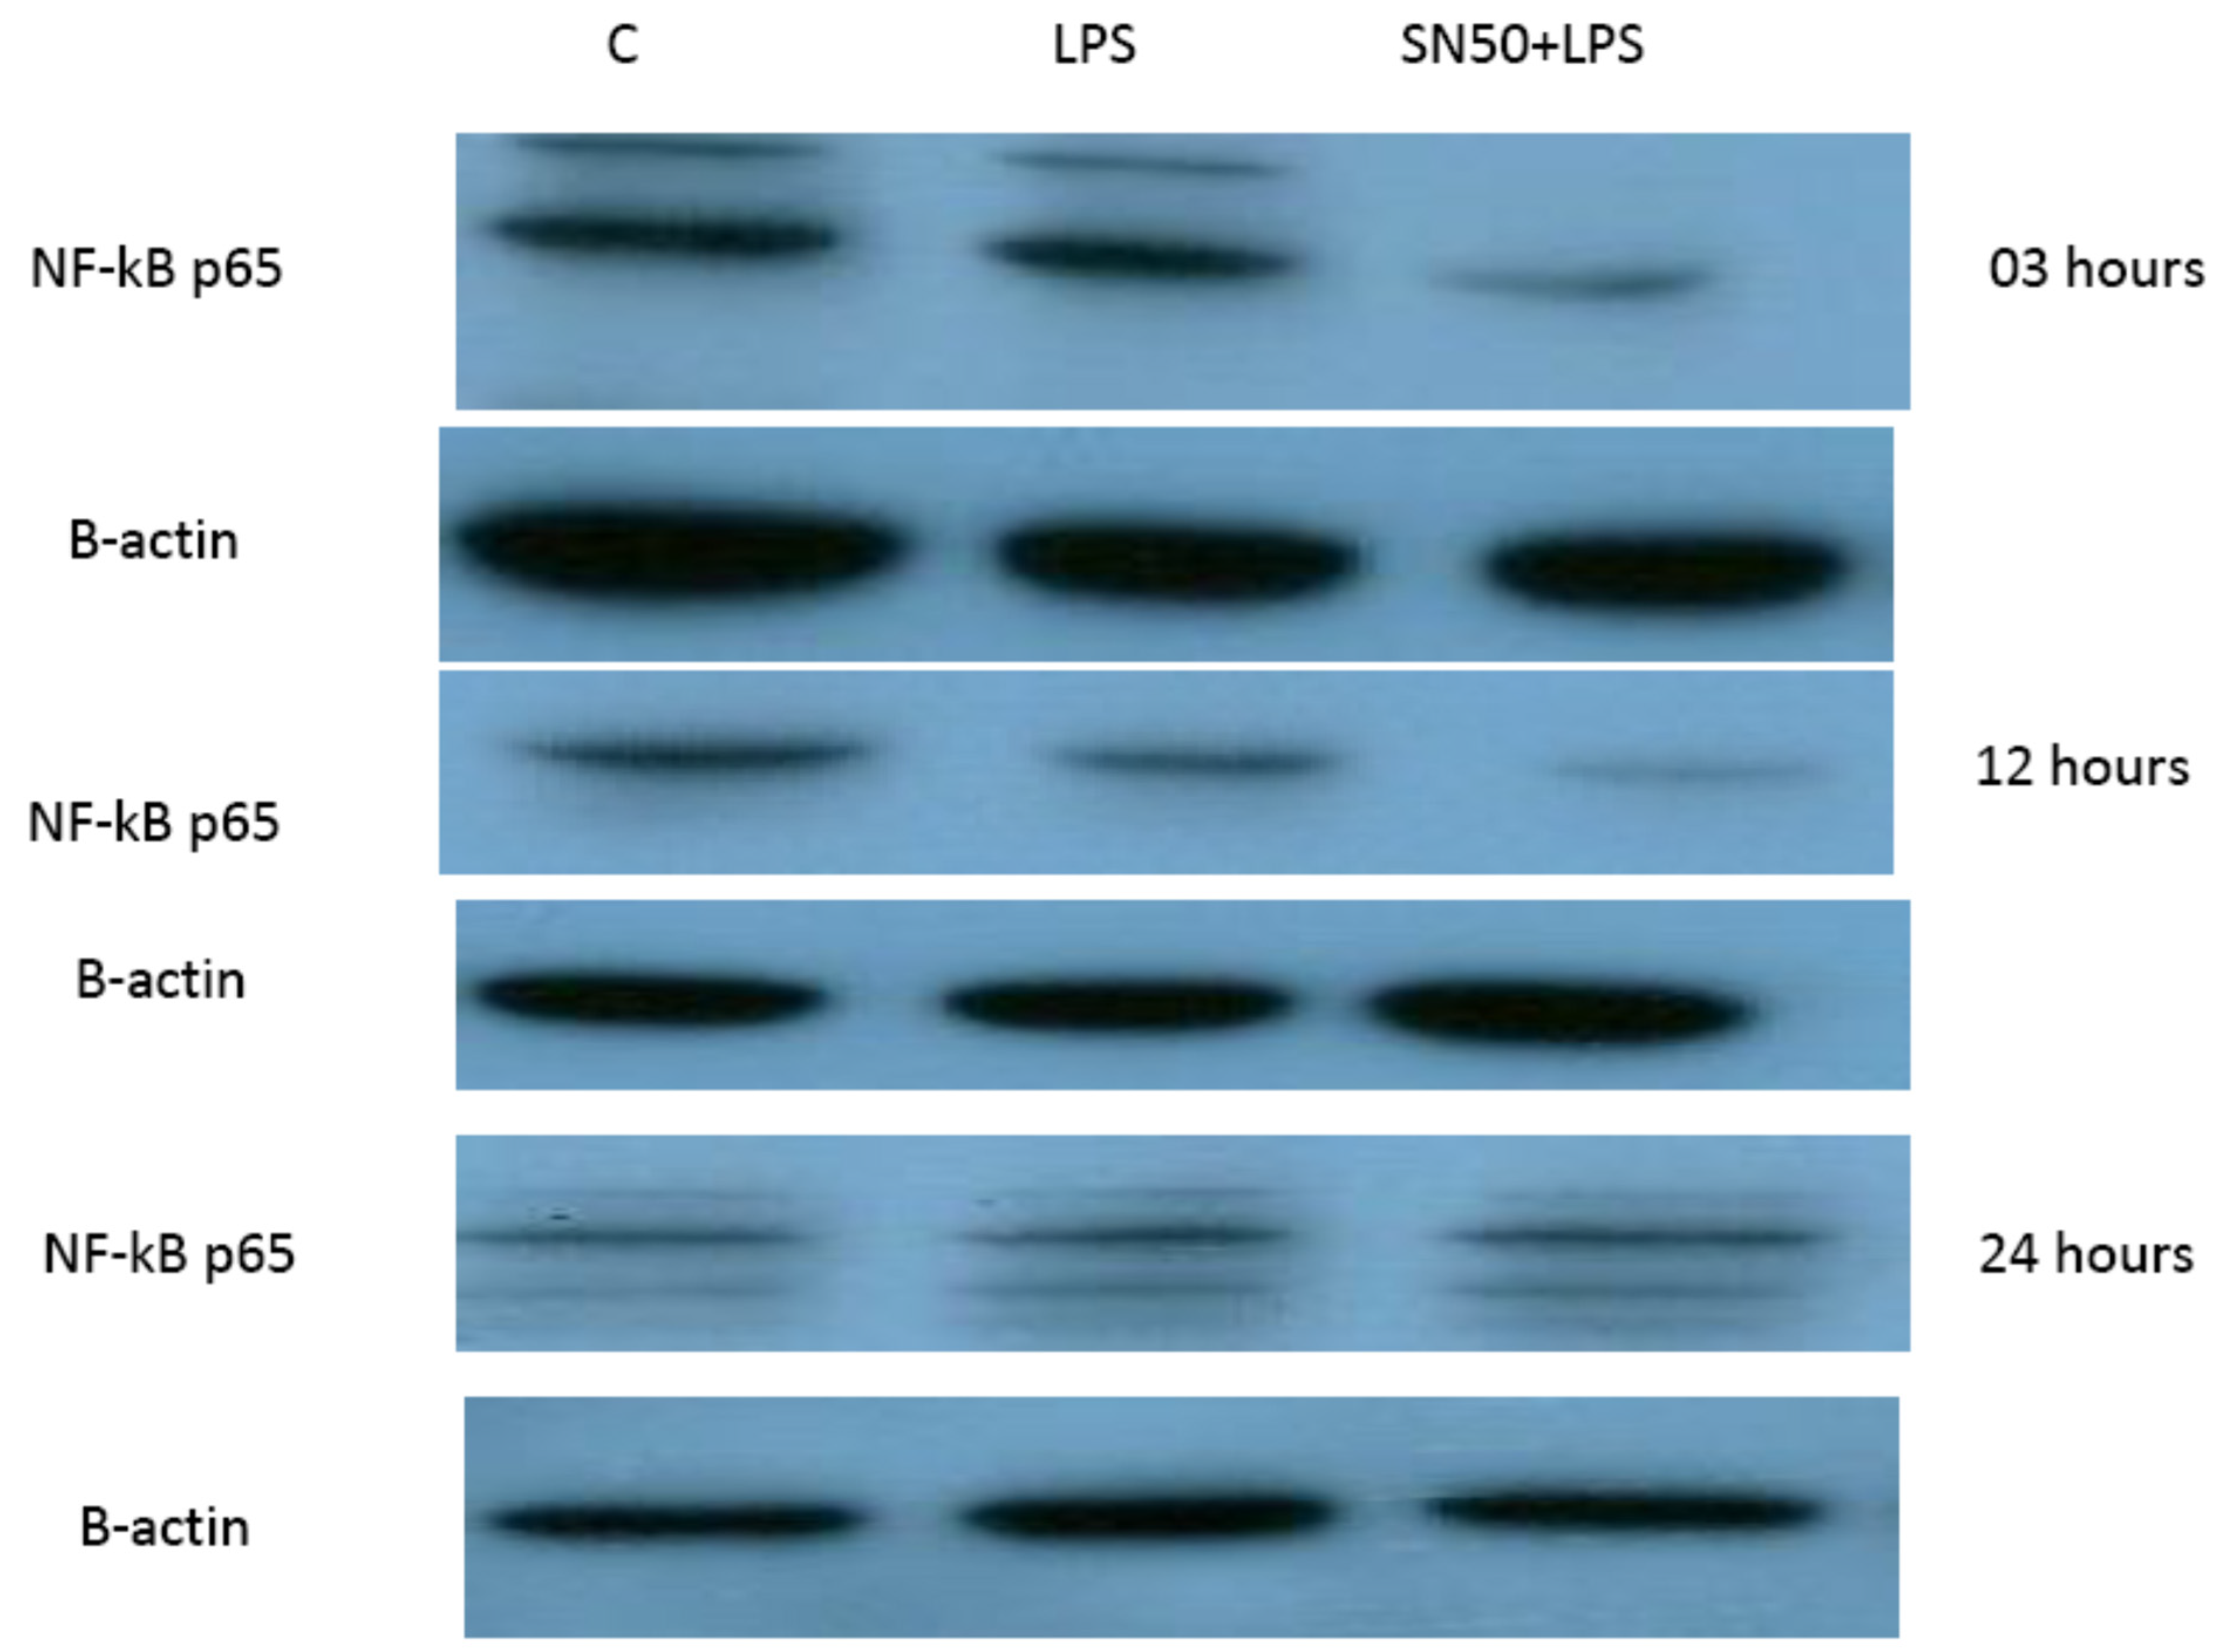
Our findings demonstrated that LPS significantly stimulates NF-κB activation in a concentration higher or equivalent to Jurkat cells (positive control cells) in both groups. Lipopolysaccharide also increase NF-κB p65 protein levels compared with those in control cells at 3 and 12 h and did not have an effect at 24 h. In contrast, coincubation with LPS and SN50 resulted in a marked reduction in NF-κB p65 levels as compared with those treated only with LPS. However, SN50 alone did not affect LPS through NF-kB activation and expression. Our findings suggest that SN50 at least in part suppresses NF-κB-mediated inflammatory pathways in adipose tissue. Another interesting finding is the relationship between NF-κB activation and the degree of adiposity. Our study observed a strong relationship between body mass index (BMI) and NF-κB p65, which remained significant independent of age.
Liposaccharide is a well-preserved component of the external part of the Gram-negative bacterial cell wall [18]. This molecule is recognized by the innate immune system via toll-like receptors (TLRs)—a class of proteins that play a key role in the innate immune system, which recognize antigens including LPS, on monocyte/macrophage activation. Activation of TLRs (particularly TLR-4) leads to translocation of NF-κB into the nucleus to initiate gene expression of cytokines like IL-1, IL-6, and TNF-α [18,19,20].
Numerous studies have shown that the endotoxin LPS has a potent inflammatory stimulant on cytokine secretion through NF-κB activation [4,
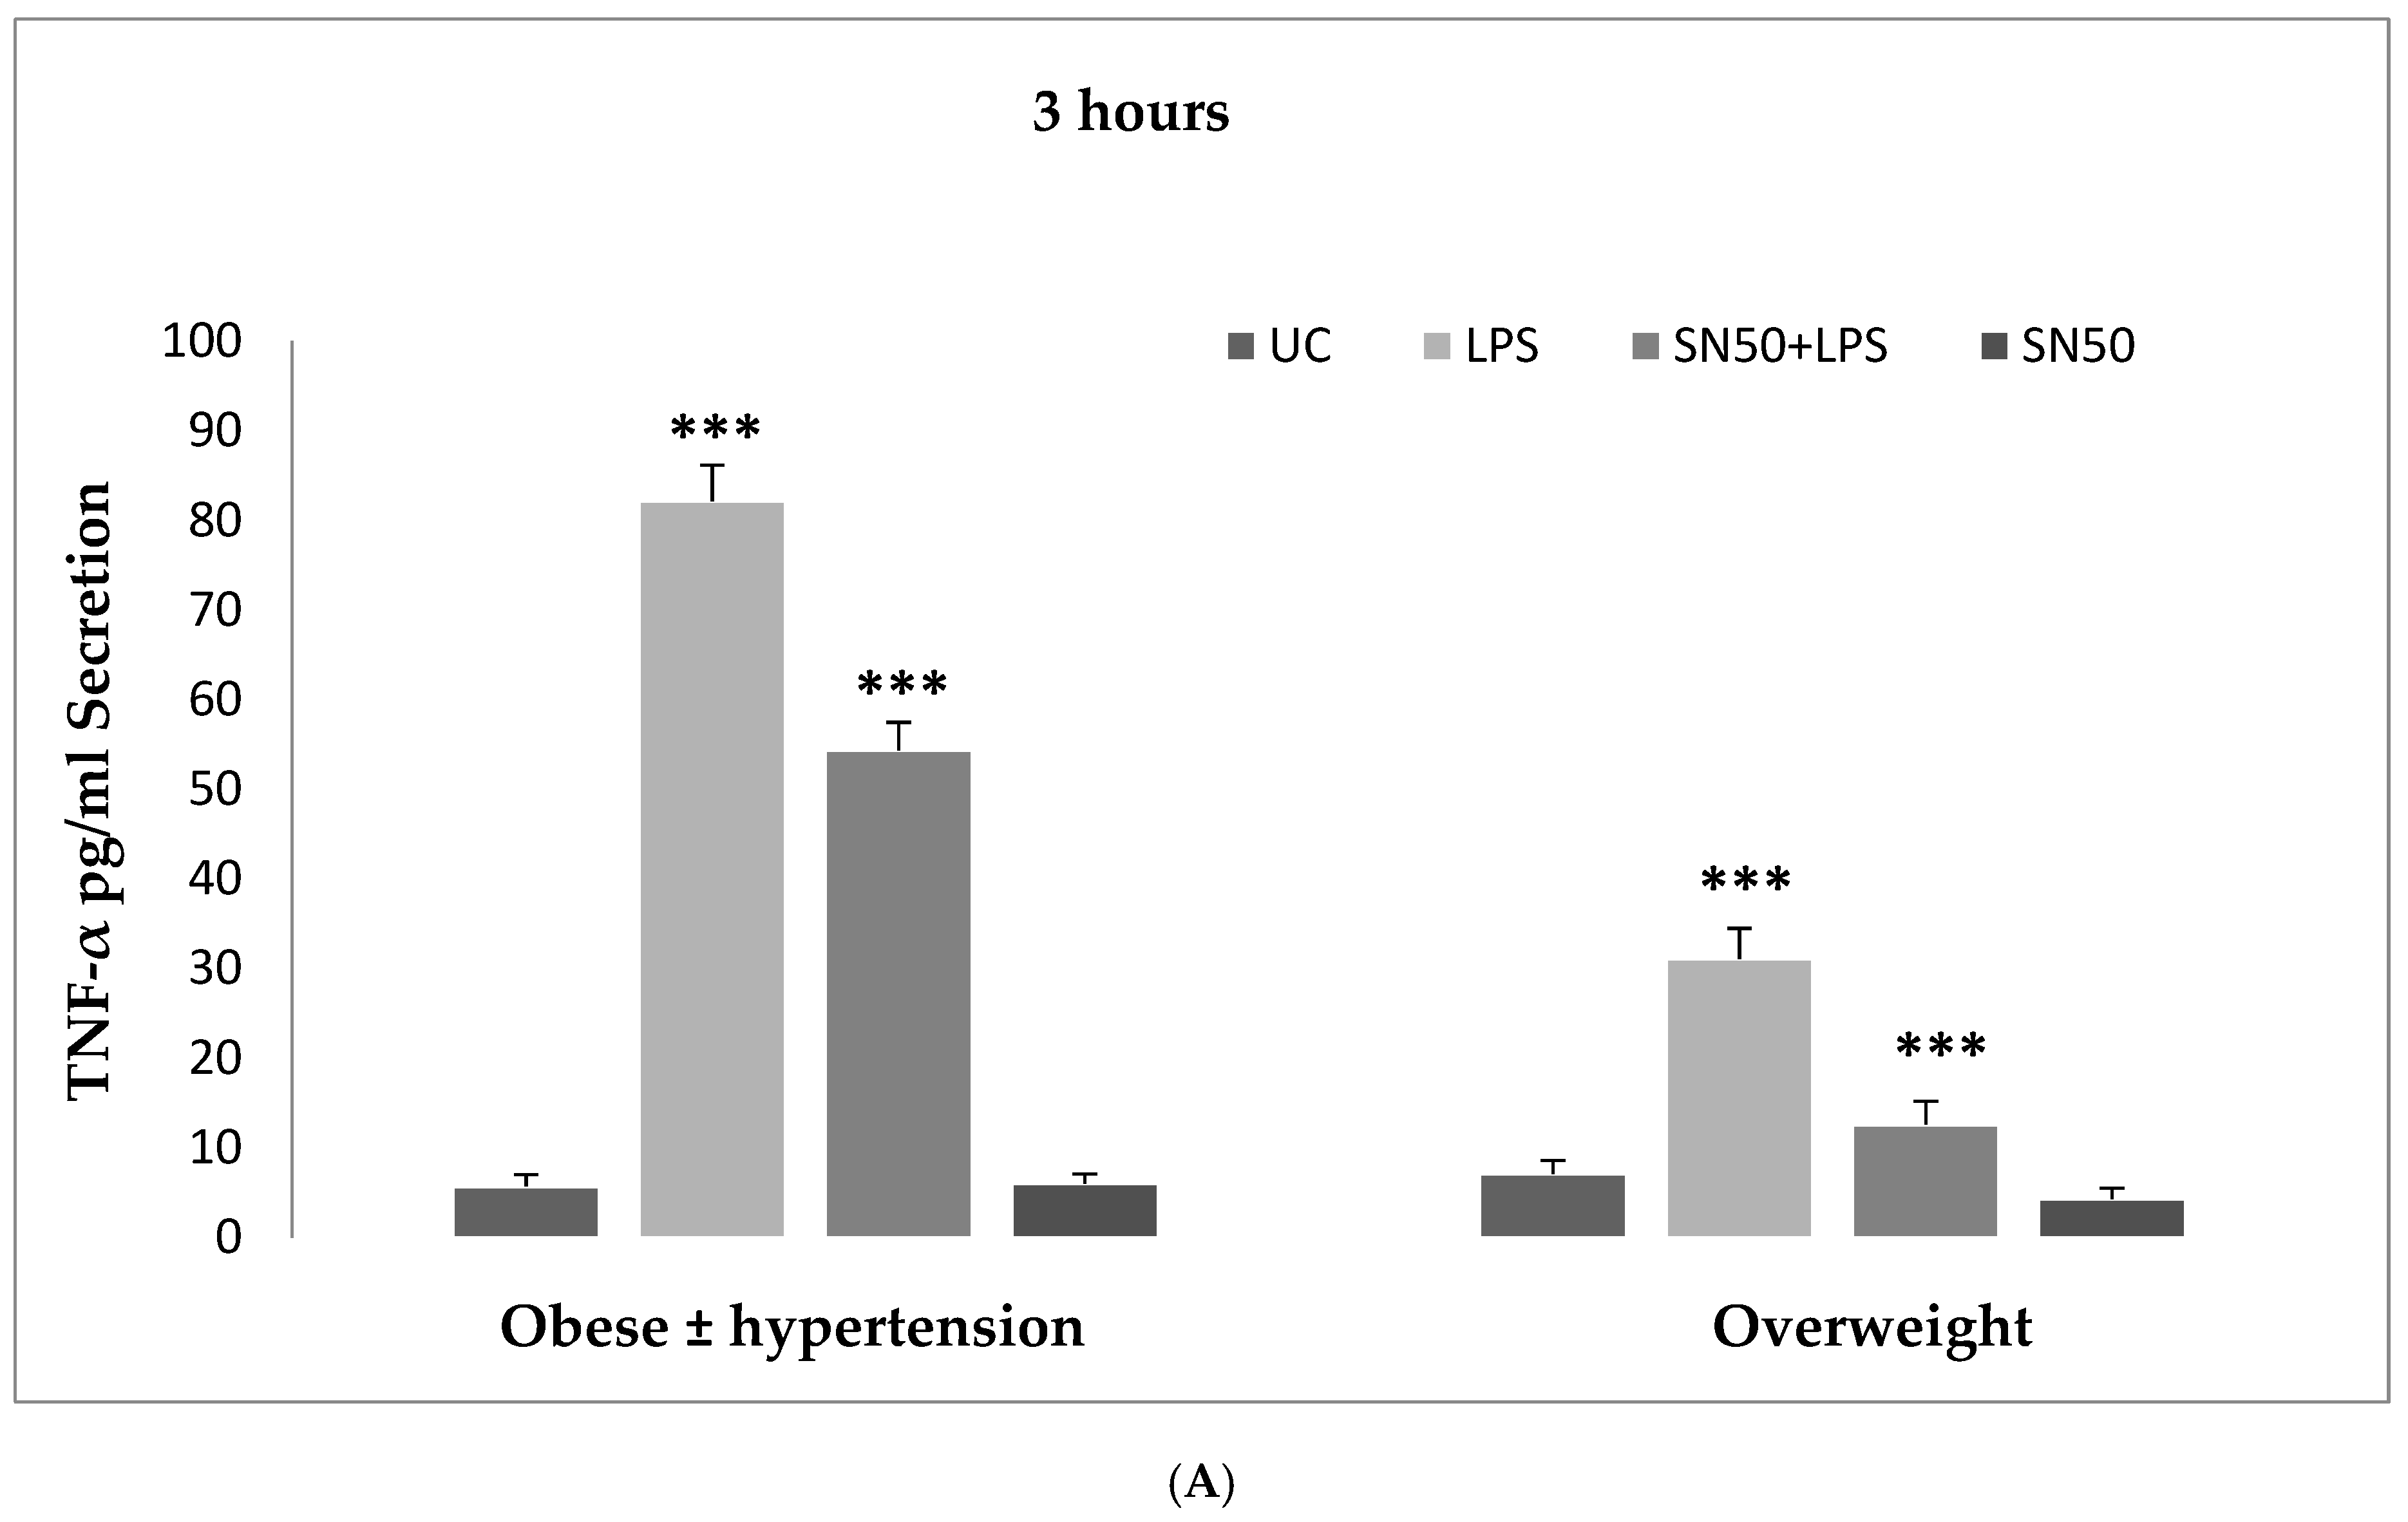
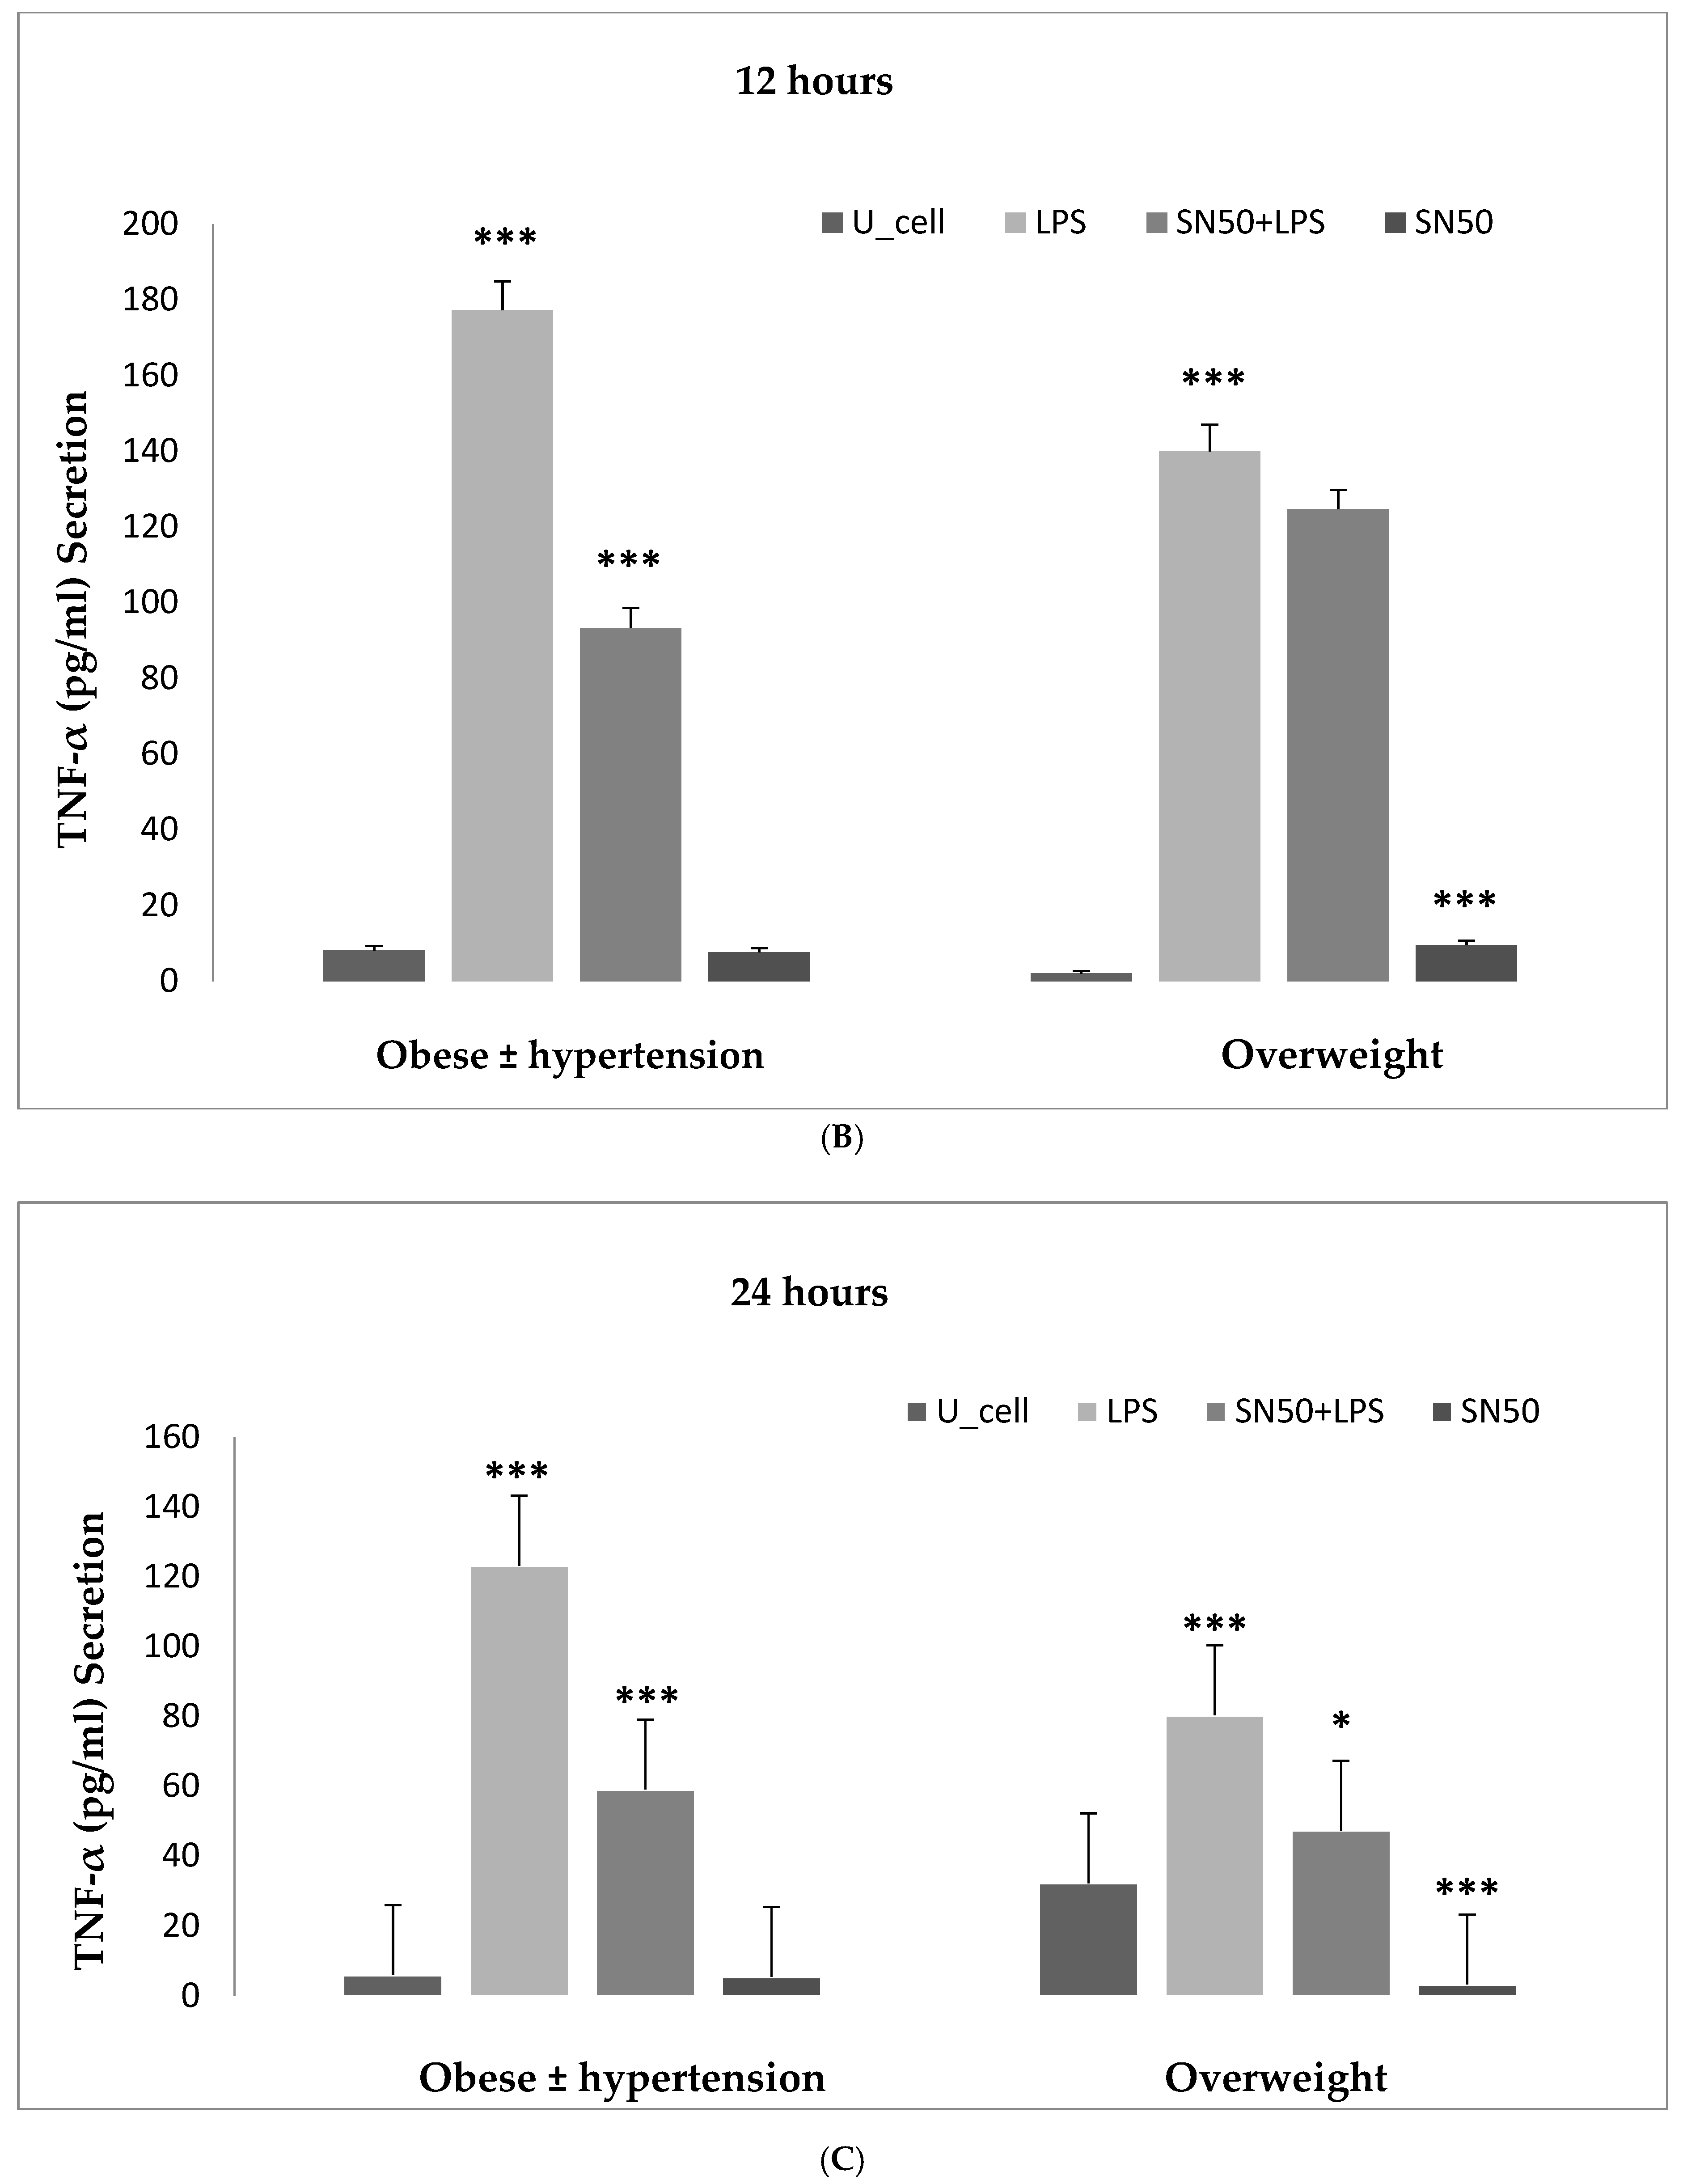
6]. Hence, our study addressed the principal activation regulatory pathways of the secretion of TNF-α by LPS via NF-κB activation. Treatment of adipocytes with 10 ng/mL LPS caused a significant increase in TNF-α secretion, whereas, a significant decrease occurred in response to the presence of SN50 as compared with those cells treated with LPS at 3, 12, and 24 h. The maximum inhibitory action of SN50 on NF-κB activation was obtained with a concentration of 50μg/mL without causing cell death, which was observed at 12 h after treatment. This effect gradually decreased in both groups. In contrast, SN50 alone did not affect TNF-α secretion compared with control cells. Moreover, we observed that TNF-α secretion was significantly higher in the obese hypertensive group than in the overweight group.
The secretion of pro-inflammatory adipokines from adipose tissue has been studied by previous authors [4,21,22]. Adipocytes are known to secrete large quantities of IL-6 as well as non-negligible amounts of TNF-α compared to macrophages [21,22], and there is increasing evidence supposing that adipocytes are highly implicated in the inflammatory phenomenon associated with the development of obesity-related hypertension. However, Hoareau et al. [18] have shown that macrophages are more sensitive to LPS than adipocytes, being able to respond to 5 ng/mL of LPS more than adipocytes, which are sensitive to 50 ng/mL LPS. The number of TLR4 on the surface of the cells could in part explain these differences in response between adipocytes and macrophages [18]. The production of TNF-α by adipocytes may be of special importance because up to one-third of circulating TNF-α is secreted by adipose tissue [23]. An increase in central (visceral) adiposity confers a higher metabolic risk. This increased metabolic risk is associated with subclinical inflammation.
This mechanism has been noted in numerous studies, which demonstrate that LPS can stimulate the release of pro-inflammatory cytokines such as TNF-α via NF-κB activation [6,18]. They observed that TNF-α production in human adipocytes is dependent on the NF-κB pathway. Lehrke et al. [6] showed that LPS increases resistin production by inducing secretion of TNF-α. This increase in resistin production can be blocked by both aspirin and rosiglitazone drugs that have a dual anti-inflammatory and insulin-sensitizing action, and they have been shown to antagonize NF-κB activity. Indeed, loss of NF-κB function abolishes LPS induction of resistin [6]. In a study of adipocytes of mice, it was found that resistin caused insulin resistance and glucose intolerance [24], and the mice, who were lacking resistin, had low blood glucose levels [25]. The ability of resistin to modulate glucose metabolism is associated with the activation of SOCS3, an inhibitor of insulin signaling in adipocytes [24]. Regarding its effect on glucose metabolism, an increase in serum resistin also predicted the risk for increased systolic and diastolic BP in patients with type 2 diabetes mellitus (T2DM) independently of age, gender, BMI, fasting, blood glucose, and HDL-cholesterol [26].
Zhang et al. [27] showed that resistin can predict the risk of future hypertension among non-diabetic women aged ≥55 years, even after adjustment for inflammatory and endothelial markers, and can promote endothelial cell activation through the release of ET-1 and up-regulation of VCAM-1 and ICAM-1 [28]. Resistin was also reported to be decreased with use of probiotics [29].
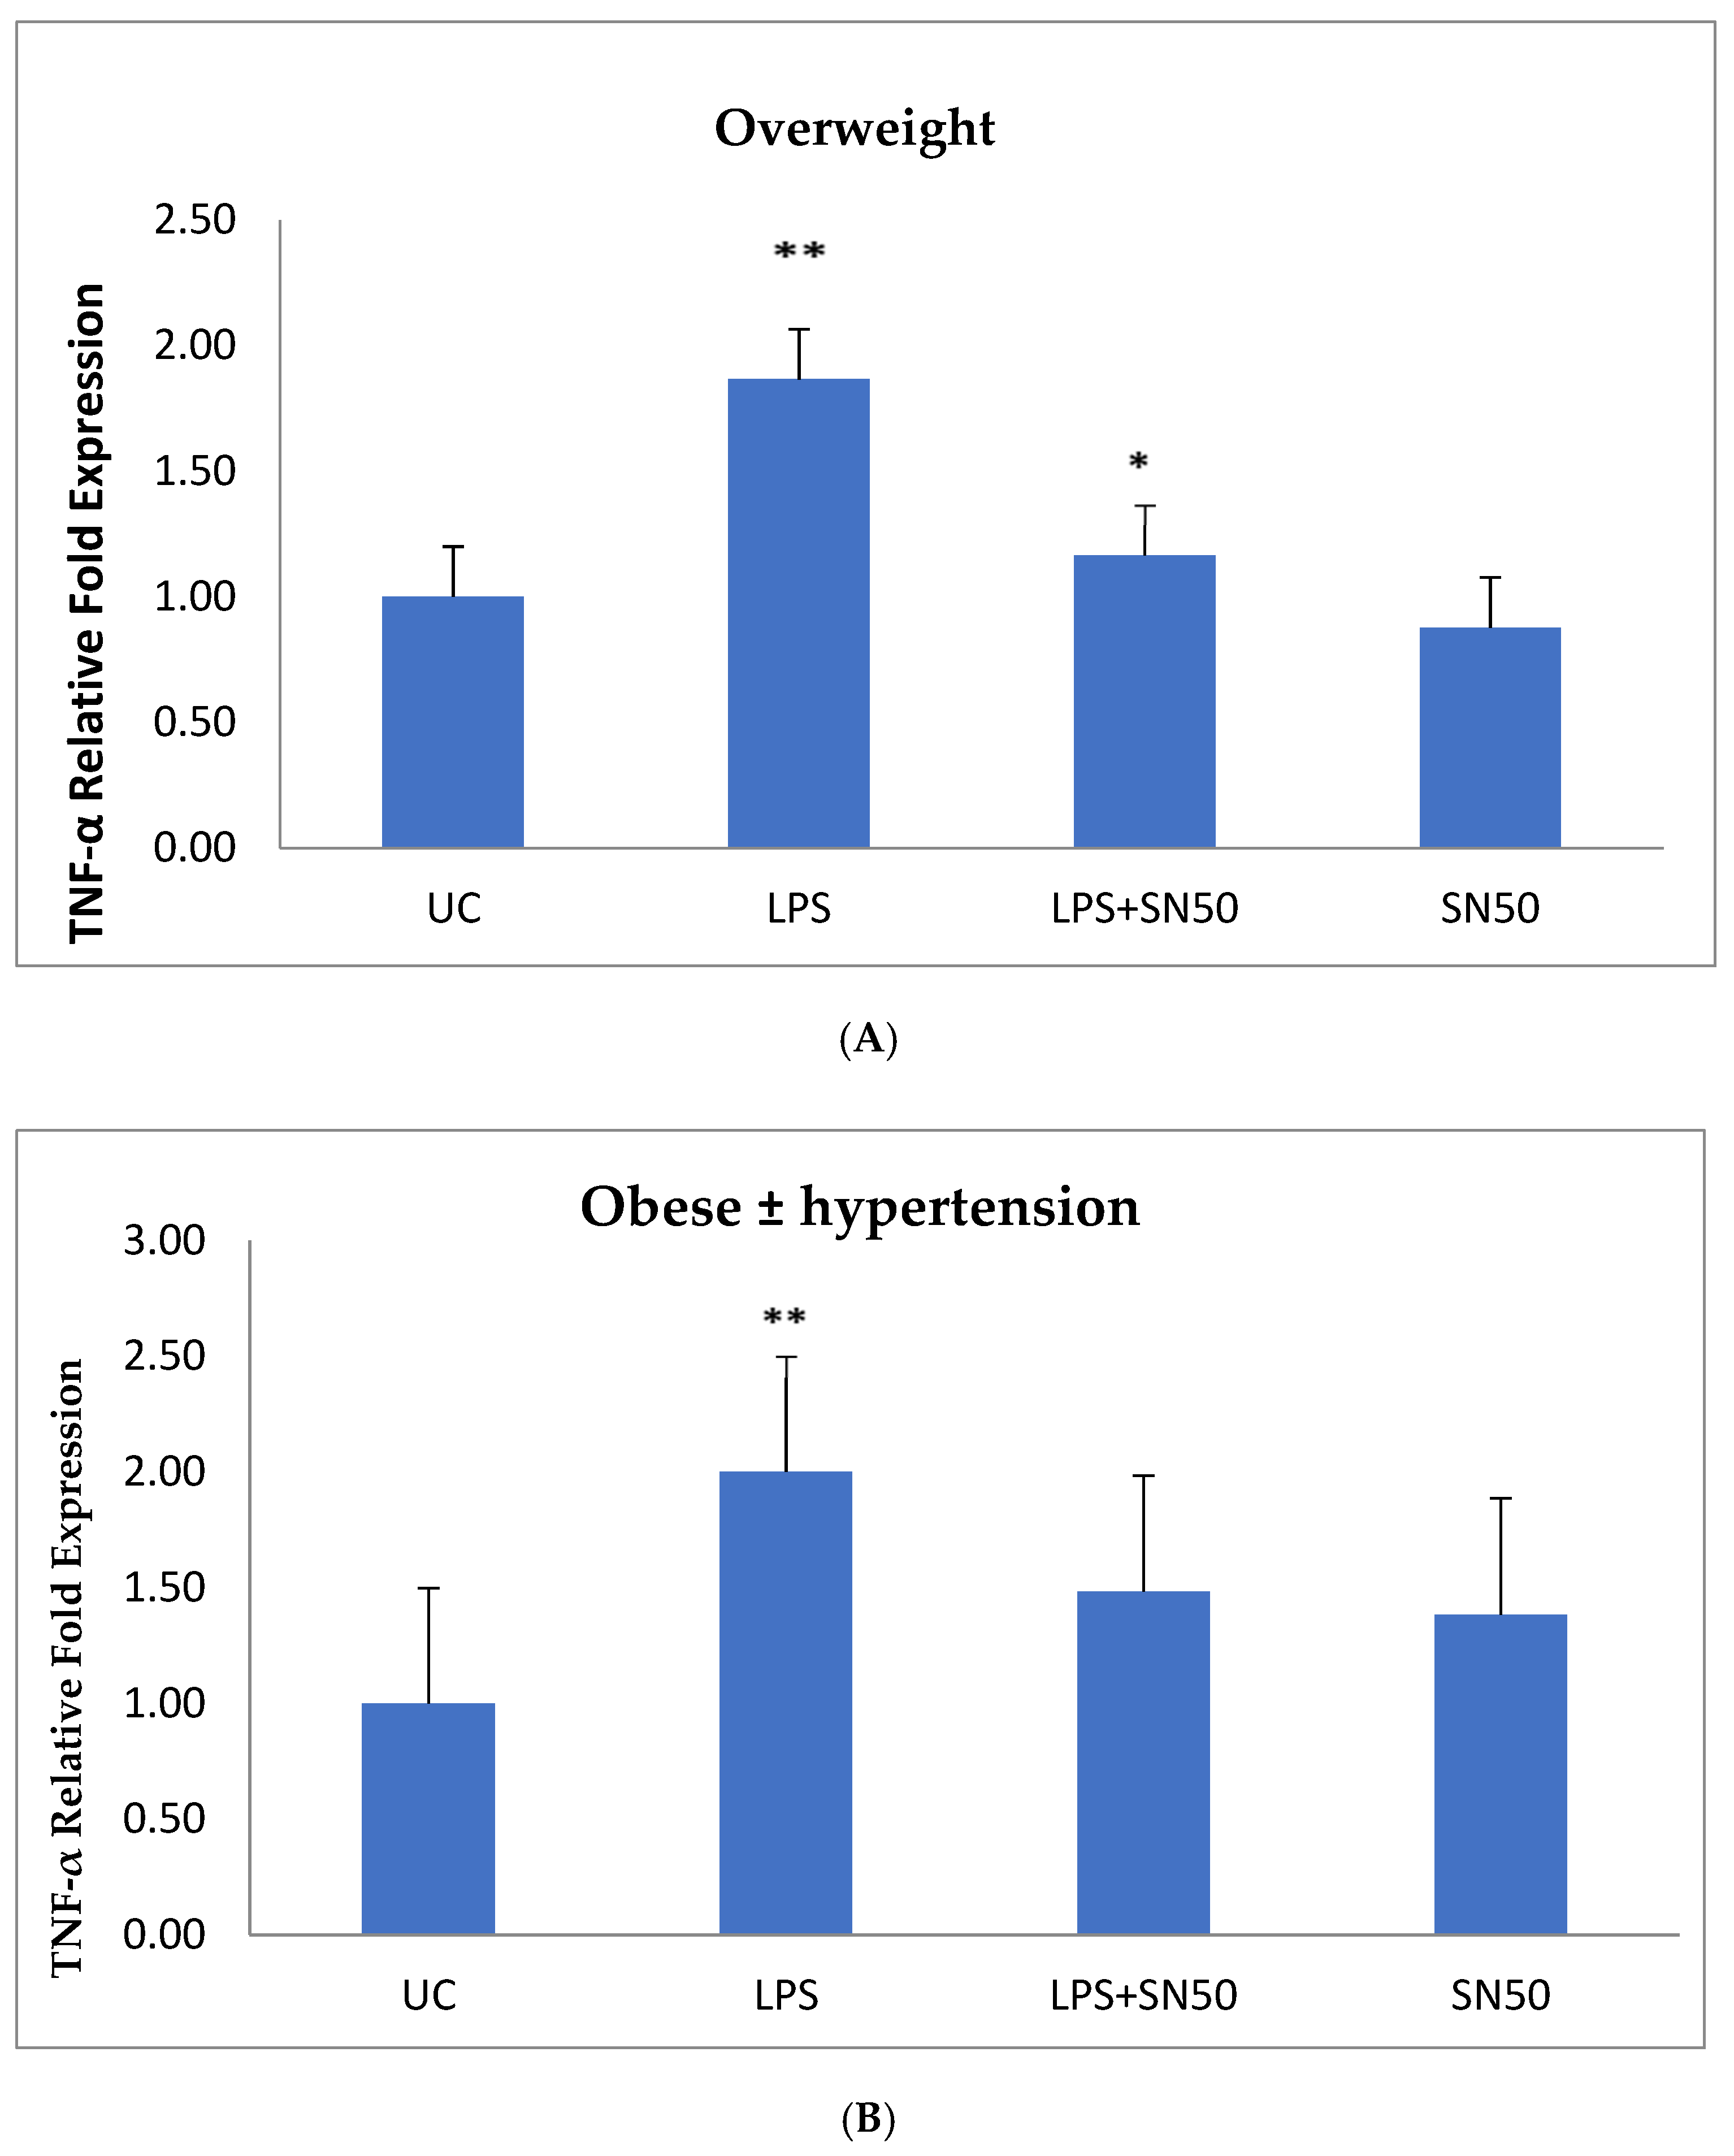
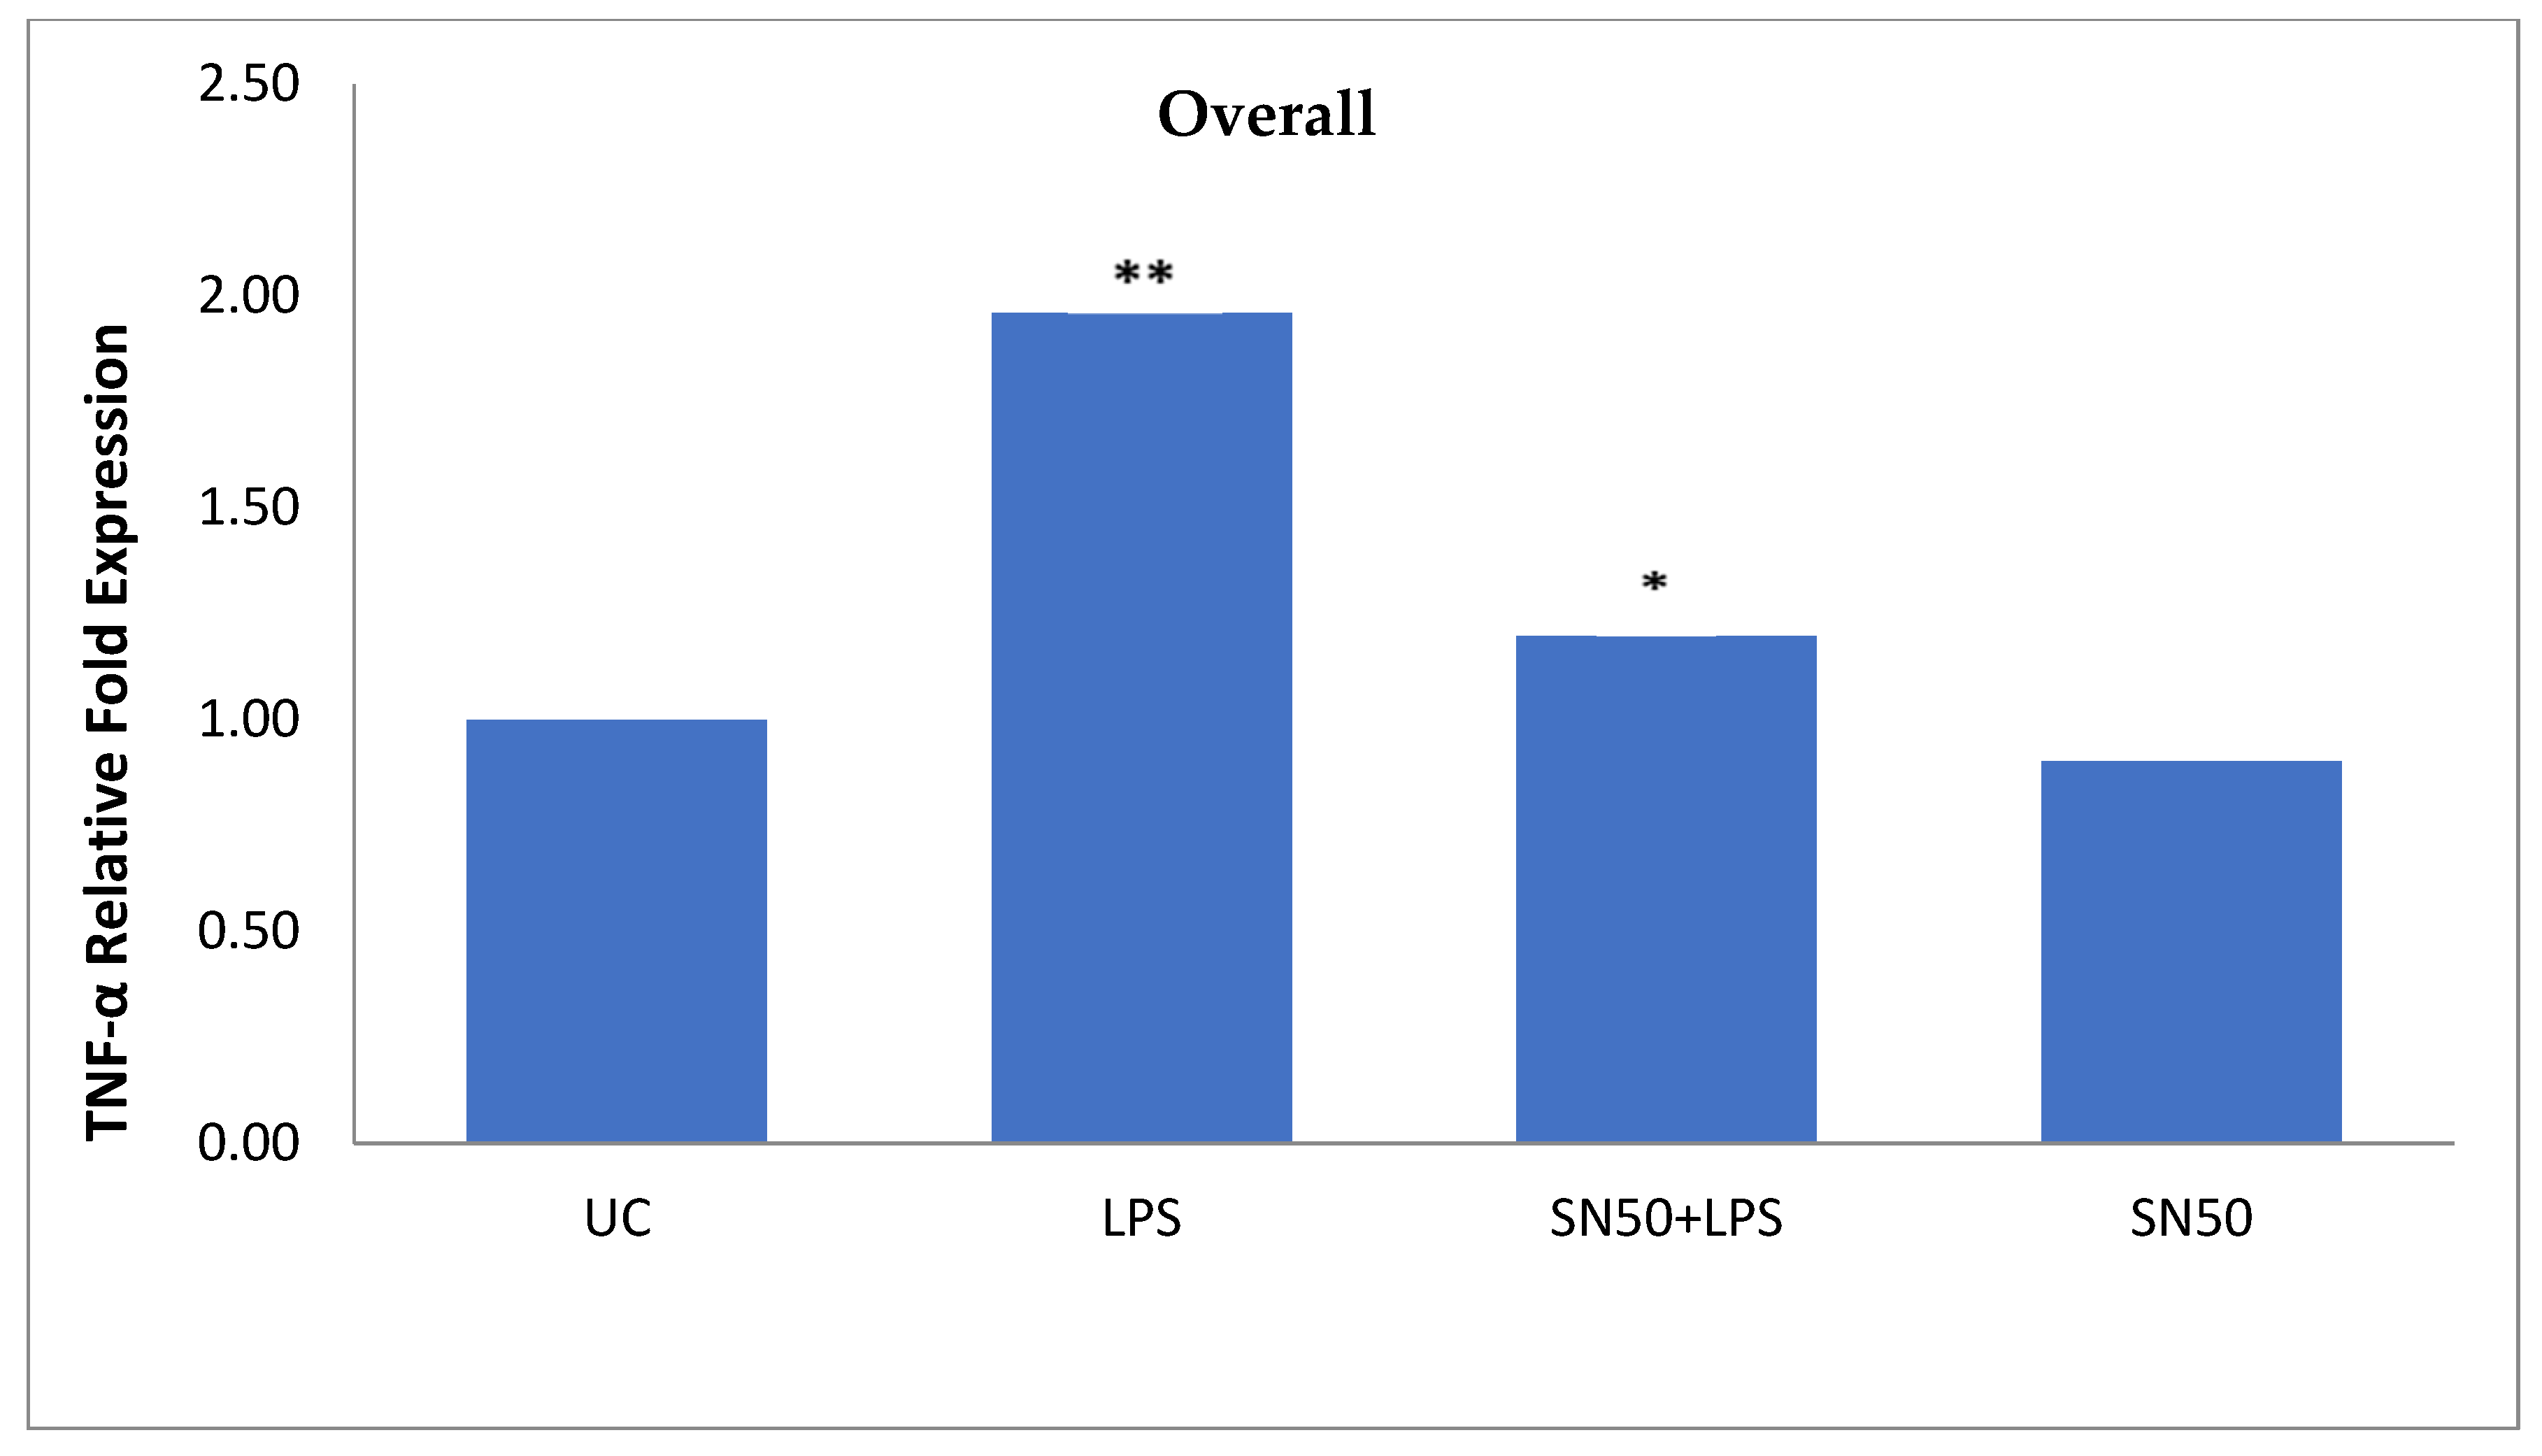
NF-κB plays a role in the regulation of gene transcription, and the present study reported this role in the mRNA TNF-α and AGT levels of overweight patients and obese patients with and without hypertension at 12 h. Treatment of AbdSc adipocytes with LPS increased the mRNA TNF-α level twofold as compared with those in untreated cells in both groups. In contrast, the treatment of AbdSc adipocytes with LPS in the presence of SN50 caused a decrease in the mRNA TNF-α level as compared with those LPS-treated overweight subjects, whereas, no significant change was observed in mRNA TNF-α level in obese subjects with and without hypertension. Moreover, SN50 alone had no effect on TNF-α mRNA levels in both of the observed groups. In contrast, our study demonstrated that the mRNA TNF-α level increased twofold in LPS-treated subjects, as compared with control cells in the combined group, and significantly decreased in the presence of SN50. In addition to its effect on gene expression, LPS also slightly increased the TNF-α protein levels as compared with those in control cells. In contrast, coincubation with LPS and SN50 resulted in a reduction in TNF-α protein levels at 24 h.
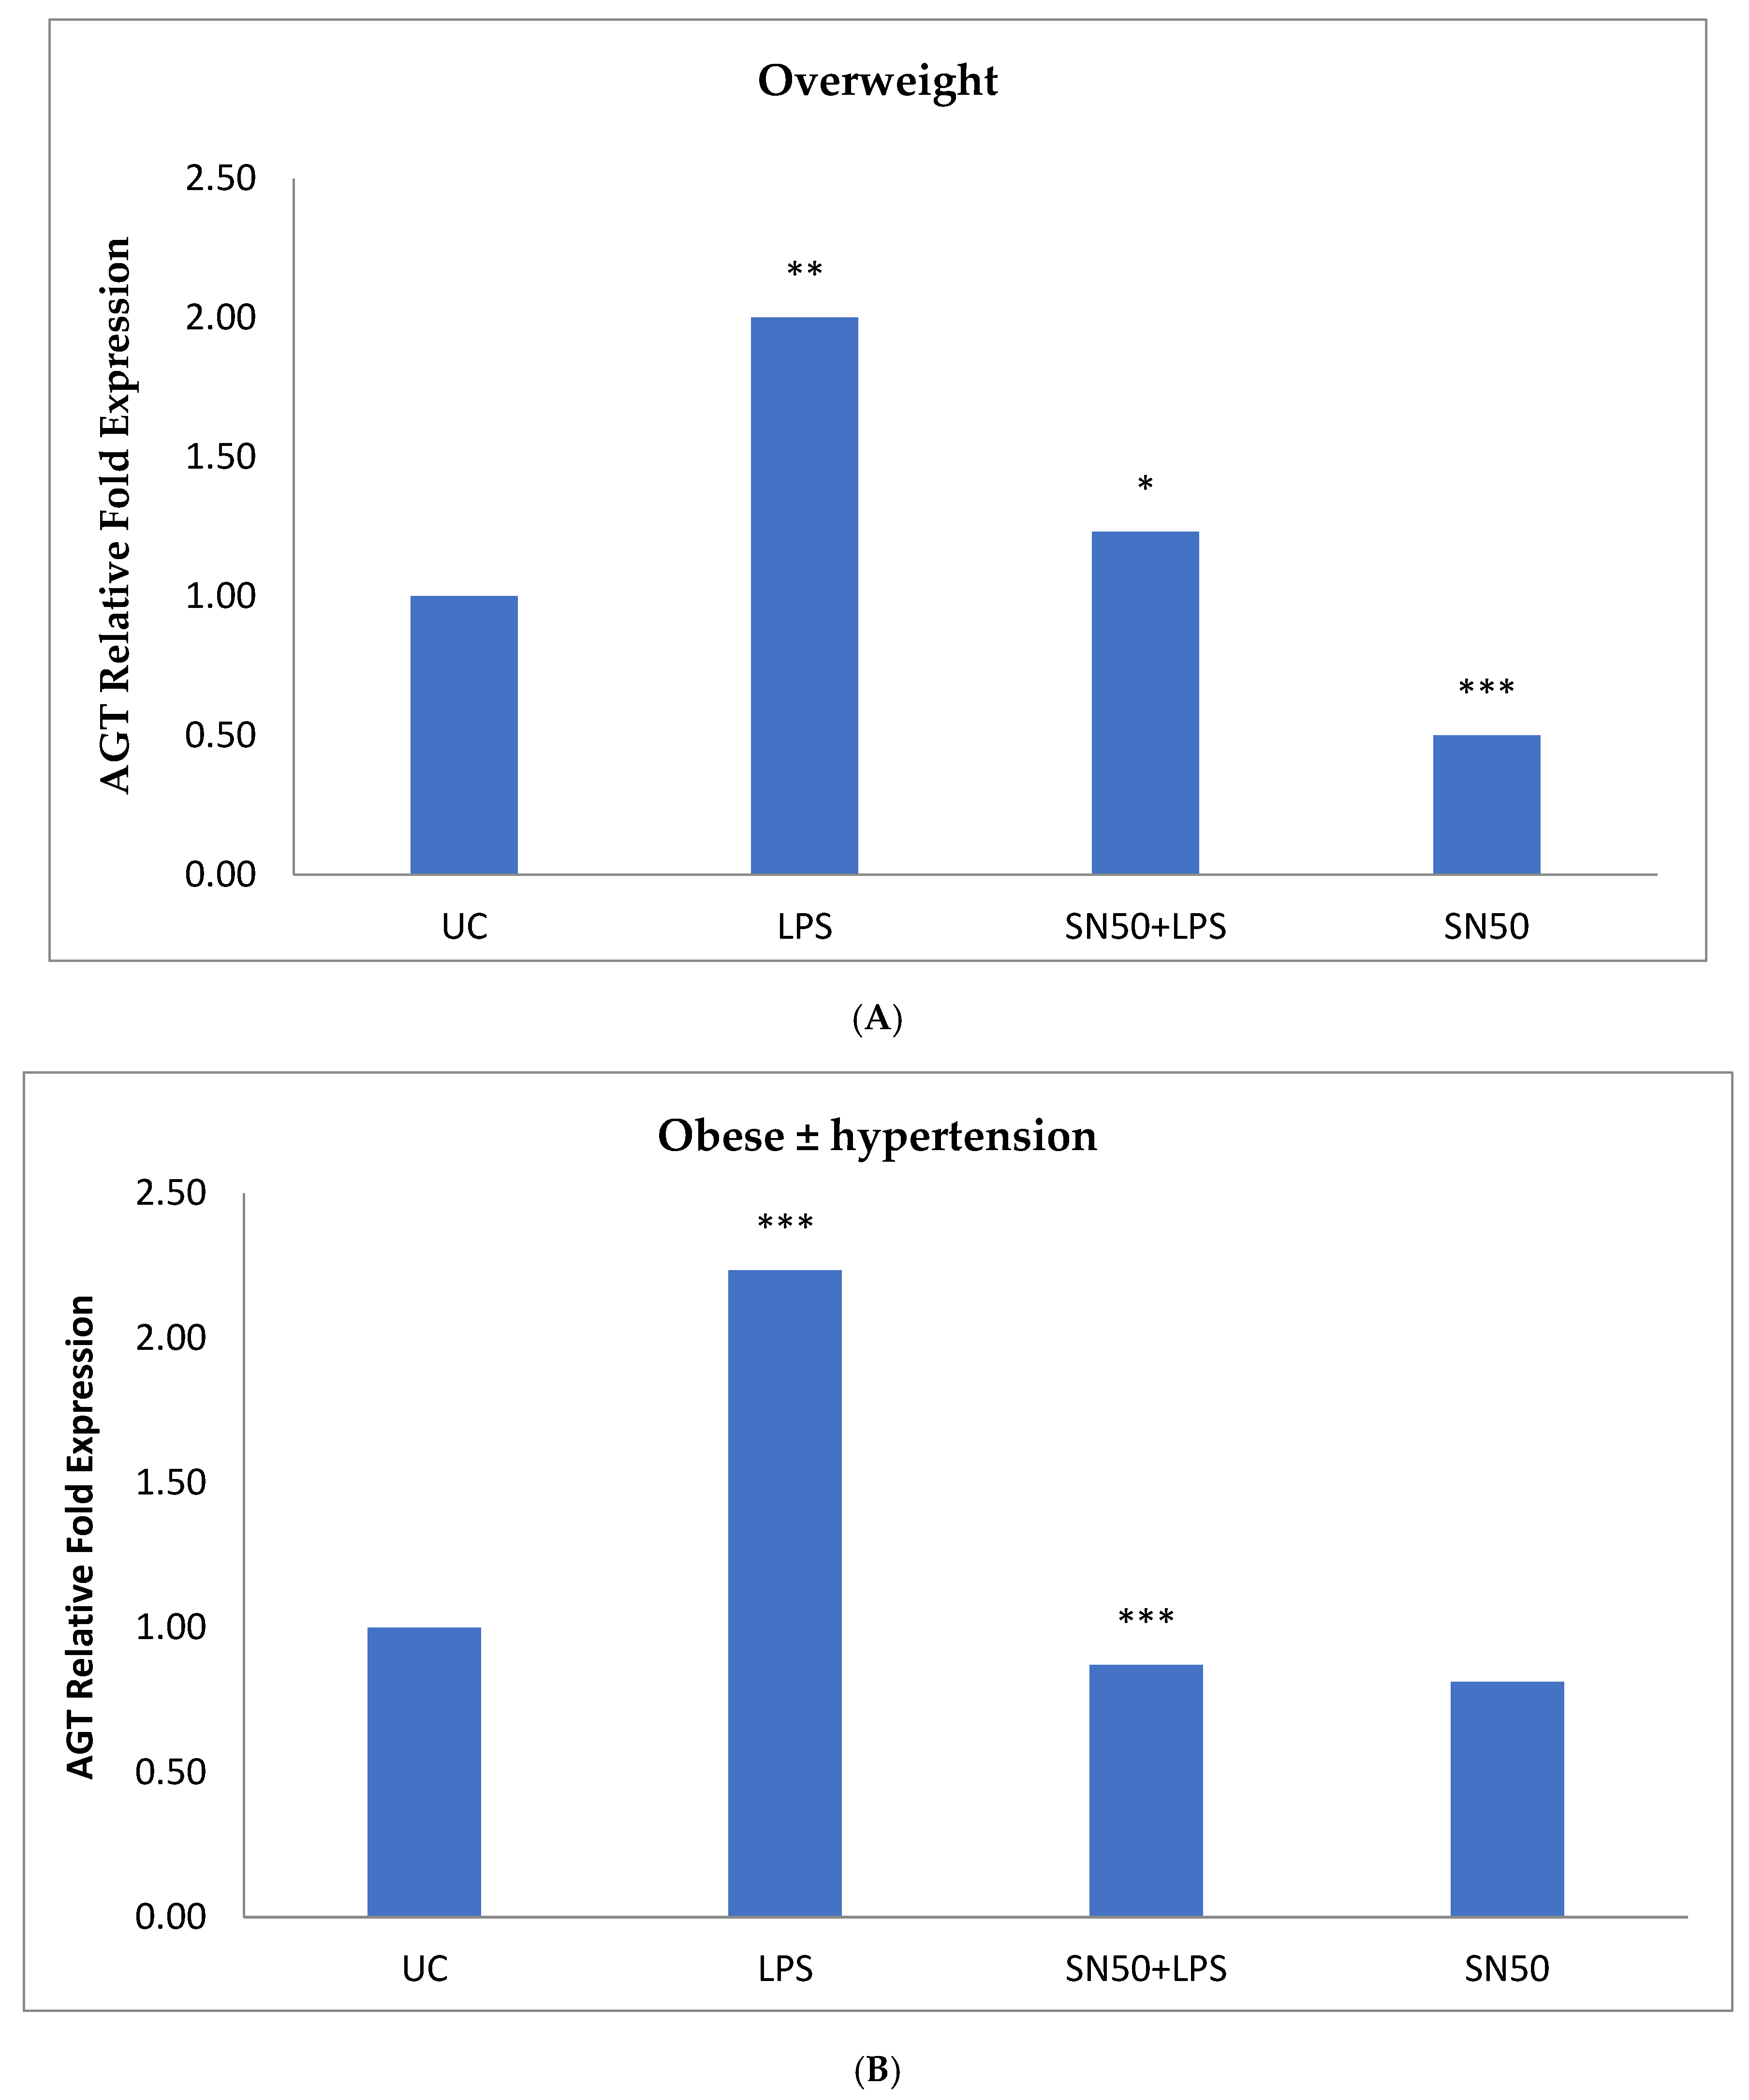
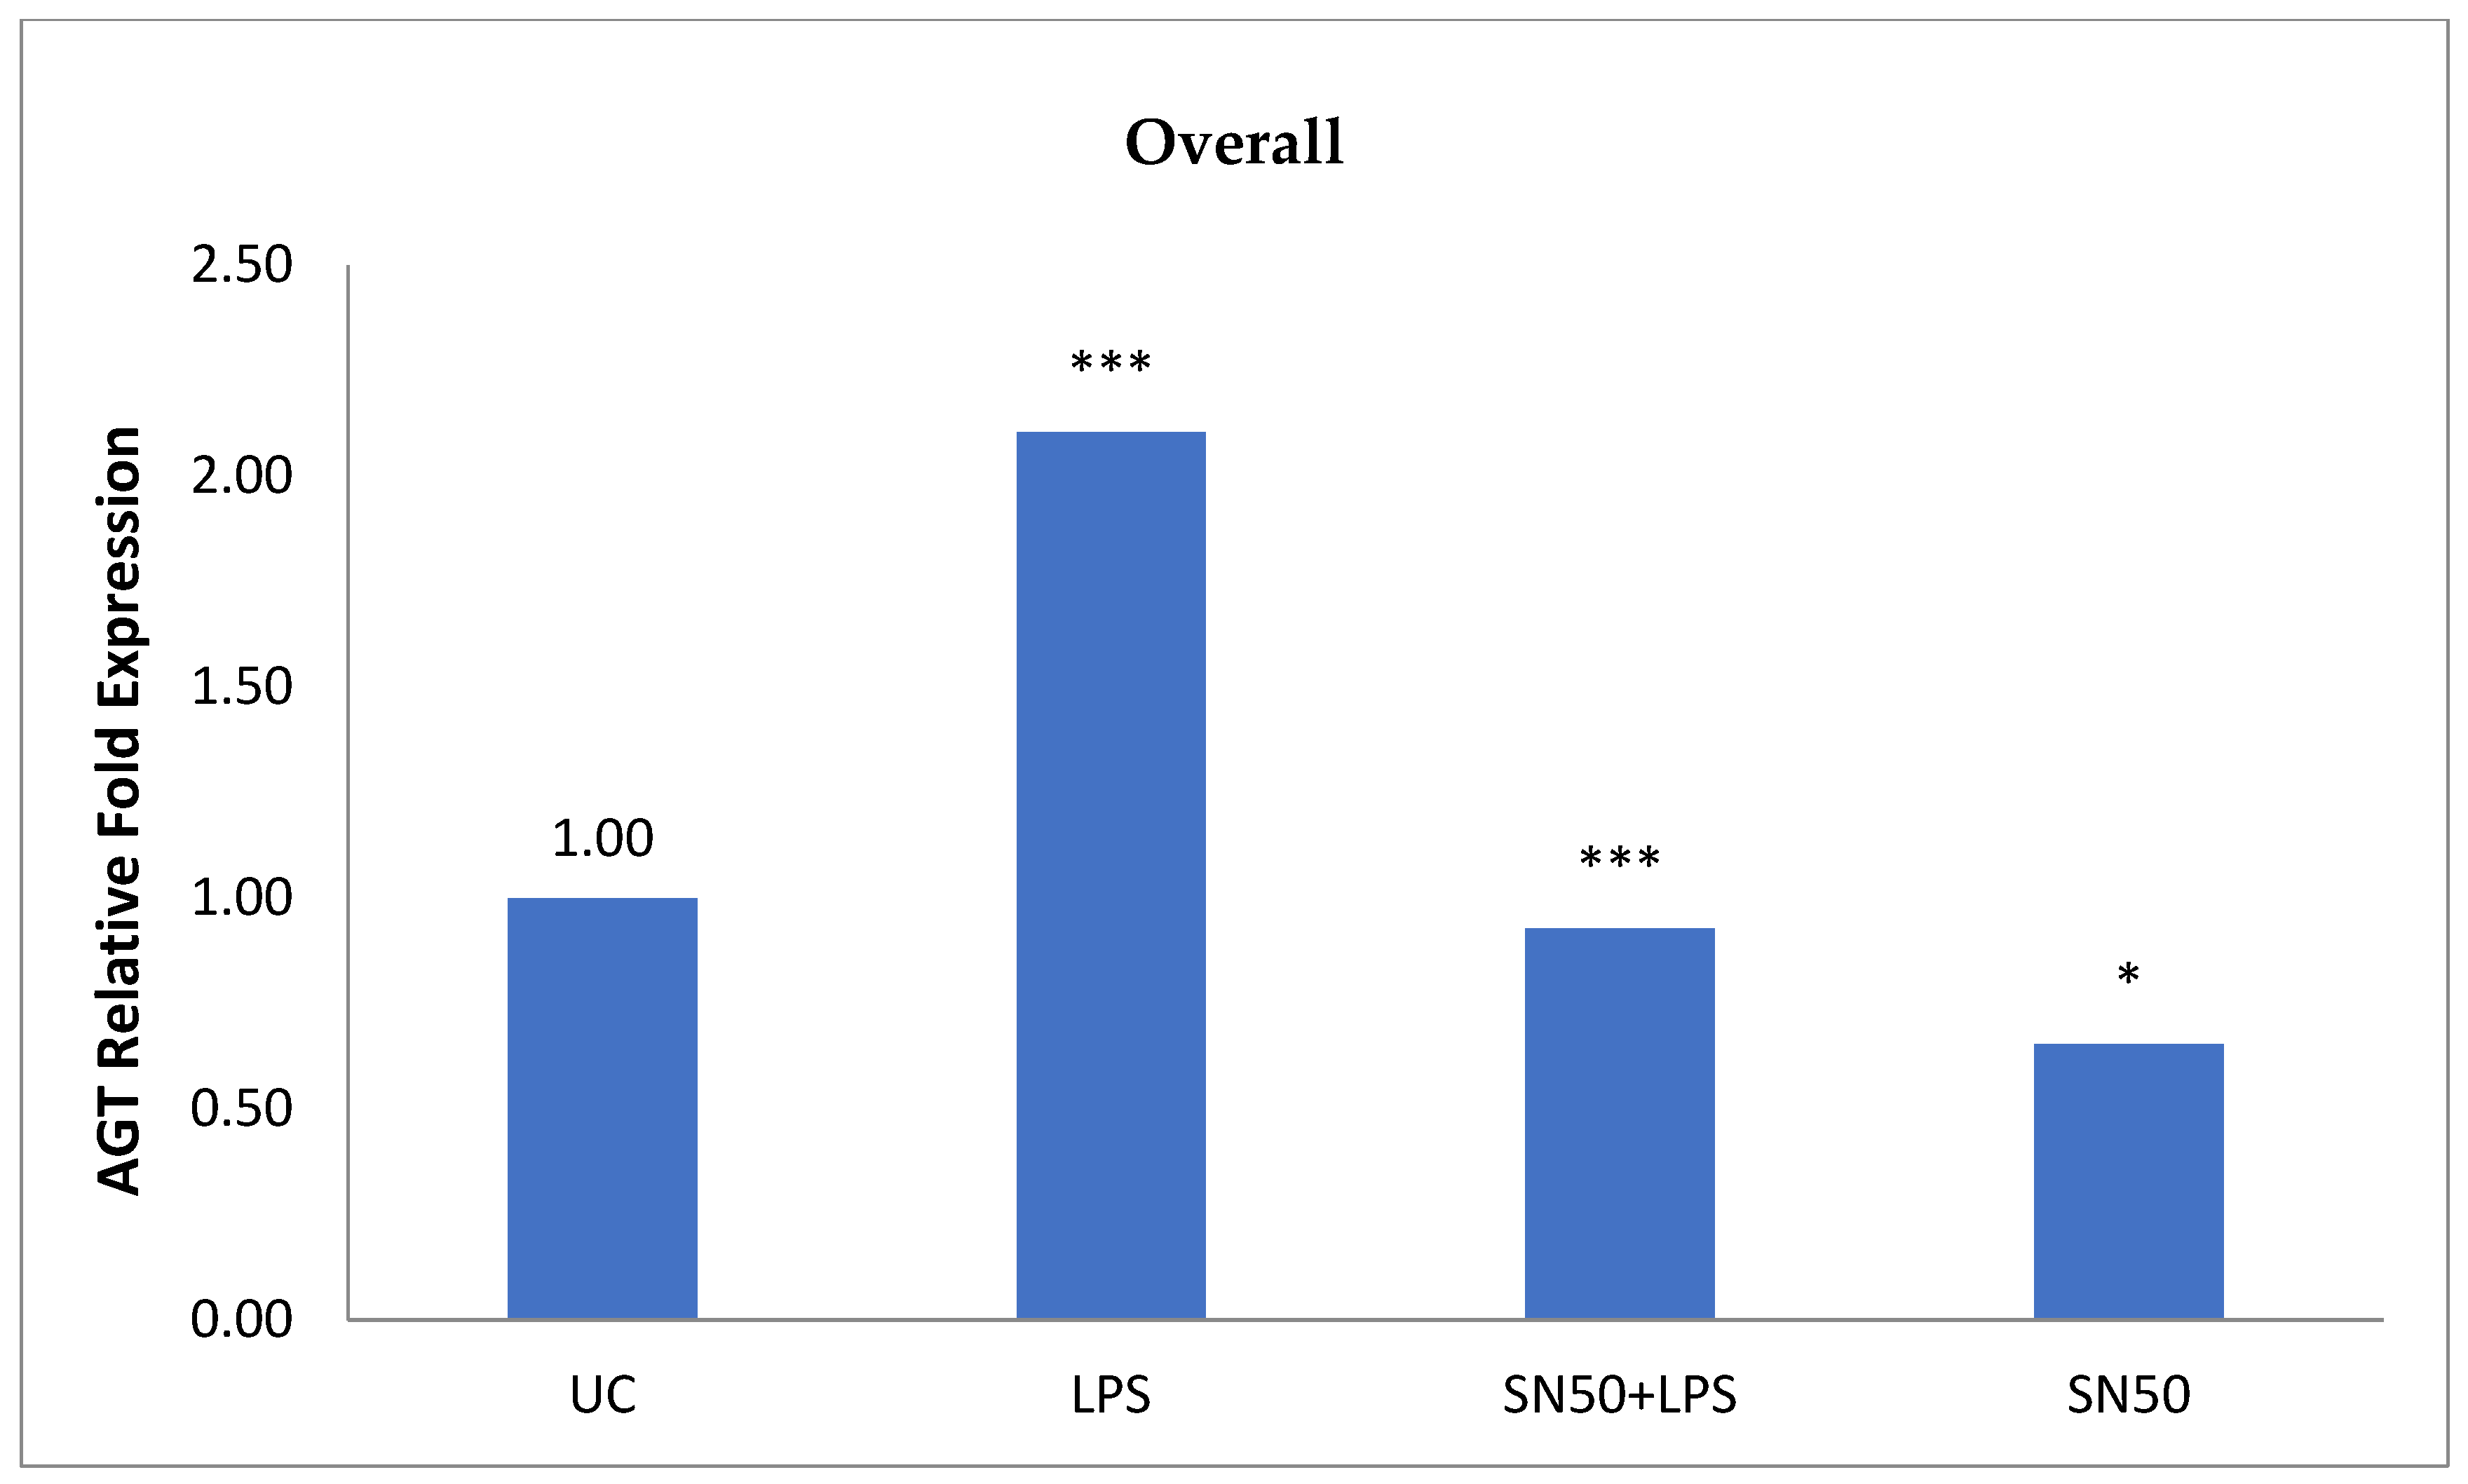
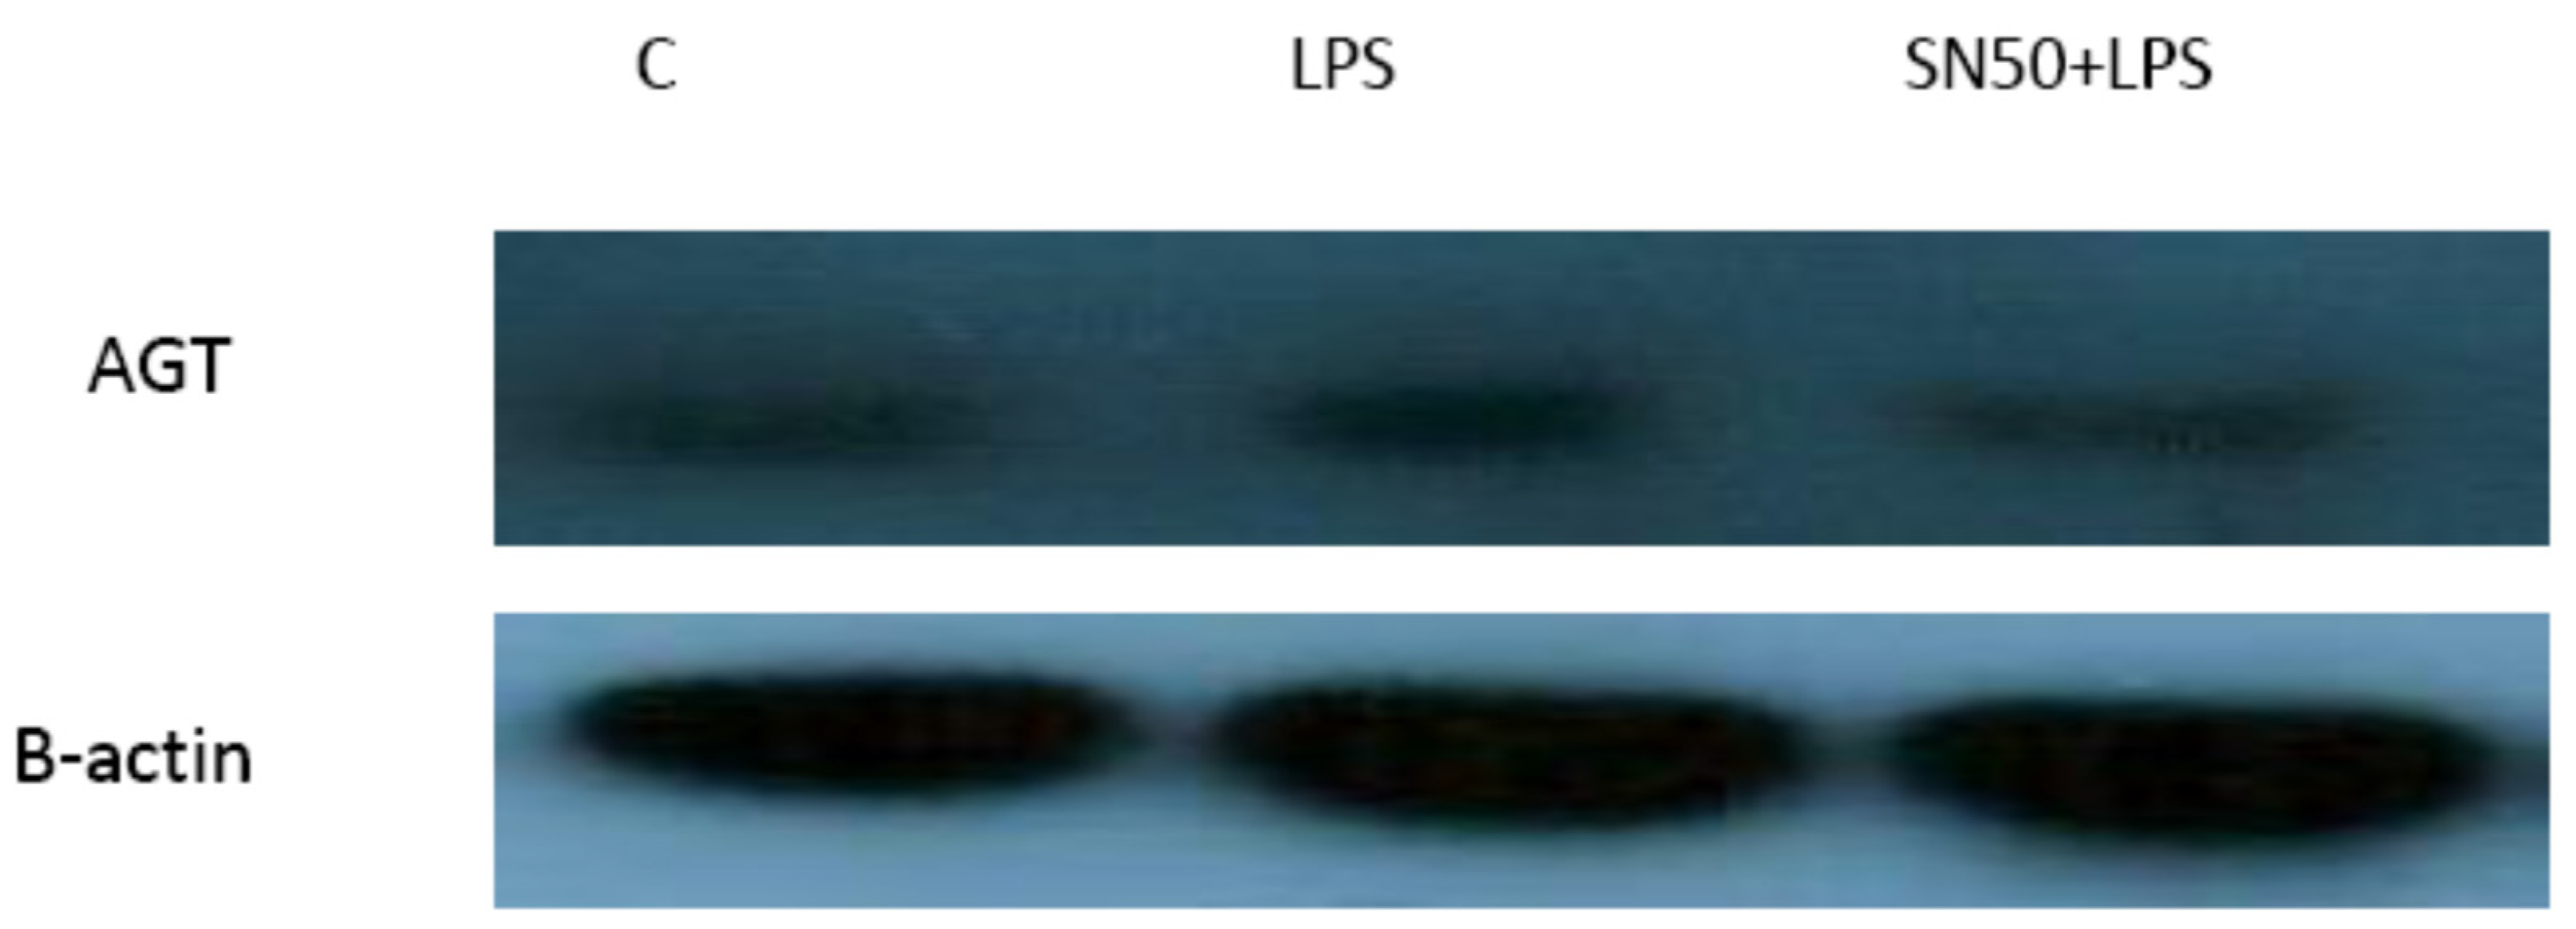
Similarly, treatment of AbdSc adipocytes with LPS caused a twofold increase in the mRNA AGT level as compared with those in control cells in both groups, whereas the treatment of AbdSc adipocytes with LPS in the presence of SN50 caused a decrease in the mRNA AGT level. Moreover, the mRNA AGT was increased twofold in LPS-treated subjects and reduced in the presence of SN50 compared with LPS-treatment in the combined group. LPS alone also slightly increased the AGT protein levels compared with those in control cells. Coincubation with LPS and SN50 resulted in a slight reduction in AGT protein levels at 24 h. Thus, LPS can cause an inflammatory status in adipocytes, and the inflammatory status leads to increased TNF-α via NF-κB and increased AGT and ANG II via RAS. The blocking of NF-κB activation by SN50 led to a decrease in the inflammatory status, which is responsible for obesity and co-morbidities such as hypertension.

5. Conclusions

Our study clearly demonstrated that the LPS-induced activation pathway may be an integral part of the inflammatory process in white adipocytes linked to obesity and obesity-related complications. This stimulatory action seems to be mediated via the NF-κB activation. Thus, the NF-κB inflammatory pathway may represent a regulator of the inflammatory processes in obesity-related hypertension. Taken together, these adipokines with NF-κB activation may represent important biomarkers to evaluate hypertension risk and may provide mechanistic insight into the pathogenesis of obesity-related hypertension.

Author Contributions

Conceptualization: N.M.A.-D., P.G.M., and L.S.B.D.; methodology: P.G.M., R.M.S., and L.S.B.D.; software: R.M.S. and L.S.B.D.; tissue experiment: R.M.S. and L.S.B.D.; samples investigation: L.S.B.D. and R.M.S.; manuscript writing: P.G.M., A.A.A., N.M.A.-D., and L.S.B.D.; manuscript review: P.G.M., N.M.A.-D., and A.A.A. All authors have read and agreed to the published version of the manuscript.

Institutional Review Board Statement

Ethical approval was granted by the Ethics Committee of the College of Science Research Center, King Saud University, Riyadh, Saudi Arabia.

Informed Consent Statement

Informed consent was obtained from all subjects involved in the study.

Data Availability Statement

Data can be accessed via the corresponding author (L.S.B.D.) upon reasonable request.

Acknowledgments

The authors are grateful to the National Plan for Science and Technology (NPST grant #08-MED-603-2), Riyadh, KSA, for funding the study and the 1Chair for Biomarkers of Chronic Diseases and Obesity Research Center, KSU for technical support. The authors are also thankful to the primary care physicians and nurses who recruited and collected the data and tissue samples of the participants. Special thanks to Benjamin Vinodson for the statistical analysis.

Conflicts of Interest

The authors declare no conflict of interest.

References

  1. Taube, A.; Schlich, R.; Sell, H.; Eckardt, K.; Eckel, J. Inflammation and metabolic dysfunction: Links to Cardiovascular Disease. Am. J. Physiol. Heart Circ. Physiol. 2012, 302, H2148–H2165. [Google Scholar] [CrossRef] [PubMed]
  2. Stabouli, S.; Kotsis, V.; Papamichael, C.; Constantopoulos, A.; Zakopoulos, N. Adolescent obesity is associated with high ambulatory blood pressure and increased carotid intimal medial thickness. J. Ped. 2005, 147, 651–656. [Google Scholar] [CrossRef] [PubMed]
  3. Takeshita, Y.; Takamura, T.; Ando, H.; Hamaguchi, E.; Takazakura, A.; Matsuzawa-Nagata, N.; Kaneko, S. Cross talk of tumor necrosis factor-alpha and the renin-angiotensin system in tumor necrosis factor-alpha-induced plasminogen activator inhibitor-1 production from hepatocytes. Eur. J. Pharmacol. 2008, 579, 426–432. [Google Scholar] [CrossRef] [PubMed]
  4. Creely, S.J.; McTernan, P.G.; Kusminski, C.M.; Fisher, M.; Da Silva, M.N.F.; Khanolkar, M.; Evans, M.; Harte, A.L.; Kumar, S. Lipopolysaccharide activates an innate immune system response in human adipose tissue in obesity and type 2 diabetes. Am. J. Physiol. Endocrinol. Metab. 2007, 292, E740–E747. [Google Scholar] [CrossRef] [PubMed]
  5. Kawai, T.; Akira, S. TLR signaling. Cell Death Differ. 2006, 13, 816–825. [Google Scholar] [CrossRef] [PubMed]
  6. Lehrke, M.; Reilly, M.P.; Millington, S.C.; Iqbal, N.; Rader, D.J.; Lazar, M.A. An inflammatory cascade leading to hyperresistinemia in Humans. PloS. Med. 2004, 1, e45. [Google Scholar] [CrossRef] [PubMed]
  7. Harte, A.L.; McTernan, P.G.; Chetty, R.; Coppack, S.; Katz, J.; Smith, S.; Kumar, S. Insulin-mediated upregulation of the renin-angiotensin system in human subcutaneous adipocytes is reduced by rosiglitazone. Circulation 2005, 111, 1954–1961. [Google Scholar] [CrossRef] [PubMed]
  8. Hall, G.; Hasday, J.D.; Rogers, T.B. Regulating the regulator: NF-kappa B signaling in heart. J. Mol. Cell. 2006, 41, 580–591. [Google Scholar] [CrossRef]
  9. Lin, Y.Z.; Yao, S.Y.; Veach, R.A.; Torgerson, T.R.; Hawiger, J. Inhibition of nuclear translocation of transcription factor NF-kappa B by a synthetic peptide containing a cell membrane-permeable motif and nuclear localization sequence. J. Biol. Chem. 1995, 270, 14255–14258. [Google Scholar] [CrossRef]
  10. McTernan, P.G.; Anwar, A.; Eggo, M.C.; Barnett, A.H.; Stewart, P.M.; Kumar, S. Gender differences in the regulation of P450 aromatase expression and activity in human adipose tissue. Int. J. Obes. Relat. Metab. Disord. 2000, 24, 875–881. [Google Scholar] [CrossRef]
  11. Renard, P.; Ernest, I.; Houbion, A.; Art, M.; Le, C.H.; Raes, M.; Remacle, J. Development of a sensitive multi-well colorimetric assay for active NF-κB. Nucleic Acids Res. 2001, 29, e4–e21. [Google Scholar] [CrossRef] [PubMed]
  12. Bradford, M.M. A rapid and sensitive method for the quantitation of microgram quantities of protein utilizing the principle of protein-dye binding. Anal. Biochem. 1976, 72, 248–254. [Google Scholar] [CrossRef]
  13. Heller, R.A.; Schena, M.; Chai, A.; Shalon, D.; Bedilion, T.; Gilmore, J.; Woolley, D.E.; Davis, R.W. Discovery and analysis of inflammatory disease-related genes using cDNA microarrays. Proc. Natl. Acad. Sci. USA. 1997, 94, 2150–2155. [Google Scholar] [CrossRef] [PubMed]
  14. Chamarthi, B.; Williams, G.H.; Ricchiuti, V.; Srikumar, N.; Hopkins, P.N.; Lauther, J.M.; Jeunemaitre, X.; Thomas, A. Inflammation and hypertension: The interplay of interleukin-6, dietary sodium, and the renin-angiotensin system in humans. Am. J. Hypertens. 2011, 24, 1143–1148. [Google Scholar] [CrossRef] [PubMed]
  15. Kern, P.A.; Ranganathan, S.; Li, C.; Wood, L.; Ranganathan, G. Adipose tissue tumor necrosis factor and interleukin-6 expression in human obesity and insulin resistance. Am. J. Physiol. Endocrinol. Metab. 2001, 280, E745–E751. [Google Scholar] [CrossRef] [PubMed]
  16. Vozarova, B.; Weyer, C.; Hanson, K.; Tataranni, P.A.; Bogardus, C.; Pratley, R.E. Circulating interleukin-6 in relation to adiposity, insulin action, and insulin secretion. Obes. Res. 2001, 9, 414–417. [Google Scholar] [CrossRef]
  17. Senn, J.J.; Klover, P.J.; Nowak, I.A.; Mooney, R.A. Interleukin-6 induces cellular insulin resistance in hepatocytes. Diabetes. 2002, 51, 3391–3399. [Google Scholar] [CrossRef]
  18. Hoareau, L.; Bencharif, K.; Rondeau, P.; Murumalla, R.; Ravanan, P.; Tallet, F.; Delarue, P.; Cesari, M.; Roche, R.; Festy, F. Signaling pathways involved in LPS induced TNF-alpha production in human adipocytes. J. Inflamm. 2010, 7, 1. [Google Scholar] [CrossRef]
  19. Muzio, M.; Polentarutti, N.; Bosisio, D.; Manoj Kumar, P.P.; Mantovani, A. Toll-like receptor family and signalling pathway. Biochem. Soc. Trans. 2000, 28, 563–566. [Google Scholar] [CrossRef]
  20. Lin, Y.; Lee, H.; Berg, A.H.; Lisanti, M.P.; Shapiro, L.; Scherer, P.E. The lipopolysaccharide-activated toll-like receptor (TLR)-4 induces synthesis of the closely related receptor TLR-2 in adipocytes. J. Biol. Chem. 2000, 275, 24255–24263. [Google Scholar] [CrossRef]
  21. Hoareau, L.; Ravanan, P.; Gonthier, M.P.; Delarue, P.; Goncalves, J.; Cesari, M.; Festy, F.; Roche, R. Effect of PEA on LPS inflammatory action in human adipocytes. Cytokine 2006, 34, 291–296. [Google Scholar] [CrossRef] [PubMed]
  22. Bes-Houtmann, S.; Roche, R.; Hoareau, L.; Gonthier, M.P.; Festy, F.; Caillens, H.; Gasque, P.; Lefebvre d’Hellencourt, C.; Cesari, M. Presence of functional TLR2 and TLR4 on human adipocytes. Histochem. Cell. Biol. 2007, 127, 131–137. [Google Scholar] [CrossRef] [PubMed]
  23. Cawthorn, W.P.; Sethi, J.K. TNF-alpha and adipocyte biology. FEBS Lett. 2008, 582, 117–131. [Google Scholar] [CrossRef] [PubMed]
  24. Steppan, C.M.; Bailey, S.T.; Bhat, S.; Brown, E.J.; Banerjee, R.R.; Wright, C.M.; Patel, H.R.; Ahima, R.S.; Lazar, M.A. The hormone resistin links obesity to diabetes. Nature 2001, 409, 307–312. [Google Scholar] [CrossRef]
  25. Banerjee, R.R.; Rangwala, S.M.; Shapiro, J.S.; Rich, A.S.; Rhoades, B.; Qi, Y.; Wang, J.; Rajala, M.W.; Pocai, A.; Scherer, P.E.; et al. Regulation of fasted blood glucose by resistin. Science 2004, 303, 1195–1198. [Google Scholar] [CrossRef]
  26. Takata, Y.; Osawa, H.; Kurata, M.; Kurokawa, M.; Yamauchi, J.; Ochi, M.; Nishida, W.; Okura, T.; Higaki, J.; Makino, H. Hyperresistinemia is associated with coexistence of hypertension and type two diabetes. Hypertension 2008, 51, 534–539. [Google Scholar] [CrossRef]
  27. Zhang, H.; Cui, J.; Zhang, C. Emerging role of adipokines as mediators in atherosclerosis. World J. Cardiol. 2010, 2, 370–376. [Google Scholar] [CrossRef]
  28. Verma, S.; Li, S.H.; Wang, C.H.; Fedak, P.W.; Li, R.K.; Weisel, R.D.; Mickle, D.A. Resistin promotes endothelial cell activation: Further evidence of adipokine-endothelial interaction. Circulation 2003, 108, 736–740. [Google Scholar] [CrossRef]
  29. Sabico, S.; Al-Mashharawi, A.; Al-Daghri, N.M.; Wani, K.; Amer, O.E.; Hussain, D.S.; Ahmed Ansari, M.G.; Masoud, M.S.; Alokail, M.S.; McTernan, P.G. Effects of a 6-month multi-strain probiotics supplementation in endotoxemic, inflammatory and cardiometabolic status of T2DM patients: A randomized, double-blind, placebo-controlled trial. Clin. Nutr. 2019, 38, 1561–1569. [Google Scholar] [CrossRef]
Figure 1. Inhibitory effect of the NF-κB inhibitor, SN50, on NF-κB p65 activity in cultured human abdominal subcutaneous (AbdSc) adipocytes. (A) Adipocytes treated with lipopolysaccharides (LPS) (10 ng/mL) in the presence and absence of SN50 (50 µg/mL) of the overweight and the obese ± hypertension group at 3 h of incubation. Values are expressed as means ± SEMs using the student t-test. Values of p < 0.05 were considered significant versus untreated and treated cells. * p-value < 0.05. (B) Adipocytes treated with LPS (10 ng/mL) in the presence and absence of SN50 (50 µg/mL) of the overweight and the obese ± hypertension group at 12 h of incubation. Values are expressed as means ± SEMs using the student t-test. Values of p < 0.05 were considered significant versus untreated and treated cells with LPS. * p-value < 0.05. (C) Adipocytes treated with LPS (10 ng/mL) in the presence and absence of SN50 (50 µg/mL) of the overweight and the obese ± hypertension group at 24 h of incubation. Values are expressed as means ± SEMs using the student t-test. Values of p < 0.05 were considered significant versus untreated and treated cells. * p-value < 0.05Abbreviations: UC: untreated cells; LPS: lipopolysaccharides; SN50: NF-kB inhibitor.
Proceedings 79 00015 g001aProceedings 79 00015 g001b
Figure 2. The NF-κB p65 antibody. Adipocyte cells were treated with LPS at 10 ng/mL in the presence and absence of SN50 (50 μg/mL) at 3, 12, and 24 h incubation periods. Proteins (20 μg per lane) were separated by 12% sodium dodecyl sulphate-polyacrylamide (SDS-PAGE) and analyzed by western blotting using the anti-NF-κB p65 antibody. Loading equality was controlled using an antibody against the β-actin protein.
Proceedings 79 00015 g002
Figure 3. Secretion of TNF-α (pg/mL) in cultured human AbdSc adipocytes. Adipocytes treated with LPS (10 ng/mL) in the presence and absence of SN50 (50 µg/mL) among overweight subjects and obese ± hypertension subjects at (A) 3, (B) 12, and (C) 24 h incubation periods. Values are expressed as means ± standard errors using the student t-test. Levels of p < 0.05 were expressed as significant versus untreated cells. * p-value < 0.05, *** p-value < 0.001.
Proceedings 79 00015 g003aProceedings 79 00015 g003b
Figure 4. mRNA Expression of TNF-α level among overweight subjects and obese with and without hypertension subjects in cultured human AbdSc adipocytes. Total RNA was isolated from AbdSc adipocytes from (A) overweight subjects (n = 10) and (B) obese ± hypertension subjects (n = 10) and treated with LPS (10 ng/mL) in the presence and absence of SN50 (50 µg/mL) at 12 h of incubation. Quantitative RT-PCR was performed using a premade TaqMan probe for TNF-α. The quantitative fold changes in mRNA expression were determined as relative to 18S mRNA levels in each corresponding group and calculated using the 2-ΔΔCT method. Statistical analysis was undertaken using the independent sample t-test. p < 0.05 was considered as significant versus untreated cells. * p-value = 0.02, ** p-value = 0.002 (the overweight group), p-value = 0.005 (the obese ± hypertension group).
Proceedings 79 00015 g004
Figure 5. mRNA expression of TNF-α level in cultured human AbdSc adipocytes in the studied combined group. Total RNA was isolated from AbdSc adipocytes treated with LPS (10 ng/mL) in the presence and absence of SN50 (50 µg/mL) at 12 h of incubation. Quantitative RT-PCR was performed using a premade TaqMan probe for TNF-α. The quantitative fold changes in mRNA expression were determined as relative to 18S mRNA levels in each corresponding group and calculated using the 2-ΔΔCT method. Statistical analysis was undertaken using the independent sample t-test. * p < 0.05 was considered as significant versus untreated cells. * p-value < 0.02, ** p-value = 0.001.
Proceedings 79 00015 g005
Figure 6. mRNA expression of angiotensinogen (AGT) levels among overweight subjects and obese subjects with and without hypertension in cultured human AbdSc adipocytes. Total RNA was isolated from AbdSc adipocytes from (A) overweight subjects (n = 10) and (B) obese ± hypertension subjects (n = 10) treated with LPS (10 ng/mL) in the presence and absence of SN50 (50 µg/mL) at 12 h of incubation. Quantitative RT-PCR was performed using a premade TaqMan probe for AGT. The quantitative fold changes in mRNA expression were determined as relative to 18S mRNA levels in each corresponding group and calculated using the 2-ΔΔCT method. Statistical analysis was undertaken using the independent sample t-test. * p < 0.05 was considered as significant versus untreated cells. * p-value = 0.02, ** p-value = 0.002 (overweight), *** p-value =< 0.001 (obese ± hypertension).
Proceedings 79 00015 g006
Figure 7. mRNA expression of AGT levels in cultured human AbdSc adipocytes in the studied combined group. Total RNA was isolated from AbdSc adipocytes treated with LPS (10 ng/mL) in the presence and absence of SN50 (50 µg/mL) at 12 h of incubation. Quantitative RT-PCR was performed using a premade TaqMan probe for AGT. The quantitative fold changes in mRNA expression were determined as relative to 18S mRNA levels in each corresponding group and calculated using the 2-ΔΔCT method. Statistical analysis was undertaken using the independent sample t-test. p <0.05 was considered as significant versus untreated cells. * p-value = 0.04, *** p-value < 0.001.
Proceedings 79 00015 g007
Figure 8. Angiotensinogen antibody by western blot. Adipocyte cells were treated with LPS at 10 ng/mL in the presence and absence of SN50 (50 μg/mL) at 24 h of incubation. Proteins (20 μg per lane) were separated by 12% SDS-PAGE and analyzed by western blotting using the anti-AGT antibody. The loading equality was controlled using the antibody against the β-actin protein.
Proceedings 79 00015 g008
Publisher’s Note: MDPI stays neutral with regard to jurisdictional claims in published maps and institutional affiliations.

