Proceeding Paper

Inhibition of TNF-Alpha Using Plant-Derived Small Molecules for Treatment of Inflammation-Mediated Diseases †

by
Md. Rimon Parves
1,*,
Shafi Mahmud
2,
Yasir Mohamed Riza
1,
Khaled Mahmud Sujon
2,
Mohammad Abu Raihan Uddin
1,
Md. Iftekhar Alam Chowdhury
1,
Md. Jahirul Islam
1,
Fahmida Alam Tithi
1,
Mosharaf Alam
1,
Nabila Rahman Jui
1,
Saiful Islam
1 and
Nurul Absar
1
1
Department of Biochemistry and Biotechnology, University of Science and Technology Chittagong (USTC), Foy’s Lake, Khulshi, Chittagong 4202, Bangladesh
2
Department of Genetic Engineering & Biotechnology, University of Rajshahi, Rajshahi 6205, Bangladesh
*
Author to whom correspondence should be addressed.
Presented at the 1st International Electronic Conference on Biomolecules: Natural and Bio-Inspired Therapeutics for Human Diseases, 1–13 December 2020; Available online: https://iecbm2020.sciforum.net/.
Proceedings 2021, 79(1), 13; https://doi.org/10.3390/IECBM2020-08586
Published: 30 November 2020

Abstract

:
Inhibition of tumor necrosis factor-alpha (TNF-α) has become a feasible target for alleviating inflammation-mediated diseases. Currently, techniques developed, such as anti-TNF antibody therapies, prove not to be nearly as beneficial enough to effectively treat inflammation-mediated syndromes because of the increased risk for severe infections and malignancies. Our study has undertaken the attempt of identifying small molecules to inhibit TNF-α. This study manually selected 37 plant-derived compounds based on IC50 value from various literature, which showed inhibitory activity against TNF-α. By employing an in silico pipeline, we have aimed to explore the binding modes, to discover the most possible mechanism of inhibition, as well as, for a deeper understanding of structural changes, which is necessary for rationalization of the targeted inhibition by our proposed bioactive compounds. Therefore, this study has identified two potential compounds through advanced induced fit docking and simulation study. The stability of protein-ligand complex and structural changes was studied by performing 100 ns molecular dynamics simulation with its binding energy estimated through MM-PBSA analysis.

1. Introduction

Tumor necrosis factor-alpha (TNF-α) is a pleiotropic inflammatory cytokine trimeric protein, encoded within the major histocompatibility complex. TNF-α is believed to play a significant role in the response of the innate immune system, inflammation associated carcinogenesis, and different pathophysiological function [1,2,3].
TNF derives its biological functions through initiating diverse signaling pathways, such as the nuclear factor κB (NF-κB) and c-Jun N-terminal kinase (JNK). NF-κB is a key cell survival signal and anti-apoptotic, whilst sustained JNK activation contributes to cell death. It also mediates the expression of anti-apoptotic and antioxidant genes, along with being able to block cell death to help cancer cells proliferate [4,5,6].
TNF plays a critical role in a diverse range of inflammatory, infectious, and malignant diseases. TNF’s crucial function in inflammatory diseases has been highlighted by therapeutics developed against TNF in a number of in vitro and in vivo studies. Inhibition of TNF was proved to be effective against Rheumatoid Arthritis, Ankylosing Spondylitis, Inflammatory Bowel Disease, Psoriasis, Respiratory Diseases, Cardiovascular Diseases, Renal Diseases, Diseases of the Central Nervous System, and a number of other inflammatory diseases [7].
As a pro-inflammatory cytokine, the expression of TNF could be high, as seen in inflammation and most aspects of carcinogenesis. It has already been suggested that serum TNF levels could be an indicator for understanding chemotherapeutics’ response and prognosis [8,9,10].
Since the 1980s, several attempts have been taken to develop potential inhibitors against TNF alpha, and protein-based drugs such as etanercept, infliximab, and adalimumab have been approved by the FDA [11]. However, these first-generation inhibitors have several adverse effects, such as; cognitive heart failure, activation of latent tuberculosis, and increased probability of cancer [12,13,14].
Following that, studies have suggested that the development of small molecules against the receptors are more applicable and ideal for long term use and could potentially be used in combination with other anti-inflammatory therapies [15]. Although there have been anti-TNF antibody therapies, they are quite expensive, and these therapies may increase the risk of severe infections and malignancies [16].
In silico approach is a low-cost and rapid method for identifying protein targets from massive pools of inhibitors. Our current study is concerned with exploring the inhibitory binding sites and exploring potential inhibitors for the target by combining molecular docking, mechanics, and dynamics simulation. The goal of this research is to suggest a way for the possible utilization of experimental natural compounds in the development of lead drug compounds against TNF-alpha. The rationale stands that natural compounds are generally more likely to be safer and less toxic (i.e., fewer side effects) according to several studies, whilst being relatively cost-effective and being widely available, especially in developing markets, where inflammatory-mediated illness is a pertinent and pressing issue [17,18].

2. Methodology

2.1. Ligand Preparation

We selected 37 plant-derived compounds having a specific action against TNF-α and based on wet lab validation from literature (Supplementary Table S1), which were then retrieved from the PubChem database [19]. However, it should be noted that, the bioactive compounds were chosen to identify potent inhibitors that fit structurally and can therefore be further experimented or developed on reliably. The compounds were then prepared in ligprep wizard of Schrödinger suite (LigPrep, Schrödinger, LLC, New York, NY, USA, 2018). The possible states of those compounds were generated by Epik [20] at target pH 7.0 ± 2 for proper enumeration in biological condition. High energy ionization/tautomer states were removed as they are likely to have low populations at the prevailing conditions.

2.2. Protein Preparation and Receptor Grid Generation

The three-dimensional structure of TNF-α (PDB ID: 2AZ5) was retrieved from the protein data bank [21] and prepared using the protein preparation wizard module [22] of Schrödinger suite. All the waters were deleted beyond 5.0 Å from het groups and the protein was pre-processed by assigning bond orders, adding Hydrogens, creating disulfide bonds and zero-order bonds to metals. H-bond networks were optimized, and protonation states were generated at pH 7.0. Finally, a restrain minimization was performed to converge atoms to 0.30 Å using the OPLS3e force field [23,24] before further analysis. In need of generating a receptor grid to be docked, the co-crystallized ligand was specified in the receptor grid generation panel of the Glide program [25].

2.3. XP Docking and MM-GBSA Rescoring Workflow

Initially, the screening process was started in Glide program by employing the XP docking protocol [26]. The produced pose file of XP was introduced into the Prime program (Prime, Schrödinger, LLC, New York, NY, USA, 2018) for predicting ligand binding free energies and to reach a relatively more accurate estimation rather than using Glide score. Using the VSGB(variable dielectric generalized Born solvation model )solvation model [27] and OPLS3e force field, the final minimization (minimization of all the atoms in each residue) was performed. During the minimization, only the residues within 5.0 Å of the ligand were allowed to relax, keeping the rest of the structure fixed [28,29]. The ligand-binding free energy (ΔGbind) was calculated by the following equation:
ΔGbind = Gcomplex − (Gprotein + Gligand)
where G = EMM + VSGB + GNP.
The molecular mechanics energies combined with the generalized born and surface area continuum solvation (MM-GBSA) estimates the relative free binding energies from the combination of molecular mechanics (EMM), an SGB solvation model for polar solvation (VSGB) and a non-polar solvation term (GNP) [30]. The non-polar solvation term is composed of the non-polar solvent accessible surface area and Van der Waals interactions. The best nine compounds were selected based on the best ΔGbind score.

2.4. Induced-Fit Docking

Receptor conformational changes is a critical issue in predicting the accuracy of docking. Besides this, it is crucial to ascertain accurate docking and characterization of binding sites [31]. However, to ensure the higher accuracy of docking, we have performed Induced-fit Docking (IFD) [32]. The IFD program is also coupled with Prime, which refines residues within 5.0 Å of ligand poses and predicts conformational changes within the receptor active-site following to be minimized that proceeds to redock. The best nine compounds obtained from the MM-GBSA rescoring workflow were subjected to IFD. Like XP docking workflow, here the co-crystalized ligand was used to generate receptor grid. The standard protocols were employed which generates up to 20 poses. The side chains were trimmed automatically based on B-factor prior to being optimized in Prime refinement panel. Finally, Glide XP redocking procedures were carried, in which the structures within the threshold value of 30.0 kcal/mol were redocked into the active sites. The produced poses were filtered and selected based on IFD score. Poses having the best IFD score were considered for further study.

2.5. ADME/T Calculation

The pkCSM and ADMETsar servers [33,34] were used for predicting both the physically significant descriptors and pharmaceutically relevant properties. To determine the ADME properties of selected compounds, the compounds were firstly neutralized to be processed in normal mode. It produced several important descriptors and the compounds were evaluated based on Lipinski’s rules of five, which is indispensable in rational drug design. Simplified molecular data input system (SMILES) and structure data file (SDF) were used as an input system to check the properties of our selected ligands.

2.6. Molecular Dynamics

YASARA Dynamics software [35] was used for simulating the drug-protein complexes to validate the docking study and for further investigation into the binding stability of the protein-ligand complexes. The Apo protein structure was also simulated as a control to compare and understand the changes in the protein structure upon ligand binding. Therefore, both Apo structure and ligand-protein complexes were cleaned, and hydrogen bonds were assigned, followed by parameterization. The Assisted Model Building with Energy Refinement 14 (AMBER14) force field [36] was used because this system is well known and extensively used to explain the macromolecular system. A cubic simulation cell with a size of 82.63 Å × 82.63 Å × 82.63 Å was created and Particle mesh Ewald (PME) methods were used to calculate long-range electrostatic interactions at a cut off distance of 8 Å at physiological state (298 K, pH 7.4, 0.9% NaCl) [37]. Initially, the energy minimization of each system has been performed by the simulated annealing method using the steepest descent approach (5000 cycles). Then, a Molecular Dynamics (MD) simulation was started with a time step interval of 2.00 fs [38]. Finally, simulation was performed about 100 ns long and MD trajectories were saved for every 100 ps for further analysis.

2.7. DCCM and PCA Analysis

The Bio3D software [39] implemented in the R program was used to construct dynamic cross-correlation maps. It is a matrix representation of time-correlated information between protein atoms i and j (cij). The dynamic cross-correlation matrices (DCCM) between i and j were obtained from the following formula;
D C C M i , j   = d i · d j d i 2 | d j 2
where d denotes the displacement between the current position and the average position of all selected pairs of atoms. The angle brackets denote the average overall trajectories. The values in the DCCM are predicted within the range of −1 to +1, where +1 and −1 describe the positive correlation and anti-correlation respectively.
Besides this, we performed Principal Component Analysis (PCA) [40], which was executed in the R program through Bio3D for investigating flexibility and collective motion of Apo structure, and protein-ligand complexes. The Algorithm removes translational and rotational movements, performs superimposition of the coordinates to the reference structure, and therefore calculates eigenvectors. An orthogonal coordinate transformation matrix was used to calculate the symmetric matrix, on which diagonalization was performed. The orthogonal coordinate transformation matrix produces the diagonal matrix of eigenvalues, in which the columns were the eigenvectors equivalent to the direction of motion relative to the initial coordinates. Furthermore, the eigenvectors were correlated with eigenvalues, representing the root-mean-square fluctuation (RMSF) of the system along the corresponding eigenvector. The mathematical details have been described previously [41,42]. The images of DCCM and PCA were rendered by using Visual molecular dynamics (VMD) and PyMOL software [43,44].

2.8. MM-PBSA Calculation

The MD trajectories were subjected to Molecular Mechanics Poisson-Boltzmann Surface Area (MMPBSA) for estimating ligand binding free energy by using built in macros of YASARA, which applies the following formula:
Binding Energy = EpotRecept + EsolvRecept + EpotLigand + EsolvLigand − EpotComplex − EsolvComplex
where more positive energies indicate better binding.

3. Results

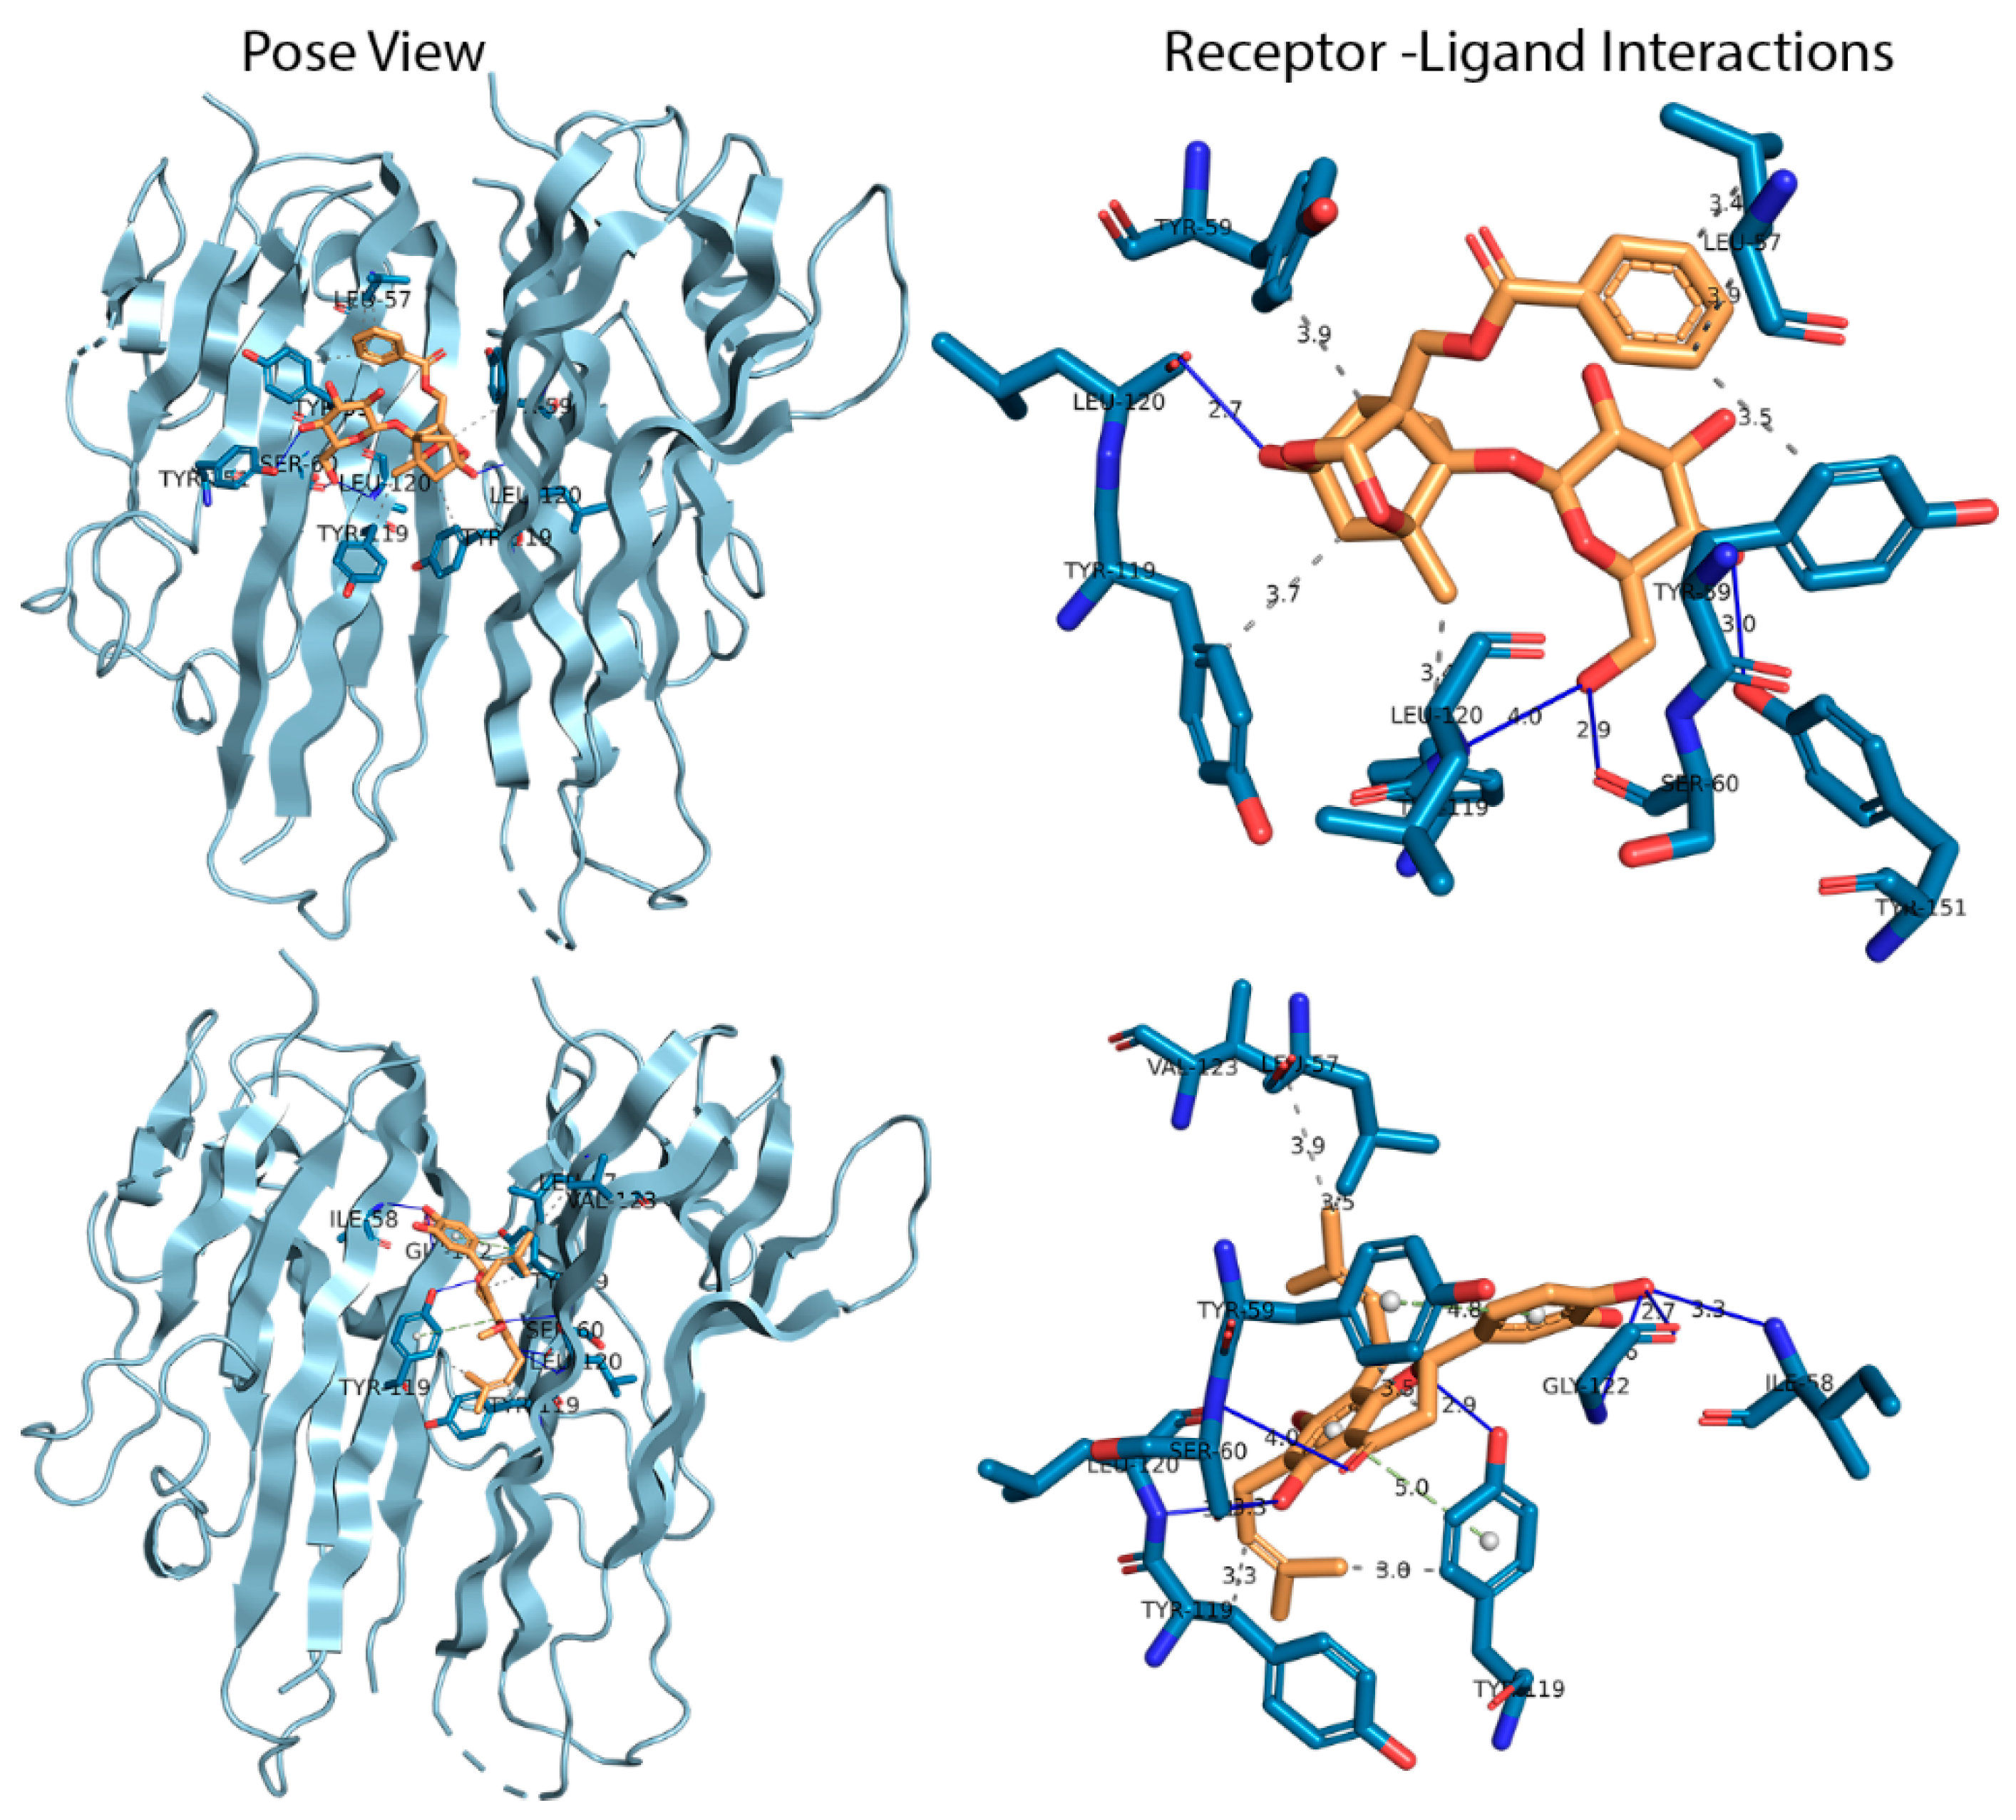
3.1. Docking Analysis

Molecular docking is an essential approach in understanding binding modes of the protein-ligand complex. However, in need of searching for potential inhibitors against TNF-α, a multistep and rigorous docking was performed. Firstly, XP docking was carried and the top nine compounds were selected based on ΔG bind score for having more accuracy. Table 1 represents the results obtained from XP docking and MM-GBSA. Finally, the top 9 compounds were subjected to IFD, wherein two ligands were considered, which could satisfy the target. The best IFD score was chosen for selecting the best pose. Table 2 reports the IFD score selected compounds with TNF-α. Figure 1 illustrates the details of non-bonded interaction study.

3.2. ADME/T Analysis

Physiochemical characteristics by the compound can be a valid alternative to the experimental method. To propose a compound to be a drug, it has to maintain certain criteria. Here, we have predicted the pharmacological and pharmacokinetic properties of two chemical compounds obtained from the docking simulation study. Thereafter, the ADMETsar, SwissAdme, and PkCSM webserver was used to determine whether the ligands had any toxic profile by evaluating the physiological profile (Table 3).

3.2.1. Molecular Dynamics Simulation Analysis

Molecular dynamics has become an essential approach in understanding stability, compactness, and expansion of the protein-ligand complex. Herein, three protein-ligand complexes including Apo protein were simulated (Figure 2). The co-crystalized protein-ligand complex was also simulated to get better contrast with other complexes. Therefore, it can be seen from Figure 2a that Paeoniflorin-TNFα complex exhibited higher root-mean-square deviation (RMSD) than other complexes throughout the simulation, and Amoradicin-TNFα showed the lowest RMSD over the time scale. However, the RMSD of control drug-TNFα complex was less than Paeoniflorin-TNFα complex and Apo protein.
Besides, from Figure 2b, it can be observed that Apo protein showed increased Radius of Gyration (Rg) value until 75 ns, and it decreased afterward. The Rg value of all complexes inclosing Apo was increased from the beginning to 12 ns of simulation, after which small random fluctuations were noticed. The Rg of control drug-TNFα complex seemed to be comparatively much lower from 0–50 ns, but showed random increased and decreased Rg in the next 50 ns time scale. Conversely, the Rg of Paeoniflorin-TNFα complex seemed to be quite lower after 50 ns to 100 ns of simulation, even though this complex showed increased Rg from 0–50 ns. Furthermore, the Rg of Amoradicin-TNFα complex seemed to be lower at 30 ns and highest at 48 ns. This complex also showed the largest decreased Rg value near to 61 ns and 66 ns. However, the noticeable increasing and decreasing trends of Rg was found frequently after 66 ns. On the other hand, the Rg of Apo protein was increased from 0–14 ns, 15–30 ns, 45–60 ns, and 65–78 ns. Thus, the interval of increased Rg range denotes the time of decreased Rg.
On the other hand, the Solvent Accessible Surface Area (SASA) analysis (Figure 2c) showed Paeoniflorin- TNFα complex had an increased but mostly stable SASA value compared to the other protein-complexes. The noticeable decreased SASA was found at 48–51 ns. The lowest SASA value was observed for the control drug-TNFα at 0–65 ns. Thereafter, this complex showed slightly increased Rg till 88 ns, after which it was found to be decreased. For Amoradicin-TNFα complex, the SASA value randomly fluctuated at different frequencies. The timescale of fluctuations is at 10–15 ns (lower peak), 42–58 ns (higher peak), 62–72 ns (lower peak), 80–84 ns (lower peak), and 85–100 ns (random higher peak), respectively. The SASA value of Apo protein was almost the same as the other protein-ligand complexes until 40 ns. The higher fluctuation of Apo was observed at 55–70 ns and the sharply decreasing Rg value was noticed at 82–100 ns.
Overall, from the analysis of RMSD, Radius of gyration, and SASA value of all simulated systems, it can be observed that Amoradicin-TNFα complex showed better stability compared to other protein-ligand complexes, even when compared with the Apo protein. The RMSD of Amoradicin-TNFα and its time series analysis showed less RMSD value (average:1.36 Å), which indicates its better stability. The average RMSD of Amoradicin-TNFα was almost near to the control drug—TNFα complex (1.45 Å), whereas the average RMSD of Paeoniflorin- TNFα complex and Apo was 1.47 Å and 1.54 Å, respectively. Besides this, the Amoradicin-TNFα complex showed a lower degree of fluctuation in Rg analysis (average Rg value 19.35 Å), compared to Apo protein (average Rg 19.45 Å), and Paeoniflorin- TNFα complex (average Rg value 19.36 Å). The average Rg of the control drug-TNFα complex was 19.34 Å, indicating that the average compactness and rigidity of the control drug-TNFα complex is almost the same, whilst compared to the respective Rg properties of Amoradicin-TNFα complex.
The average SASA value of all systems were 12749.23 Å2 (Apo), 13108.08 Å2 (Paeoniflorin- TNFα complex), 12712.89 Å2 (Amoradicin-TNFα complex), and 12709.78 Å2 (control drug-TNFα complex); this indicates that the binding of Paeoniflorin increases SASA, and binding of Amoradicin, control drug reduces SASA, while compared to the Apo structure.
For a better understanding of the region of all the respective proteins and their complexes that have been fluctuated during the simulation, we have separated and reported (Figure 2) RMSF analysis of A and B chain. From Figure 2d, it can be observed that Paeoniflorin and protein complex exhibit slightly higher RMSF profile than other complexes in A chain. The Figure also revealed that the beta-hairpin region (Ala22, Glu23, Gly24, Gln25), helix zone (Ser71, Thr72), beta-turn (Ala145, Glu146) unveil greater RMSF value for all protein complexes whereas Paeoniflorin showed higher flexibility. On the other hand, Amoradicin showed higher fluctuation than other complexes in 10–60 amino acids, after which the control drug and Apo protein had taken the place of Amoradicin complex in terms of higher instability. Interestingly, the Paeoniflorin complex showed more flexibility from 120–160 amino acid residues from the B chain (Figure 2e). Beta hairpin (Gln21, Ala22, Glu23), and helix strand (Lys 90, Val91, Asn92, Leu93, Ile118, Tyr119) regions of B chain had more flexibility compared to other amino acids.

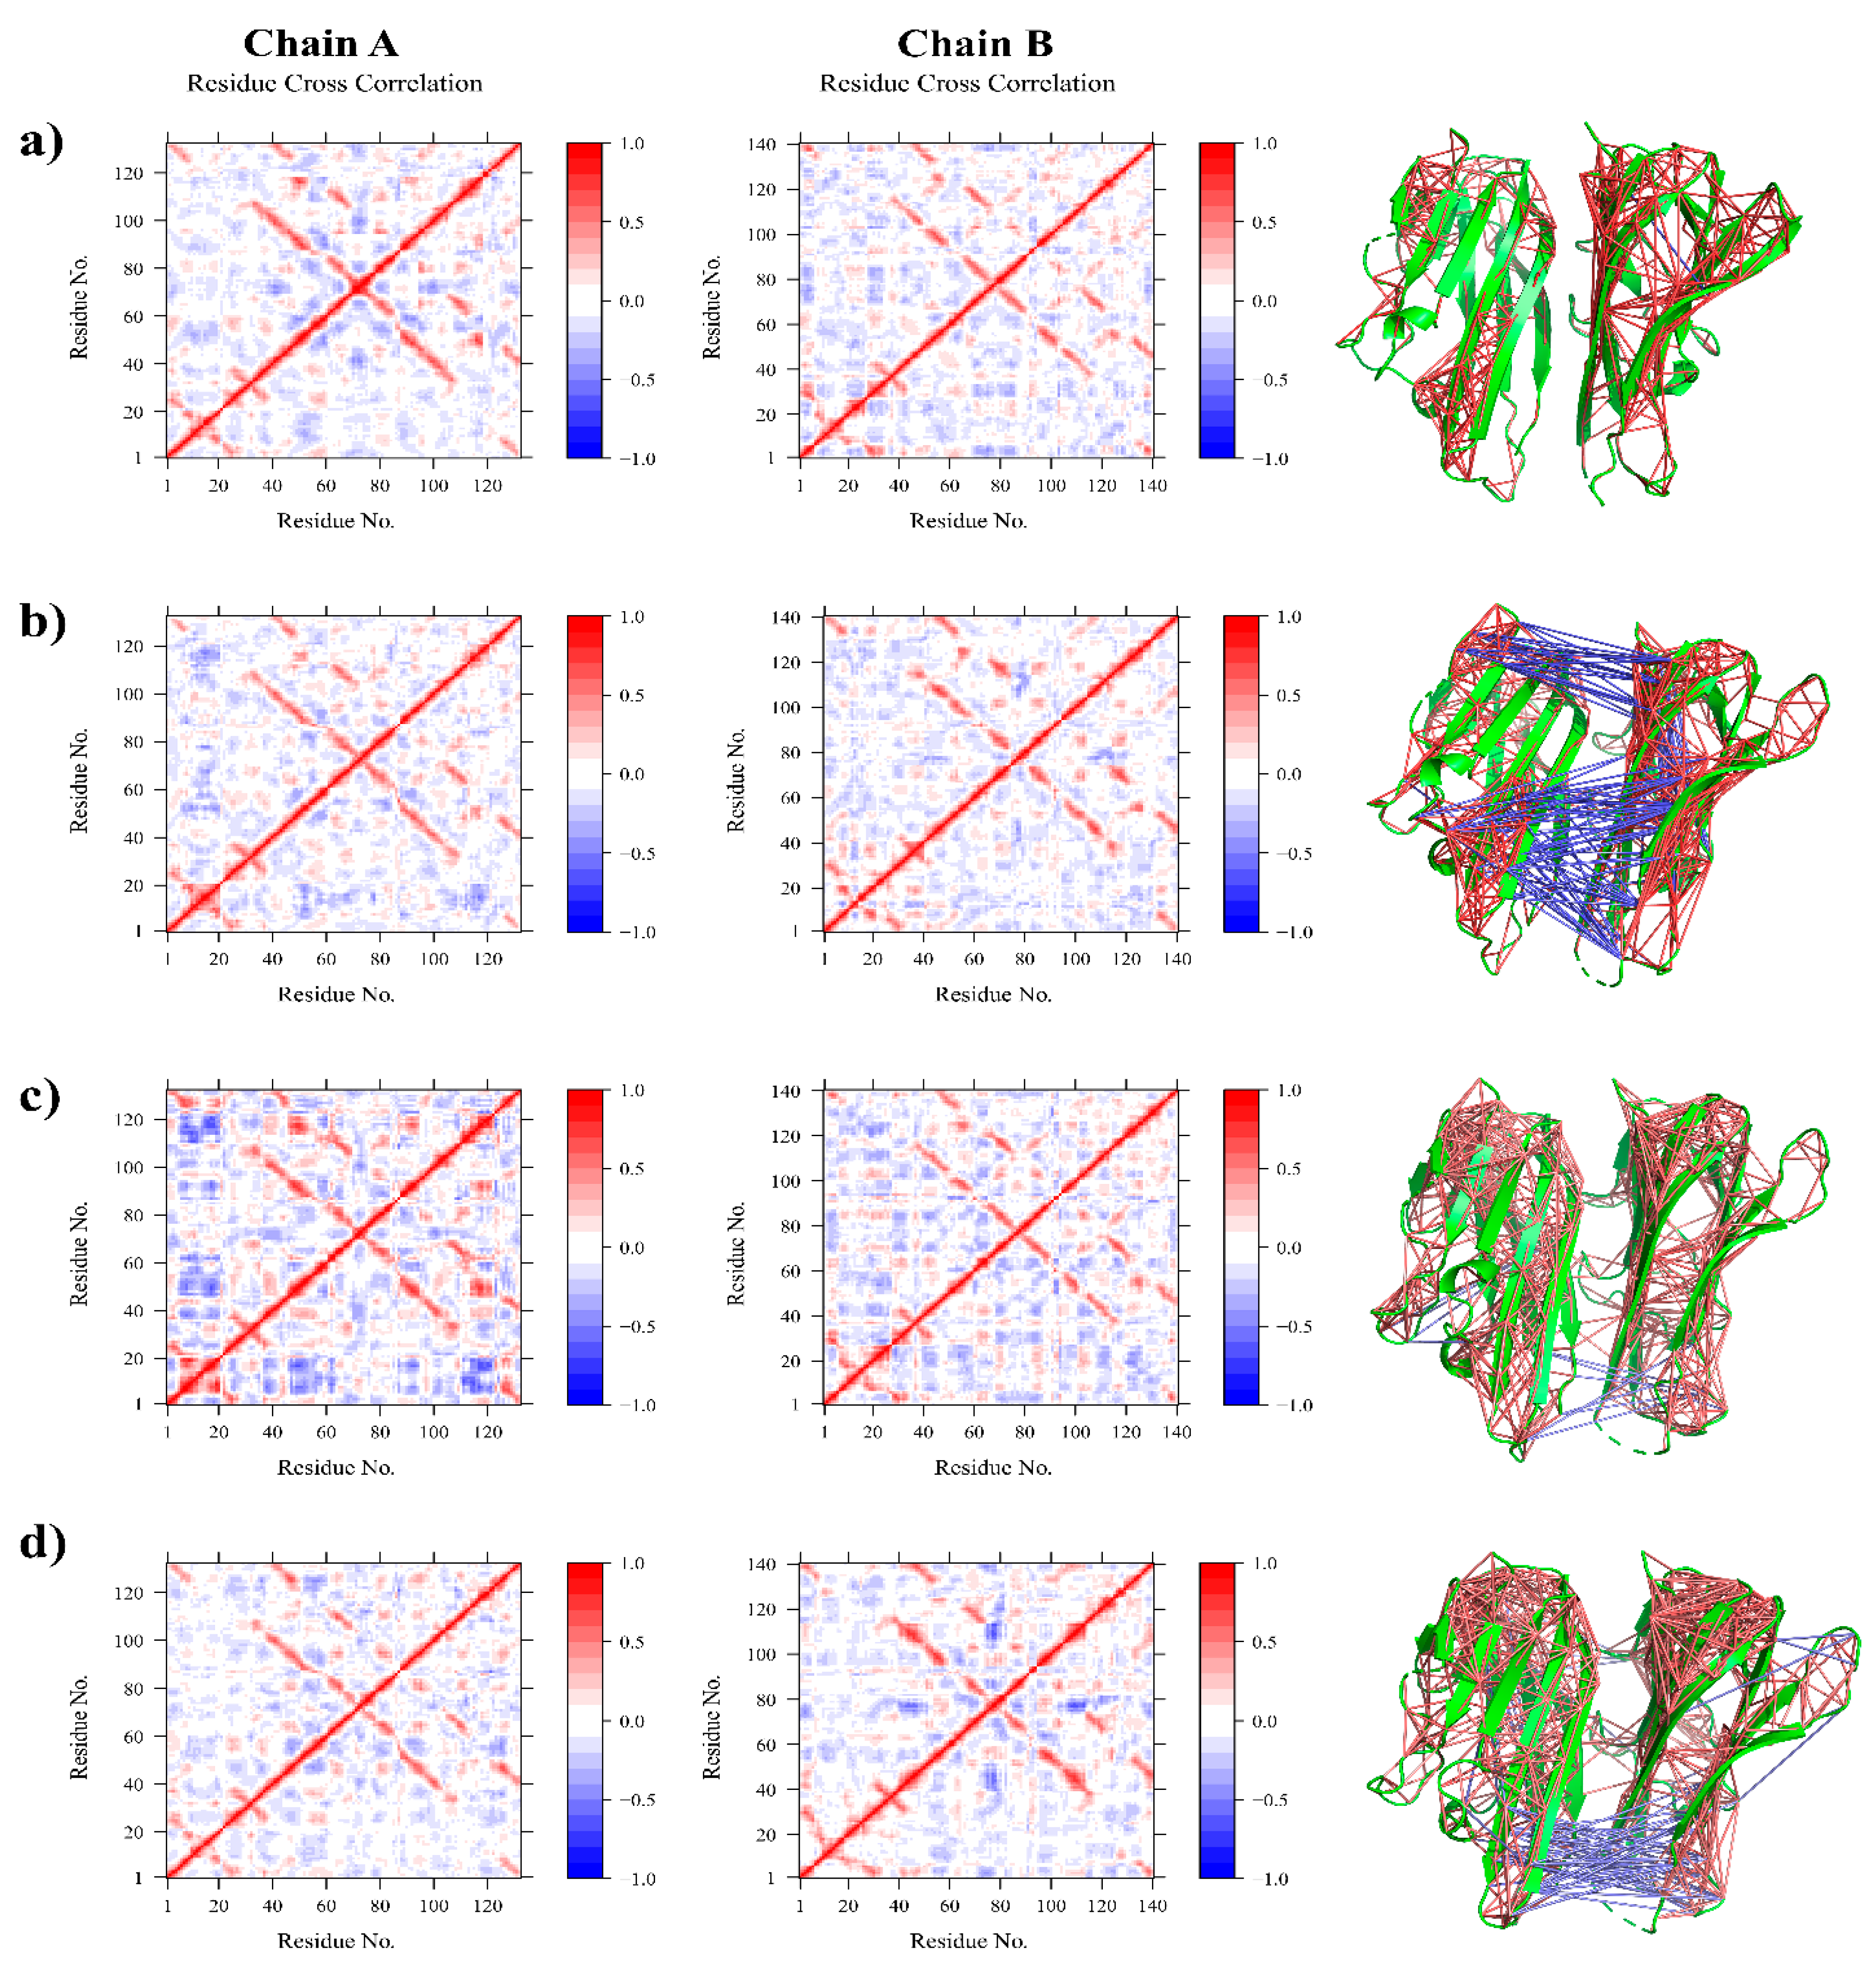
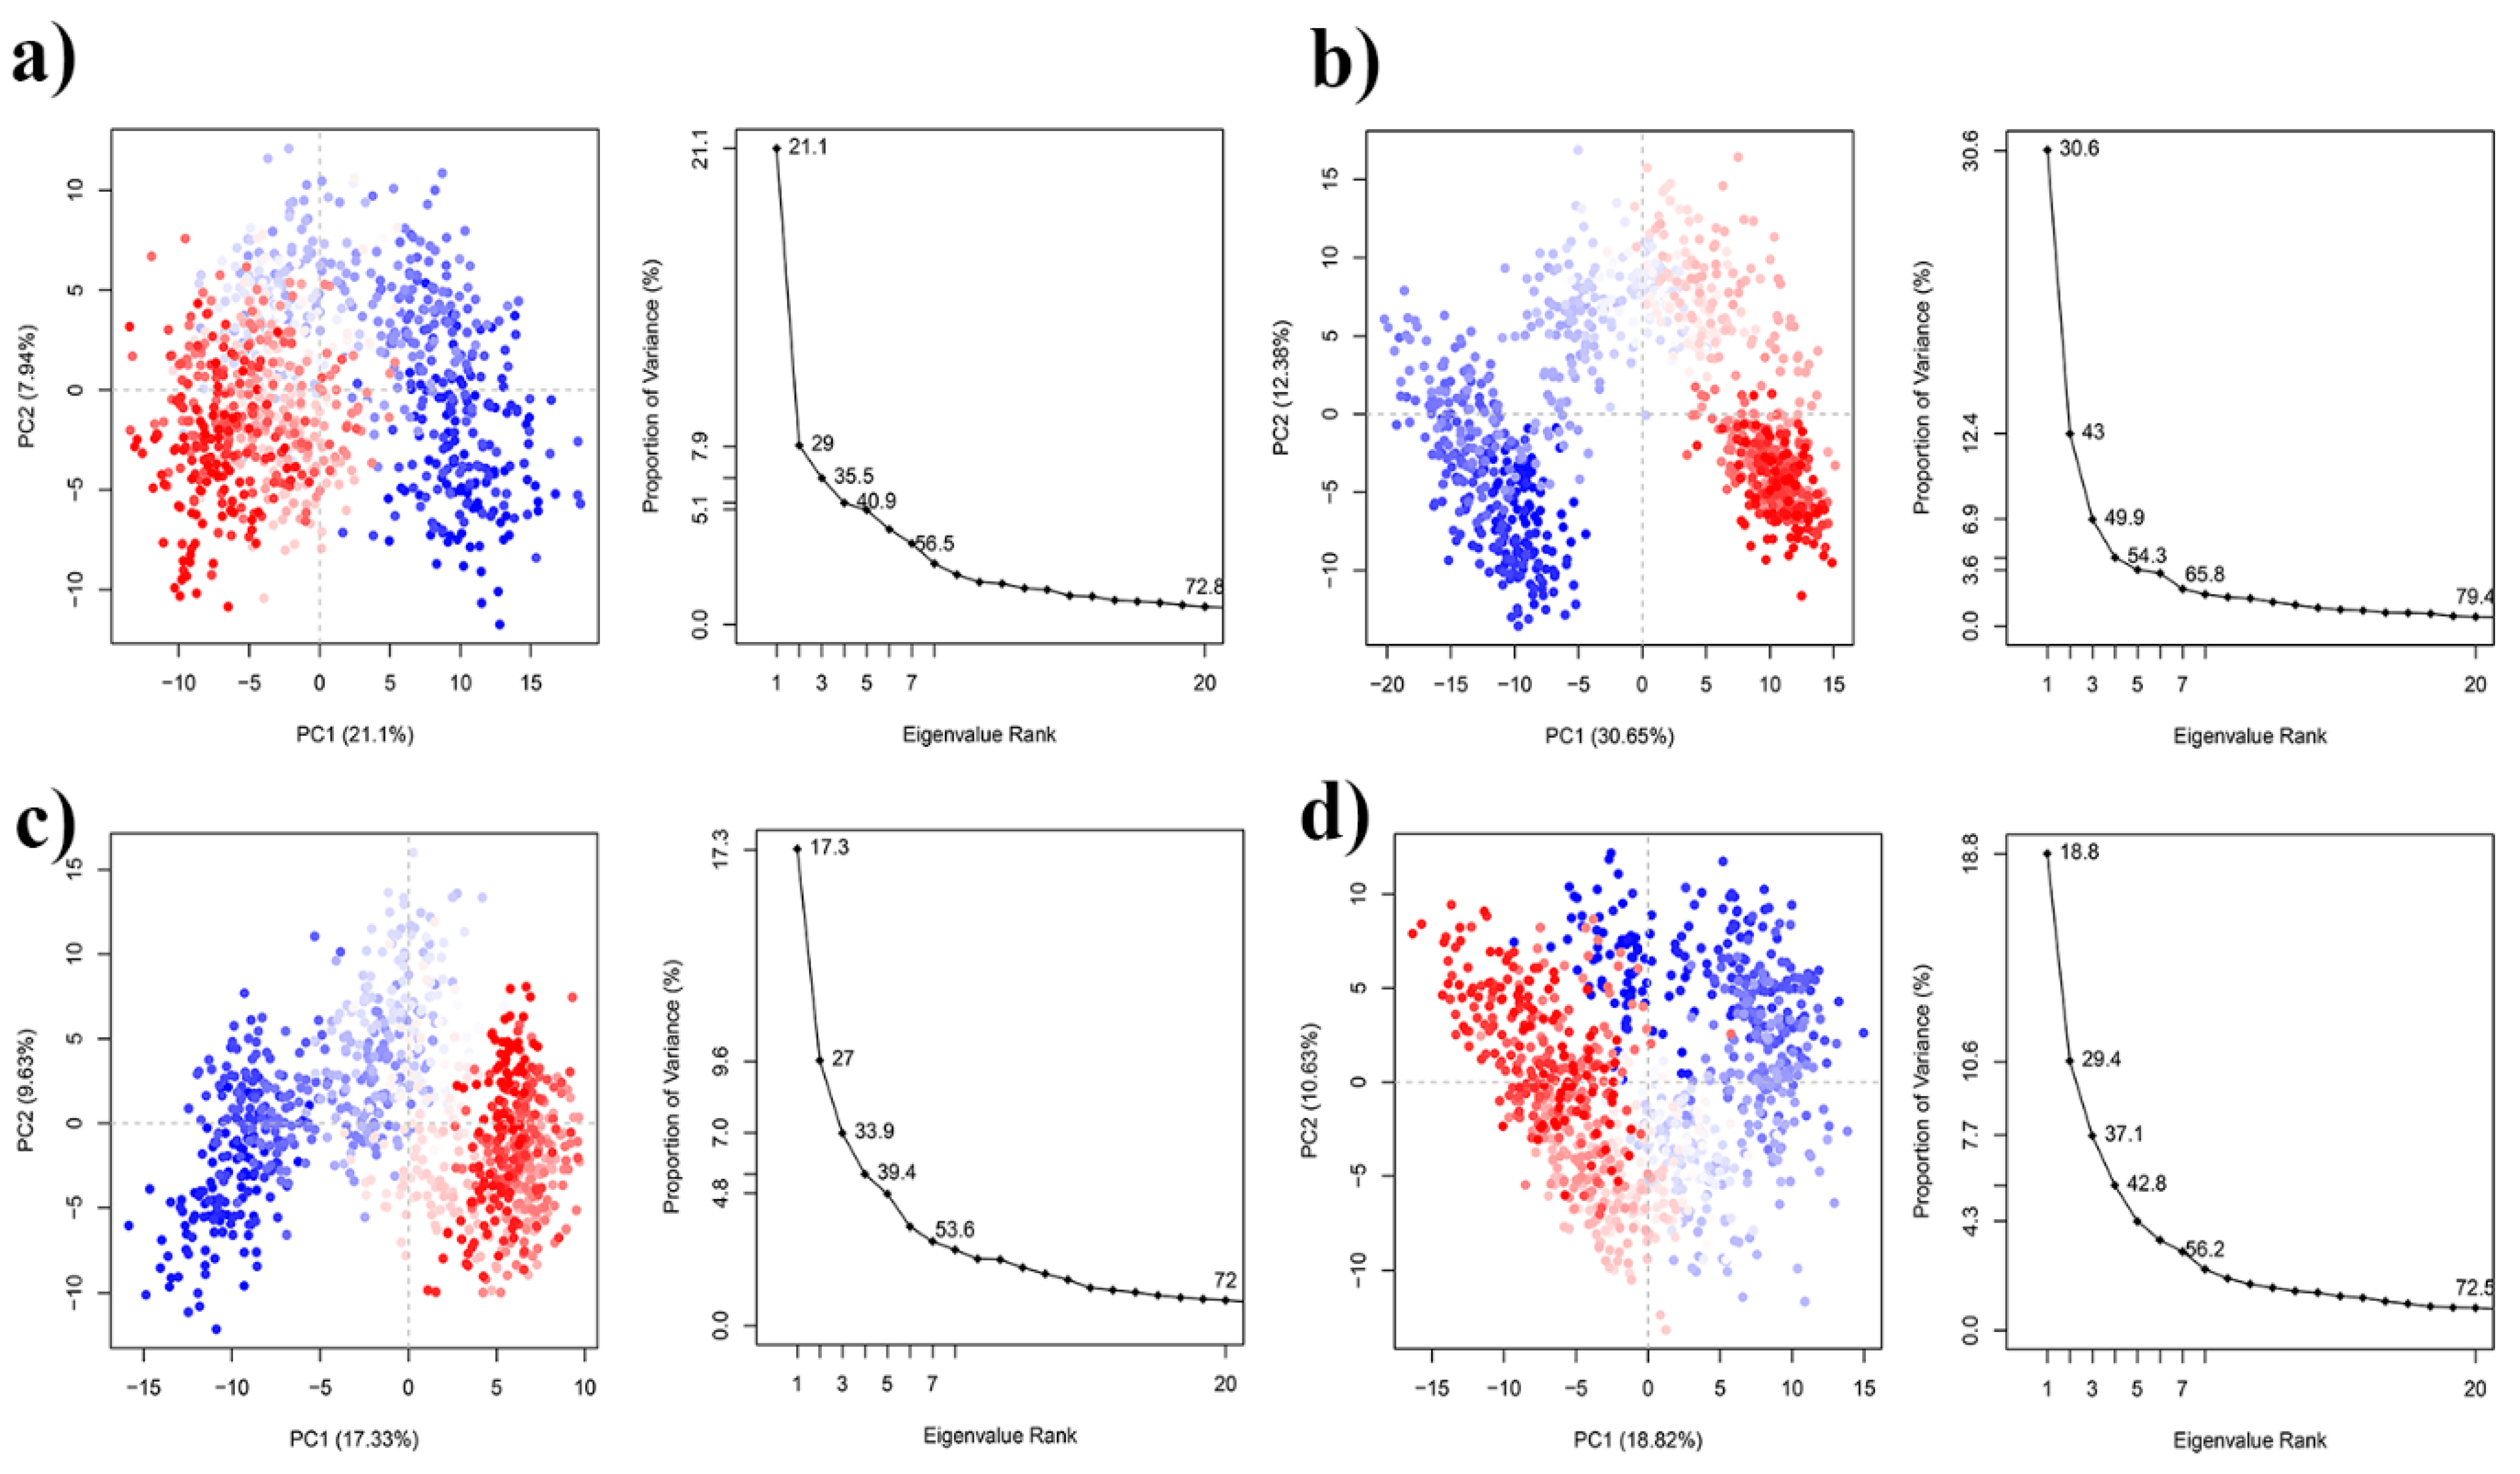
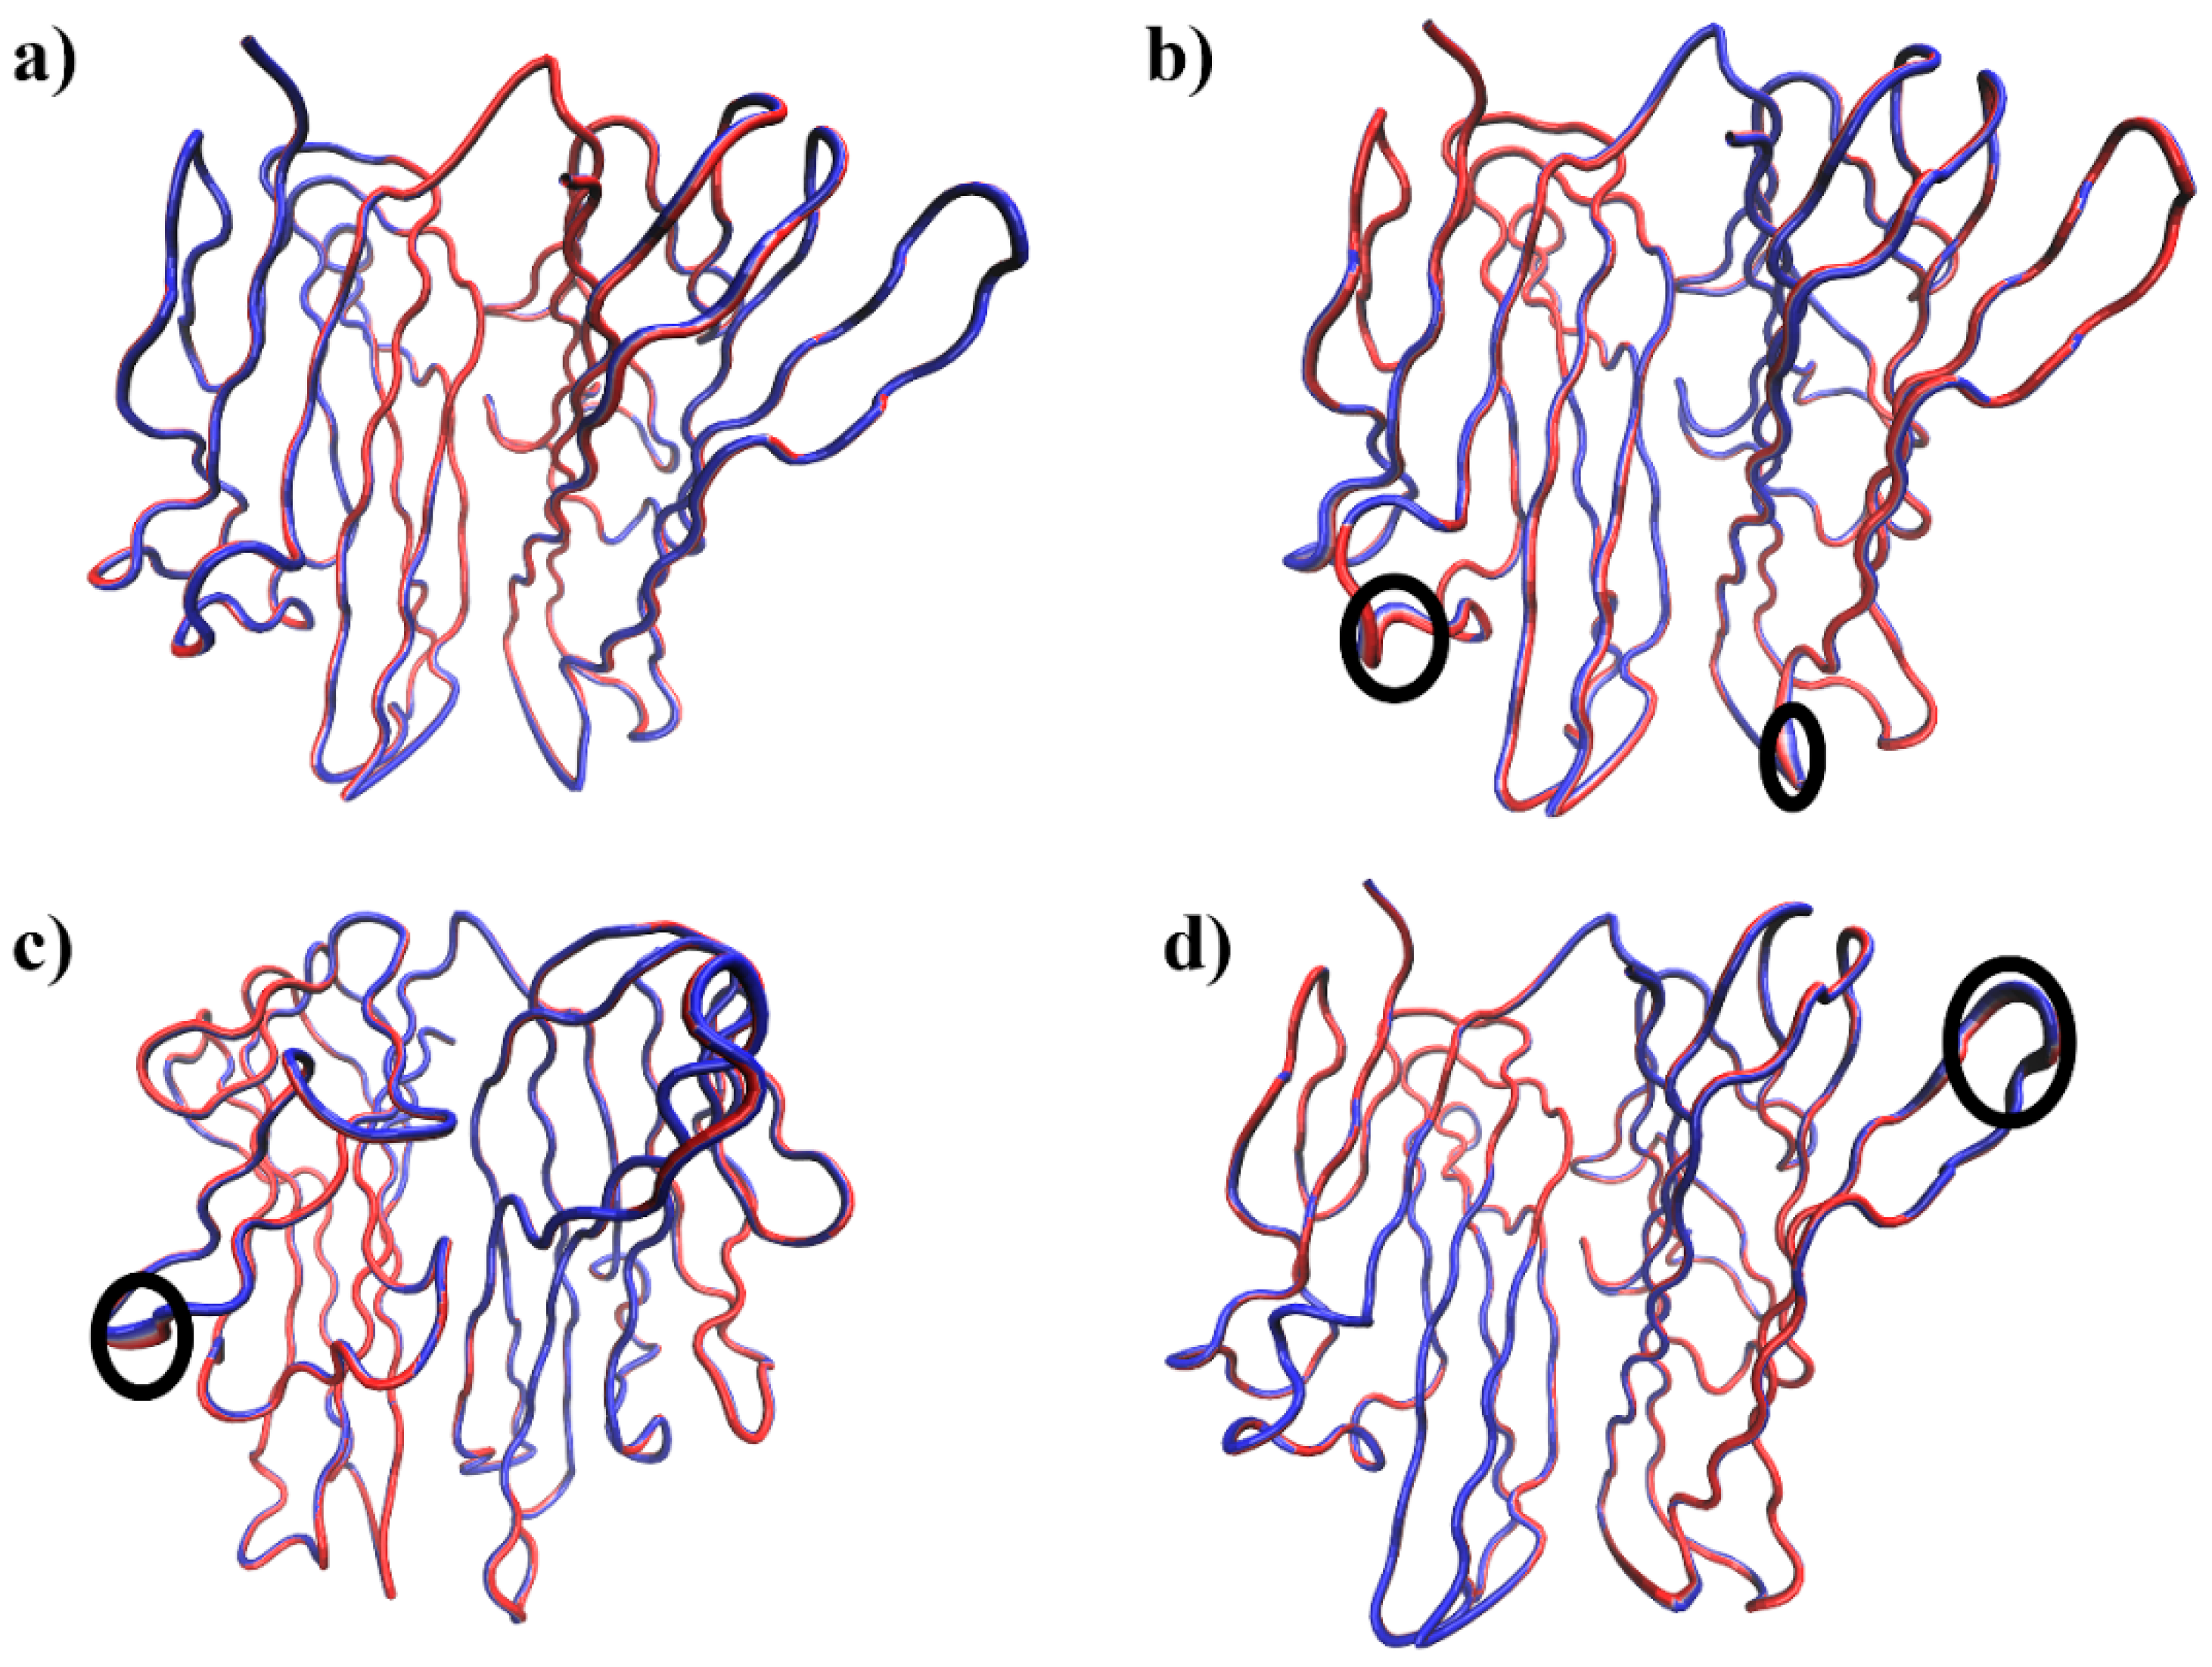
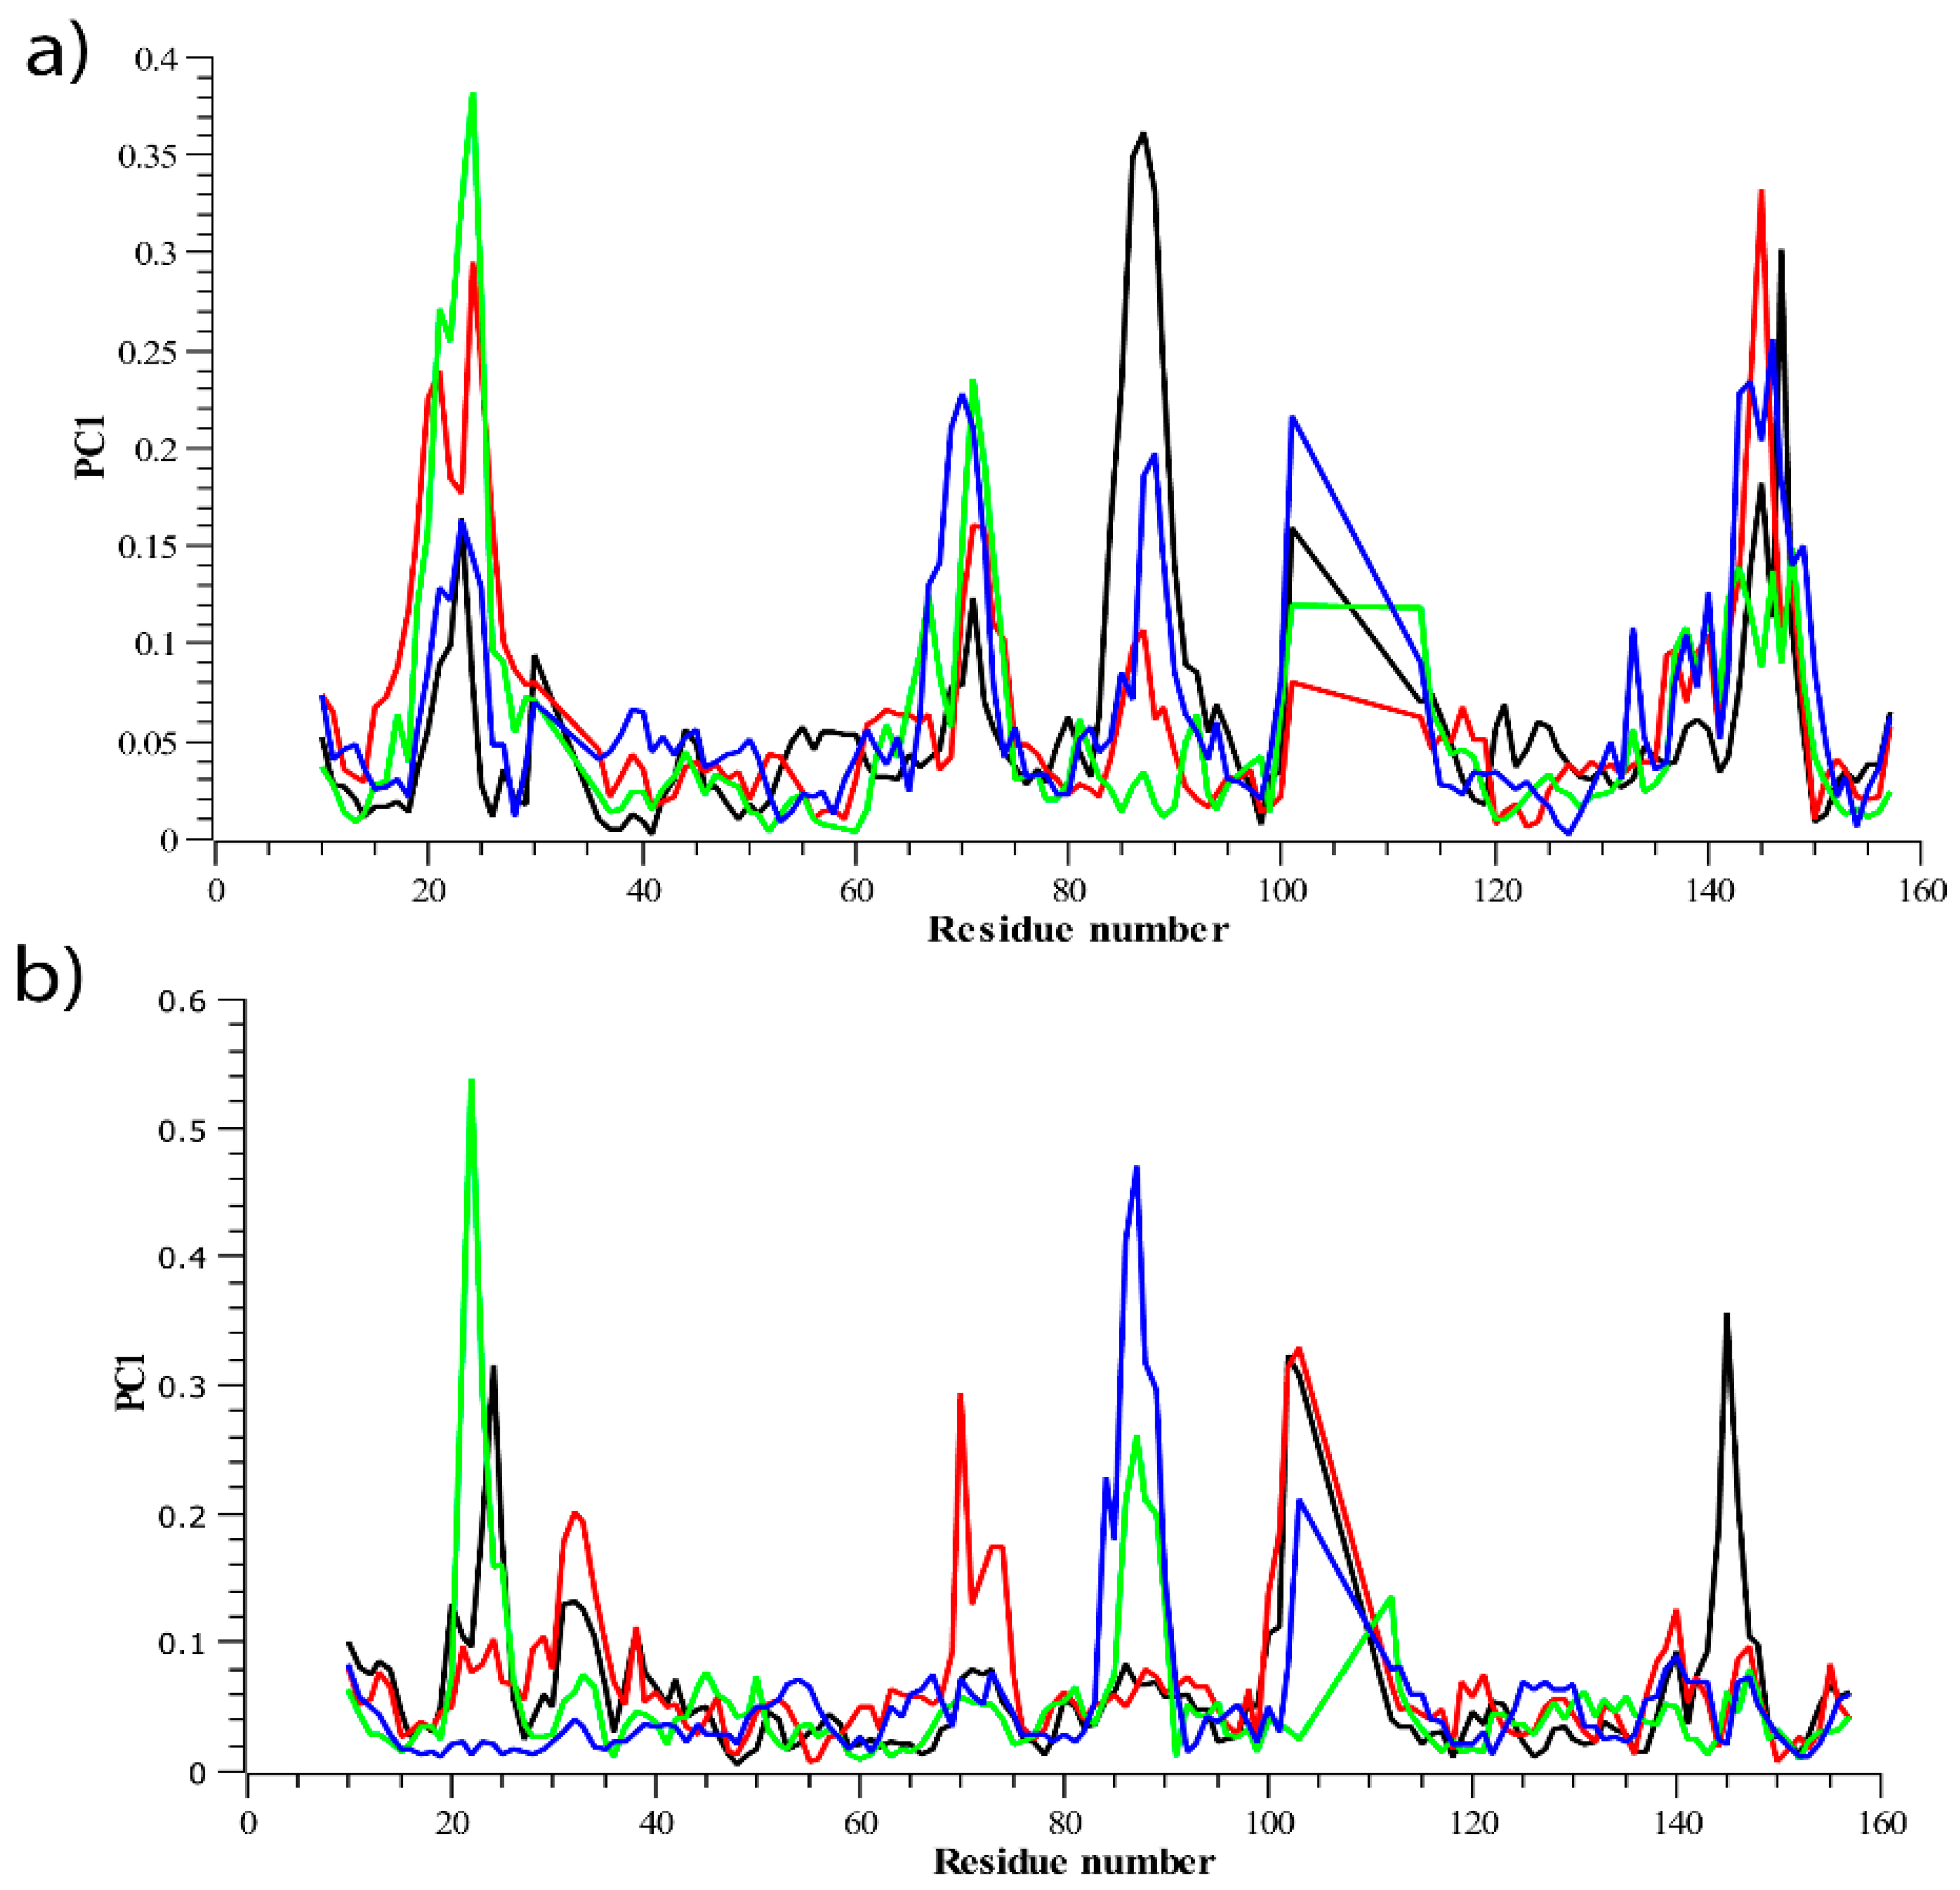
3.2.2. Residue Flexibility and Motion Analysis

After analyzing the root mean square fluctuation (RMSF) of Cα atoms, the correlative motions were analyzed, which is known to play an important role in the identification and interrelation of the bio-macromolecular system, which can be achieved from the analysis of the dynamic cross-correlation matrix (DCCM). Figure 3 represents time correlated information among protein residues, where the intensity of the red and blue color indicates the degree of positive and negative correlation.
The Apo structure was found to be positively correlated with having very little negative correlation. In the case of Paeoniflorin-TNFα complex, the positive correlation and negative correlation was a bit higher than the Apo one, indicating that the binding of Paeoniflorin alters residual movement. The major anti cross-correlation was found within binding site residues indicating that binding of Paeoniflorin could prevent the trimeric association of TNFα by interfering with their motions and associations.
Besides this, the Amoradicin-TNFα complex seemed to be quite weakly negatively correlated, especially within disulfides and active sites residues, indicating that Amoradicin could induce little structural conformation and might have a slight effect on subunit attachment of TNFα. However, while comparing the motions of proposed compounds and its complex to control drug-TNFα complex, the negative correlation for the control one was observed mostly within binding sites and disulfides. Additionally, Principle Component Analysis (PCA) was performed.
The PCA analysis can convert the high-dimensional data of protein dynamics into the low-dimensional space to obtain a series of eigenvectors and eigenvalues that reflect overall motions in the protein [45,46]. The PCA can be applied to any system and permits to study the influence of any varying parameters by reducing the complexity of the collective motion [47,48,49], which is associated with the phase space behavior related to protein functions and stability. Therefore, it is often used to characterize different conformational variances which are involved in protein folding, open-close mechanism of ion channels, and conformational dynamics [50,51,52,53].
The first 34 PCs of the Apo, Paeoniflorin-TNFα complex, Amoradicin-TNFα complex, and control drug-TNFα accounted for 21.1%, 30.65%, 17.33%, and 18.82% of the total variations, respectively (Figure 4). The highest PC1 (30.65%) was noticed for Paeoniflorin- TNFα complex, which indicates that the complex had undergone higher conformational changes. Conversely, the lowest PC1 (17.33%) was observed for Amoradicin- TNFα complex, indicating that the complex had undergone very little conformational changes. However, the PC1 of the control drug-TNFα complex was slightly higher than the Paeoniflorin-TNFα complex, which was calculated as 18.82% of total variations.
Moreover, the PC1 of Apo structure was 21.1%, which is greater than Amoradicin-TNFα complex, and control drug-TNFα complex, indicating that binding of Amoradicin and the control drug stabilizes the Apo’s conformational changes. Figure 5 shows the possible conformational changes of complexes which are responsible for the variations into their PC scores.
Figure 6 displays the contribution of residues to the corresponding PC1 of all systems. It can be seen from Figure 6a,b that the residues in A chain positioning at 18–24, 65–72, 82–94, and 142–154 was mostly mobile. The major contributions of these residues to PC1 of Amoradicin-TNFα complex was notably higher, which indicates that the binding of Amoradicin with TNFα mostly induces its residues mobility.
The second major residual contribution to PC1 of Paeoniflorin-TNFα complex was observed mostly at the same positions as aforementioned, except for the position ranging from 82–94, that was exhibited by the contribution from control drug-TNFα complex. However, in the case of the residual contribution positioning from 142–154, their influences on PC1 were ordered as Amoradicin-TNFα complex > control drug-TNFα complex > Paeoniflorin-TNFα complex > Apo. On the other hand, the residual contribution of B chain, positioned at the same orientation as described earlier for A chain was observed. It showed that the local mobility of these residues was found to be different for apo protein and all the other protein-ligand complexes, which facilitates to a deeper understanding of the ligand-induced behavior of protein mobilities. It can be understood from Figure 6b that the control drug and paeoniflorin reduce residual flexibility positioning from 18–24, indicating that they might better influence the flexibility of A chain at the same positions than that of B chain.
Furthermore, another major fluctuation and its contribution was noticed for paeoniflorin-TNFα complex at the residue 65–72. However, the major exceptionalities were found for the residues, positioning from 82–94, where the binding of control drug and Amoradicin significantly alters its flexibility when compared to PC1 of its respective complexes of A chain. So, these ligands might induce residue flexibilities mostly in the same region. Interestingly, another major change in fluctuations was noticed for all the protein-ligand complex, where the residual flexibilities at 142–154 were found to be reduced. Overall, the PCA analysis supports our earlier RMSF analysis.

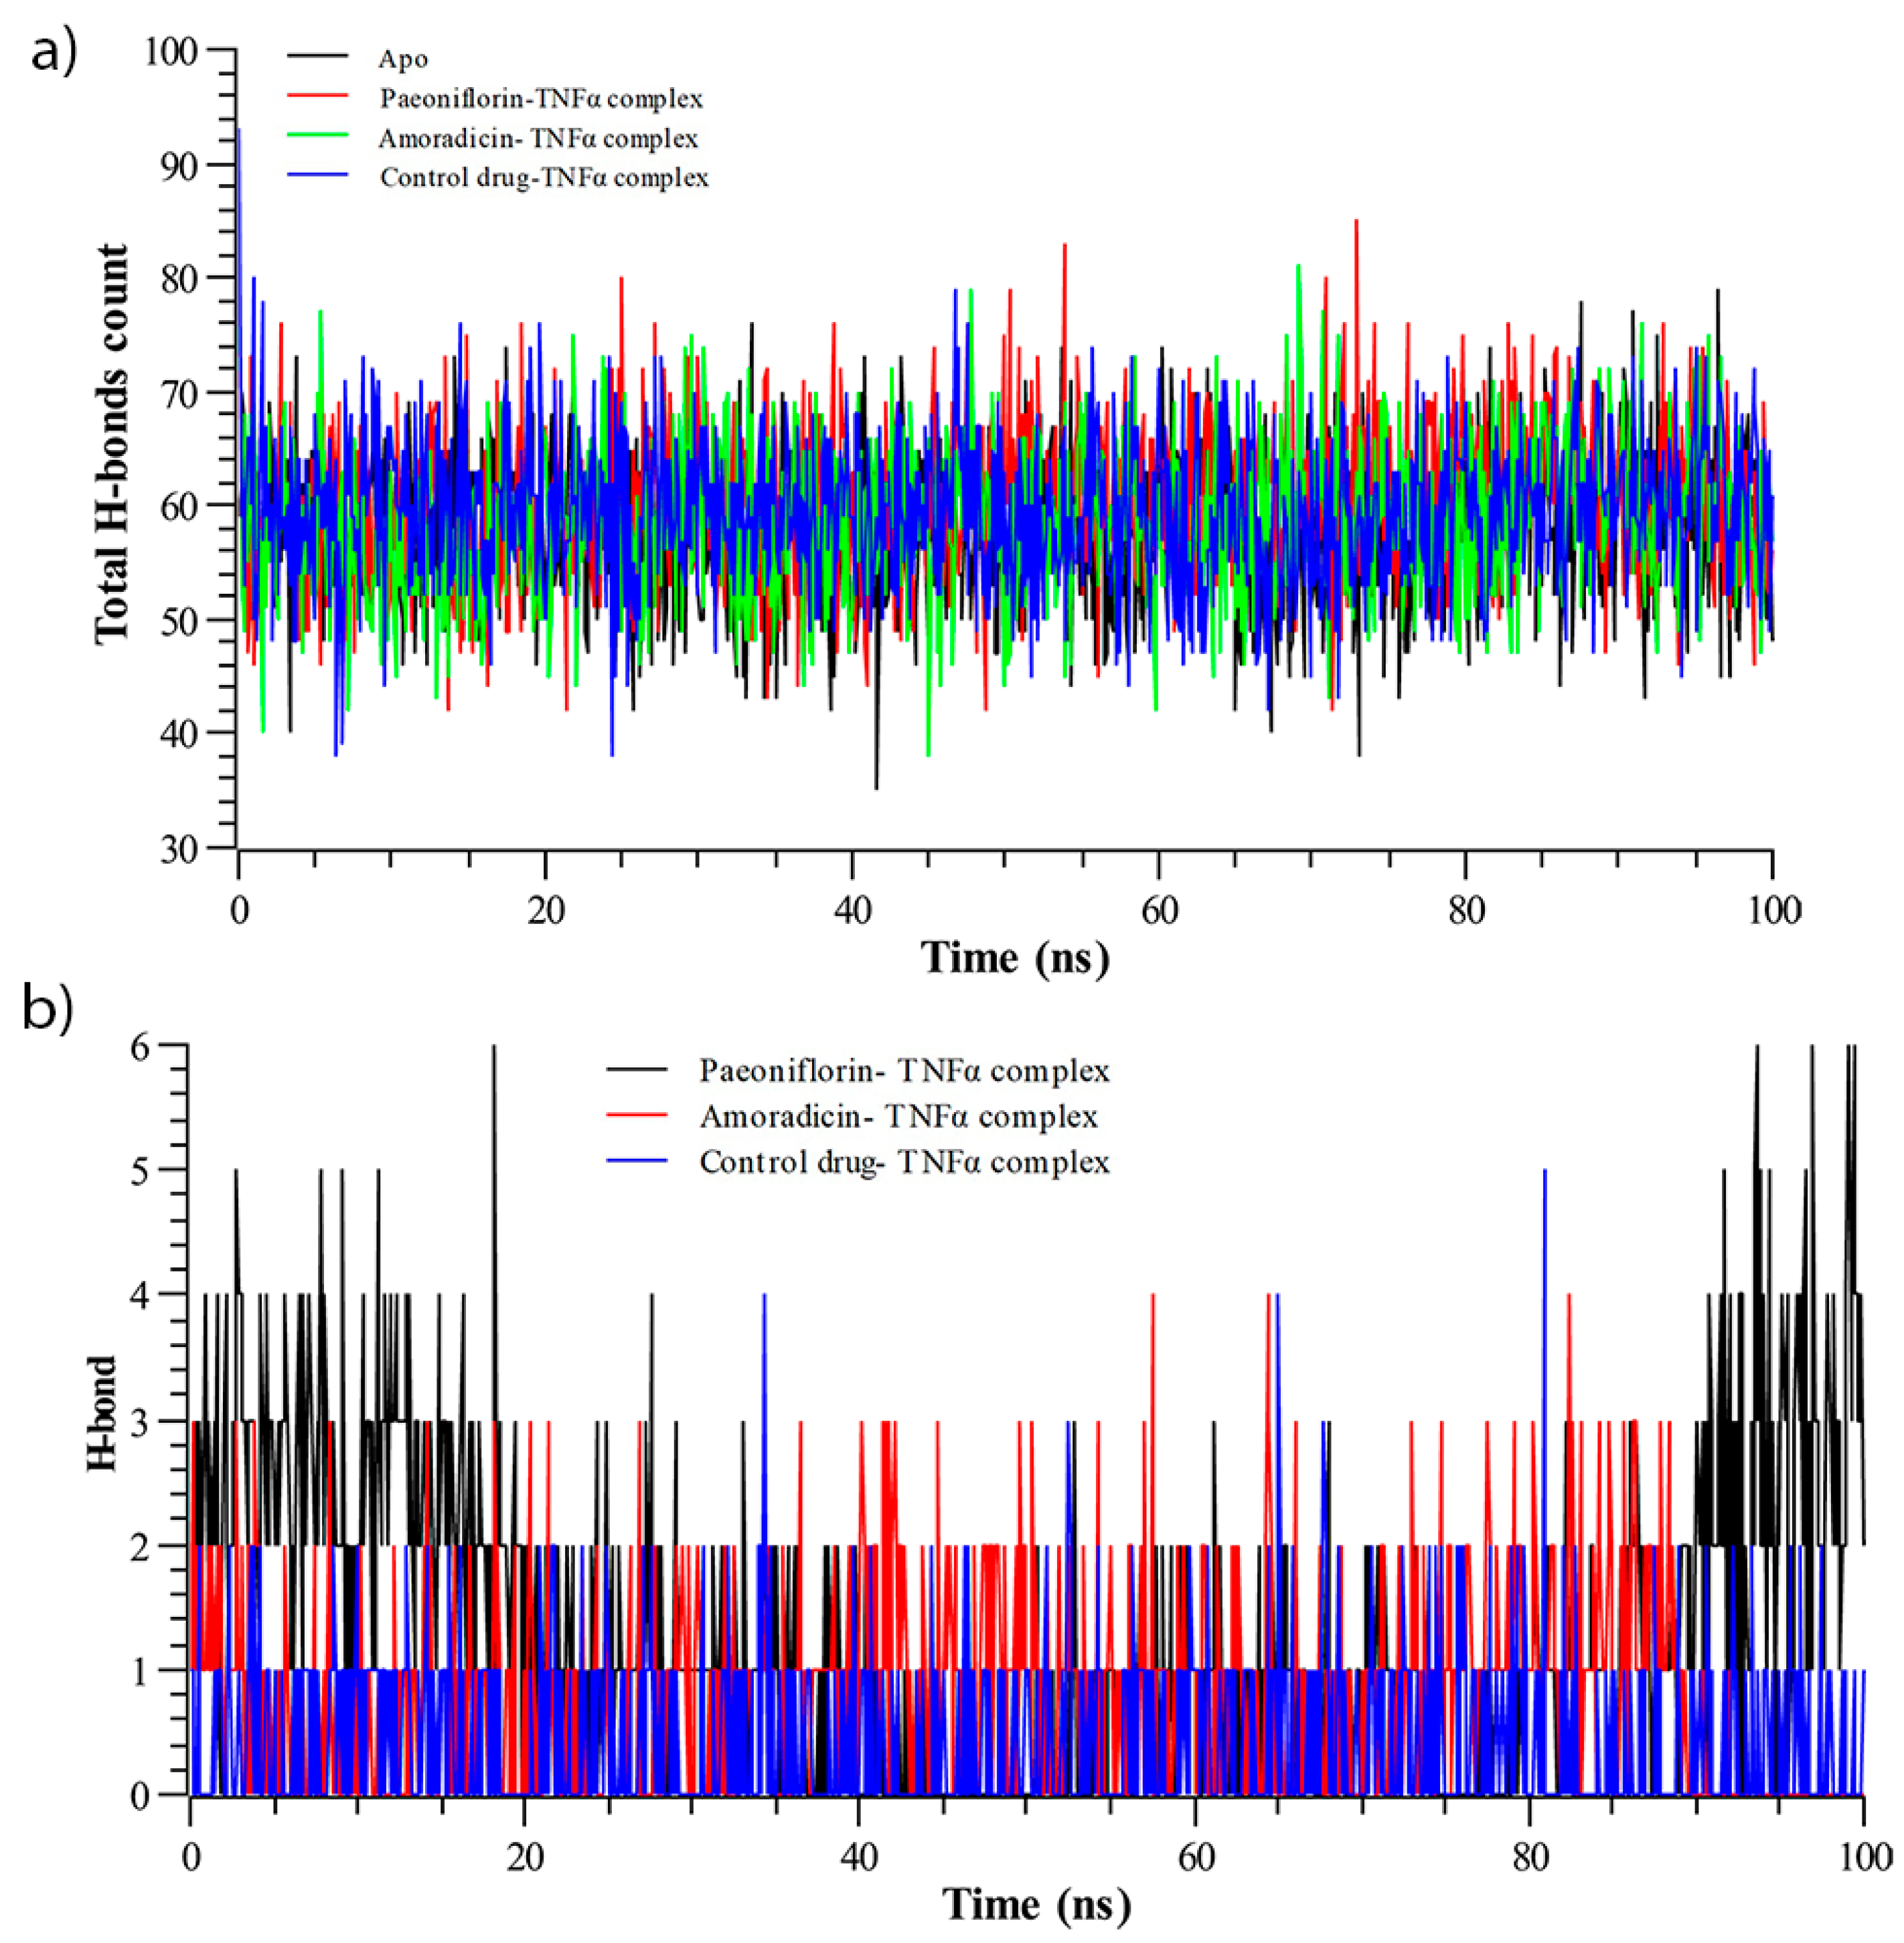
3.2.3. Hydrogen Bond Analysis

The total number of intermolecular and intramolecular hydrogen bonds were counted (Figure 7). As depicted in Figure 7a, it can be seen that the Paeoniflorin-TNFα complex showed the maximum number of intermolecular hydrogen bonds, whereas the lowest total H-bonds count were observed for Apo structure.
However, the proposed compounds and their complex exhibited a higher number of intermolecular hydrogen bonds than control-drug TNFα complex, indicating their higher stability. On the other hand, the intramolecular hydrogen bonds (Figure 7b), which were calculated from simulated trajectories, showed significant differences when comparing among the complexes with the function of time.
The average hydrogen bond count of the control-drug TNFα complex was lowest, whereas the average hydrogen bond count of the Amoradicin-TNFα complex was calculated to be highest. It can also be observed that compound and their respective complexes exhibited a greater number of intramolecular hydrogen bonds compared to the control. Moreover, the intramolecular hydrogen bonds of the Paeoniflorin-TNFα complex seemed to be higher during 0–20 ns and 90–100 ns. The Amoradicin-TNFα complex showed no intramolecular hydrogen bonds after 91 ns.

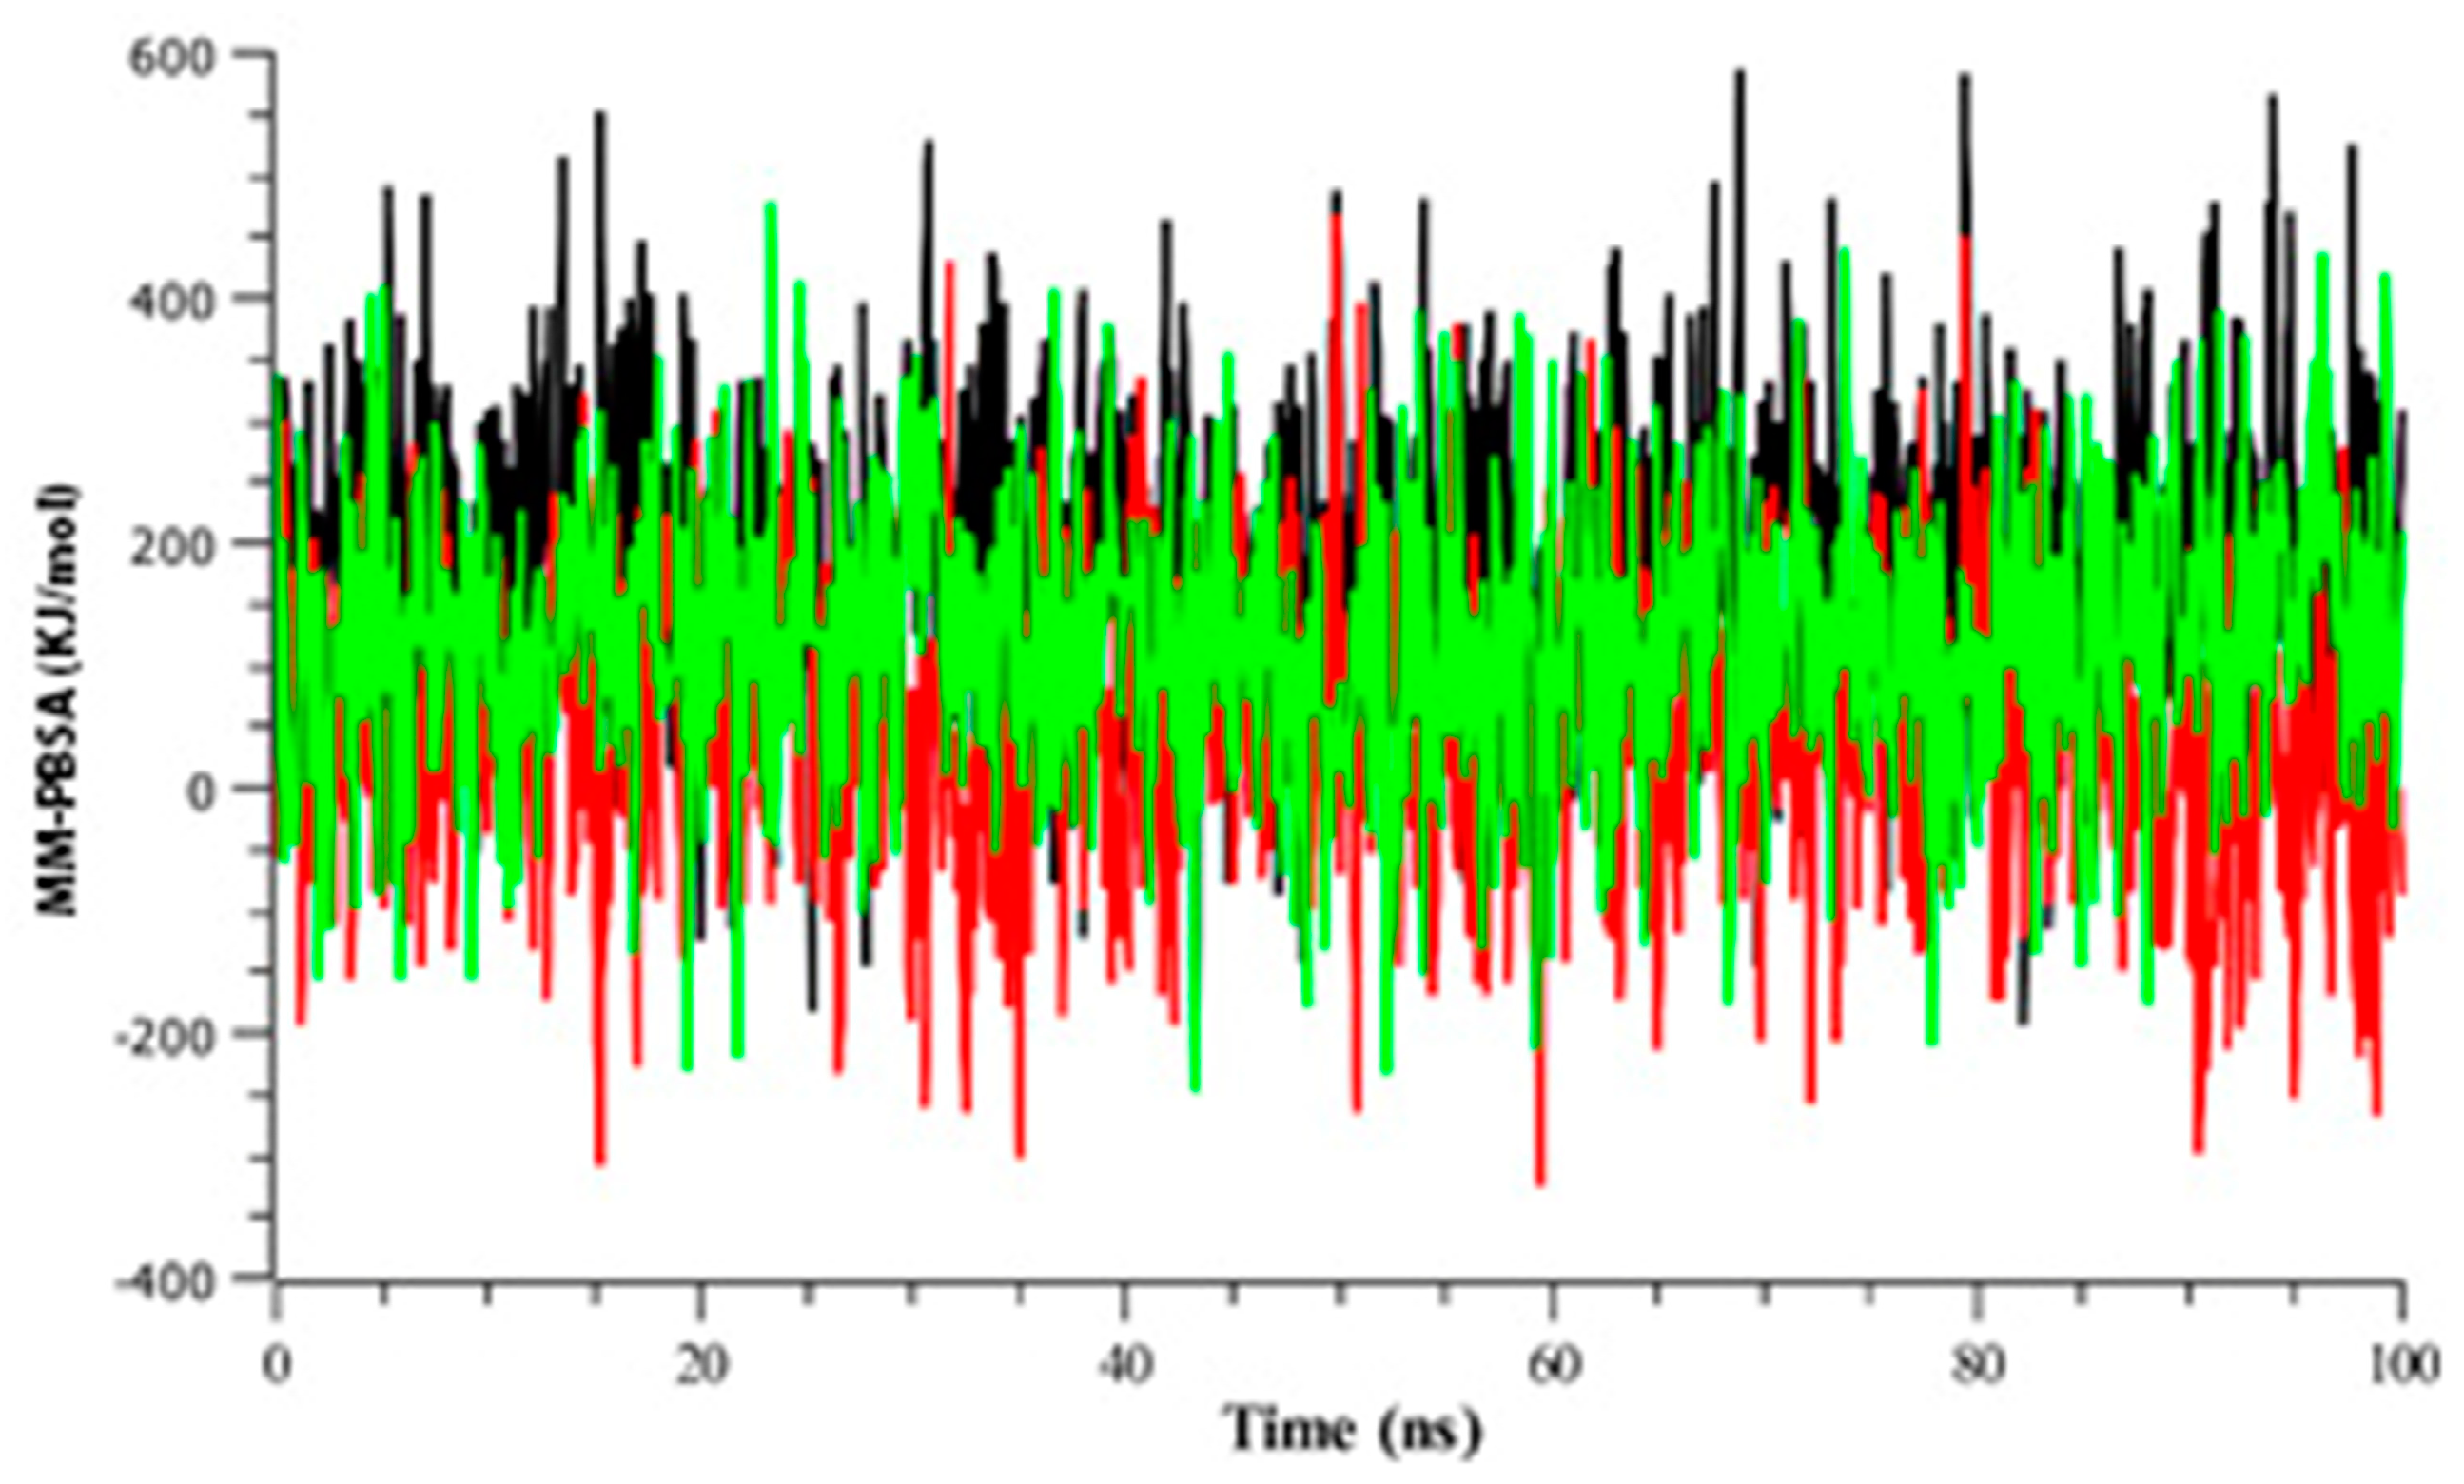
3.2.4. Binding Free Energy Analysis

The binding free energy analysis (Figure 8) revealed that the control drug exhibited the highest energy compared to others for each of its snapshots during the simulation. However, strong binding energy was also observed for Amoradicin. Besides this, poor binding energy was observed for paeoniflorin. The compound paeoniflorin seemed to show downward fluctuations for most of the time.

4. Discussion

The root bark of the Mountain cortex or Paeonia suffruticosa Andrews has been used widely as traditional Chinese medicine. Antioxidant, sedative, and pharmacological activities of the bark extract of Paeonia suffruticosa Andrews were explored along with the anti-inflammatory activity. Different concentrations (6.1 to 200 mM) were assessed in a cell model system where untreated synoviocytes and IL-1 treated synoviocytes used as a negative and positive control respectively. Compared to the control groups, paeoniflorin had inhibitory activity against TNF-α [54].
TNF-alpha (pleiotropic cytokine) has numerous activities in a biological system like cytotoxicity and inflammation processes [55]. On the other hand, Amoradicin, which is a prenylfavanone type of flavonoid extracted from Amorpha fruticose, showed inhibitory activity against TNF-α in lipopolysaccharide (LPS)-stimulated RAW264.7 cells. It was suggested that the bond between C2 and C3 and a ketone group at 4 position might be required for inhibition activity. Genistein and Amoradicin had a similar kind of activity which suggests that C2 and C3 may not have a principal effect on inhibitory activity due to antioxidant effect or non-enzymatic reaction.
Literature also suggests that Amoradicin activity was six times higher than Silybin due to the presence of phenyl ring [56,57,58]. Although the selected compounds showed inhibitory activity against TNF-α, their binding modes and interaction patterns are not yet revealed. Therefore, we employed a molecular docking approach to explore potential interaction sites, which are most likely to be responsible for causing inhibitory activity of TNF-α.
The active form of TNF-α is a homotrimer where the monomer consists of an anti-parallel beta-sheet [59,60]. However, the success rate of ligand design is very low due to uncharacterized inhibition [61,62]. To inhibit TNF-α, two possible mechanisms can explain TNF-α dimer formation: (1) predissociation dependent mode, (2) predissociation independent mode. Research suggests that in order to inactivate TNF-α trimer, the complex may form an intermediate form that can undergo subunit dissociation. Herein, we have targeted TNF-α dimer to prevent its trimeric association, thereby inhibiting its function [63,64,65,66].
The dimethyl chromone moieties and trifluoromethyl phenyl indole binds with TNF-α dimer and creates 16 contacts including Leu120, Ser60, Gly121, Tyr59, and Leu57 [67]. In our study, Paeoniflorin interacts with TNF-α by establishing hydrophobic interactions at Leu57 of A chain, Tyr 59 of A, B chains, and Tyr 119 of A, B chains. This compound also formed strong hydrogen bonding interactions at Ser60 of A chain, Leu120 of A, B chains, and Tyr 151 of A chain of TNF-α.
On the other hand, Amoradicin formed hydrogen bonding interactions at several positions; Ile 58 of A chain, Ser 60 of A, B chains, Tyr 119 of A chain, Leu 120 of B chain, and Gly 122 of A chain, which align with the literature study where TNF-α inhibition was initiated by trifluoromethyl phenyl indole and dimethyl chromene moieties. However, Amoradicin seemed to form several strong hydrophobic interactions at Leu 57 of A chain, Tyr 59 of B chain, Tyr 119 of A, B chains, and Val 123 of B chain. Moreover, Tyr 59 of B chain and Tyr 119 of A chain formed π-Stacking interactions with Amoradicin. The modes of binding of Amoradicin are mostly the same as an aggregating small molecule inhibitor of TNF-α [68]. So, Amoradicin may employ similar mechanisms of inhibition.
However, most of the interacted residues by paeoniflorin and amoradicin were found to reside in Tumor necrosis factor receptor 1 (TNFR1) binding site of the TNFα; thereby, these compounds could possibly inhibit TNF/TNFR1 signaling pathways as well as deactivating downstream signaling and inflammations [69,70,71,72].
Besides this, we have also predicted both physiochemical and pharmacologically relevant descriptors. The selected compounds showed positive results towards the properties including octanol/water partition coefficient (QPlogPo/w), SASA [73], QPlogS (aqueous solubility), molecular weight, H bond acceptor/donor [74], and Lipinski’s rules of five [75].
All of the selected compounds also showed positive results towards total clearance, renal OCT2 substrate, hepatotoxicity, AMES toxicity, bioavailability (Martin, 2005), and percent of human oral and intestinal absorption [33,76]. Paeoniflorin and Amoradicin showed no hERG inhibition, whereas the control drug showed hERG inhibition. So, the control drug has inhibitory activity towards the human ether-a-go-go related gene and may cause Long QT syndrome [77]. The selected compounds showed no AMES toxicity, whilst the control drug showed AMES toxicity, which may act as potential chemical mutagen [78].
However, the Paeoniflorin were found to be poorly distributed to the brain and unable to penetrate CNS (molecules with BB < −1 are poorly distributed, and molecules with logPS < −3 are considered as unable to penetrate CNS) [33], whereas Amoradicin was predicted to be able to penetrate CNS and poorly permeable to the blood-brain barrier.
Furthermore, Paeoniflorin showed positive properties towards CYP substrates and possible metabolism through the CYP family [79,80], whilst Amoradicin was found to have inhibitory activity on CYP2C9 and CYP3A4. The Amoradicin also showed interaction on the CYP3A4 substrate. Contrarily, the control drug was predicted to be metabolized only through CYP2C9. This drug also showed to have substrate interaction with CYP2D6 and CYP3A4. So, compared to known control drugs, Paeoniflorin may have a higher probability to be metabolized through CYP2C9, whereas Amoradicin may have a higher probability to have CYP3A4 substrate-based interaction. However, all these findings indicate that the compounds identified showing ideal behavior of 95% of known drug molecules.
Figure 1 illustrates the different types of interactions. The IFD score for Paeoniflorin was found to be best, which was calculated to be −554.98 Kcal/mol, which could be explained by the formation of relatively strong hydrogen and hydrophobic bonds than any of the other respective complexes (Supplementary File 2). Paeoniflorin formed four hydrogen bonds, which were present in Ser60, Leu120, and Tyr151, and multiple hydrophobic interactions were seen at Leu57, Tyr 59, and Tyr 119 positions. The IFD score of the Amoradicin compound was found to be lower than Paeoniflorin, which was estimated to be −546.31 Kcal/mol. The Amoradicin made hydrogen bonding interactions with Ile 58, Ser60, Tyr119, Leu120, and Gly122 residues. This complex also formed several hydrophobic interactions at Leu57, Tyr59, Tyr119, Val123 positions, and two π stacking with Tyr 59 and Tyr 119.
The apo protein and protein-ligand complexes were simulated to gain deeper insight into how binding of a ligand changes the structure of TNF-α. The molecular dynamics simulation analysis (Figure 2) showed that the behavior of Amoradicin-TNFα is almost the same as control drug-TNFα. Thus, binding of Amoradicin with TNFα reduces its Rg and SASA, which indicates the highest rigidity [81], tightest packing [82,83], and reduced protein expansion during the simulation [84,85], while compared to other respective protein-ligand complexes and Apo structure. Besides this, the binding of Paeoniflorin also seemed to stabilize its complex. Upon binding of Paeoniflorin with TNFα, it also reduces Rg but increases SASA, indicating that Amoradicin-TNFα had undergone the tightest packing and formed rigid conformation during the simulation but was also expanding the protein structure. However, binding of Paeoniflorin with TNFα didn’t show the most similar behavior as control drug-protein complex in respect to RMSD, Rg, and SASA.
In order to gather more insight into the residual flexibility, movement, and conformational analysis, we performed RMSF, DCCM, and PCA analysis (Figure 2, Figure 3 and Figure 4). By performing these analyses, we found that Paeoniflorin-TNFα complex induces major residual flexibility, residual movement, and conformational variations, which is most likely to be accounted for preventing the trimeric association of TNFα, and thereby inhibiting its function. However, we included control drug-TNFα complex into these analyses for better comprehension of the results. The control drug-TNFα complex showed negatively correlated motions, whilst compared to the Apo (control) one. Interestingly, the most negative correlation was observed for Paeoniflorin-TNFα complex, especially within the loop, as being the most favored to be exhibited by the control drug and its complex.

5. Conclusions

Plant derived small molecules, such as our two natural lead compounds, paeoniflorin and amoradicin, is a testament that natural compounds have the efficacy to potentially produce strong therapeutic effects against inflammation-mediated diseases and carcinogenesis. Not only is it widely available and relatively affordable to manufacture and distribute even in poor developing countries, but its greatest significance is that it would also minimize the need for developing countries to import expensive commercial alternatives that may potentially be less effective with more side effects, compared to natural compounds that are generally well-tolerated, safe, and non-toxic (i.e., fewer side effects). Our study attempts to rationalize the interaction insight, binding mechanisms, and dynamic behavior of two natural compounds as potential inhibitors of TNF-α. The goal of this research is to suggest a way for the possible utilization of experimental compounds. The two compounds which have promising potential have been studied in-depth by utilizing advanced computational processing and cutting-edge algorithms, specifically their target binding site residues, the binding mechanisms, and the conformational analysis of the bound complexes. Furthermore, the MD simulation was utilized for both apo and bound structures to understand the complexity of TNF-α protein. Not only will this streamline the research and development (R&D) pipeline, but it will also provide invaluable insights and information for fellow scientists and researchers to develop potential drugs, especially in developing countries where they may not have access to such advanced computational power. This will help improve the confidence of our fellow scientists to invest in further research and experimentation to develop the potential drug compounds. We hope that this would prove to be invaluable research for therapeutics against cancers and inflammation-mediated diseases, especially in developing countries.

Supplementary Materials

The following are available online at www.mdpi.com/xxx/s1, Supplementary File 1: List of chemical compounds retrieved from different literatures. Supplementary File 2: Table S1: Results of Hydrophobic interactions of Paeoniflorin with the active site residues of TNF-α. Table S2: Hydrogen bonding interactions of Paeoniflorin with the active site residues of TNF-α. Table S3: Hydrophobic interactions patterns of Amoradicin with the active site residues of TNF-α. Table S4: Hydrogen bonding interactions of Amoradicin with the active site residues of TNF-α. Table S5: π-Stacking interactions of Amoradicin with the active site residues of TNF-α.

Author Contributions

M.R.P. and S.M. have conceived idea and written manuscript. M.A.R.U., M.A., N.R.J., M.I.A.C., S.I. have reviewed literatures and retrieved compounds. M.A.R.U., S.M., K.M.S. and F.A.T. have performed simulation and generated trajectory reports. M.R.P. has analyzed and interpreted trajectory data. M.J.I. has helped to comparative writing. Y.M.R. has contributed in introduction writing and language editing. S.M. and N.A. have revised manuscript. All authors have read and agreed to the published version of the manuscript.

Funding

The authors received no funding from an external source.

Institutional Review Board Statement

Not applicable.

Informed Consent Statement

Not applicable.

Data Availability Statement

The data presented in this study are available in Supplementary Material.

Acknowledgments

We would like to express our deepest gratitude and thanks to Allah, our parents, families, teachers and all those who’ve helped and supported us along the way.

Conflicts of Interest

The authors declare that they have no conflicts of interest.

References

  1. Feldman, A.M.; Combes, A.; Wagner, D.; Kadakomi, T.; Kubota, T.; Li, Y.Y.; McTiernan, C. The role of tumor necrosis factor in the pathophysiology of heart failure. J. Am. Coll. Cardiol. 2000, 35, 537–544. [Google Scholar] [CrossRef]
  2. Sethi, G.; Sung, B.; Aggarwal, B.B. TNF: A master switch for inflammation to cancer. Front. Biosci. 2008, 13, 5094–5107. [Google Scholar] [CrossRef] [PubMed]
  3. Clowes, J.A.; Riggs, B.L.; Khosla, S. The role of the immune system in the pathophysiology of osteoporosis. Immunol. Rev. 2005, 208, 207–227. [Google Scholar] [CrossRef]
  4. Lin, A.; Dibling, B. The true face of JNK activation in apoptosis. Aging Cell 2002, 1, 112–116. [Google Scholar] [CrossRef] [PubMed]
  5. Wajant, H.; Pfizenmaier, K.; Scheurich, P. Tumor necrosis factor signaling. Cell Death Differ. 2003, 10, 45–65. [Google Scholar] [CrossRef] [PubMed]
  6. Kamata, H.; Honda, S.-I.; Maeda, S.; Chang, L.; Hirata, H.; Karin, M. Reactive oxygen species promote TNFalpha-induced death and sustained JNK activation by inhibiting MAP kinase phosphatases. Cell 2005, 120, 649–661. [Google Scholar] [CrossRef]
  7. Bradley, J.R. TNF-mediated inflammatory disease. J. Pathol. 2008, 214, 149–160. [Google Scholar] [CrossRef]
  8. Michalaki, V.; Syrigos, K.; Charles, P.; Waxman, J. Serum levels of IL-6 and TNF-alpha correlate with clinicopathological features and patient survival in patients with prostate cancer. Br. J. Cancer 2004, 90, 2312–2316. [Google Scholar] [CrossRef]
  9. Ferrajoli, A.; Keating, M.J.; Manshouri, T.; Giles, F.J.; Dey, A.; Estrov, Z.; Koller, C.A.; Kurzrock, R.; Thomas, D.A.; Faderl, S.; et al. The clinical significance of tumor necrosis factor-alpha plasma level in patients having chronic lymphocytic leukemia. Blood. 2002, 100, 1215–1219. [Google Scholar] [CrossRef]
  10. Berberoglu, U.; Yildirim, E.; Celen, O. Serum levels of tumor necrosis factor alpha correlate with response to neoadjuvant chemotherapy in locally advanced breast cancer. Int. J. Biol. Markers 2004, 19, 130–134. [Google Scholar] [CrossRef]
  11. Taylor, P.C. Anti-tumor necrosis factor therapies. Curr. Opin. Rheumatol. 2001, 13, 164–169. [Google Scholar] [CrossRef] [PubMed]
  12. Kroot, E.J.; Van Leeuwen, M.A.; Van Rijswijk, M.H.; Prevoo, M.L.; Van’t Hof, M.A.; Van de Putte, L.B.; Van Riel, P.L. No increased mortality in patients with rheumatoid arthritis: Up to 10 years of follow up from disease onset. Ann. Rheum. Dis. 2000, 59, 954–958. [Google Scholar] [CrossRef] [PubMed]
  13. Baecklund, E.; Sundstrom, C.; Ekbom, A.; Catrina, A.I.; Biberfeld, P.; Feltelius, N.; Klareskog, L. Lymphoma subtypes in patients with rheumatoid arthritis: Increased proportion of diffuse large B cell lymphoma. Arthritis Rheum. 2003, 48, 1543–1550. [Google Scholar] [CrossRef] [PubMed]
  14. Ekström, K.; Hjalgrim, H.; Brandt, L.; Baecklund, E.; Klareskog, L.; Ekbom, A.; Askling, J. Risk of malignant lymphomas in patients with rheumatoid arthritis and in their first-degree relatives. Arthritis Rheum. Off. J. Am. Coll. Rheumatol. 2003, 48, 963–970. [Google Scholar] [CrossRef] [PubMed]
  15. Palladino, M.A.; Bahjat, F.R.; Theodorakis, E.A.; Moldawer, L.L. Anti-TNF-alpha therapies: The next generation. Nat. Rev. Drug Discov. 2003, 2, 736–746. [Google Scholar] [CrossRef]
  16. Bongartz, T.; Sutton, A.J.; Sweeting, M.J.; Buchan, I.; Matteson, E.L.; Montori, V. Anti-TNF antibody therapy in rheumatoid arthritis and the risk of serious infections and malignancies: Systematic review and meta-analysis of rare harmful effects in randomized controlled trials. JAMA 2006, 295, 2275–2285. [Google Scholar] [CrossRef]
  17. Guo, Z. The modification of natural products for medical use. Acta Pharm. Sin. B 2017, 7, 119–136. [Google Scholar] [CrossRef]
  18. Aung, T.N.; Qu, Z.; Kortschak, R.D.; Adelson, D.L. Understanding the effectiveness of natural compound mixtures in cancer through their molecular mode of action. Int. J. Mol. Sci. 2017, 18, 656. [Google Scholar] [CrossRef]
  19. Kim, S.; Thiessen, P.A.; Bolton, E.E.; Chen, J.; Fu, G.; Gindulyte, A.; Han, L.; He, J.; He, S.; Shoemaker, B.A.; et al. PubChem Substance and Compound databases. Nucleic Acids Res. 2016, 44, D1202–D1213. [Google Scholar] [CrossRef]
  20. Shelley, J.C.; Cholleti, A.; Frye, L.L.; Greenwood, J.R.; Timlin, M.R.; Uchimaya, M. Epik: A software program for pKaprediction and protonation state generation for drug-like molecules. J. Comput.-Aided Mol. Des. 2007, 21, 681–691. [Google Scholar] [CrossRef]
  21. Berman, H.M.; Bourne, P.E.; Westbrook, J.; Zardecki, C. The protein data bank. Nucleic Acids Res. 2000, 28, 235–242. [Google Scholar] [CrossRef] [PubMed]
  22. Sastry, G.M.; Adzhigirey, M.; Day, T.; Annabhimoju, R.; Sherman, W. Protein and ligand preparation: Parameters, protocols, and influence on virtual screening enrichments. J. Comput.-Aided Mol. Des. 2013, 27, 221–234. [Google Scholar] [CrossRef] [PubMed]
  23. Harder, E.; Damm, W.; Maple, J.; Wu, C.; Reboul, M.; Xiang, J.Y.; Wang, L.; Lupyan, D.; Dahlgren, M.K.; Knight, J.L. OPLS3: A force field providing broad coverage of drug-like small molecules and proteins. J. Chem. Theory Comput. 2015, 12, 281–296. [Google Scholar] [CrossRef] [PubMed]
  24. Roos, K.; Wu, C.; Damm, W.; Reboul, M.; Stevenson, J.M.; Lu, C.; Dahlgren, M.K.; Mondal, S.; Chen, W.; Wang, L.; et al. OPLS3e: Extending Force Field Coverage for Drug-Like Small Molecules. J. Chem. Theory Comput. 2019, 15, 1863–1874. [Google Scholar] [CrossRef]
  25. Friesner, R.A.; Banks, J.L.; Murphy, R.B.; Halgren, T.A.; Klicic, J.J.; Mainz, D.T.; Repasky, M.P.; Knoll, E.H.; Shelley, M.; Perry, J.K.; et al. Glide: A new approach for rapid, accurate docking and scoring. 1. Method and assessment of docking accuracy. J. Med. Chem. 2004, 47, 1739–1749. [Google Scholar] [CrossRef]
  26. Friesner, R.A.; Murphy, R.B.; Repasky, M.P.; Frye, L.L.; Greenwood, J.R.; Halgren, T.A.; Sanschagrin, P.C.; Mainz, D.T. Extra Precision Glide:  Docking and Scoring Incorporating a Model of Hydrophobic Enclosure for Protein−Ligand Complexes. J. Med. Chem. 2006, 49, 6177–6196. [Google Scholar] [CrossRef]
  27. Li, J.; Abel, R.; Zhu, K.; Cao, Y.; Zhao, S.; Friesner, R.A. The VSGB 2.0 model: A next generation energy model for high resolution protein structure modeling. Proteins Struct. Funct. Bioinform. 2011, 79, 2794–2812. [Google Scholar] [CrossRef]
  28. Riza, Y.M.; Parves, M.R.; Tithi, F.A.; Alam, S. Quantum chemical calculation and binding modes of H1R; a combined study of molecular docking and DFT for suggesting therapeutically potent H1R antagonist. Silico Pharmacol. 2019, 7, 1. [Google Scholar] [CrossRef]
  29. Ignjatović, M.M.; Caldararu, O.; Dong, G.; Muñoz-Gutierrez, C.; Adasme-Carreño, F.; Ryde, U. Binding-affinity predictions of HSP90 in the D3R Grand Challenge 2015 with docking, MM/GBSA, QM/MM, and free-energy simulations. J. Comput.-Aided Mol. Des. 2016, 30, 707–730. [Google Scholar] [CrossRef]
  30. Vijayakumar, B.; Umamaheswari, A.; Puratchikody, A.; Velmurugan, D. Selection of an improved HDAC8 inhibitor through structure-based drug design. Bioinformation 2011, 7, 134–141. [Google Scholar] [CrossRef]
  31. Jacobson, M.P.; Friesner, R.A.; Xiang, Z.; Honig, B. On the role of the crystal environment in determining protein side-chain conformations. J. Mol. Biol. 2002, 320, 597–608. [Google Scholar] [CrossRef]
  32. Sherman, W.; Day, T.; Jacobson, M.P.; Friesner, R.A.; Farid, R. Novel Procedure for Modeling Ligand/Receptor Induced Fit Effects. J. Med. Chem. 2006, 49, 534–553. [Google Scholar] [CrossRef] [PubMed]
  33. Pires, D.E.V.; Blundell, T.L.; Ascher, D.B. pkCSM: Predicting Small-Molecule Pharmacokinetic and Toxicity Properties Using Graph-Based Signatures. J. Med. Chem. 2015, 58, 4066–4072. [Google Scholar] [CrossRef]
  34. Cheng, F.; Li, W.; Zhou, Y.; Shen, J.; Wu, Z.; Liu, G.; Lee, P.W.; Tang, Y. AdmetSAR: A comprehensive source and free tool for assessment of chemical ADMET properties. J. Chem. Inf. Model. 2012, 52, 3099–3105. [Google Scholar] [CrossRef] [PubMed]
  35. Krieger, E.; Darden, T.; Nabuurs, S.B.; Finkelstein, A.; Vriend, G. Making optimal use of empirical energy functions: Force-field parameterization in crystal space. Proteins Struct. Funct. Bioinform. 2004, 57, 678–683. [Google Scholar] [CrossRef]
  36. Case, D.A.; Cheatham, T.E., 3; Darden, T.; Gohlke, H.; Luo, R.; Merz, K.M.J.; Onufriev, A.; Simmerling, C.; Wang, B.; Woods, R.J. The Amber biomolecular simulation programs. J. Comput. Chem. 2005, 26, 1668–1688. [Google Scholar] [CrossRef]
  37. Krieger, E.; Nielsen, J.E.; Spronk, C.A.E.M.; Vriend, G. Fast empirical pKa prediction by Ewald summation. J. Mol. Graph. Model. 2006, 25, 481–486. [Google Scholar] [CrossRef]
  38. Krieger, E.; Vriend, G. New ways to boost molecular dynamics simulations. J. Comput. Chem. 2015, 36, 996–1007. [Google Scholar] [CrossRef]
  39. Grant, B.J.; Rodrigues, A.P.C.; ElSawy, K.M.; McCammon, J.A.; Caves, L.S.D. Bio3D: An R package for the comparative analysis of protein structures. Bioinformatics 2006, 22, 2695–2696. [Google Scholar] [CrossRef]
  40. Ichiye, T.; Karplus, M. Collective motions in proteins: A covariance analysis of atomic fluctuations in molecular dynamics and normal mode simulations. Proteins Struct. Funct. Bioinform. 1991, 11, 205–217. [Google Scholar] [CrossRef]
  41. Shlens, J. A tutorial on principal component analysis. arXiv 2014, arXiv:1404.1100. [Google Scholar]
  42. Salmas, R.E.; Yurtsever, M.; Durdagi, S. Investigation of Inhibition Mechanism of Chemokine Receptor CCR5 by Micro-second Molecular Dynamics Simulations. Sci. Rep. 2015, 5, 13180. [Google Scholar] [CrossRef] [PubMed]
  43. Humphrey, W.; Dalke, A.; Schulten, K. VMD: Visual molecular dynamics. J. Mol. Graph. 1996, 14, 33–38. [Google Scholar] [CrossRef]
  44. Schrodinger LLC. The PyMOL Molecular Graphics System, Version 2.2.3. 2019. Available online: https://pymol.org/2/ (accessed on 1 July 2019).
  45. Yan, F.; Liu, X.; Zhang, S.; Su, J.; Zhang, Q.; Chen, J. Electrostatic interaction-mediated conformational changes of adipocyte fatty acid binding protein probed by molecular dynamics simulation. J. Biomol. Struct. Dyn. 2018, 37, 3583–3595. [Google Scholar] [CrossRef] [PubMed]
  46. Shukla, R.; Singh, T.R. Virtual screening, pharmacokinetics, molecular dynamics and binding free energy analysis for small natural molecules against cyclin-dependent kinase 5 for Alzheimer’s disease. J. Biomol. Struct. Dyn. 2019, 38, 248–262. [Google Scholar] [CrossRef] [PubMed]
  47. García, A.E. Large-amplitude nonlinear motions in proteins. Phys. Rev. Lett. 1992, 68, 2696–2699. [Google Scholar] [CrossRef]
  48. Kitao, A.; Go, N. Investigating protein dynamics in collective coordinate space. Curr. Opin. Struct. Biol. 1999, 9, 164–169. [Google Scholar] [CrossRef]
  49. Kitao, A.; Hirata, F.; Gō, N. The effects of solvent on the conformation and the collective motions of protein: Normal mode analysis and molecular dynamics simulations of melittin in water and in vacuum. Chem. Phys. 1991, 158, 447–472. [Google Scholar] [CrossRef]
  50. Maisuradze, G.G.; Liwo, A.; Scheraga, H.A. Principal component analysis for protein folding dynamics. J. Mol. Biol. 2009, 385, 312–329. [Google Scholar] [CrossRef]
  51. Maisuradze, G.G.; Liwo, A.; Scheraga, H.A. Relation between free energy landscapes of proteins and dynamics. J. Chem. Theory Comput. 2010, 6, 583–595. [Google Scholar] [CrossRef]
  52. Grottesi, A.; Domene, C.; Hall, B.; Sansom, M.S.P. Conformational Dynamics of M2 Helices in KirBac Channels:  Helix Flexibility in Relation to Gating via Molecular Dynamics Simulations. Biochemistry 2005, 44, 14586–14594. [Google Scholar] [CrossRef] [PubMed]
  53. Spellmon, N.; Sun, X.; Sirinupong, N.; Edwards, B.; Li, C.; Yang, Z. Molecular Dynamics Simulation Reveals Correlated Inter-Lobe Motion in Protein Lysine Methyltransferase SMYD2. PLoS ONE 2016, 10, e0145758. [Google Scholar] [CrossRef] [PubMed]
  54. Wu, M.; Gu, Z. Screening of bioactive compounds from moutan cortex and their anti-inflammatory activities in rat synoviocytes. Evid.-Based. Complement. Altern. Med. 2009, 6, 57–63. [Google Scholar] [CrossRef] [PubMed]
  55. van Ostade, X.; Vandenabeele, P.; Tavernier, J.; Fiers, W. Human tumor necrosis factor mutants with preferential binding to and activity on either the R55 or R75 receptor. Eur. J. Biochem. 1994, 220, 771–779. [Google Scholar] [CrossRef]
  56. Agullo, G.; Gamet-Payrastre, L.; Manenti, S.; Viala, C.; Rémésy, C.; Chap, H.; Payrastre, B. Relationship between flavonoid structure and inhibition of phosphatidylinositol 3-kinase: A comparison with tyrosine kinase and protein kinase C inhibition. Biochem. Pharmacol. 1997, 53, 1649–1657. [Google Scholar] [CrossRef]
  57. Cho, J.Y.; Kim, P.S.; Park, J.; Yoo, E.S.; Baik, K.U.; Kim, Y.-K.; Park, M.H. Inhibitor of tumor necrosis factor-α production in lipopolysaccharide-stimulated RAW264.7 cells from Amorpha fruticosa. J. Ethnopharmacol. 2000, 70, 127–133. [Google Scholar] [CrossRef]
  58. Kuppusamy, U.R.; Khoo, H.E.; Das, N.P. Structure-activity studies of flavonoids as inhibitors of hyaluronidase. Biochem. Pharmacol. 1990, 40, 397–401. [Google Scholar] [CrossRef]
  59. Beutler, B.; Cerami, A. Tumor necrosis, cachexia, shock, and inflammation: A common mediator. Annu. Rev. Biochem. 1988, 57, 505–518. [Google Scholar] [CrossRef]
  60. Eck, M.J.; Sprang, S.R. The structure of tumor necrosis factor-alpha at 2.6 A resolution. Implications for receptor binding. J. Biol. Chem. 1989, 264, 17595–17605. [Google Scholar] [CrossRef]
  61. Jackson, R.W.; Gelinas, R.; Baughman, T.A.; Cox, T.; Howbert, J.J.; Kucera, K.A.; Latham, J.A.; Ramsdell, F.; Singh, D.; Darwish, I.S. Benzobicyclooctanes as novel inhibitors of TNF-alpha signaling. Bioorg. Med. Chem. Lett. 2002, 12, 1093–1097. [Google Scholar] [CrossRef]
  62. Jackson, R.W.; Tabone, J.C.; Howbert, J.J. Identification of TNF-alpha inhibitors from a split-pool library based on a tyrosine-proline peptidomimetic scaffold. Bioorg. Med. Chem. Lett. 2003, 13, 205–208. [Google Scholar] [CrossRef]
  63. Deng, X.; Zhang, X.; Tang, B.; Liu, H.; Shen, Q.; Liu, Y.; Lai, L. Design, Synthesis, and Evaluation of Dihydrobenzo[cd]indole-6-sulfonamide as TNF-α Inhibitors. Front. Chem. 2018, 6, 98. Available online: https://www.frontiersin.org/article/10.3389/fchem.2018.00098 (accessed on 7 September 2019). [CrossRef] [PubMed]
  64. Melagraki, G.; Ntougkos, E.; Papadopoulou, D.; Rinotas, V.; Leonis, G.; Douni, E.; Afantitis, A.; Kollias, G. In Silico Discovery of Plant-Origin Natural Product Inhibitors of Tumor Necrosis Factor (TNF) and Receptor Activator of NF-κB Ligand (RANKL). Front. Pharmacol. 2018, 9, 800. Available online: https://www.frontiersin.org/article/10.3389/fphar.2018.00800 (accessed on 7 September 2019). [CrossRef] [PubMed]
  65. Malik, A.; Arooj, M.; Butt, T.T.; Zahid, S.; Zahid, F.; Jafar, T.H.; Waquar, S.; Gan, S.H.; Ahmad, S.; Mirza, M.U. In silico and in vivo characterization of cabralealactone, solasodin and salvadorin in a rat model: Potential anti-inflammatory agents. Drug Des. Devel. Ther. 2018, 12, 1431–1443. [Google Scholar] [CrossRef] [PubMed]
  66. Maiorov, E.G.; Ozbabacan, S.A.; Keskin, O.; Gursoy, A.; Nussinov, R. Structural Pathways of Cytokines May Illuminate Their Roles in Regulation of Cancer Development and Immunotherapy. Cancers 2014, 6, 663–683. [Google Scholar] [CrossRef] [PubMed]
  67. He, M.M.; Smith, A.S.; Oslob, J.D.; Flanagan, W.M.; Braisted, A.C.; Whitty, A.; Cancilla, M.T.; Wang, J.; Lugovskoy, A.A.; Yoburn, J.C.; et al. Small-Molecule Inhibition of TNF-α. Science 2005, 310, 1022–1025. [Google Scholar] [CrossRef] [PubMed]
  68. Blevitt, J.M.; Hack, M.D.; Herman, K.L.; Jackson, P.F.; Krawczuk, P.J.; Lebsack, A.D.; Liu, A.X.; Mirzadegan, T.; Nelen, M.I.; Patrick, A.N.; et al. Structural Basis of Small-Molecule Aggregate Induced Inhibition of a Protein–Protein Interaction. J. Med. Chem. 2017, 60, 3511–3517. [Google Scholar] [CrossRef]
  69. Saddala, M.S.; Huang, H. Identification of novel inhibitors for TNFα, TNFR1 and TNFα-TNFR1 complex using pharmacophore-based approaches. J. Transl. Med. 2019, 17, 215. [Google Scholar] [CrossRef]
  70. Chen, S.; Feng, Z.; Wang, Y.; Ma, S.; Hu, Z.; Yang, P.; Chai, Y.; Xie, X. Discovery of Novel Ligands for TNF-alpha and TNF Receptor-1 through Structure-Based Virtual Screening and Biological Assay. J. Chem. Inf. Model. 2017, 57, 1101–1111. [Google Scholar] [CrossRef]
  71. Geng, L.; Li, X.; Feng, X.; Zhang, J.; Wang, D.; Chen, J.; Liu, R.; Chen, H.; Sun, L. Association of TNF-α with Impaired Migration Capacity of Mesenchymal Stem Cells in Patients with Systemic Lupus Erythematosus. J. Immunol. Res. 2014, 2014, 169082. [Google Scholar] [CrossRef]
  72. Cao, Y.; Li, Y.-H.; Lv, D.-Y.; Chen, X.-F.; Chen, L.-D.; Zhu, Z.-Y.; Chai, Y.-F.; Zhang, J.-P. Identification of a ligand for tumor necrosis factor receptor from Chinese herbs by combination of surface plasmon resonance biosensor and UPLC-MS. Anal. Bioanal. Chem. 2016, 408, 5359–5367. [Google Scholar] [CrossRef] [PubMed]
  73. Jorgensen, W.L.; Duffy, E.M. Prediction of drug solubility from structure. Adv. Drug Deliv. Rev. 2002, 54, 355–366. [Google Scholar] [CrossRef]
  74. Cavalli, A.; Poluzzi, E.; de Ponti, F.; Recanatini, M. Toward a pharmacophore for drugs inducing the long QT syndrome: Insights from a CoMFA study of HERG K(+) channel blockers. J. Med. Chem. 2002, 45, 3844–3853. [Google Scholar] [CrossRef]
  75. Lipinski, C.A. Lead- and drug-like compounds: The rule-of-five revolution. Drug Discov. Today. Technol. 2004, 1, 337–341. [Google Scholar] [CrossRef] [PubMed]
  76. Ntie-Kang, F. An in silico evaluation of the ADMET profile of the StreptomeDB database. Springerplus 2013, 2, 353. [Google Scholar] [CrossRef] [PubMed]
  77. Witchel, H.J.; Hancox, J.C. Brief review familial and acquired long QT syndrome and the cardiac rapid delayed rectifier potassium current. Clin. Exp. Pharmacol. Physiol. 2000, 27, 753–766. [Google Scholar] [CrossRef] [PubMed]
  78. Hengstler, J.G.; Oesch, F. Ames Test. In Encyclopedia of Genetics; Brenner, S., Miller, J.H., Eds.; Academic Press: New York, NY, USA, 2001; pp. 51–54. [Google Scholar] [CrossRef]
  79. Huang, S.; Strong, J.M.; Zhang, L.; Reynolds, K.S.; Nallani, S.; Temple, R.; Abraham, S.; al Habet, S.; Baweja, R.K.; Burckart, G.J. New era in drug interaction evaluation: US Food and Drug Administration update on CYP enzymes, transporters, and the guidance process. J. Clin. Pharmacol. 2008, 48, 662–670. [Google Scholar] [CrossRef] [PubMed]
  80. Hollenberg, P.F. Characteristics and common properties of inhibitors, inducers, and activators of CYP enzymes. Drug Metab. Rev. 2002, 34, 17–35. [Google Scholar] [CrossRef]
  81. Lobanov, M.Y.; Bogatyreva, N.S.; Galzitskaya, O.V. Radius of gyration as an indicator of protein structure compactness. Mol. Biol. 2008, 42, 623–628. [Google Scholar] [CrossRef]
  82. Mahmud, S.; Parves, R.; Riza, Y.M.; Mahmud, K.; Ray, S.; Tithi, F.A.; Zaoti, Z.F.; Absar, N. Exploring the potent inhibitors and binding modes of phospholipase A2 through in silico investigation. J. Biomol. Struct. Dyn. 2020, 38, 4221–4231. [Google Scholar] [CrossRef]
  83. Mitra, S.; Dash, R. Structural dynamics and quantum mechanical aspects of shikonin derivatives as CREBBP bromodomain inhibitors. J. Mol. Graph. Model. 2018, 83, 42–52. [Google Scholar] [CrossRef] [PubMed]
  84. Bogatyreva, N.S.; Ivankov, D.N. The relationship between the solvent-accessible surface area of a protein and the number of native contacts in its structure. Mol. Biol. 2008, 42, 932. [Google Scholar] [CrossRef]
  85. Gilis, D.; Rooman, M. Stability changes upon mutation of solvent-accessible residues in proteins evaluated by database-derived potentials. J. Mol. Biol. 1996, 257, 1112–1126. [Google Scholar] [CrossRef] [PubMed]
Figure 1. Pose view and ligand interactions diagram of selected compounds with tumor necrosis factor-alpha (TNF-α). The upper left and right panel of the figure indicate the binding pose and interactions of Paeoniflorin with TNF-α, whilst the bottom left and right panel indicate the binding pose and interactions of Amoradicin with TNF-α respectively. The colors; sky, blue, yellow, solid blue line, silver colored dash line, olive colored dash line indicates ribbon view of protein, interacting amino acids, ligand, H bond interactions, hydrophobic interactions, and π stacking interactions respectively.
Proceedings 79 00013 g001
Figure 2. (a) RMSD (Root Mean Square Fluctuation) (b) Rg (Radius of gyration), (c) SASA (Solvent Accessible Surface Area), (d) Root mean square fluctuation (RMSF) of A chain for Apo, and protein-ligand complexes, (e) RMSF of B chain for Apo, and protein-ligand complexes. Analysis from simulated trajectories of all systems.
Proceedings 79 00013 g002
Figure 3. Residue cross correlation maps of (a) Apo, (b) Paeoniflorin-TNFα complex (c) Amoradicin-TNFα complex, and (d) control drug-TNFα complex.
Proceedings 79 00013 g003
Figure 4. Principle component analysis of (a) Apo, (b) Paeoniflorin-TNFα complex, (c) Amoradicin-TNFα complex, and (d) control drug-TNFα complex. Each dot denotes its conformation of the protein throughout the X and Y axis. The spread of blue and red color dots described the degree of conformational changes in the simulation, where the color spectrum from blue to white to red is equivalent to simulation time. The blue specifies the initial timestep, white specifies intermediate, and the final timestep is represented by red color.
Proceedings 79 00013 g004
Figure 5. The PC1 of all systems are represented as the tube structures of three-dimensional structures of (a) Apo, (b) Paeoniflorin-TNFα complex (c) Amoradicin-TNFα complex, and (d) control drug-TNFα complex. The circular black colour indicates the regions of higher flexibility.
Proceedings 79 00013 g005
Figure 6. The residual contribution to PC1 of all systems is represented in (a) PC1 of A chain, (b) PC1 of B chain.
Proceedings 79 00013 g006
Figure 7. Hydrogen bond analysis of during Molecular Dynamics (MD) simulation; (a) total intermolecular hydrogen bonds count, and (b) number of intramolecular hydrogen bond.
Proceedings 79 00013 g007
Figure 8. Time series analysis of binding free energy of all protein-ligand complexes. The color codes black, red, and green indicates control drug, paeoniflorin, and Amoradicin with their respective complex.
Proceedings 79 00013 g008
Table 1. Docking results (kcal/mol) and of primary estimation of binding affinity.
Compound NameDocking ScoreGlide Ligand EfficiencyGlide EvdwGlide EcoulGlide EnergyGlide EmodelMMGBSA ΔG Bind
Kaempferol−10.677−0.254−40.764−14.462−55.226−73.529−61.26
Corilagin−10.325−0.229−31.526−16.372−47.897−63.724−29.57
Amoradicin−8.149−0.255−35.262−6.188−41.45−55.702−58.69
Paeoniflorin−7.696−0.226−31.778−8.588−40.366−51.405−40.42
Quercetin−7.591−0.345−29.553−7.52−37.073−42.579−41.9
Myricetin−7.52−0.327−20.062−8.104−28.166−38.118−26.69
Eriodictyol−7.42−0.353−16.679−15.465−32.145−36.398−36.53
Luteolin−7.241−0.345−28.16−6.815−34.976−44.758−37.48
Curcumin−6.515−0.241−27.64−8.604−36.244−48.232−40.98
Table 2. IFD results of selected compounds with TNF-α.
Compound NameIFD Score (kcal/mol)Prime EnergyGlide ScoreGlide Ecoul
Paeoniflorin−554.98−10699.63−11.327−9.291
Amoradicin−546.31−10883.87−10.790−7.678
Table 3. Physiochemical and pharmaceutically relevant descriptors of selected compounds and control drug.
ParametersPaeoniflorinAmoradicinControl Drug
CNS permeability−3.914−2.769−0.686
Blood Brain Barrier permeability−1.352−1.2940.147
Total clearance0.6450.320.79
Renal OCT2 substrateNoNoNo
hERG inhibitorNoNoYes
HepatotoxicityNoNoYes
% of Human Oral absorption48.35010084.485
% of Human Intestinal absorption67.87388.71293.083
QPlogPo/W 0.2564.9986.700
QPlogS −2.365−6.934−6.985
Solvent Accessible Surface Area (SASA)654.688761.367684.054
AMES toxicityNoNoYes
Hydrogen bond donors530
Hydrogen bond acceptors1165
LipinskiYesYesNo
Bioavailability0.550.550.55
Molecular Weight480.46 g/mol438.51 g/mol547.621 g/mol
CYP2D6 substrateNoNoYes
CYP3A4 substrateNoYesYes
CYP1A2 inhibitorNoNoYes
CYP2C9 inhibitorNoYesNo
CYP2D6 inhibitorNoNoYes
CYP3A4 inhibitorNoYesYes
Publisher’s Note: MDPI stays neutral with regard to jurisdictional claims in published maps and institutional affiliations.

