Proceeding Paper

Standardized Questionnaires for User Experience Evaluation: A Systematic Literature Review †

1
Research Center for Informatics and Communication Technologies, University of Costa Rica, 11501-2060 San José, Costa Rica
2
School of Computer Science and Informatics, University of Costa Rica, 11501-2060 San José, Costa Rica
*
Author to whom correspondence should be addressed.
Presented at the 13th International Conference on Ubiquitous Computing and Ambient Intelligence UCAmI 2019, Toledo, Spain, 2–5 December 2019.
Proceedings 2019, 31(1), 14; https://doi.org/10.3390/proceedings2019031014
Published: 20 November 2019

Abstract

:
Standardized questionnaires are one of the methods used to evaluate User Experience (UX). Standardized questionnaires are composed of an invariable group of questions that users answer themselves after using a product or system. They are considered reliable and economical to apply. The standardized questionnaires most recognized for UX evaluation are AttrakDiff, UEQ, and meCUE. Although the structure, format, and content of each of the questionnaires are known in detail, there is no systematic literature review (SLR) that categorizes the uses of these questionnaires in primary studies. This SLR presents the eligibility protocol and the results obtained by reviewing 946 papers from four digital databases, of which 553 primary studies were analyzed in detail. Different characteristics of use were obtained, such as which questionnaire is used more extensively, in which geographical context, and the size of the sample used in each study, among others.

1. Introduction

User Experience (UX) is currently a key factor in establishing the quality of a product or service [1,2,3]. User Experience is defined by ISO [4] as a: person’s perceptions and responses resulting from the use and/or anticipated use of a product, system, or service. ISO definition includes users’ emotions, beliefs, physical and psychological responses, and considers UX also a consequence of brand image, presentation, system performance, the user’s internal and physical state resulting from prior experiences, attitudes, skills, and personality, among others.
To study UX, an essential element is the evaluation, which refers to the application of a set of methods and tools whose objective is to determine the perception about the use of a system or product. Among the methods to evaluate UX are the standardized questionnaires, in which end-users describe their perception regarding aspects such as whether the product is easy to use, clear, confusing, original, among others. AttrakDiff, UEQ, and meCUE are the three most recognized questionnaires for UX evaluation. This is stated in studies such as those presented by Lallemand et al. [5], Baumgartner et al. [6], Forster et al. [7] and Klammer et al. [8], and it is also reaffirmed in a preliminary study conducted by us in October 2018, prior to this SLR. In the mentioned papers [5,6,7,8], the three questionnaires are described and cited as the recognized scales for UX evaluation. For example, Forster et al. [7] differentiate UX from the three other constructs Usability, Acceptance, and Trust, and for each of these constructs the authors identify the following standardized questionnaires: AttrakDiff, UEQ, and meCUE for UX, SUS and PSSUQ for Usability, UTAUT and TAM for Acceptance, and ATS for Trust. In [5], the number of questions that contain AttrakDiff, UEQ, and meCUE are presented, as well as the type of scale they use and the theoretical models on which they are based. This paper also describes the mechanics of using the questionnaires according to the planning phases, the application of the questionnaire, the analysis, and the presentation of results. For their part, the questionnaires AttrakDiff, UEQ, and meCUE are listed in [6] as the standardized questionnaires for UX evaluation, and the difference between these three questionnaires for UX from Usability evaluation questionnaires is also explained. For their part, in [8], the three standardized questionnaires are cited as the validated instruments for measuring UX.
Despite the information provided by the articles above, they do not address the issue of how the different standardized questionnaires have been used, only describe them. The only element that sheds light on the use of standardized questionnaires AttrakDiff, UEQ, and meCUE is presented by Forster et al. [7], who conducted a Google Scholar search and found 1157 citations of the three UX questionnaires, of which 697 citations correspond to AttrakDiff (60.24%), 429 citations to UEQ (37.08%), and 31 citations to meCUE (2.68%).
Similarly, there are no systematic literature reviews dealing with how standardized questionnaires have been used in primary studies. The closest we found to the topic were two literature reviews on User Experience evaluation in general, presented by Maia and Furtado [9] and Ten and Paz [10]. However, in neither of the two cases were objectives established as those formulated in our study. The review presented in [9] raises four research questions, of which number 2 (How is the evaluation performed?) could have been related to the review presented in our article. Nevertheless, the authors focused on investigating when to perform the evaluation (if it is done before, during, or after the use of the product), if it is done manually or in an automated way and only mention that a high percentage of the studies (84%) uses questionnaires, but without detailing or mentioning the questionnaires used. In [10], a systematic literature review is proposed to find the methods, tools, and criteria used to evaluate the User Experience of websites. Among the tools identified are the questionnaires, and although the study recognizes that questionnaires are the most used tool, it does not detail which questionnaire was used in the studies. In fact, in none of the two reviews cited, is there any mention of the most common specific standardized questionnaires: AttrakDiff, UEQ, or meCUE, and both reviews focus only on general issues of UX evaluations.
It is due to this lack of information regarding the uses given to the different standardized questionnaires for UX evaluation that our systematic literature review is proposed.
The following section (Section 2) describes the three standardized questionnaires in general and the structural characteristics of the questionnaires included in the study: AttrakDiff, UEQ, and meCUE. Subsequently, Section 3 describes the protocol used to carry out a systematic literature review. Section 4 shows the most important results of this investigation, and finally, in Section 5, the conclusions of this work are presented.

2. Background

Standardized questionnaires for UX evaluation are considered standardized since they contain an invariable set of questions that are always exposed in the same order and that the study participants respond to by themselves [11]. These questionnaires use Likert scales [12] or semantic differentials [13] to collect the opinion of the users regarding the pragmatic or hedonistic characteristics of the products. As pragmatic characteristics, we understand those traits as if a product is predictable, confusing, simple, complicated, among others. On the other hand, the hedonistic characteristics are those that appeal to sensations as if a product is boring, interesting, novel, or disappointing, related to stimulation traits and also those related to identification and evocation traits, such as the ability of a product to connect with others rather than isolate [8].
Standardized questionnaires are economical and easy to use since they are self-applied by the user based on the perceived experience after using a product or service, and for this reason, its use is extended. In addition, they are considered reliable and valid to measure the User Experience [14].
The first of the three questionnaires to appear in the industry is AttrakDiff, proposed by Hassenzahl, Burmester, and Koller in 2003 [15]. It consists of 28 items to be marked by the user, where each item is constructed by a 7-point semantic differential. Later, in 2008, Laugwitz, Held, and Schrepp presented the “User Experience Questionnaire” (UEQ) [16]. It consists of 26 items also built by 7-point semantic differentials. Finally, in 2013, Minge and Riedel proposed the meCUE questionnaire [17], built with 33 items formed by 7-point Likert scales. These three standardized questionnaires have been used in several primary studies reported in the academic literature, and on these questionnaires, this SLR was performed, whose protocol is described below.

3. Systematic Literature Review

The purpose of this systematic literature review is to collect information on the uses that have been given to the standardized UX evaluation questionnaires. We used the PRISMA Statement for systematic reviews, as proposed by Liberati et al. [18].

3.1. Planning the Review

The objective of the following paragraphs is to document this SLR to make it replicable and auditable, so the research question, the search strategy, and the papers’ inclusion criteria will be presented next.

3.1.1. Research Question

The research question of this systematic review is the following: How have the standardized questionnaires AttrakDiff, UEQ, and meCUE been used to evaluate the User Experience in primary studies reported academically? This research question will be answered by identifying which questionnaire is most widely used, the geographical context in which they are used, as well as the sample size used in each of the primary studies. Another aspect that will be considered is if the questionnaires have been used in combination with other methods of evaluation, for example, Usability questionnaires, or if, on the contrary, they are used as the only evaluation method.

3.1.2. Search Strategy

In October 2018, a preliminary study was carried out to establish the search strategy. In this study, consultations were made in the digital libraries of ACM, IEEE Xplore, and Springer Link, searching for articles that cited one of the three questionnaires: AttrakDiff, UEQ, or meCUE. This study allowed us to anticipate the number of articles that report uses of standardized questionnaires, as well as to organize the team that would oversee the revision. Additionally, when conducting the screening, the search query was improved to be more precise and to bring results within the field of study of the evaluation of User Experience. From the results obtained in the searches, 55 articles were full text reviewed in this preliminary study, where the relevant elements were identified, as well as those criteria that were later used to discard articles that should not be included in the systematic literature review. Based on this preliminary review, it was also decided to include a fourth digital library: Science Direct.
The search query that was finally established to perform the SLR presented in this paper is as follows: (meCUE OR AttrakDiff OR AttrakDiff2 OR (UEQ AND (UX OR “User Experience”))).

3.1.3. Study Selection

The selection of the studies to be included was divided into two parts: First, a screening was carried out to discard articles based on the revision of the title, keyword, and abstract, and second, a full-text review was performed. In the screening process, those articles where the digital library did not provide the full text were discarded, as well as those results that are part of textbooks and only mention some of the standardized questionnaires. Results returned by the query that had nothing to do with the UX evaluation, among which are, for example, coincidences with other UEQ and UX that are not the “User Experience Questionnaire” or the “User Experience” concept were also removed. For the full-text review phase, the following exclusion criteria were identified: the paper was written in languages other than English, the paper proposes a new method and uses the questionnaire as a basis or reference, the questionnaire used is a translation of one of the standardized questionnaire into another language, or the paper mentioned a standardized questionnaire in the “related work” section, for example, but, in fact, the questionnaire is not used in the primary study.

3.2. Conducting the Review

The systematic literature review described in this paper was done in April 2019. The research group that conducted the review comprised a Ph.D., two Ph.D. candidates, a Ph.D. student, and 11 Master’s degree students. The first four researchers comprise the main group of this study, executing most of the research, while the second group, formed by the Master’s degree students, had a smaller participation, carrying out the complete text review of 20 articles each. Figure 1 shows the PRISMA diagram for this review.

3.2.1. Identification

The search query was executed on ACM Digital Library, IEEE Xplore, Springer Link, and Science Direct. The search engines of the four libraries were configured to run the search query in the metadata as well as in the full text of the articles. A filter was added to the queries so that the answers did not include articles before 2003, the date on which the AttrakDiff questionnaire appeared, this being the first of the three questionnaires to be proposed. Additionally, for the Springer Link library, a second filter was added that left out those articles in languages other than English. In the other three libraries, discarding articles in other languages was done manually during the screening process. As a result of executing this query in the four digital libraries, 946 papers were retrieved, as can be seen in the upper level of the PRISMA diagram in Figure 1.

3.2.2. Screening

Initially, seven articles were discarded from the original 946 because they were present in more than one library. Then the screening process started where one of the researchers reviewed the title of the paper, the abstract, and the keywords of the 939 articles. In this review, those articles that the library did not provide the full text were discarded, as well as those results that are part of textbooks and that only mention some of the standardized questionnaires. The researcher also removed those results returned by the query that had nothing to do with the UX evaluation, among which are, for example, coincidences with other UEQ and UX that are not the “User Experience Questionnaire” or the “User Experience” concept. In total, 182 results were discarded in this screening, on which a full-text review was not be carried out. A second researcher performed a cross-review process of these 182 discarded papers, and no discrepancies were found. At this point, there were 757 articles for the full-text review.

3.2.3. Eligibility

The 757 papers were assessed for eligibility by the 15 researchers. The four researchers from the main group reviewed 135 papers each, on average, while the researchers in the second group analyzed 20 papers each. The researchers discarded a set of papers according to the criteria indicated in Section 3.1.2 Study Selection. A cross-review of the papers discarded was carried out to confirm that there were no inconsistencies.
The researchers also decided to discard nine papers that used more than one of the three standardized questionnaires. These are papers comparing two of the standardized questionnaires or explaining concepts used in the questionnaires, for example. They are the following [16,19,20,21,22,23,24,25,26]. These nine papers include two papers from the creators of meCUE [19,20], in which they describe the questionnaire and compare the results obtained from it with AttrakDiff and UEQ. This list also includes the paper where the UEQ questionnaire is presented in 2008 [16], in which AttrakDiff is used for comparison purposes.
As a result of this phase, 209 papers were discarded, leaving 548 to be included in the qualitative synthesis.

3.2.4. Included

As seen in the lower section of Figure 1, a total of 548 papers were included in the study to analyze the uses of the standardized UX evaluation questionnaires and thus respond to the research question. On this list, a cross-review was carried out by a second researcher (different from the one who carried out the original revision), and the discrepancies found were settled. Table 1 shows a summary of the papers reviewed and included for each phase of the review, classified by the digital library to which they correspond.
It should be noted that four papers presented more than one study, so the total number of studies is 553. The researchers analyzed these 553 studies in detail and obtained the results presented in the following section.

4. Discussion and Results

This section presents the results obtained in the full-text study of the included articles, organized according to the analyzed topic.

4.1. Most Used Standardized Evaluation Questionnaires

As seen in Table 2, the AttrakDiff questionnaire was the most present in the literature, being used in 341 of the 553 studies analyzed (61.6%). It is followed by UEQ with 200 studies (36.2%), and finally meCUE with 12 (2.2%). Considering the year in which each questionnaire was presented (AttrakDiff in 2003, UEQ in 2008, and meCUE in 2013), one might initially think that the seniority of the questionnaire affects the number of reported uses.

4.2. Uses by Year

The use of standardized questionnaires has been increasing every year, according to the articles that report their use, as shown in Figure 2. This figure does not include the studies presented in 2019, given that the consultation of the different libraries performed in March 2019, so the results do not represent the full year.
Analyzing the number of uses of each questionnaire individually, it can be noted that the three questionnaires have had an increasing progression over the years. It is interesting to note that AttrakDiff, being the first questionnaire to appear and that globally covers 62% of the uses, was surpassed in 2017 and 2018 by UEQ. While AttrakDiff has maintained a stable number of uses since 2015, UEQ is growing at a faster pace, surpassing AttrakDiff in 2017 and 2018 by 42% and 47% of uses respectively. This behavior is shown in Figure 3.
As for meCUE, which appeared in 2013, it shows an increase in use in 2017 and 2018. The behavior of this questionnaire should be analyzed in the coming years to see if it manages to take a significant place next to AttrakDiff and UEQ, which are the most used to date.

4.3. Geographical Distribution of the Use of Questionnaires
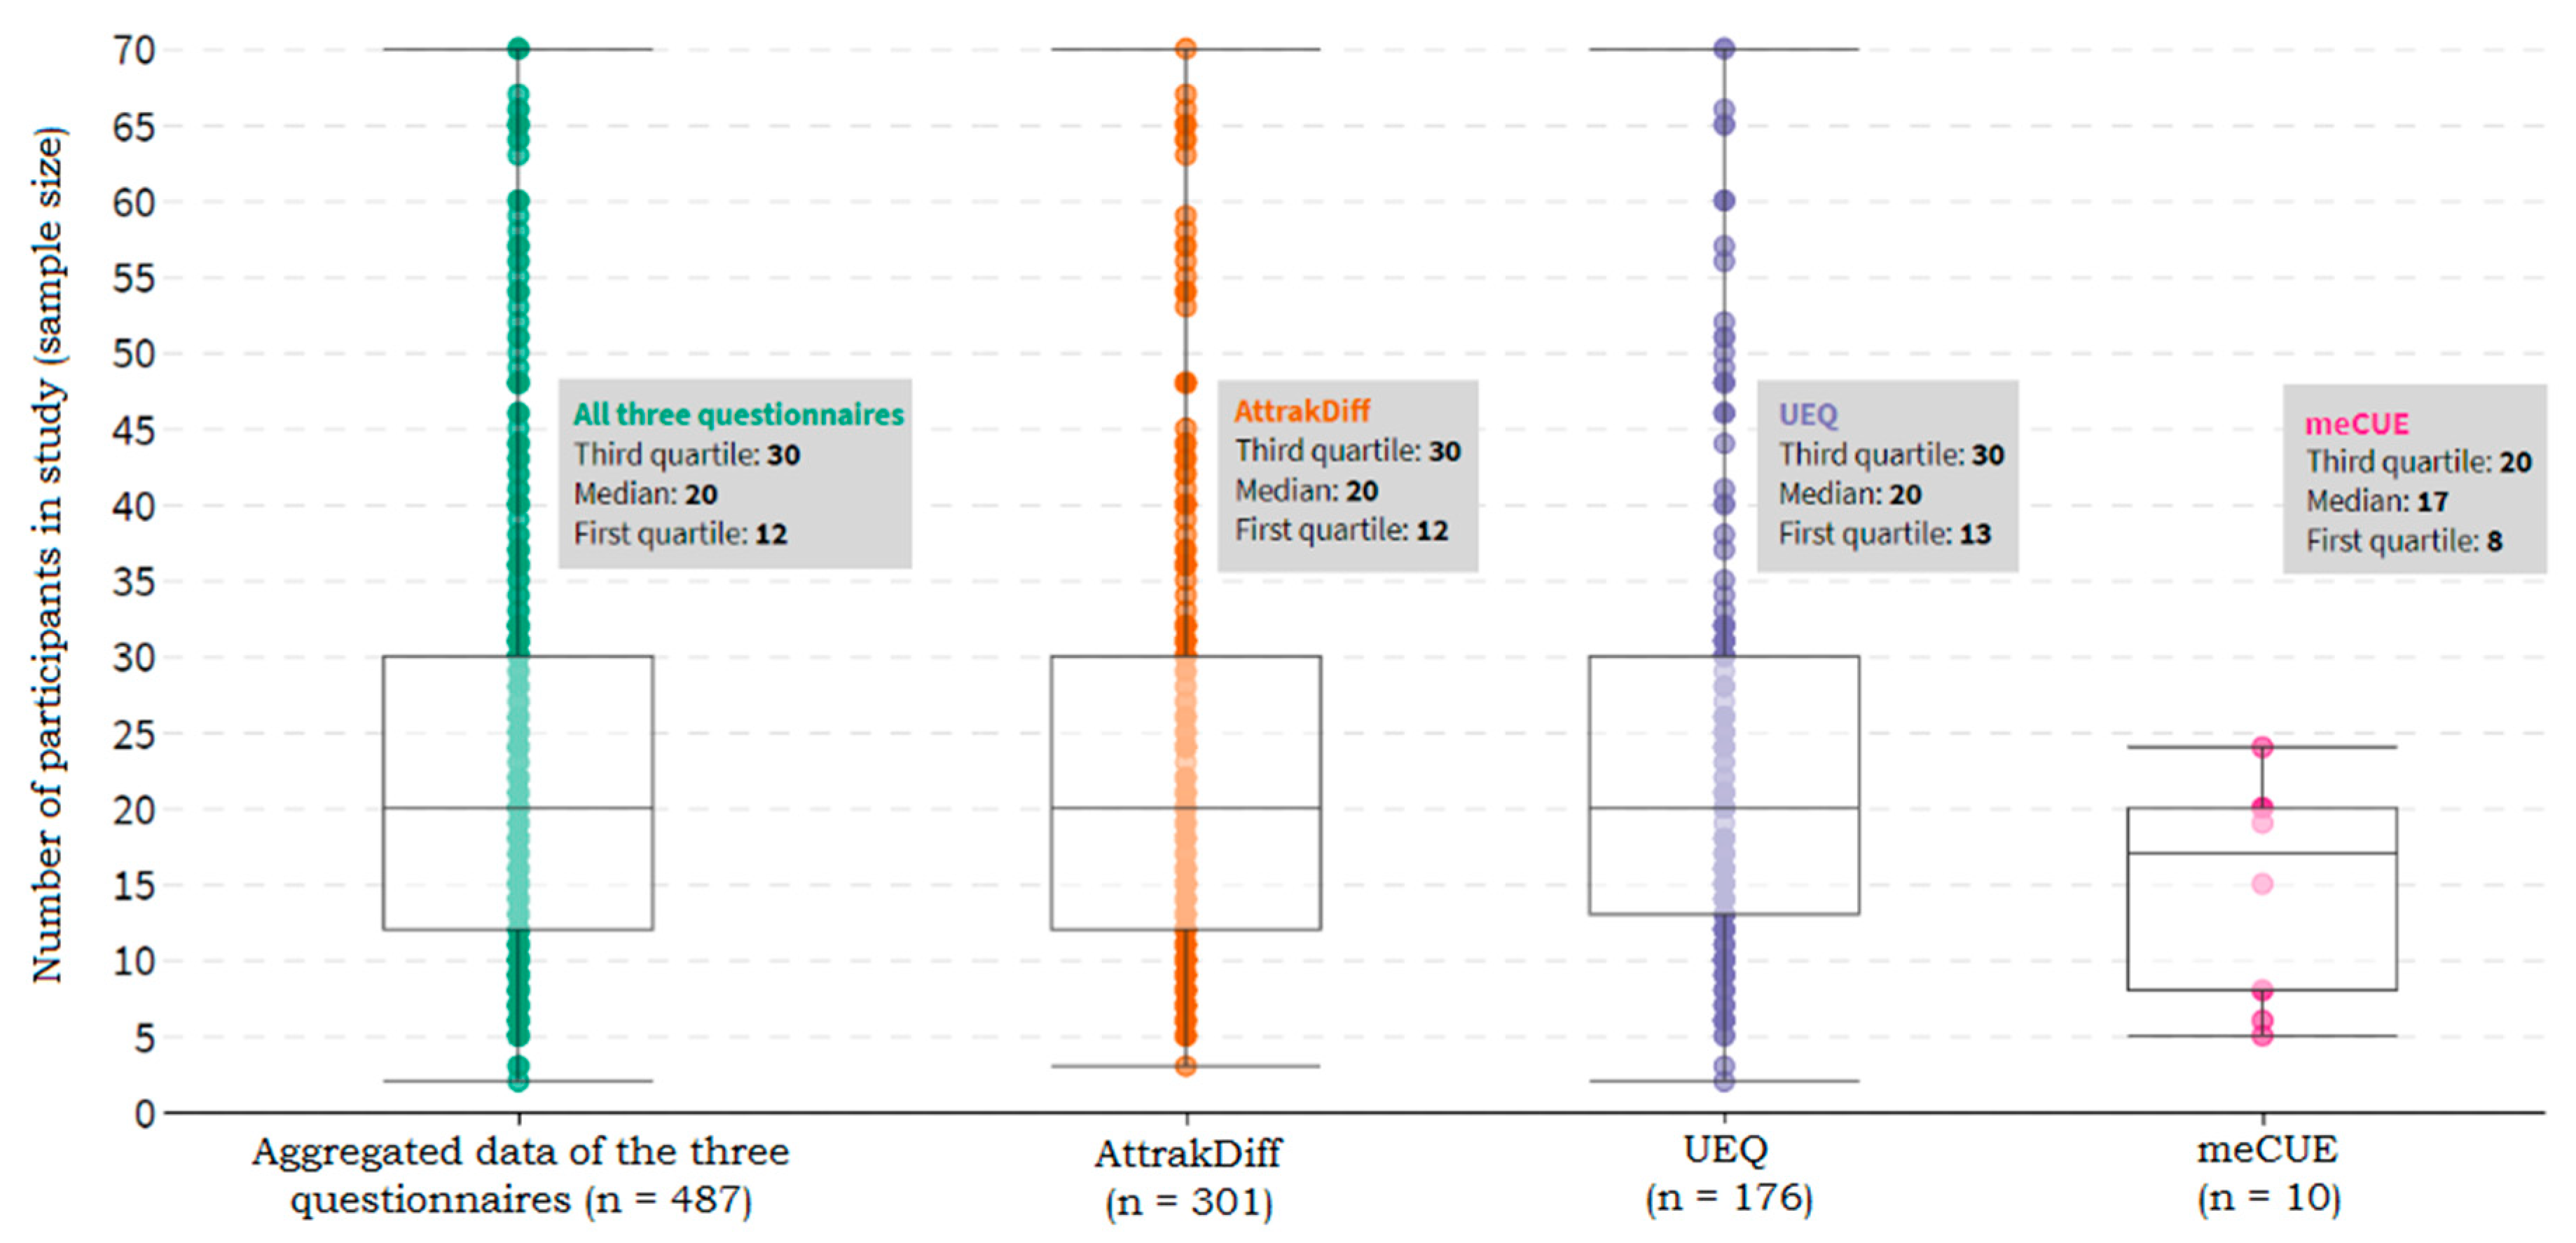
As seen in Table 3, Europe is by far the region with the most use of standardized UX evaluation questionnaires, with 463 studies out of 551 analyzed (84%). It was not possible to identify where the questionnaire was used in two of the 553 studies included in this literature review. Europe is followed by Asia with 33 studies (6.0%), North America (20 studies, 3.6%), South America (15, 2.7%) and Oceania (10, 1.8%). Additionally, 10 studies (1.8%) were carried out in more than one region simultaneously.
Reviewing in detail the use of the questionnaires in Europe, the distribution of the three questionnaires corresponds to the global distribution of these. However, it is worth noting that in Asia, the UEQ questionnaire is significantly more used than the other two, with 76% of the uses (25 studies of 33 reviewed), while AttrakDiff only represents 21% (7 studies).
The large number of studies carried out in Europe may correspond to the fact that the three standardized questionnaires were created in Germany, which may have influenced their expansion in this region. In fact, as can be seen in Figure 4, 247 studies of the 463 reported in Europe were conducted in Germany, representing a significant 53.3% of the studies in that continent. In countries neighboring Germany, such as Switzerland, Austria, the Netherlands, and France, there is also an important use of standardized questionnaires. Finland, although a little further away from Germany than those mentioned, contributes with 37 studies, representing 8.0% of the total.
Concerning other regions, Indonesia provides the largest number of studies carried out in Asia, with 11 of the 33 studies, corresponding to 33.3%, and using UEQ exclusively in all cases conducted in that country. In South America, Brazil reports eight of the 15 studies for 53.3% of that region. In Oceania, Australia contributes with nine of the 10 studies (90.0%), while in North America, the United States represents 50.0%, with 10 studies out of 20 reported in the region. It is interesting to mention that of the 10 studies conducted in the United States, seven were recently carried out, three studies in 2017 and four in 2018, which would seem to indicate that the interest on standardized questionnaires of researchers in that country is recent and that it could increase in the coming years.

4.4. Sample Size

The number of participants in each of the reported studies ranged from two to 691 participants. It was not possible to identify the sample size in five studies. The statistical analysis identified 61 studies as outliers, with samples greater than 70 participants. Without considering these outliers, Figure 5 shows that the median for the aggregated data of the three questionnaires is 20 participants per study, the first quartile corresponds to 12 participants and the third quartile to 30 participants. Considering the outliers, the median is still 20 participants per study, while the first and third quartiles increase slightly to 13 and 36 participants, respectively.
Analyzing each questionnaire separately, Figure 5 shows the median and quartile values for each of them. The values for the uses of the AttrakDiff and UEQ questionnaires are practically identical. The fact that the general median for the three questionnaires, as well as the median of the AttrakDiff and UEQ questionnaires is 20, could be influenced by the fact that the official AttrakDiff site has an online questionnaire in which it is possible to collect information from up to 20 participants for free.

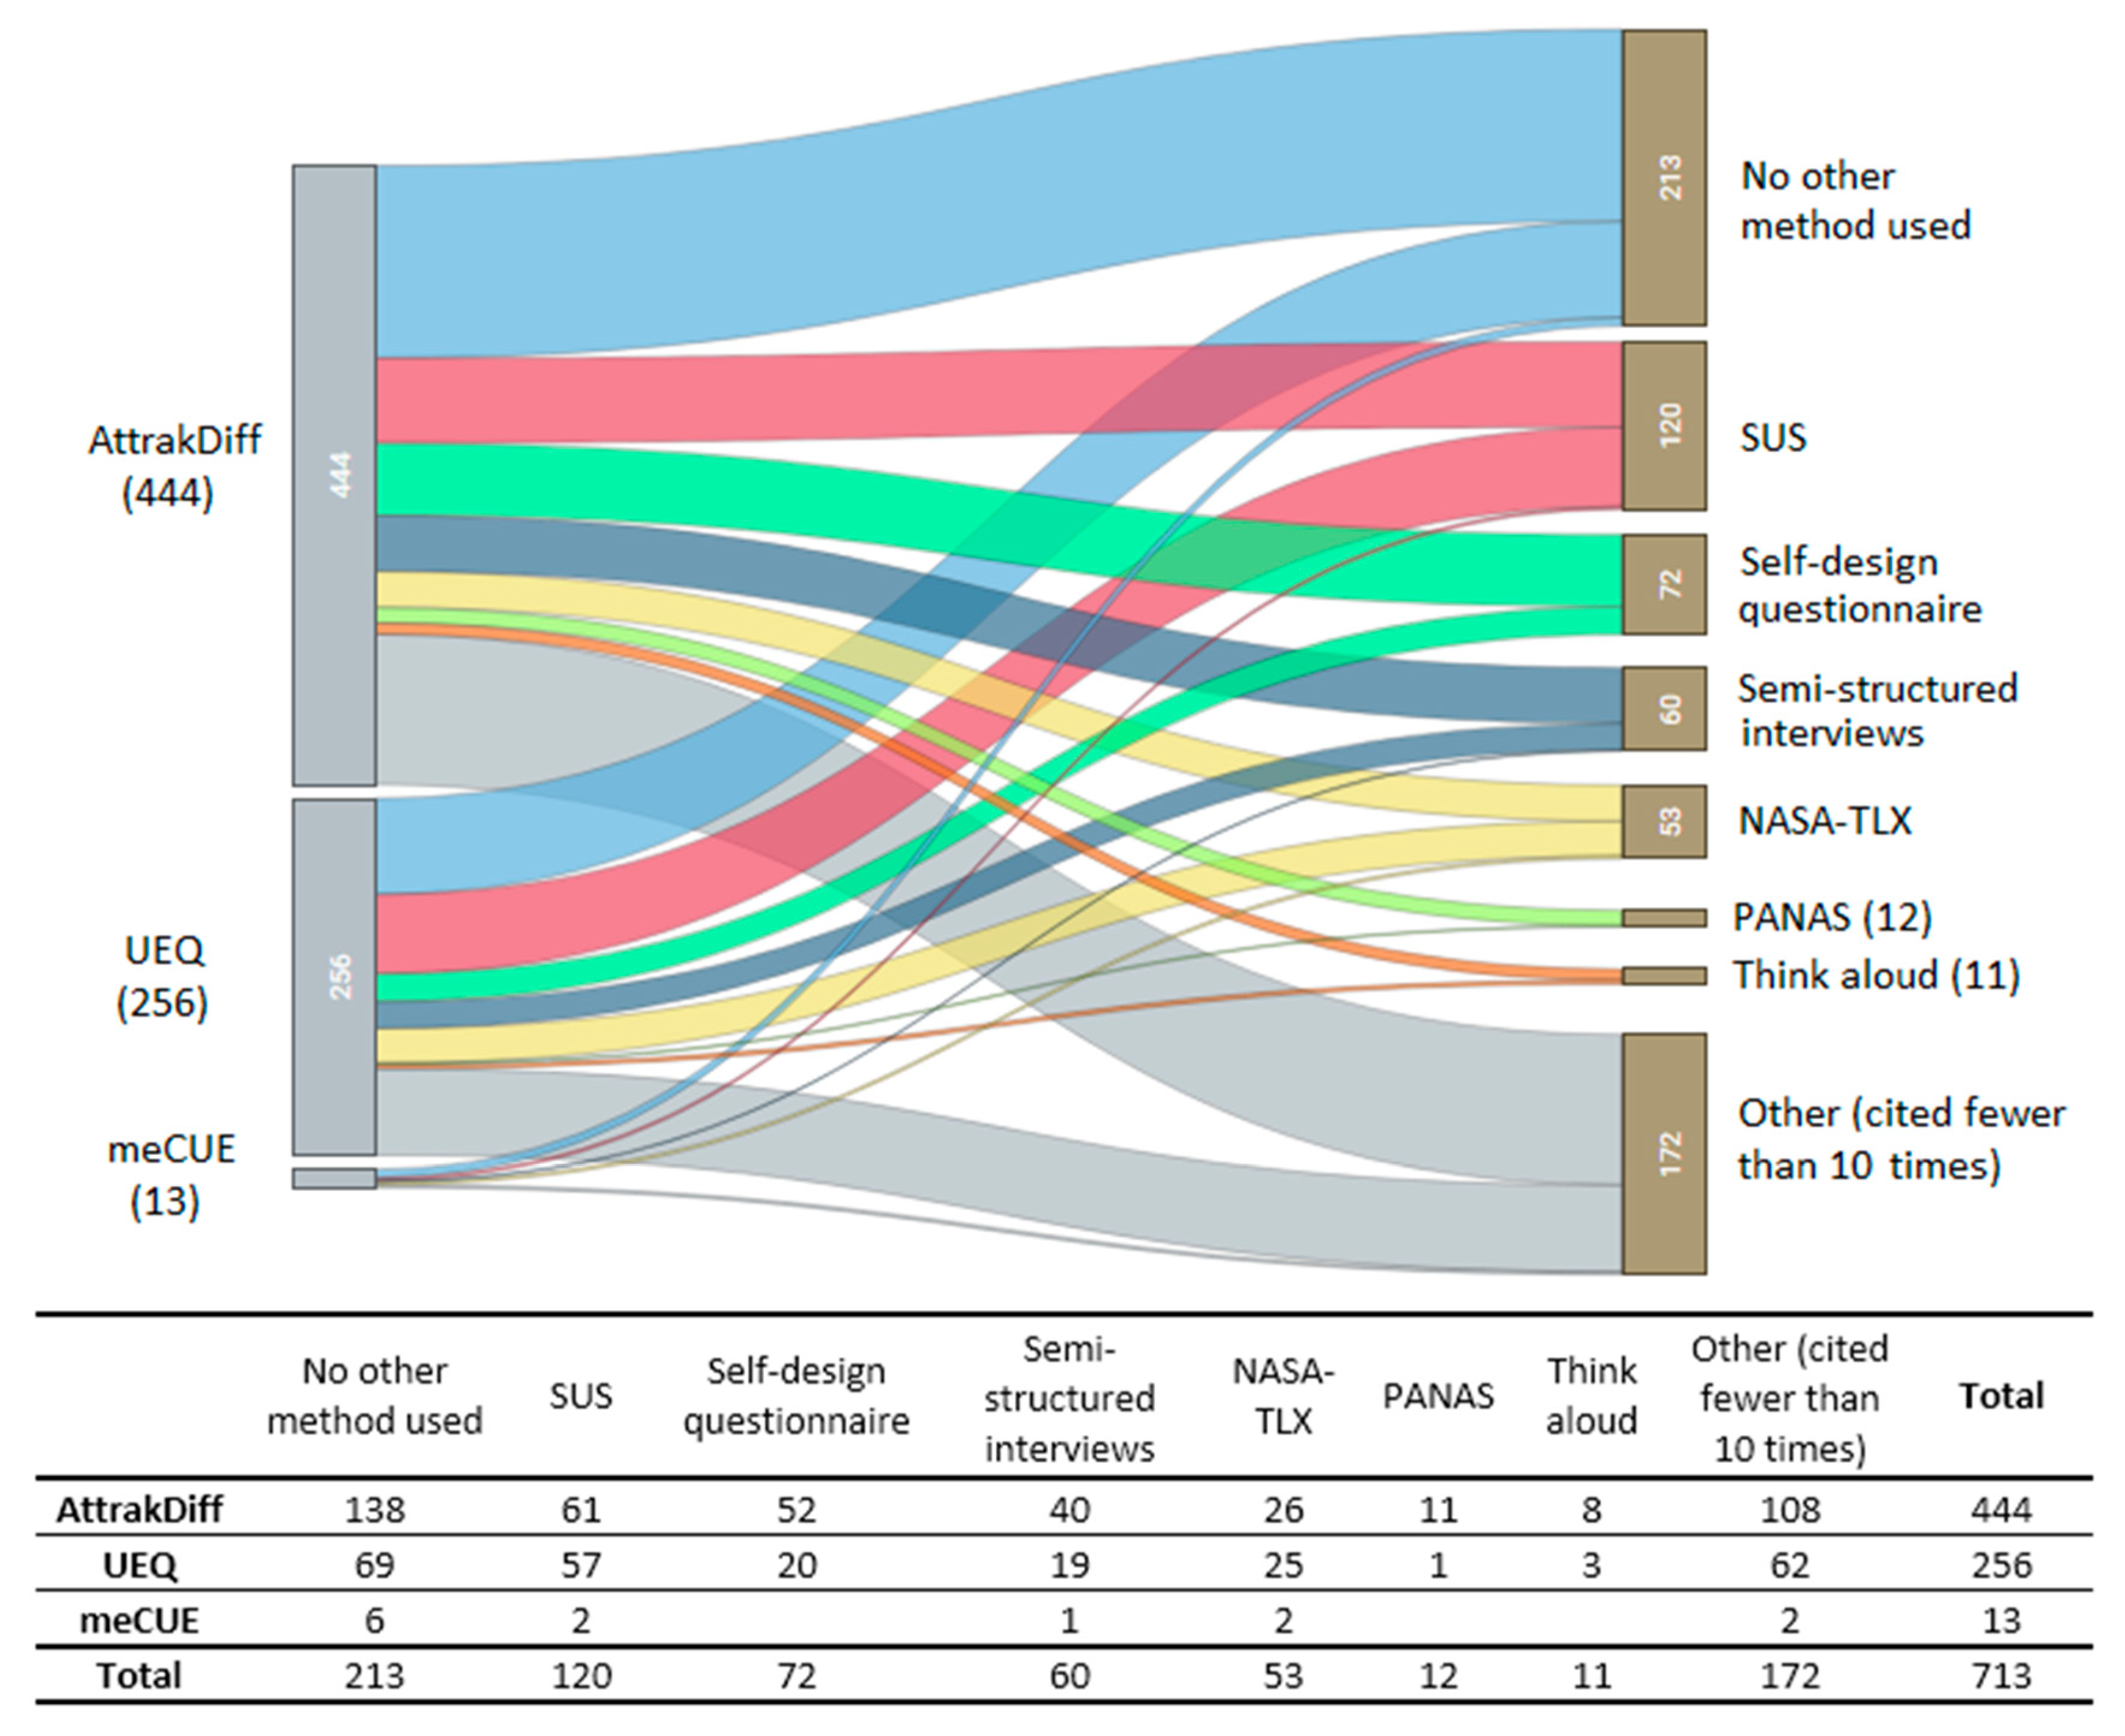
4.5. Association with Other Evaluation Mechanisms

In 340 of the 553 studies reported (61.5%), in addition to applying the standardized UX evaluation questionnaire, another evaluation method was applied, while in the remaining 213 studies (38.5%), only the standardized questionnaire was used as a method of evaluation. Of the 340 studies that supplemented the evaluation with other methods, 219 studies (64.4%) used 1 additional method, 88 (25.9%) used 2 methods, 28 (8.2%) used 3 methods, 4 (1.2%) used 2 methods, and 1 (0.3%) used a total of 5 additional methods.
Figure 6 shows the relationship between the three standardized questionnaires and other methods used in the 553 studies. It is important to mention that since a study can include from zero to five additional methods, the 340 studies that used at least one additional method represent 500 additional methods. The 213 studies that did not use additional evaluations are considered as having one method each, which added to the 500 complementary methods used, gives a total of 713 methods distributed in the graph.
In addition to showing the 213 studies that only used the standardized UX questionnaire as an evaluation method, Figure 6 evidences the additional methods most used as a complement to the use of standardized UX questionnaires. It is important to highlight that 120 studies applied the SUS (System Usability Scale) questionnaire, which demonstrates its strong positioning as a Usability evaluation questionnaire. Other methods used are self-designed questionnaires (72 studies), semi-structured interviews (60 studies), the NASA-TLX questionnaire (53 studies), PANAS (12 studies), the Think aloud technique (11 studies) ,and 172 other methods that were used in fewer than 10 studies each, among which are 79 methods that were used only once.

5. Threats to Validity

The results of the presented work may have been affected by the selection process carried out by the group of researchers, which could be influenced by their human characteristics. Having used a large group of researchers poses a challenge to the consistency of the inclusion criteria and characterization of the studies. Cross validations were performed to reduce biases.
Another point to mention is that only four digital databases were used for collecting the papers. Although the number of papers analyzed is significant, future work could consider including other sources.

6. Conclusions

This article presents the results of the systematic literature review conducted to classify and compare the uses of the standardized questionnaires AttrakDiff, UEQ, and meCUE in academic studies.
Results show that the use of standardized questionnaires has increased year after year, starting in 2006, where first articles are published describing their use. Throughout these years, the most used questionnaire is AttrakDiff, which coincides with the fact of being the first questionnaire to be created. However, since 2017, the UEQ questionnaire has far surpassed AttrakDiff in number of uses.
As for the geographical context, in Europe, the standardized questionnaires have been used more extensively than in the rest of the world, followed by Asia. In Europe, Germany greatly exceeds the rest of the European countries. It should be noted that the three questionnaires, although their original version is in German, were quickly translated into English so that their use could be more widespread. Despite this, and the United States being one of the technological leaders of the world, few studies using standardized questionnaires are reported in that country. It should be noted, however, that the 10 studies reported in the United States correspond to the years 2017 and 2018, which could indicate that the use of standardized questionnaires will increase in the coming years.
Regarding the sample size of the studies, this review shows that the median for the aggregated data of the three questionnaires is 20 participants, while the values for the first and third quartiles are 12 and 30 participants, respectively. This information is almost identical for the two most commonly used questionnaires: AttrakDiff and UEQ, if their data is analyzed individually, and reflects the number of participants that researchers are using in studies around the world to evaluate user experience.
Finally, it is worth mentioning that 38.5% of the studies reviewed used the standardized UX evaluation questionnaire as the only evaluation method. The 61.5% of remaining primary studies (340 studies) used between one and five complementary methods, among which the SUS usability questionnaire stands out, which is reported in 120 studies analyzed.

Supplementary Materials

The complete bibliography of the 548 papers analyzed in the full-text review is available at http://citic.ucr.ac.cr/sites/default/files/SLR_References_IDO.pdf.

Author Contributions

Conceptualization, I.D. and G.L.; Methodology, I.D. and G.L.; Validation, L.Q. and L.G.; Formal Analysis, I.D.; Investigation, I.D.; Data Curation, I.D., G.L., L.Q., L.G.; Writing–Original Draft Preparation, I.D.; Writing—Review and Editing, G.L., L.Q., L.G.; Supervision, L.G.

Funding

This research was funded by ECCI and CITIC at the University of Costa Rica, grant numbers 834-B4-412 and 326-B9-107.

Conflicts of Interest

The authors declare no conflict of interest.

References

  1. Schrepp, M.; Hinderks, A.; Thomaschewski, J. Applying the user experience questionnaire (UEQ) in different evaluation scenarios. In Lecture Notes in Computer Science (Including Subseries Lecture Notes in Artificial Intelligence and Lecture Notes in Bioinformatics); Springer International Publishing: Crete, Greece, 2014. [Google Scholar]
  2. Vermeeren, A.P.O.S.; Law, E.L.-C.; Roto, V.; Obrist, M.; Hoonhout, J.; Väänänen-Vainio-Mattila, K. User experience evaluation methods. In Proceedings of the 6th Nordic Conference on Human-Computer Interaction Extending Boundaries - NordiCHI ’10, Reykjavik, Iceland, 16–20 October 2010; p. 521. [Google Scholar]
  3. Wallach, D.; Conrad, J.; Steimle, T. The UX metrics table: A missing artifact. In Lecture Notes in Computer Science (Including Subseries Lecture Notes in Artificial Intelligence and Lecture Notes in Bioinformatics); Springer International Publishing: Vancouver, BC, Canada, 2017. [Google Scholar]
  4. ISO DIS 9241-210:2010; Ergonomics of Human-System Interaction. International Standardization Organization (ISO): Geneva, Switzerland, 2010.
  5. Lallemand, C.; Koenig, V. How Could an Intranet be Like a Friend to Me? In Proceedings of the European Conference on Cognitive Ergonomics 2017 - ECCE 2017, Umeå, Sweden, 19–22 September 2017.
  6. Baumgartner, J.; Sonderegger, A.; Sauer, J. No need to read: Developing a pictorial single-item scale for measuring perceived usability. Int. J. Hum. Comput. Stud. 2019, 122, 78–89. [Google Scholar] [CrossRef]
  7. Forster, Y.; Hergeth, S.; Naujoks, F.; Krems, J.F. How Usability Can Save the Day - Methodological Considerations for Making Automated Driving a Success Story. In Proceedings of the 10th International Conference on Automotive User Interfaces and Interactive Vehicular Applications, Toronto, ON, Canada, 23–25 September 2018; pp. 278–290. [Google Scholar]
  8. Klammer, J.; van den Anker, F.W.G. Design, User Experience, and Usability: Users, Contexts and Case Studies; Springer International Publishing: Berlin/Heidelberg, Germany, 2018; Volume 10920. [Google Scholar]
  9. Maia, C.L.B.; Furtado, E.S. A systematic review about user experience evaluation. In Design, User Experience, and Usability: Design Thinking and Methods; Springer International Publishing: Berlin/Heidelberg, Germany, 2016; Volume 9746, pp. 445–455. [Google Scholar]
  10. Ten, A.C.; Paz, F. A systematic review of user experience evaluation methods in information driven websites. In Lecture Notes in Computer Science (Including Subseries Lecture Notes in Artificial Intelligence and Lecture Notes in Bioinformatics); Springer International Publishing: Vancouver, BC, Canada, 2017; Volume 10288, LNCS; pp. 492–506. [Google Scholar]
  11. Lallemand, C.; Koenig, V. How Could an Intranet Be Like a Friend to Me?: Why Standardized UX Scales Don’T Always Fit. In In Proceedings of the European Conference on Cognitive Ergonomics 2017, Umea, Sweden, 19–22 September 2017; pp. 9–16. [Google Scholar]
  12. Likert, R. A Technique For The Measurement of Attitude; Archieves of Psychology: New York, NY, USA, 1932. [Google Scholar]
  13. Osgood, E.C. The Nature and measurement of meaning. Psychol. Bull. 1952, 49, 197–237. [Google Scholar] [CrossRef] [PubMed]
  14. Gronier, G.; Lallemand, C.; Chauvet, A. Mesurer la formation de la première impression d’une interface à l’aide du test des 5 secondes; Huitième Colloque de Psychologie Ergonomique (EPIQUE): Aix-en-Provence, France, 2015. [Google Scholar]
  15. Hassenzahl, M.; Burmester, M.; Koller, F. AttrakDiff: Ein Fragebogen zur Messung wahrgenommener hedonischer und pragmatischer Qualität. In Mensch & Computer 2003: Interaktion in Bewegung; B. G. Teubner: Stuttgart, Germany, 2003; pp. 187–196. [Google Scholar]
  16. Laugwitz, B.; Held, T.; Schrepp, M. Construction and Evaluation of a User Experience Questionnaire. Comput. Sci. 2008. [Google Scholar] [CrossRef]
  17. Minge, M.; Riedel, L. meCUE – Ein modularer Fragebogen zur Erfassung des Nutzungserlebens [meCUE - A modular questionnaire for capturing the user experience]. Mensch und Comput. 2013, 9, 89–98. [Google Scholar]
  18. Liberati, A.; Altman, D.G.; Tetzlaff, J.; Mulrow, C.; Gøtzsche, P.C.; Ioannidis, J.P.A.; Clarke, M.; Devereaux, P.J.; Kleijnen, J.; Moher, D. The PRISMA Statement for Reporting Systematic Reviews and Meta-Analyses of Studies that Evaluate Health Care Interventions: Explanation and Elaboration. PLoS Med. 2009, 62, e1–e34. [Google Scholar]
  19. Minge, M.; Thüring, M.; Wagner, I.; Kuhr, C.V. The meCUE Questionnaire: A Modular Tool for Measuring User Experience; Springer: Cham, Switzerland, 2017; pp. 115–128. [Google Scholar]
  20. Minge, M.; Thüring, M. The MeCUE Questionnaire (2.0): Meeting Five Basic Requirements for Lean and Standardized UX Assessment. In Proceedings of the HCI International 2018, Las Vegas, NV, USA, 15–20 July 2018; Volume 10918, pp. 451–469. [Google Scholar]
  21. Wagner, I.; Minge, M. The gods play dice together: The influence of social elements of gamification on seniors’ user experience. In Communications in Computer and Information Science; Springer International Publishing: Los Angeles, CA, USA, 2015. [Google Scholar]
  22. Pollmann, K.; Sinram, V.; Fronemann, N. Design. Can We Distinguish Pragmatic from Hedonic User Experience Qualities with Implicit Measures? In Proceedings of the HCI International 2018, Las Vegas, NV, USA, 15–20 July 2018; Volume 10918, pp. 509–527. [Google Scholar]
  23. Mõttus, M.; Lamas, D.; Kukk, L. Aesthetic Categories of Interaction: Aesthetic Perceptions on Smartphone and Computer. In Proceedings of the 2017 Federated Conference on Computer Science and Information Systems, Prague, Czech Republic, 3–6 September 2017; Volume 11, pp. 1249–1256. [Google Scholar]
  24. Ali, M. A Data-Driven Knowledge Acquisition System: An End-to-End Knowledge Engineering Process for Generating Production Rules. IEEE Access 2018, 6, 15587–15607. [Google Scholar] [CrossRef]
  25. Gebhardt, S. An Evaluation of a Smart-Phone-Based Menu System for Immersive Virtual Environments. In Proceedings of the 2014 IEEE Symp. 3D User Interfaces, Minneapolis, MN, USA, 29–30 March 2014; pp. 31–34. [Google Scholar]
  26. Gebhardt, S.; Pick, S.; Leithold, F.; Hentschel, B.; Kuhlen, T. Extended Pie Menus for Immersive Virtual Environments. IEEE Trans. Vis. Comput. Graph. 2013, 19, 644–651. [Google Scholar] [CrossRef] [PubMed]
Figure 1. PRISMA flow diagram for this Systematic Literature Review.
Proceedings 31 00014 g001
Figure 2. Total uses of standardized questionnaires by year, summarizing all three questionnaires.
Proceedings 31 00014 g002
Figure 3. Total uses of standardized questionnaires by year, summarized by questionnaire.
Proceedings 31 00014 g003
Figure 4. Total uses of standardized questionnaires in Europe.
Proceedings 31 00014 g004
Figure 5. Number of participants on the studies without considering 61 identified outliers: 21 studies with samples between 72 and 100 participants, 27 studies with samples between 101 and 186, and 13 studies with samples greater or equal to 200. Additionally, in five studies, the sample size could not be established.
Proceedings 31 00014 g005
Figure 6. Additional methods used in combination with the three standardized questionnaires.
Proceedings 31 00014 g006
Table 1. Distribution of papers by source
SourceQuery ResultTitle and Abstract ReviewedTitle and Abstract IncludedFull Paper ReviewedFull Paper Included (*)
ACM351348304304234 a
IEEE Xplore14514413213294 b
Springer Link343340250250166 c
Science Direct107107717154 d
Total946939757757548
Percentage100.0%99.3%80.0%80.0%57.9%
(*) (Supplementary file) References for the 548 papers analyzed in the full text review are available at: http://citic.ucr.ac.cr/sites/default/files/SLR_References_IDO.pdf; a: ref. 5, 27259; b: ref. 260353; c: ref. 1,354518; d: ref. 519572.
Table 2. Total number of uses of standardized questionnaires
QuestionnaireAttrakDiffUEQmeCUETotal
Uses34120012553
Percentage61.6%36.2%2.2%100%
Table 3. Total number of uses of standardized questionnaires by geographical region.
QuestionnaireEuropeAsiaNorth AmericaSouth AmericaOceaniaMore than one Region
AttrakDiff303710857
UEQ1502510743
meCUE101 1
Total4633320151010
Percentage84.0%6.0%3.6%2.7%1.8%1.8%
Publisher’s Note: MDPI stays neutral with regard to jurisdictional claims in published maps and institutional affiliations.

