BAIS2: Burned Area Index for Sentinel-2 †


Independent Scientist, Via Michelangelo Tamburini 8, 00154 Roma, Italy
†
Presented at the 2nd International Electronic Conference on Remote Sensing, 22 March–5 April 2018; Available online: https://sciforum.net/conference/ecrs-2.
Proceedings 2018, 2(7), 364; https://doi.org/10.3390/ecrs-2-05177
Published: 22 March 2018
(This article belongs to the Proceedings of The 2nd International Electronic Conference on Remote Sensing)
Abstract
:Accurate and rapid mapping of fire damaged areas is fundamental to support fire management, account for environmental loss, define planning strategies and monitor the restoration of vegetation. Under climate change conditions, drought severity may trigger tough fire regimes, in terms of number and dimension of fires. In order to deliver rapid information about areas damaged by fires, Burned Area Index (BAI), Normalized Burn Ratio (NBR), and their relative versions have been largely employed in the past to map burned areas from high resolution optical satellite data. The new MSI sensor aboard Sentinel-2 satellites carries more spectral information recorded in the red-edge spectral region, opening the way to the development of new indices for burned area mapping. This study present a newly developed Burned Area Index for Sentinel-2 (BAIS2), based on Sentinel-2 spectral bands, to detect burned areas at 20 m spatial resolution and the design of a processor developed to perform post-fire mapping using Sentinel-2 data. The new index has been tested on various study cases in Italy for summer 2017 fires, and results show a good performance of the index and highlighted critical issues related to the Sentinel-2 data processing.
Keywords:
BAIS2; burned area index; Sentinel-2; wildfire; fire severity; operational service; biophysical1. Introduction
Wildfire is an important disturbance factor for the
ecosystems that induces land-cover modification and change [1] and a significant source of gas and aerosols
worldwide [2]. Under climate change
conditions, drought severity may trigger tough fire regimes, in terms of number
and dimension of fires. The year2017 was characterized by a harsh fire season
in the Mediterranean area, especially for Portugal, Italy, Spain, Croatia, and Bosnia
and Herzegovina.
Satellite data play a major role in supporting
knowledge about fire severity by delivering rapid information to map areas
damaged by fire in an accurately and prompt way. Accurate and rapid mapping of
fire damaged areas is fundamental to support fire management, account for
environmental loss, define planning strategies, and monitor the restoration of
vegetation. Remote sensing (RS) tools have proven useful to accurately estimate
fire-affected areas and burn severity, to aid in forest fire prevention,
assessment, and monitoring on global, regional, and local scales [3]. Rapid post-fire mapping of the spatial extent
of the areas affected by fires burned area still represent an indispensable
requirement to support fire management.
Generally speaking, post-fire mapping can be
inferred from satellite remotely sensed spectra applying two different
approaches: using a single satellite image or using multitemporal satellite
images, usually adopting a combination of pre-fire and post-fire satellite
acquisitions. Fire severity is often estimated by visual inspection or measured
in situ by means of field observations of several ecological parameters [4], the most widely used approach for assessing
post-fire effects in the field are the Composite Burn Index (CBI), [5] and its modified versions Geometrically
structure CBI and weighted-CBI [6].
Several methods have been developed for mapping
fire-affected areas from multitemporal or single post-fire satellite images [7]. Threshold-based classification of Normalized
Burn Ratio difference (dNBR) [5] has turned
into a methodological reference to obtain burn severity maps [6]. However, no agreement exists on which index
performs best in the detection of fire-affected areas and in the estimation of
fire severity and in which conditions it has to be preferred [8].
Operational services based on the methodological
references for burned area mapping have been developed in the past years to
provide near–real time information on wildland fires. Through an activation
request, the Copernicus Emergency Management Service (EMS) delivers high spatial
resolution wildfire maps generated from satellite data to determine the
perimeter of the fires and distribution of four fire severity levels [4,9]. On the other side, the European Forest Fire
Information System (EFFIS) supports the services in charge of the protection of
forests against fires in the EU countries with updated and reliable near-real
time information on wildland fires at mid-low spatial resolution from optical
and thermal satellite data.
In recent years, the large availability of satellite
high spatial resolution optical data—like the MSI sensor aboard Sentinel-2 (S2)
satellites, equipped with specific spectral bands to record data in the
vegetation red-edge spectral domain, which is one of the best radiance based
descriptors of chlorophyll content [10]—opened
the way to the development and application of new spectral indices for
discriminating burn severity. Recent studies have successfully assessed burn
severity using S2 data through the comparison of pre-fire post-fire satellite
acquisitions [4,11,12,13,14] and showed the
suitability of already existing red-edge spectral indices for discriminating
burn severity [11], and the different S2 MSI
spectral bands for the burned area detection [12,14],
suggesting the potential and need for further research to develop a systematic
S2 MSI burned area mapping capability.
This study presents the new BAIS2 (Burned Area
Index for Sentinel-2) spectral index for burned area mapping, specifically
designed to take advantage of the S2 MSI spectral characteristics and adopting
spectral combination of bands which have been demonstrated to be suitable for
post-fire burned area detection. The derived dBAIS2 index (Difference Burned
Area Index for Sentinel-2) is based on the arithmetic difference between
pre-fire BAIS2 and post-fire BAIS2 estimates.
BAIS2 and dBAIS2 have been used to map wildfires
occurred in July 2017, results have been compared with the reference NBR and
dNBR indices and with the grading maps of Copernicus EMS products. Finally, the
design of a processor based on BAIS2 and dBAIS2 indices for high resolution
wildfire mapping is presented. The processor could be implemented as an
operational service to support knowledge about wildfire occurrences profiting
from fire severity estimation, loss of vegetation estimation and to monitor
post-fire ecosystem responses.
2. Materials and Methods
The study area (Figure
1a) is located in the Sicily region (southern Italy), where many
wildfires happened in July 2017, burning 110.21 km2 of land on a
total of 5231.56 km2, according to the Copernicus EMS products.
Copernicus EMS
products (ID: EMSR213) were used as reference truth for the activations
numbered in Figure 1a. Some study cases already considered the
analysis performed by the EMS, produced with a fire grading map with four burn
severity levels, as reference truth for testing satellite derived spectral
indices for burned area detection [4,11]. EMS products represent a valid alternative to
classical validation measurements, that could require a big effort in terms of
economic and time effort.
Two S2 acquisitions over the study area, whose
granule footprints are displayed in Figure 1a,
have been used for the analysis. S2A data acquired on 07/07/2017 at 09:50:29
UTC was used as pre-fire, and S2B data acquired on 22/07/2017 at 09:50:29 UTC (Figure 1b) was used as post-fire image. Since
Copernicus EMS products were generated using different pre- and post-fire
acquisitions for the AOIs, only grading polygons corresponding to fires
occurred in were visually selected as reference truth (Figure 1b).
S2 data were atmospherically corrected to L2A
bottom of atmosphere reflectances using Sen2cor algorithm [15], applying the Bidirectional Reflectance
Distribution Function (BRDF) correction using method ‘21’, and later resampled
to 20 m spatial resolution. Then the biophysical processor [16] was used to compute Leaf Area Index (LAI) from
L2A atmospherically corrected data.
Later Water Pixels (WP) were masked from the images
applying the following formula:
The BAIS2 index was computed according to the
following formula:
The novelty introduced in the Equation (2) for detecting fire affected areas is the use of a band ratio in the red-edge spectral domain, which aim to describe vegetation properties, combined with a band ratio to detect the radiometric response of the SWIR spectral domain, largely recognized to be efficient in the determination of burned areas.
In order to compare BAIS2 with the reference spectral index used for burned area mapping, NBR was computed according to the formula:
The derived dBAIS2 and dNBR indices were computed as the arithmetic difference between pre-fire and post-fire estimates.
Spectral sensitivity of the calculated indices for burned area and severity estimation has been assesses using the Separability Index (SI), adopted in similar studies [8,12,17,18,19].
where μb and μu are the mean values of the considered indices for burned and unburned sample areas delineated over the imagery, and σb and σu are the standard deviations of the respective indices.
Statistics on computed spectral indices were calculated for burned and unburned areas and for the different grading levels delimited in Copernicus EMS products, and representing (ordered by severity level) negligible to slight damaged area, moderately damaged area, highly damaged area, and completely destroyed area.
3. Results
Statistics of the SI calculation are reported in Table 1. BAIS2 and its dBAIS2 derived version obtained a score slightly higher than the correspondent NBR index.
4. Discussion
The present BAIS2 benefits from vegetation properties described in the red-edge spectral domains and the radiometric response in the SWIR spectral domain, largely recognized to be efficient in the determination of burned areas. The use S2 spectral information allows to map burned areas at 20 m and to identify small burned areas.
The S2 MSI sensor (see Table S1 for details) records data in the vegetation red-edge spectral domain which is one of the best radiance based descriptors of chlorophyll content [10]. Such spectral characteristics makes S2 a valuable instrument for post-fire monitoring [4], with a great potential for discriminating burn severity levels in a fire [11]. Recently, it has been demonstrated that most suitable S2 MSI spectral indices to discriminate burn severity are the indices based on B5, red-edge close to red wavelengths mainly associated to variations in chlorophyll content, and B7 or B8, red-edge close to NIR or NIR, mainly related to variations in leaf structure. Further, the adoption of the narrowband NIR (B8A) instead of broadband NIR (B8) in the calculation of spectral indices for post-fire has been already demonstrated not to bring significant differences [11].
A resulting score from SI calculation that is larger than 1 should allow a good separation of burned areas, while a value smaller than 1 suggests poor discriminatory capability [19]. Results obtained from this study are significantly different from those obtained by [12], indicating that such scores may be strongly dependent on the considered dataset. Misclassification problems at low fire severity levels are common and have been already reported by different studies [13,20].
The preprocessing phase of S2 data highlighted critical issues related to the existence of extremely dark pixels that can be the source of commission errors in the classification of burned pixels from BAIS2 estimates. In particular, a proper water area masking should be adopted to remove the dark areas due to water spectrum absorption, and the cloud shadow pixels should be removed from image and bidirectional reflectance distribution function (BRDF) should be minimized to enable reliable mapping of surface features and the detection of surface change and to provide consistent sensor data comparison. The S2 BRDF effects have been found to be quite large and are expected to be greater than for other high-resolution satellite optical data (i.e., Landsat) due to the wider 20.6° sensor field of view, constituting a significant source of noise for certain applications [21].
The adoption of difference indices (i.e., dBAIS2 and dNBR) is demonstrated to gather better results when compared to a single temporal observation because they rely on the estimation of changing vegetation cover. In order to reduce burned areas classification errors, the use of difference indices is recommended, together with the use of dense time series in order to identify the exact time at which wildfires occurred and to reduce errors due to the SWIR variability resulting from charcoal removal [11] and to vegetation restoration.
Differences among values BAIS2 and LAI (Figure 2) have been highlighted through a comparison of the two products. The difference between spectral indices and biophysical estimates suggests further investigation to identify the suitability of using biophysical estimates (i.e., LAI) for the evaluation of fire severity levels in a more comprehensive manner.
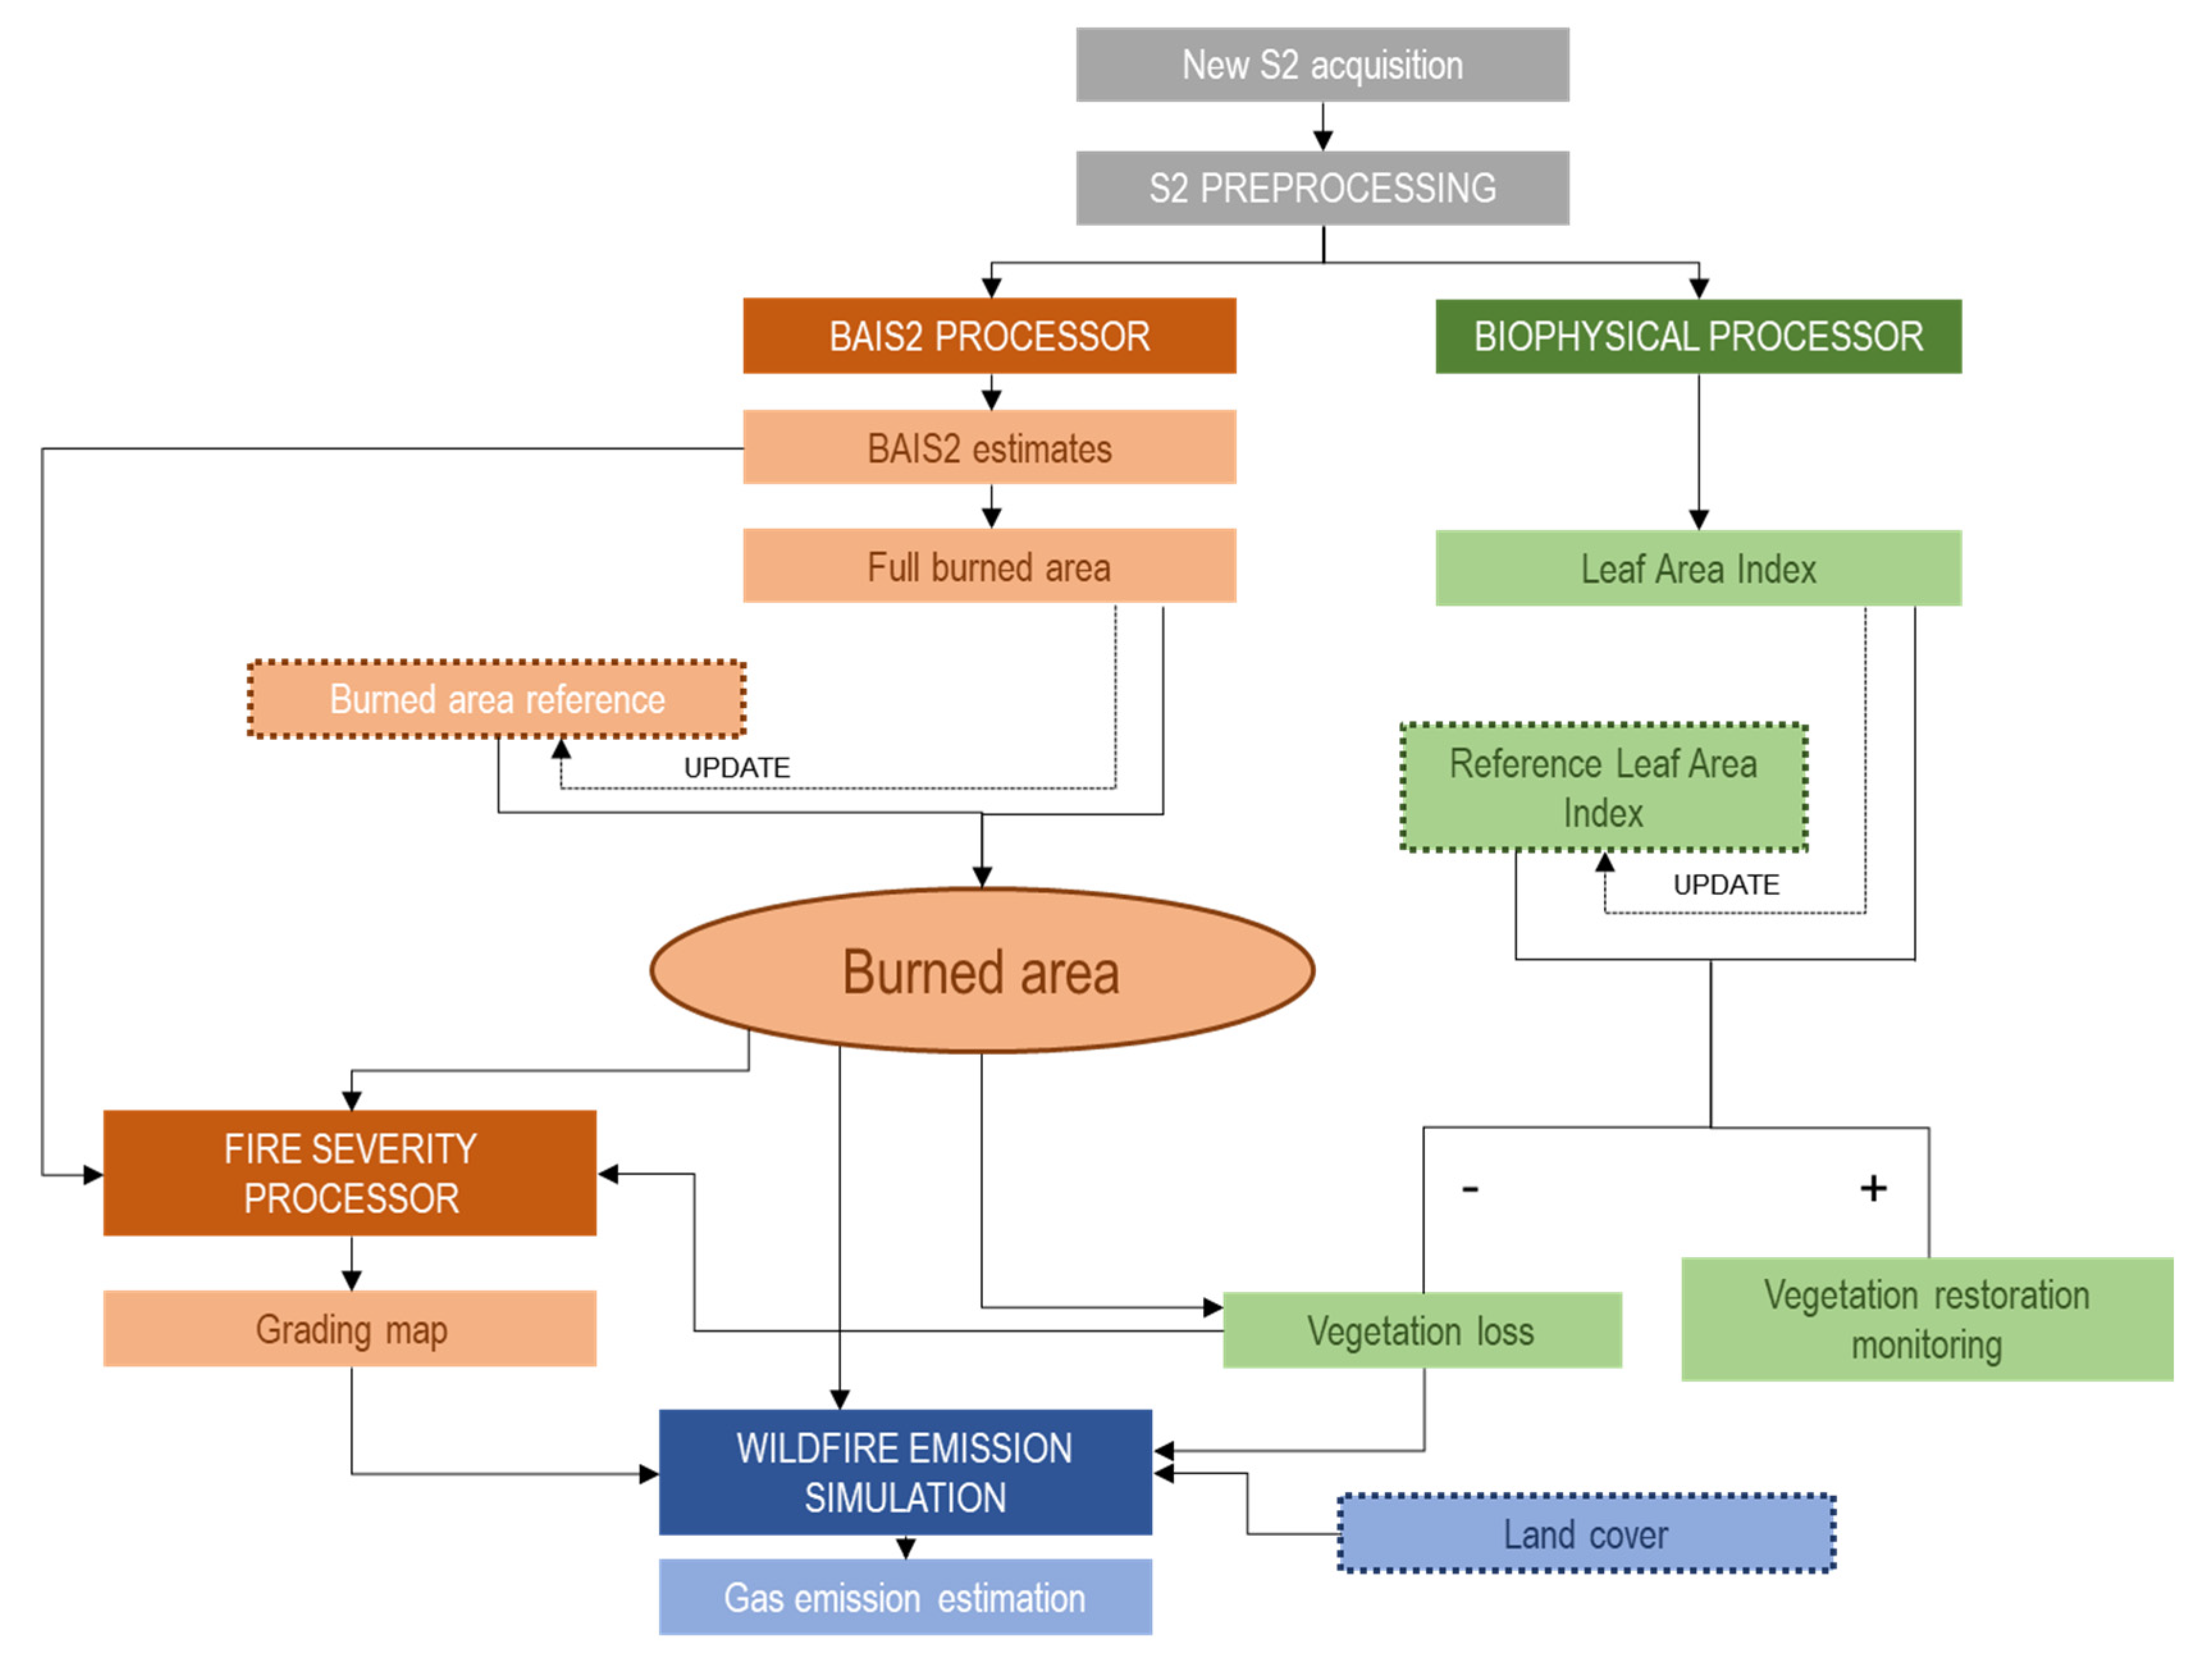
As a final outcome, the design of an operational service to support knowledge about wildfire, including the use of BAIS2 index, is presented in Figure 3.
5. Conclusions
The new BAIS2 spectral index for burned area mapping specifically designed to take advantage of the S2 MSI spectral characteristics was presented. Results from the comparison with NBR index and Copernicus EMS products showed a good performance of BAIS2 for the detection of burned areas, highlighting critical issues related to S2 data processing and stimulating the need to make use of biophysical parameters to estimate fire severity in a more comprehensive manner.
The processor could be implemented in an operational service to support knowledge about wildfire occurrences profiting from fire severity estimation, loss of vegetation estimation, and to monitor post-fire ecosystem responses.
Supplementary Materials
The following are available online at https://www.mdpi.com/2504-3900/2/7/364/s1.
Acknowledgments
Sentinel 2 MSI data used were available at no cost from ESA Sentinels Scientific Data Hub. This work contains modified Copernicus Sentinel data and Copernicus Service information (2018). The author is grateful to the many individuals working on the development of free and open-source software for supporting the sharing of knowledge. The author would like to thank ISPRA (Istituto Superiore per la Protezione e la Ricerca Ambientale) colleagues for stimulating the need of a wildfire mapping operational service.
Conflicts of Interest
The author declares no conflict of interest.
References
- Thonicke, K.; Venevsky, S.; Sitch, S.; Cramer, W. The role of fire disturbance for global vegetation dynamics: Coupling fire into a Dynamic Global Vegetation Model. Glob. Ecol. Biogeogr. 2001, 10, 661–677. [Google Scholar] [CrossRef]
- French, N.H.F.; Kasischke, E.S.; Williams, D.G. Variability in the emissions of carbon-based trace gases from wildfire in the Alaskan boreal forest. J. Geophys. Res. 2003, 107, 8151. [Google Scholar] [CrossRef]
- Chuvieco, E. Global impacts of fire. In Earth Observation of Wildland Fires in Mediterranean Ecosystems; Chuvieco, E., Ed.; Springer: Berlin/Heidelberg, Germany, 2009; pp. 1–11. [Google Scholar]
- Navarro, G.; Caballero, I.; Silva, G.; Parra, P.C.; Vázquez, A.; Caldeira, R. Evaluation of forest fire on Madeira Island using Sentinel-2A MSI imagery. Int. J. Appl. Earth Obs. Geoinf. 2017, 58, 97–106. [Google Scholar] [CrossRef]
- Key, C.; Benson, N. Landscape Assessment: Ground Measure of Severity, the Composite Burn Index; and Remote Sensing of Severity, the Normalized Burn Ratio. In FIREMON: Fire Effects Monitoring and Inventory System; US Department of Agriculture: Fort Collins, CO, USA,, 2006; pp. 219–279. [Google Scholar]
- Soverel, N.; Perrakis, D.; Coops, N. Estimating Burn Severity from Landsat dNBR and RdNBR Indices across Western Canada. Remote Sens. Environ. 2010, 114, 1896–1909. [Google Scholar] [CrossRef]
- Boschetti, M.; Stroppiana, D.; Brivio, P.A. Mapping burned areas in a Mediterranean environment using soft integration of Spectral Indices from high-resolution satellite images. Earth Int. 2010, 14, 1–20. [Google Scholar] [CrossRef]
- Lasaponara, R. Estimating spectral separability of satellite derived parameters for burned areas mapping in the Calabria region by using SPOT-Vegetation data. Ecol. Modell. 2006, 196, 265–270. [Google Scholar] [CrossRef]
- EMSR213. Forest Fire in Southern Italy. 2016. Available online: http://emergency.copernicus.eu/mapping/list-of-components/EMSR213 (accessed on 8 February 2018).
- Curran, P.J.; Dungan, J.L.; Gholz, H.L. Exploring the relationship between reflectance red edge and chlorophyll content in slash pine. Tree Physiol. 1990, 7, 33–48. [Google Scholar] [CrossRef] [PubMed]
- Fernández-Manso, A.; Fernández-Manso, O.; Quintano, C. SENTINEL-2A red-edge spectral indices suitability for discriminating burn severity. Int. J. Appl. Earth Obs. Geoinf. 2016, 50, 170–175. [Google Scholar] [CrossRef]
- Mallinis, G.; Mitsopoulos, I.; Chrysafi, I. Evaluating and comparing Sentinel 2A and Landsat-8 Operational Land Imager (OLI) spectral indices for estimating fire severity in a Mediterranean pine ecosystem of Greece. GISci. Remote Sens. 2018, 55, 1–18. [Google Scholar] [CrossRef]
- Quintano, C.; Fernández-Manso, A.; Fernández-Manso, O. Combination of Landsat and Sentinel-2 MSI data for initial assessing of burn severity. Int. J. Appl. Earth Obs. Geoinf. 2018, 64, 221–225. [Google Scholar] [CrossRef]
- Huang, H.; Roy, D.P.; Boschetti, L.; Zhang, H.K.; Yan, L.; Kumar, S.S.; Gomez-Dans, J.; Li, J. Separability analysis of Sentinel-2A multi-spectral instrument (MSI) data for burned area discrimination. Remote Sens. 2016, 8, 873. [Google Scholar] [CrossRef]
- Louis, J.; Debaecker, V.; Pflug, B.; Main-Knorn, M.; Bieniarz, J.; Mueller-Wilm, U.; Cadau, E.; Gascon, F. Sentinel-2 Sen2Cor: L2A Processor for Users. In Proceedings of the Living Planet Symposium, Prague, Czech Republic, 9–13 May 2016; pp. 1–8. [Google Scholar]
- Available online: http://step.esa.int/docs/extra/ATBD_S2ToolBox_L2B_V1.1.pdf (accessed on 7 May 2018 ).
- Kaufman, Y.; Remer, L. Detection of Forests Using mid-IR Reflectance: An Application for Aerosol Studies. IEEE Trans. Geosci. Remote Sens. 1994, 32, 672–683. [Google Scholar] [CrossRef]
- Pereira, J. A Comparative Evaluation of NOAA/AVHRR Vegetation Indexes for Burned Surface Detection and Mapping. IEEE Trans. Geosci. Remote Sens. 1999, 37, 217–226. [Google Scholar] [CrossRef]
- Veraverbeke, S.; Lhermitte, S.; Verstraeten, W.; Goossens, R. Evaluation of Pre/Post-Fire Differenced Spectral Indices for Assessing Burn Severity in a Mediterranean Environment with Landsat Thematic Mapper. Int. J. Remote Sens. 2001, 32, 3521–3537. [Google Scholar] [CrossRef]
- Cocke, A.E.; Fulé, P.Z.; Crouse, J.E. Comparison of burn severity assessments using differenced normalized burn ratio and ground data. Int. J. Wildland Fire 2005, 14, 189–198. [Google Scholar] [CrossRef]
- Roy, D.P.; Li, J.; Zhang, H.K.; Yan, L.; Huang, H.; Li, Z. Examination of Sentinel-2A multi-spectral instrument (MSI) reflectance anisotropy and the suitability of a general method to normalize MSI reflectance to nadir BRDF adjusted reflectance. Remote Sens. Environ. 2017, 199, 25–38. [Google Scholar] [CrossRef]
Figure 1.
(a) Study area location, with the extent of the four Sentinel-2 granules used and the Copernicus Emergency Management Service (EMS) Areas Of Interest (AOIs) of the products used for the analysis; (b) Detailed focus map of the area of Messina. Background: Sentinel-2B image acquired on 22/07/2017 at 09:50:29 UTC displayed in false color (R: BOA reflectance at 1610 nm; G: BOA reflectance at 864 nm; B: BOA reflectance at 665 nm). Overlay: burned areas from Copernicus EMS products.

Figure 2.
(a) Detailed focus map of the area of Messina showing Burned Area Index for Sentinel-2 (BAIS2) values in the burned area polygons of Copernicus EMS products; (b) Detailed focus map of the area of Messina showing Leaf Area Index (LAI) computed for the S2 acquisition of 07/07/2017 at 09:50:29 UTC with ∆LAI overlay reporting LAI loss in the burned area polygons of Copernicus EMS products.

Figure 3.
Design of a processor to be developed as operational service to support knowledge about wildfires.
Figure 3.
Design of a processor to be developed as operational service to support knowledge about wildfires.


Table 1.
Separability Index (SI)value of the four indices computed for the Copernicus EMS area of activations.
Table 1.
Separability Index (SI)value of the four indices computed for the Copernicus EMS area of activations.
| BAIS2 | NBR | dBAIS2 | dNBR |
|---|---|---|---|
| 0.865 | 0.848 | 1.337 | 1.324 |
Publisher’s Note: MDPI stays neutral with regard to jurisdictional claims in published maps and institutional affiliations. |
© 2018 by the author. Licensee MDPI, Basel, Switzerland. This article is an open access article distributed under the terms and conditions of the Creative Commons Attribution (CC BY) license (https://creativecommons.org/licenses/by/4.0/).
Share and Cite
MDPI and ACS Style
Filipponi, F. BAIS2: Burned Area Index for Sentinel-2. Proceedings 2018, 2, 364. https://doi.org/10.3390/ecrs-2-05177
AMA Style
Filipponi F. BAIS2: Burned Area Index for Sentinel-2. Proceedings. 2018; 2(7):364. https://doi.org/10.3390/ecrs-2-05177
Chicago/Turabian StyleFilipponi, Federico. 2018. "BAIS2: Burned Area Index for Sentinel-2" Proceedings 2, no. 7: 364. https://doi.org/10.3390/ecrs-2-05177