Article

Relationship between Remanence and Micromorphology of Nd-Fe-B Permanent Magnets Revealed by Fractal Theory and EBSD Data

1
School of Materials Science and Engineering, Northeastern University, Shenyang 110819, China
2
Division of Functional Materials, Central Iron and Steel Research Institute, Beijing 100081, China
*
Authors to whom correspondence should be addressed.
Fractal Fract. 2023, 7(5), 393; https://doi.org/10.3390/fractalfract7050393
Submission received: 9 December 2022 / Revised: 3 April 2023 / Accepted: 30 April 2023 / Published: 9 May 2023
(This article belongs to the Special Issue Fractal Mechanics of Engineering Materials)

Abstract

:
Remanence is an important parameter of magnetic property for Nd-Fe-B magnets, and high remanent magnetization is a prerequisite for high-performance magnets. In this paper, the surface morphology perpendicular to the texture orientation direction and parallel to the texture orientation direction is analyzed by Nd-Fe-B permanent magnets with different compositions. For the first time, the relationship between the remanence of a magnet and the degree of texture orientation is explained in depth using the fractal dimension. The fractal dimension of surface morphology combined with the remanence equation yields the degree of texture orientation of the magnet, which is in agreement with the trend of the squareness factor of the demagnetization curves. Among the three samples, the Nd-Fe-B sample has the highest degree of texture orientation, the Pr-Nd-Fe-B sample has the lowest degree of texture orientation, and the Nd-Ce-Fe-B sample is in between the first two. The multiples of uniform (pole) density obtained by EBSD further prove the correctness of the degree of texture orientation calculated by the fractal dimension. The combination of EBSD morphology and fractal dimension to obtain novel insights into the correlation between remanence and the degree of texture orientation will contribute to the development of high-performance Nd-Fe-B with high remanence.

1. Introduction

Nd-Fe-B permanent magnets are widely used in green energy technologies such as wind turbines and electric vehicles [1,2]. The performance evaluation of sintered Nd-Fe-B permanent magnets is mainly expressed in terms of the following parameters: maximum energy product, coercivity, and remanence, where the level of coercivity is related to the applicable temperature of the magnet. The thermal stability of coercivity is generally enhanced by the substitution of heavy rare earths (HREs) or HRE grain boundary diffusion [3]. The expensive price of HREs limits their use in industrial production in large quantities. The magnets prepared by the dual-main-phase (DMP) process allow the successful application of light rare earths (LREs) resources in industrial production, which alleviates the problem of unbalanced utilization of medium rare earths, HREs, and LREs resources [4,5,6]. DMP magnets have higher remanence than single-main-phase magnets for the same nominal composition. The key magnetic parameter that determines the maximum energy product is remanence, and high remanence is a prerequisite for high-performance Nd-Fe-B magnets. To have a high remanence, the magnets with the same nominal composition require a strong c-axis <001> texture orientation structure, which means that the 2:14:1 main phase grains of the magnet have a strong tendency to align along the easy magnetization axis. Therefore, micron-sized magnetic powders that have undergone hydrogen decrepitation and jet milling are pressed into green compacts under the action of an applied magnetic field to ensure that the powders have a good degree of texture orientation during the process of magnet preparation.
The degree of texture orientation can be characterized by X-ray diffraction. The degree of texture is generally obtained directly from polar figures or rocking curve measurements [7]. Alternatively, the ratio of (006) and (105) diffraction peak intensities obtained by θ-2θ scanning is used as a measure of the degree of c-axis orientation. However, the macroscale diffraction data has a large bias because the instrument has a broadening error of about 3 degrees [8]. Electron backscatter diffraction (SEM-EBSD) shows its unique advantages as a micron-level texture characterization because it can simultaneously both grain geometry and grain orientation information [9,10]. The calibration of the Kikuchi pattern allows for the determination of the crystal structure and grain orientation of the sample. The distribution of grains with different orientations can be finely displayed in different colors using an inverse pole figure (IPF). High- or low-angle grain boundaries can be obtained by misorientation between grains. The phase map of multi-phase materials can be obtained by linking it with the energy dispersive spectrometer (EDS). Researchers have done some studies on the texture orientation and phase map of Nd-Fe-B magnets as well as the correlation between the magnetic domain size and the texture using EBSD [11,12,13,14,15,16].
The fractal theory originates from the self-similarity between the whole and the parts. The fractal dimension differs from the traditional dimension in that it is a measure of self-similarity that reflects the degree of similarity between a tiny region and the whole [17]. Regular fractal structures have strict self-similarity, and irregular fractal structures have statistical self-similarity. The introduction of fractal theory into the analysis of material microstructures has largely enriched the study of materials science [18,19]. We first introduced linear fractal dimension into the analysis of the fractal morphology of permanent magnet materials [20]. E. M. Semenova determined the fractal dimension of the atomic force microscopy image of Sm(CoCuFe)5 alloy at different scales, while the average fractal dimension is practically the same [21]. A. D. Zigert established a relationship between the magnetic state (demagnetized state, partially magnetized by the external field) and the fractal dimension of the changed magnetic domain structure of ferrite garnet magnetic films [22]. Recently, we revealed the relationship between the fractal dimension and the coercivity of permanent magnets through the complex microstructural information of the fractal surface [23]. The unique advantages exhibited by fractal theory in microstructure analysis prompted us to further explore the correlation between microstructure and the magnetic properties of Nd-Fe-B permanent magnets. In the present work, the fractal dimension is used for the first time to give new insights into the relationship between the remanence (the key parameters affecting the magnetic energy product) and the degree of magnet texture orientation. Information on the degree of texture orientation is obtained by the analysis of the surface morphology with fractal structure, which is consistent with the texture orientation reflected by the squareness factor and the value of the multiples of uniform (pole) density (MUD) obtained from the EBSD inverse pole figure. New insight into the correlation between remanence and the degree of texture orientation will contribute to the development of high-performance Nd-Fe-B permanent magnets with high remanence.

2. Experimental

Nd-Fe-B permanent magnets were prepared using the traditional powder metallurgy process. The magnets with nominal compositions of Nd30FebalM0.3B1, (Nd0.76Pr0.24)30FebalM0.3B1, and (Nd0.64Ce0.36)30FebalM0.3B1 (M=Co, Cu, Al, Ga) in wt.% were prepared. According to the diversity of remanence, the samples were named S1 (Nd30FebalM0.3B1), S2 ((Nd0.76Pr0.24)30FebalM0.3B1), and S3 ((Nd0.64Ce0.36)30FebalM0.3B1), respectively. Each magnet was machined into a cylinder with ϕ10*10 mm and a cuboid with 4 × 4 × 8 mm, while a total of six samples were used for EBSD analysis. The test surface of the cylindrical sample is the polished surface perpendicular to the c-axis orientation direction, as shown in Figure 1a. The test surface of a rectangular sample is the polished surface parallel to the c-axis orientation direction, as shown in Figure 1c. A multi-functional field emission scanning electron microscope (JSM-7200F, JEOL) equipped with an EDAX velocity super ultrafast electron backscattered diffraction (EBSD) probe was used to obtain the high-quality orientation data. Characterization of the magnetic properties of the magnets was conducted using demagnetization curves, which were obtained on a NIM 6500C hysteresigraph analyzer system. The fractal dimension is related to the micromorphology of Nd-Fe-B permanent magnets. The profile of the grain can be represented by the EBSD orientation map. As shown in Figure 1b,d, the X-axis orientation figures of the samples are chosen as the micromorphology of the magnet because only those in both directions of the EBSD data for the same sample are similar, which is not relevant for the different distortions of crystallographic texture. The box-counting dimension method based on the image processing function in MATLAB is adopted to calculate the fractal dimension of micromorphology for Nd-Fe-B permanent magnets. The figures of the magnets’ micromorphology are first processed as graphs of two colors, black and white, called binary images. Black and white are represented by the binary numbers 0 and 1, respectively. In this way, the picture information is transformed into a two-dimensional matrix consisting of 0 s and 1 s. The matrix file can be covered by several boxes, and then the fractal dimension of the image is calculated using the matrix. The negative value of the slope obtained by fitting the number of covered boxes and different side lengths in double logarithmic coordinates using least squares is the fractal dimension. The fractal dimension is calculated using the following equation [23]:
D k = lim δ k 0 log N k log 1 δ k
The weighted average FD is defined by the equation:
D = 1 n D k 1 n k
where N k is the number of boxes, δ k is the side length of the box composed of k pixels, and k = 1, 2, 3, … n. According to the definition of fractal dimension, the smaller the side length of the box, the more accurate the computed dimension of the image. In the process of calculating the fractal dimension, the box edge length is capped at 15-pixel points in length, so that there are enough boxes in the image to ensure that the resulting data is accurate without distortion.

3. Results and Discussions

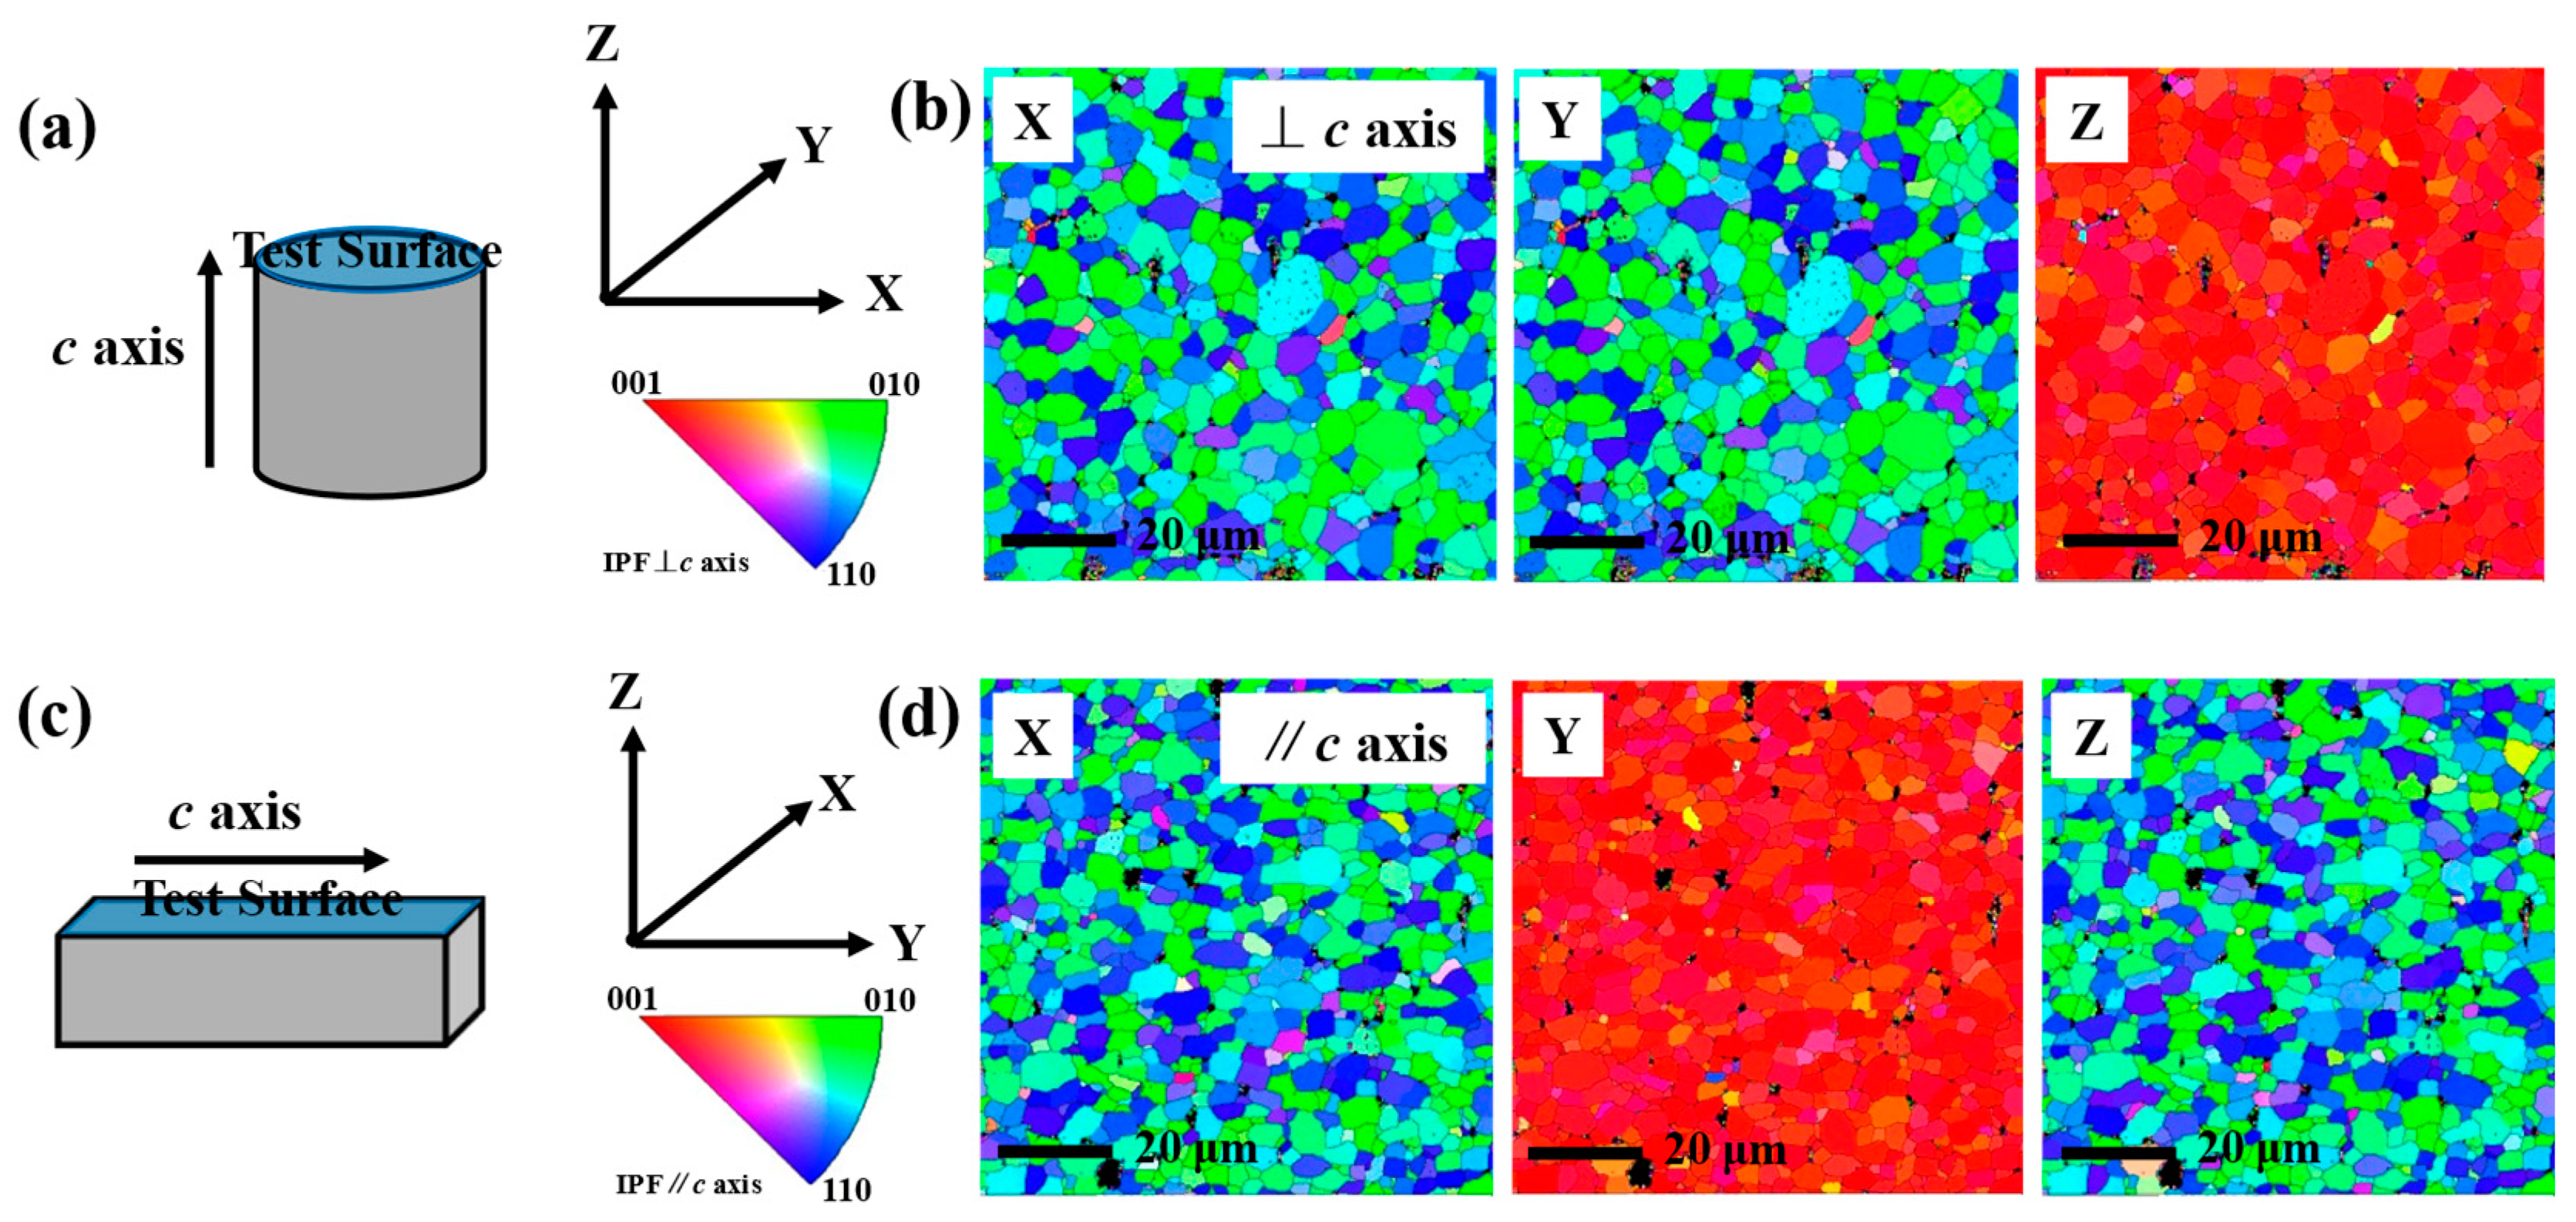
Figure 1 shows the schematic diagram of the sample for EBSD measurement and the corresponding IPF orientation maps for the surfaces perpendicular to (parallel to) the c-axis orientation direction. The test surface in Figure 1a is the surface perpendicular to the direction of the c-axis orientation, i.e., the (001) plane. The results are shown in Figure 1b, where sample X and Y directions correspond to the <010> or <110> direction, and sample Z direction corresponds to the <001> direction. Figure 1c is the surface parallel to the direction of the c-axis orientation, i.e., the (110) plane. The results are shown in Figure 1d, where sample X, Z directions correspond to the <010> or <110> direction, and sample Y directions correspond to the <001> direction. The color scales show that red represents the <001> direction, green represents the <010> direction, and blue represents the <110> direction. According to the description of the color scale, magnets with strong <001> texture will demonstrate red grains, such as the sample Z direction in Figure 1b and the sample Y direction in Figure 1d. The misaligned grains will display other colors. It is worth noting that there are some black areas in the EBSD orientation maps. They are the impurity phases that cannot be identified outside of the 2:14:1 main phase and are usually considered nonmagnetic phases. The nonmagnetic phase is dilutive to the remanence of the magnet; the volume fraction of the nonmagnetic phase is lower in magnets with higher remanence.
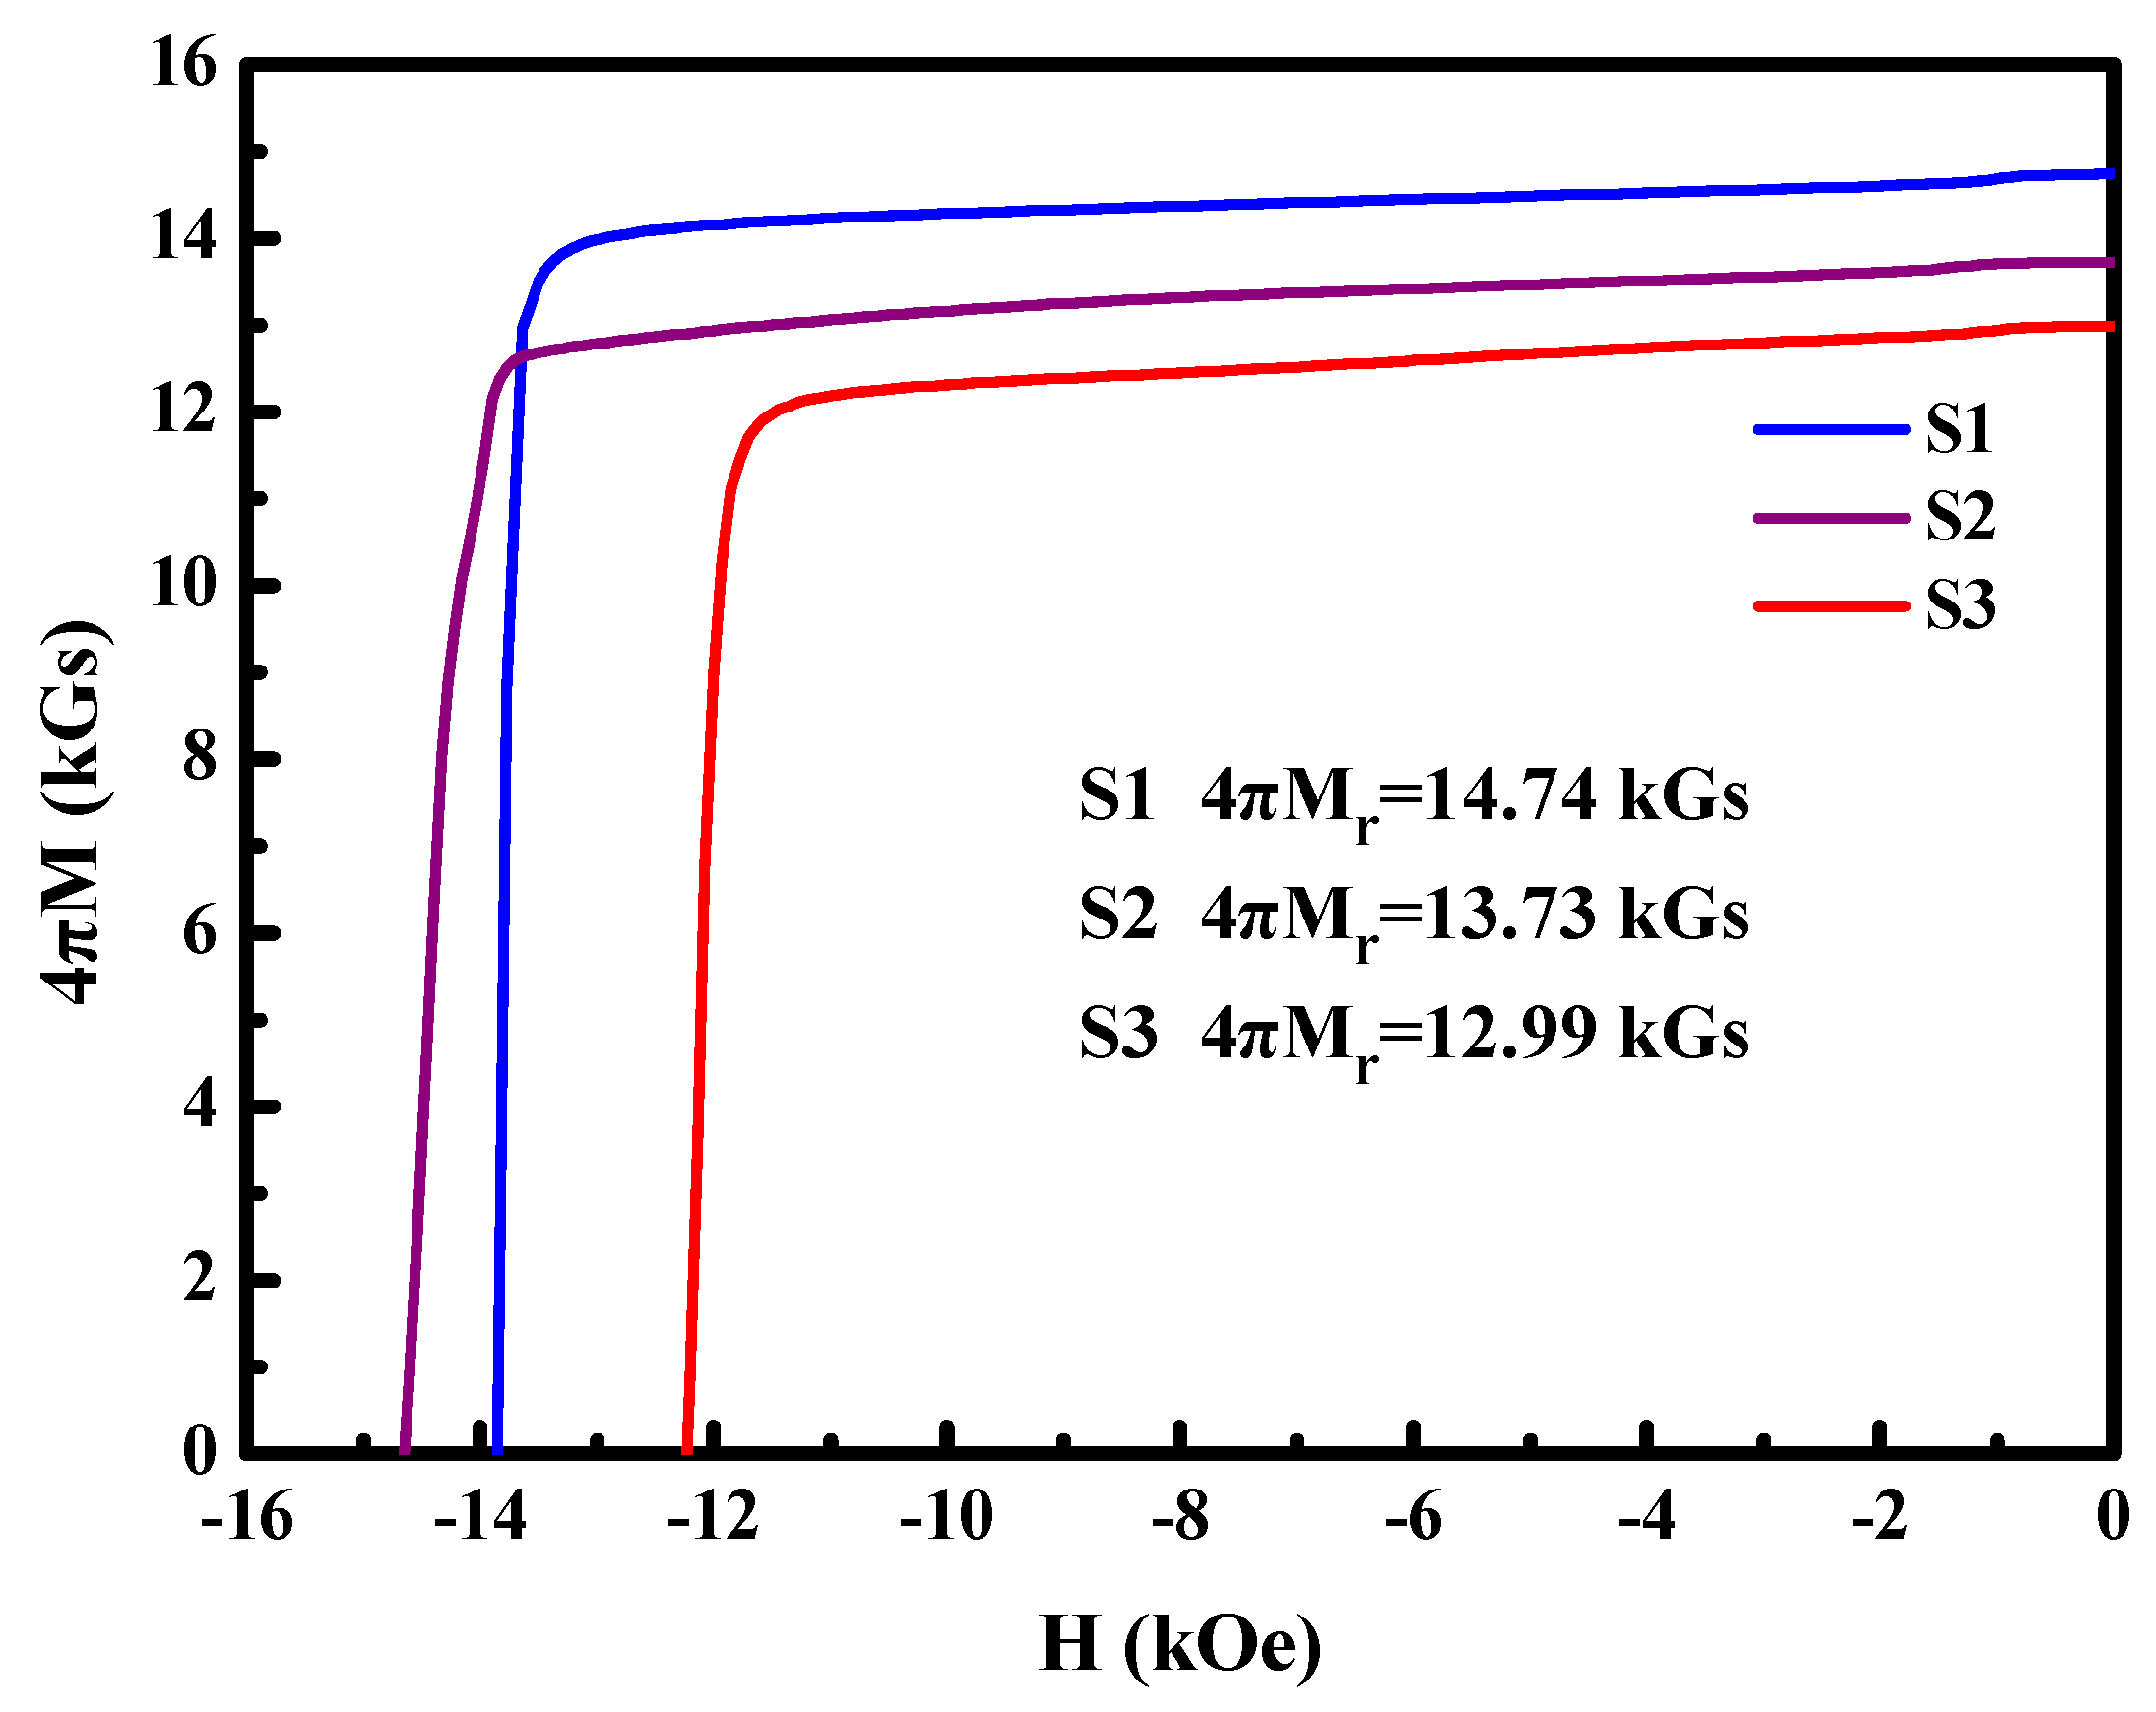
The demagnetization curves of S1, S2, and S3 at room temperature are shown in Figure 2. The samples exhibit diverse remanences, among which the highest remanence is 14.74 kGs for S1 and the lowest remanence is 12.99 kGs for S3. Table 1 lists the magnetic properties of the three samples. S1 has the highest maximum energy product of 51.86 MGOe. S2 has the highest coercivity of 14.65 kOe. The parameter related to the texture orientation is the squareness factor (Q), which is calculated by the formula: Q = H k H c j , where Hk is the knee coercivity defined as the external magnetic field corresponding to 90% of remanence, and Hcj is the intrinsic coercivity [24]. The squareness factor reflects the degree of homogeneity of the internal reverse domains during the demagnetization of the magnet, which laterally reflects the degree of homogeneity of the grain alignment along the easy magnetization axis. A larger value of Q indicates a stronger magnet <001> texture orientation.
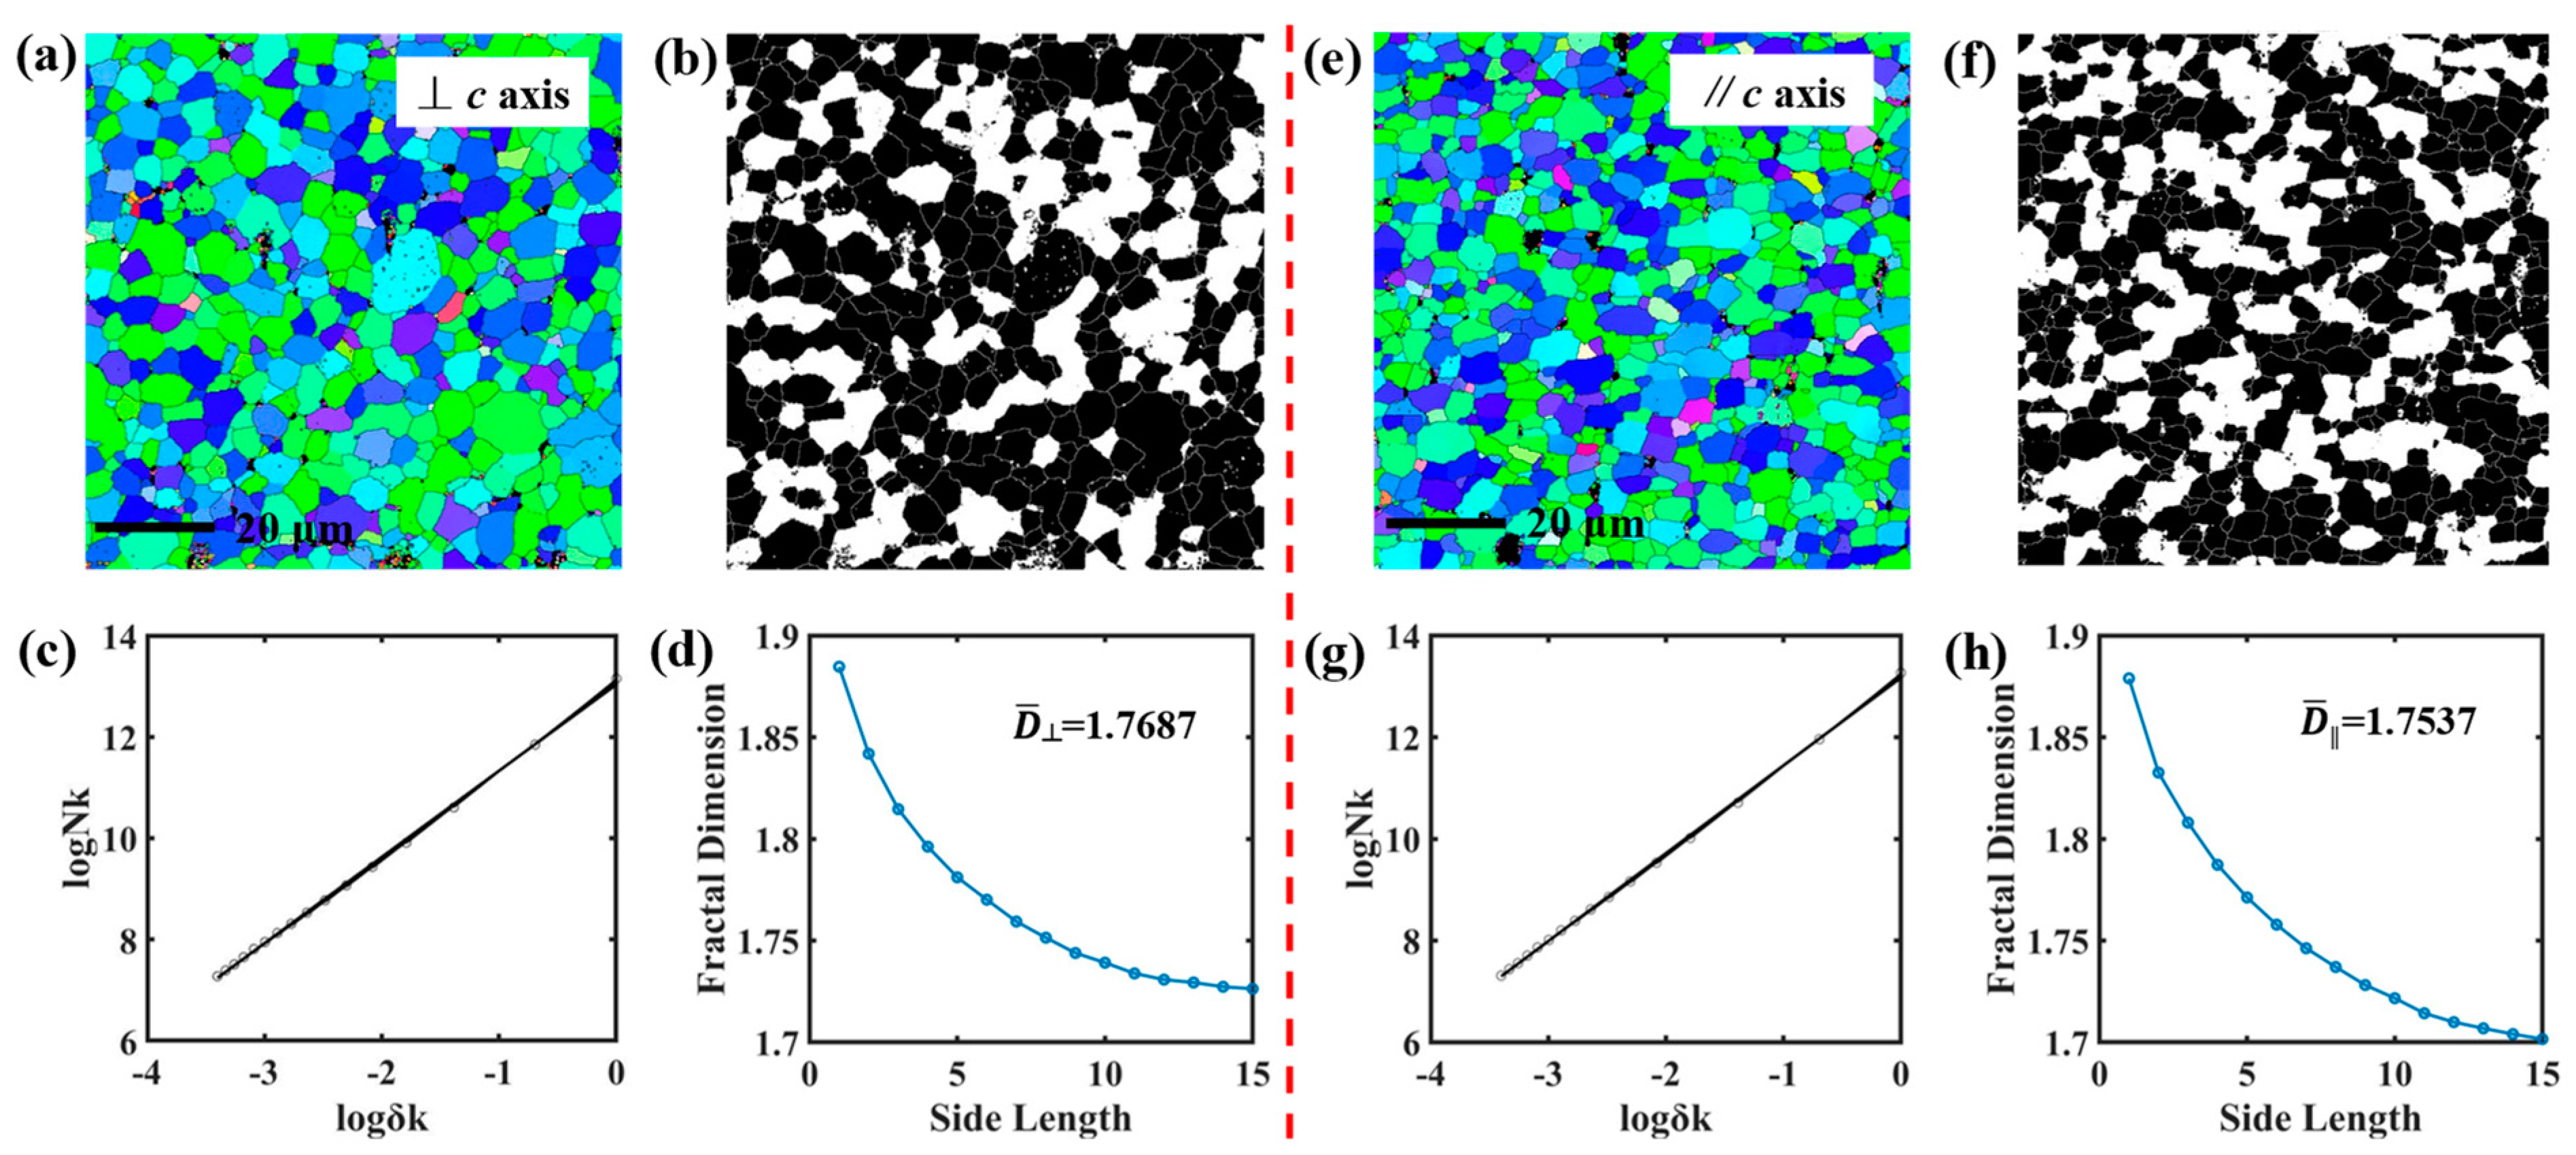
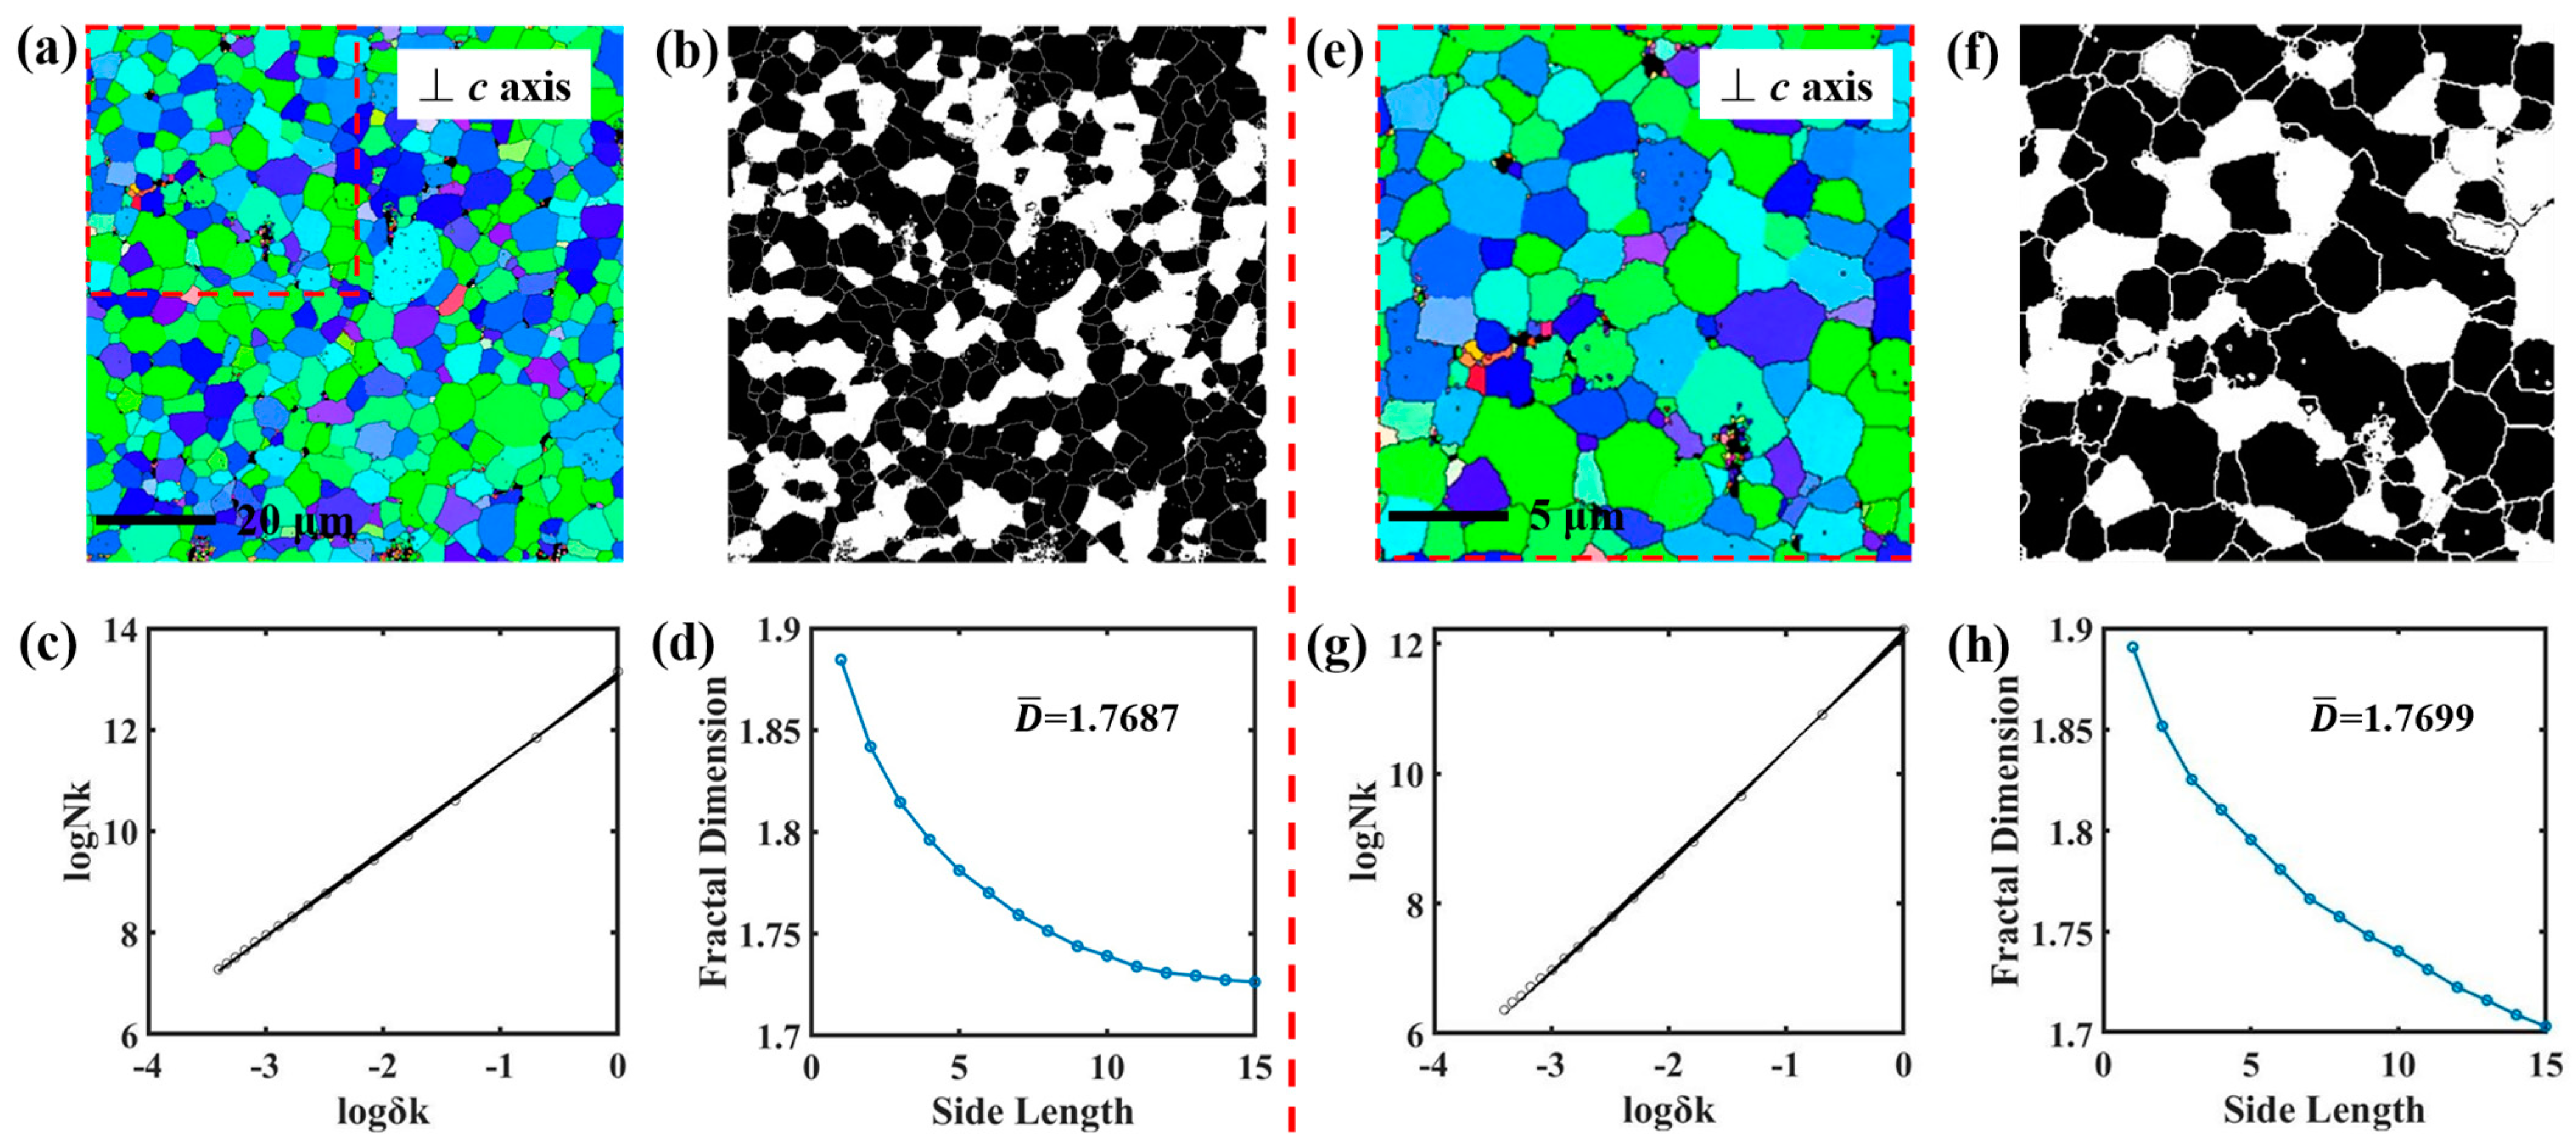
Figure 3a,e show the EBSD results of S1 with the test surface perpendicular to the c-axis direction and parallel to the c-axis direction, respectively. The EBSD orientation map demonstrates the texture orientation in addition to a clear grain profile of the micromorphology. As shown in the figure, the grains parallel to the c-axis direction show a rounded profile (Figure 3a), while the grains perpendicular to the c-axis direction show a flat profile (Figure 3e). Based on the self-similarity of fractal theory, the complex morphological information of two surfaces of S1 is analyzed. Figure 3b,f show the binary images of the morphology, i.e., the sample morphology is treated as black and white. It has been previously reported in the literature that different gray-level thresholds affect the resolution effect of the binary image [23]. Smaller or larger thresholds distort the binary image, resulting in a poorly resolved grain profile, which in turn affects the calculation of the fractal dimension. In this work, the gray-level threshold we used is 0.5 to ensure the accuracy of the calculation results. Figure 3c,g show the fitted results in the form of a logarithm of the side length of boxes and the number of boxes, and there are 15 fitted lines in each figure. The dependency of box side length and fractal dimension indicates that the FD gradually decreases and tends to stabilize as the box side length increases. The average value of the fractal dimension of the sample surface perpendicular to the c-axis direction is 1.7687 ( D ), and the average value of the fractal dimension of the sample surface parallel to the c-axis direction is 1.7537 ( D ). The values of the average fractal dimensions are similar in both directions, indicating that the magnets have high uniformity and consistency.
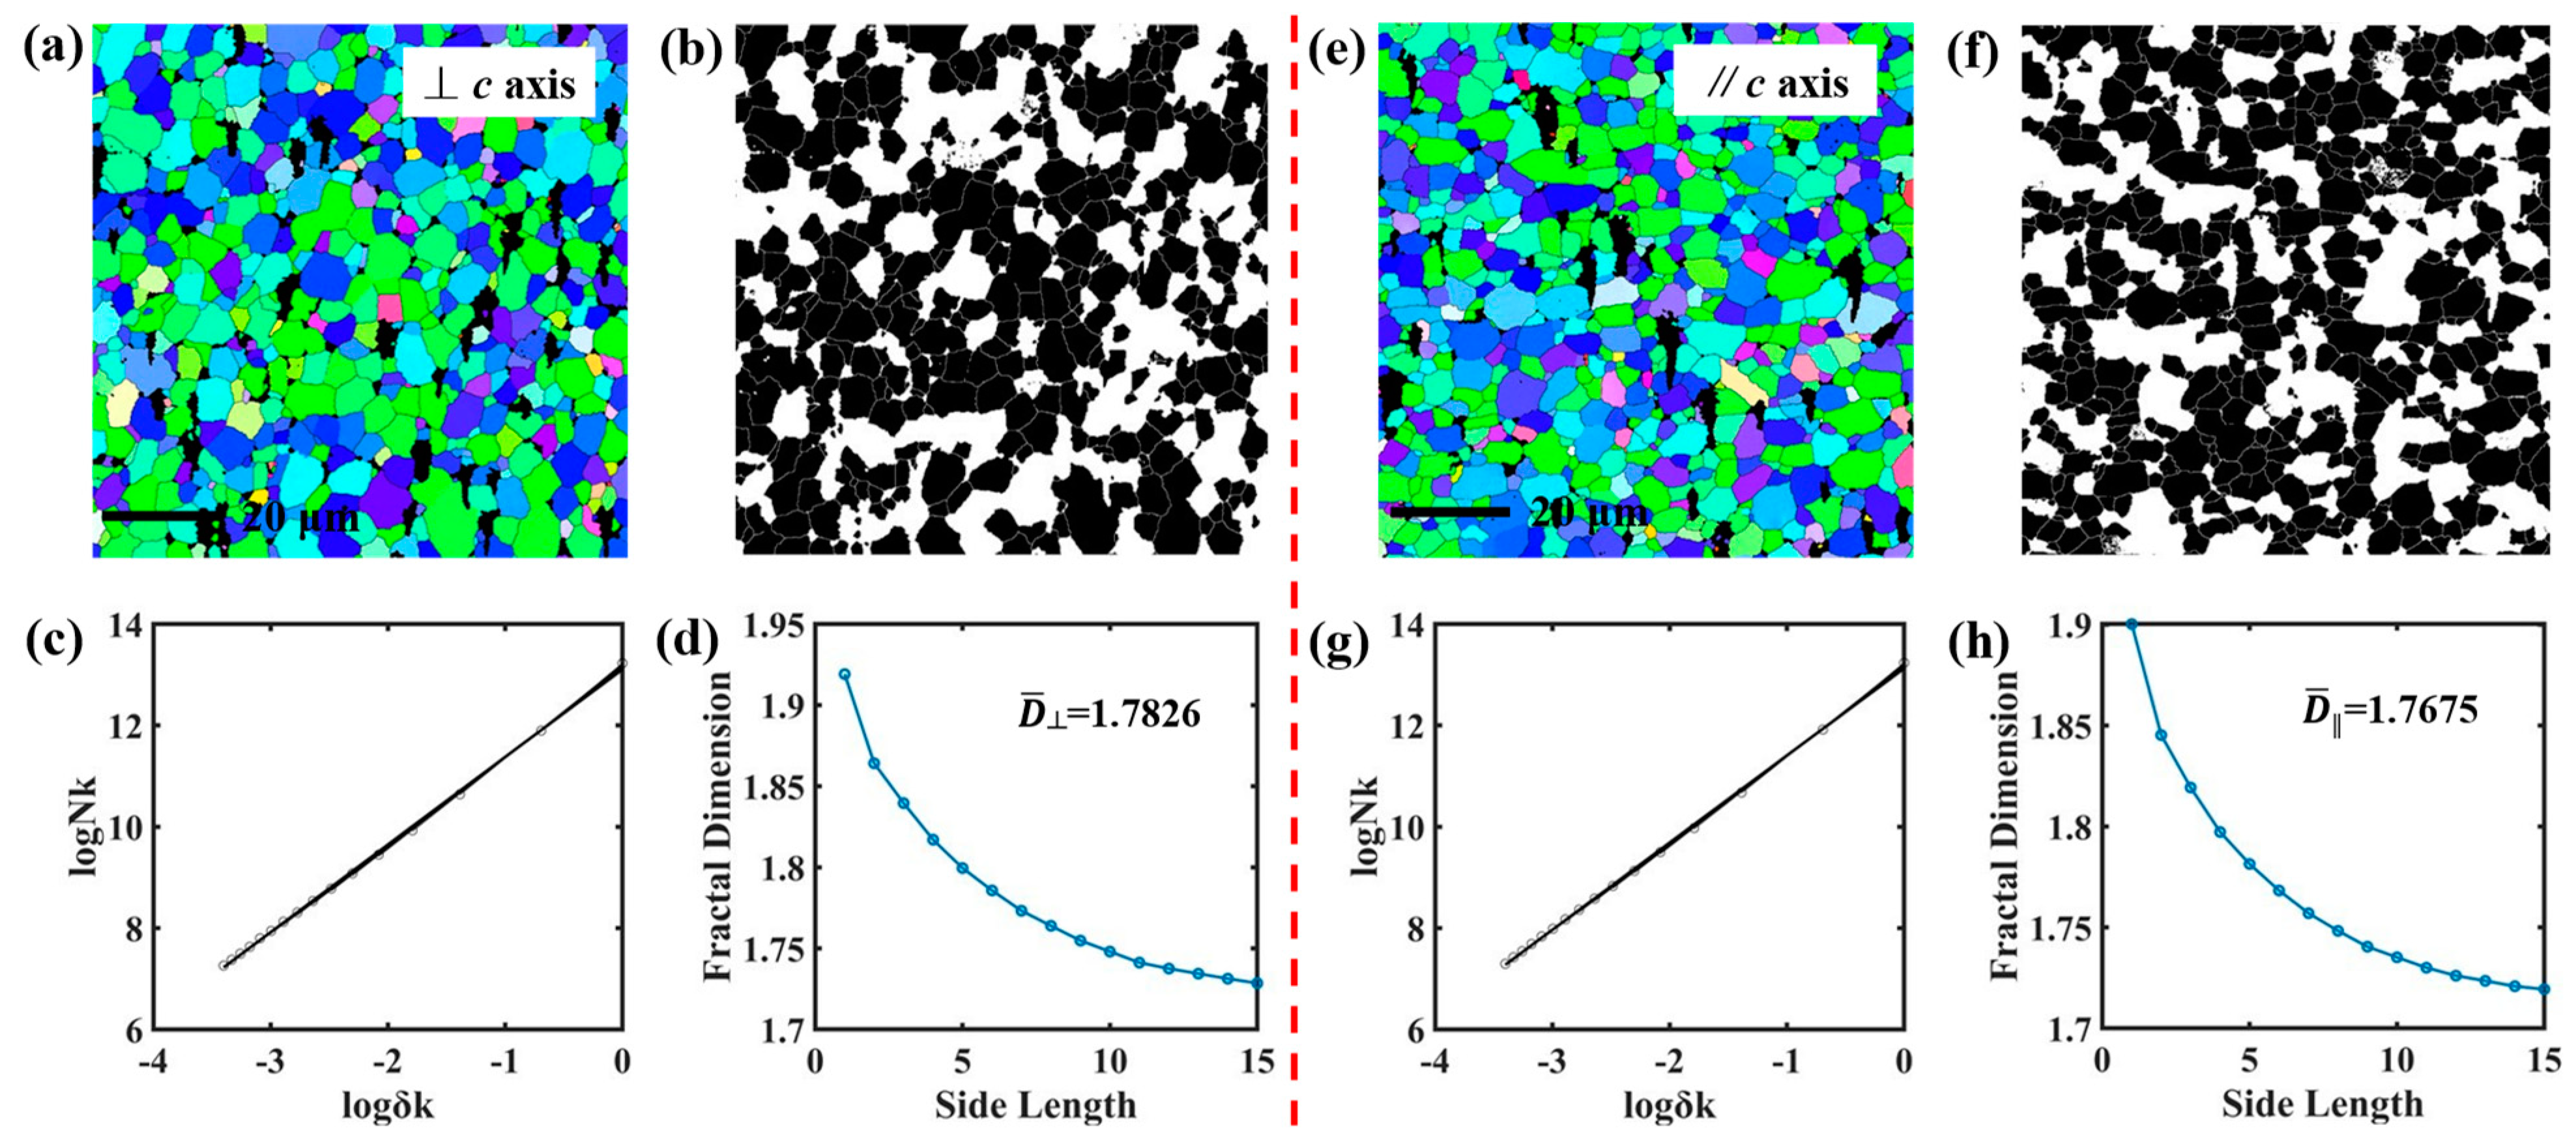
Figure 4a,e show the micromorphology of S2 with the test surface perpendicular to the c-axis direction and parallel to the c-axis direction, respectively. The grain profile of the test surface in both directions is clearly shown. The fractal dimensions of different side lengths of the boxes are obtained by fitting the data. For the S2 sample, the average value of the fractal dimension of the surface perpendicular to the c-axis direction is 1.7826 ( D ), and the average value of the fractal dimension of the surface parallel to the c-axis direction is 1.7675 ( D ). 
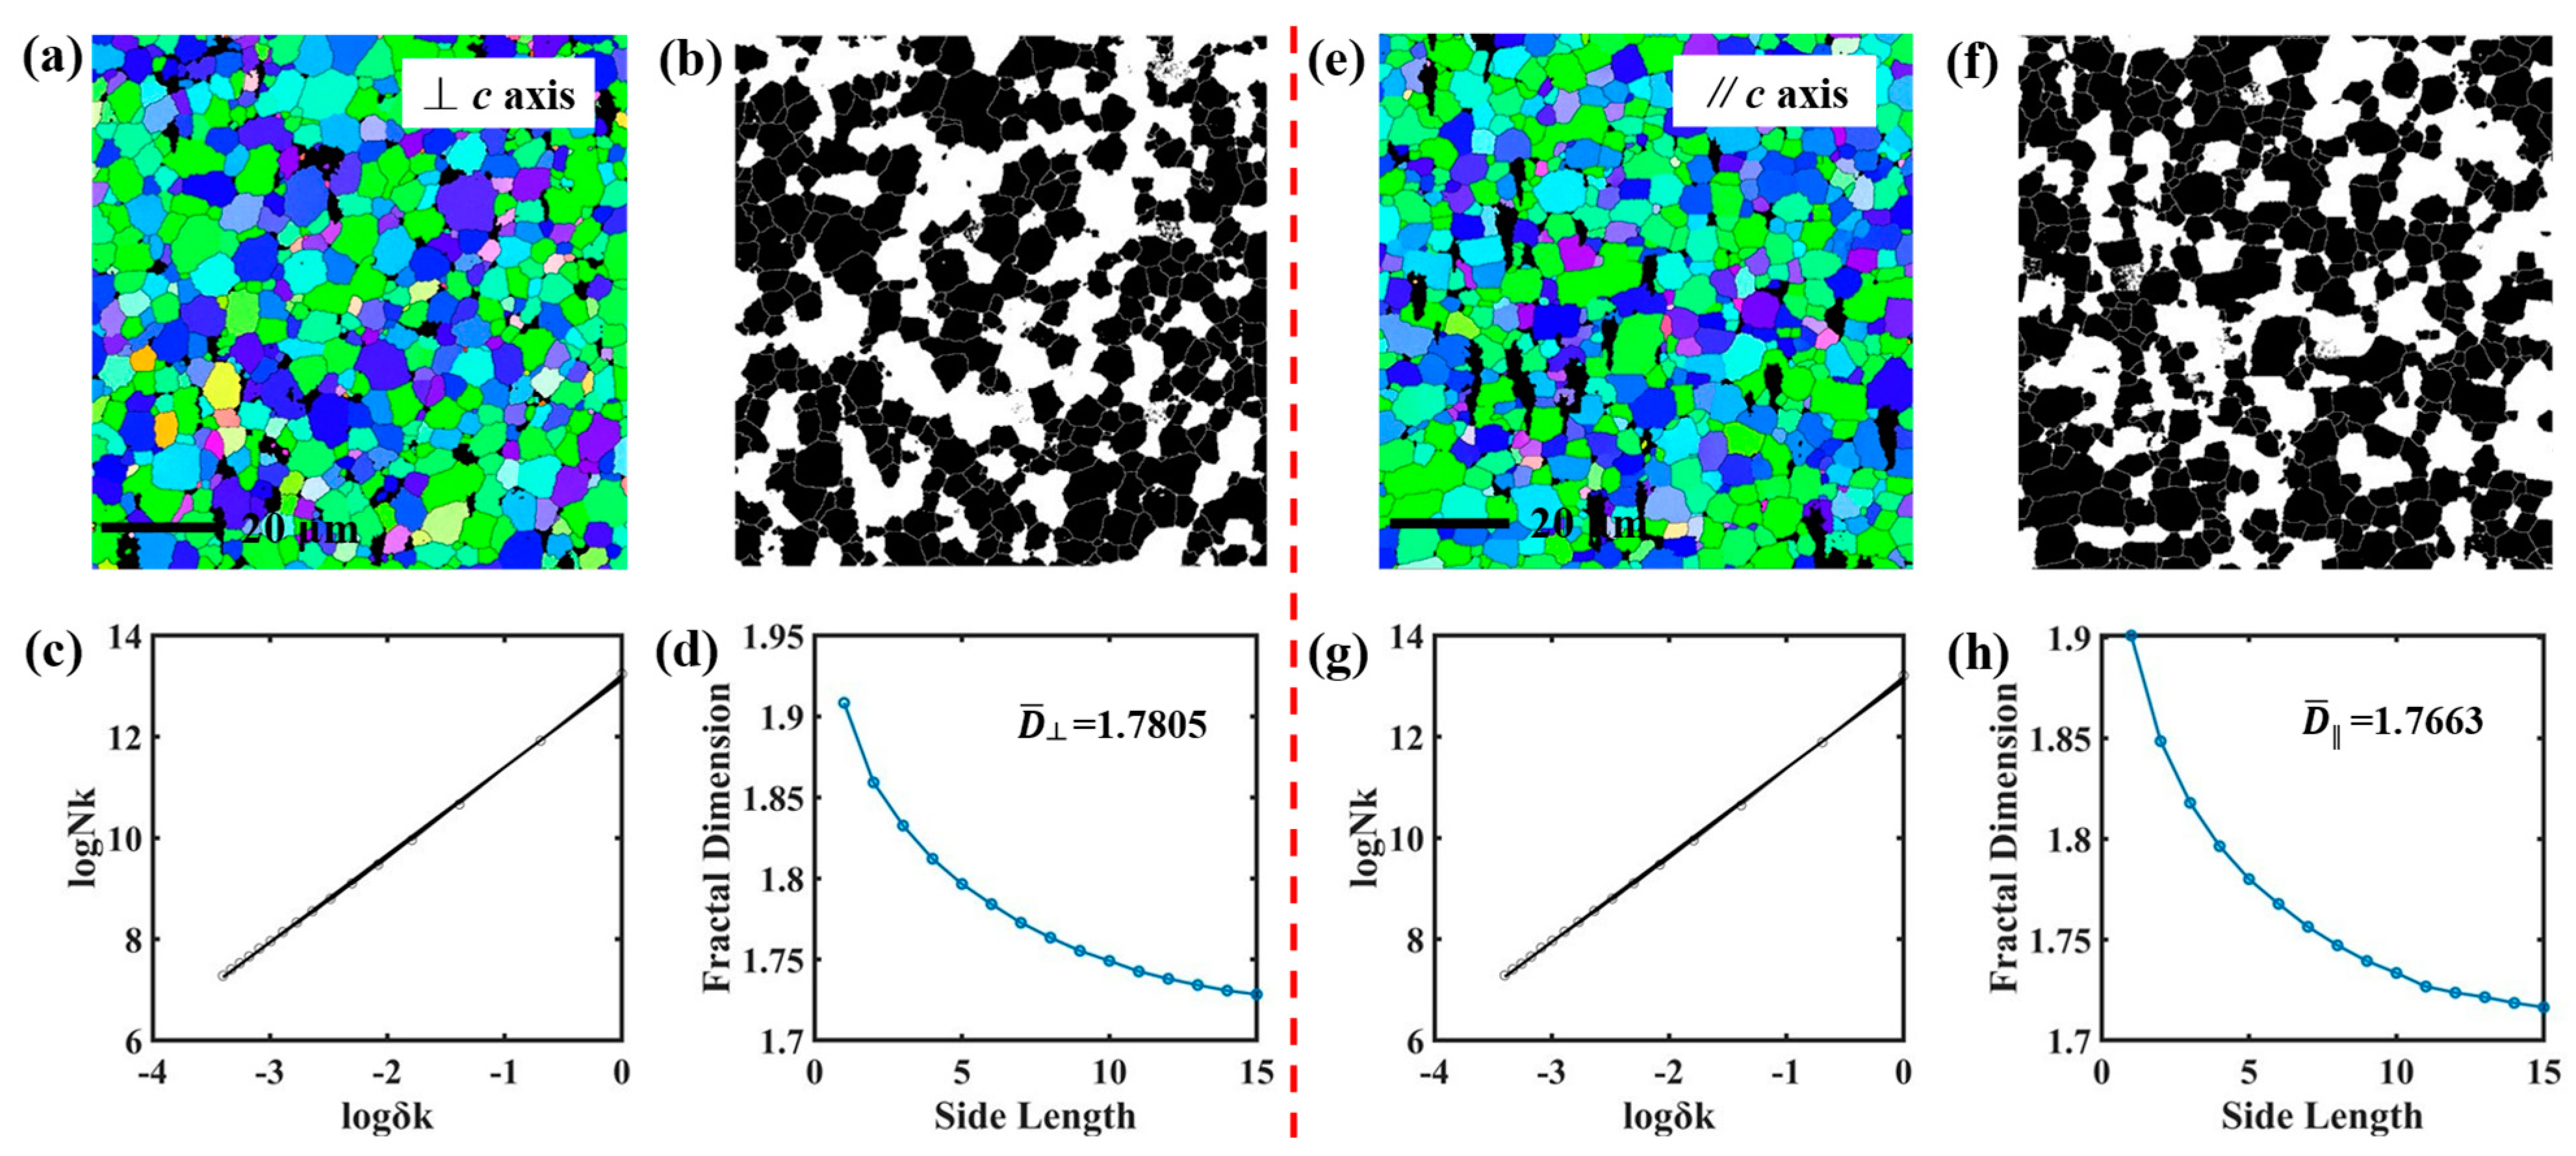
Figure 5 shows the micromorphology of S3 surfaces perpendicular to the c-axis direction and parallel to the c-axis direction, the binary images, the fitted data, and the fractal dimension for different side lengths of the boxes. The average fractal dimension of a surface perpendicular to the c-axis direction is 1.7805 ( D ), and the average fractal dimension of a surface parallel to the c-axis direction is 1.7663 ( D ). The morphology images of the three magnets parallel to the c-axis prove that the grains rotate when the magnetic field is applied to the magnetic powders during preparation, and the direction of the long axis of the flattened grains is the direction of magnetic field orientation, as shown in Figure 3e, Figure 4e and Figure 5e. In addition, the fractal dimensions of the surface parallel to the c-axis direction for all three samples are smaller than the fractal dimensions of the surface perpendicular to the c-axis direction. This is consistent with the fractal dimension previously calculated using fractal morphology, where anisotropic magnets exhibit anisotropic fractal dimension [23]. The black areas in the image show no tendency to align along the magnetic field direction, which is further evidence that the black areas are rare-earth-rich nonmagnetic phases clustered in the corners of the 2:14:1 main phase.
The empirical equations for remanence are expressed as follows [25]:
4 π M r = A 1 β ' 4 π M s cos θ
4 π M r = A 1 D D β 4 π M s cos θ
M r M s = A 1 D D β cos θ = x cos θ
cos θ = M r x M s
where A is the volume fraction of the forward domain and β’ is the parameter related to the volume fraction of the nonmagnetic phase. The distribution morphology of the nonmagnetic phase is directly related to the microstructure of the magnet. The nonmagnetic phase region is somewhat different from the main phase grains. D and D are the average values of the fractal dimension of the sample surface parallel and perpendicular to the c-axis direction, respectively. Based on the self-similarity of fractal theory, the distribution of the nonmagnetic phase is also directly related to the fractal dimension of the surface morphology. Therefore, β’ can be written as D D β . Where D D is a parameter directly related to the distribution of the nonmagnetic phase, which is also related to the microstructure of the magnet, β is the nonmagnetic phase volume fraction, Ms is the saturation magnetization, and cosθ represents the c-axis texture orientation of the magnet.
The saturation magnetization of Nd2Fe14B is 16.1 kGs, and that of Pr2Fe14B is 15.6 kGs. The saturation magnetization of Ce2Fe14B is 11.7 kGs [26,27]. The weight ratios yielded the corresponding saturation magnetizations of the three samples, which were 16.1 kGs for S1, 15.98 kGs for S2, and 14.516 kGs for S3. Assuming that the volume fraction A of the forward domain in the magnet is 1 and the volume fraction β of the nonmagnetic phase is 2%, the 
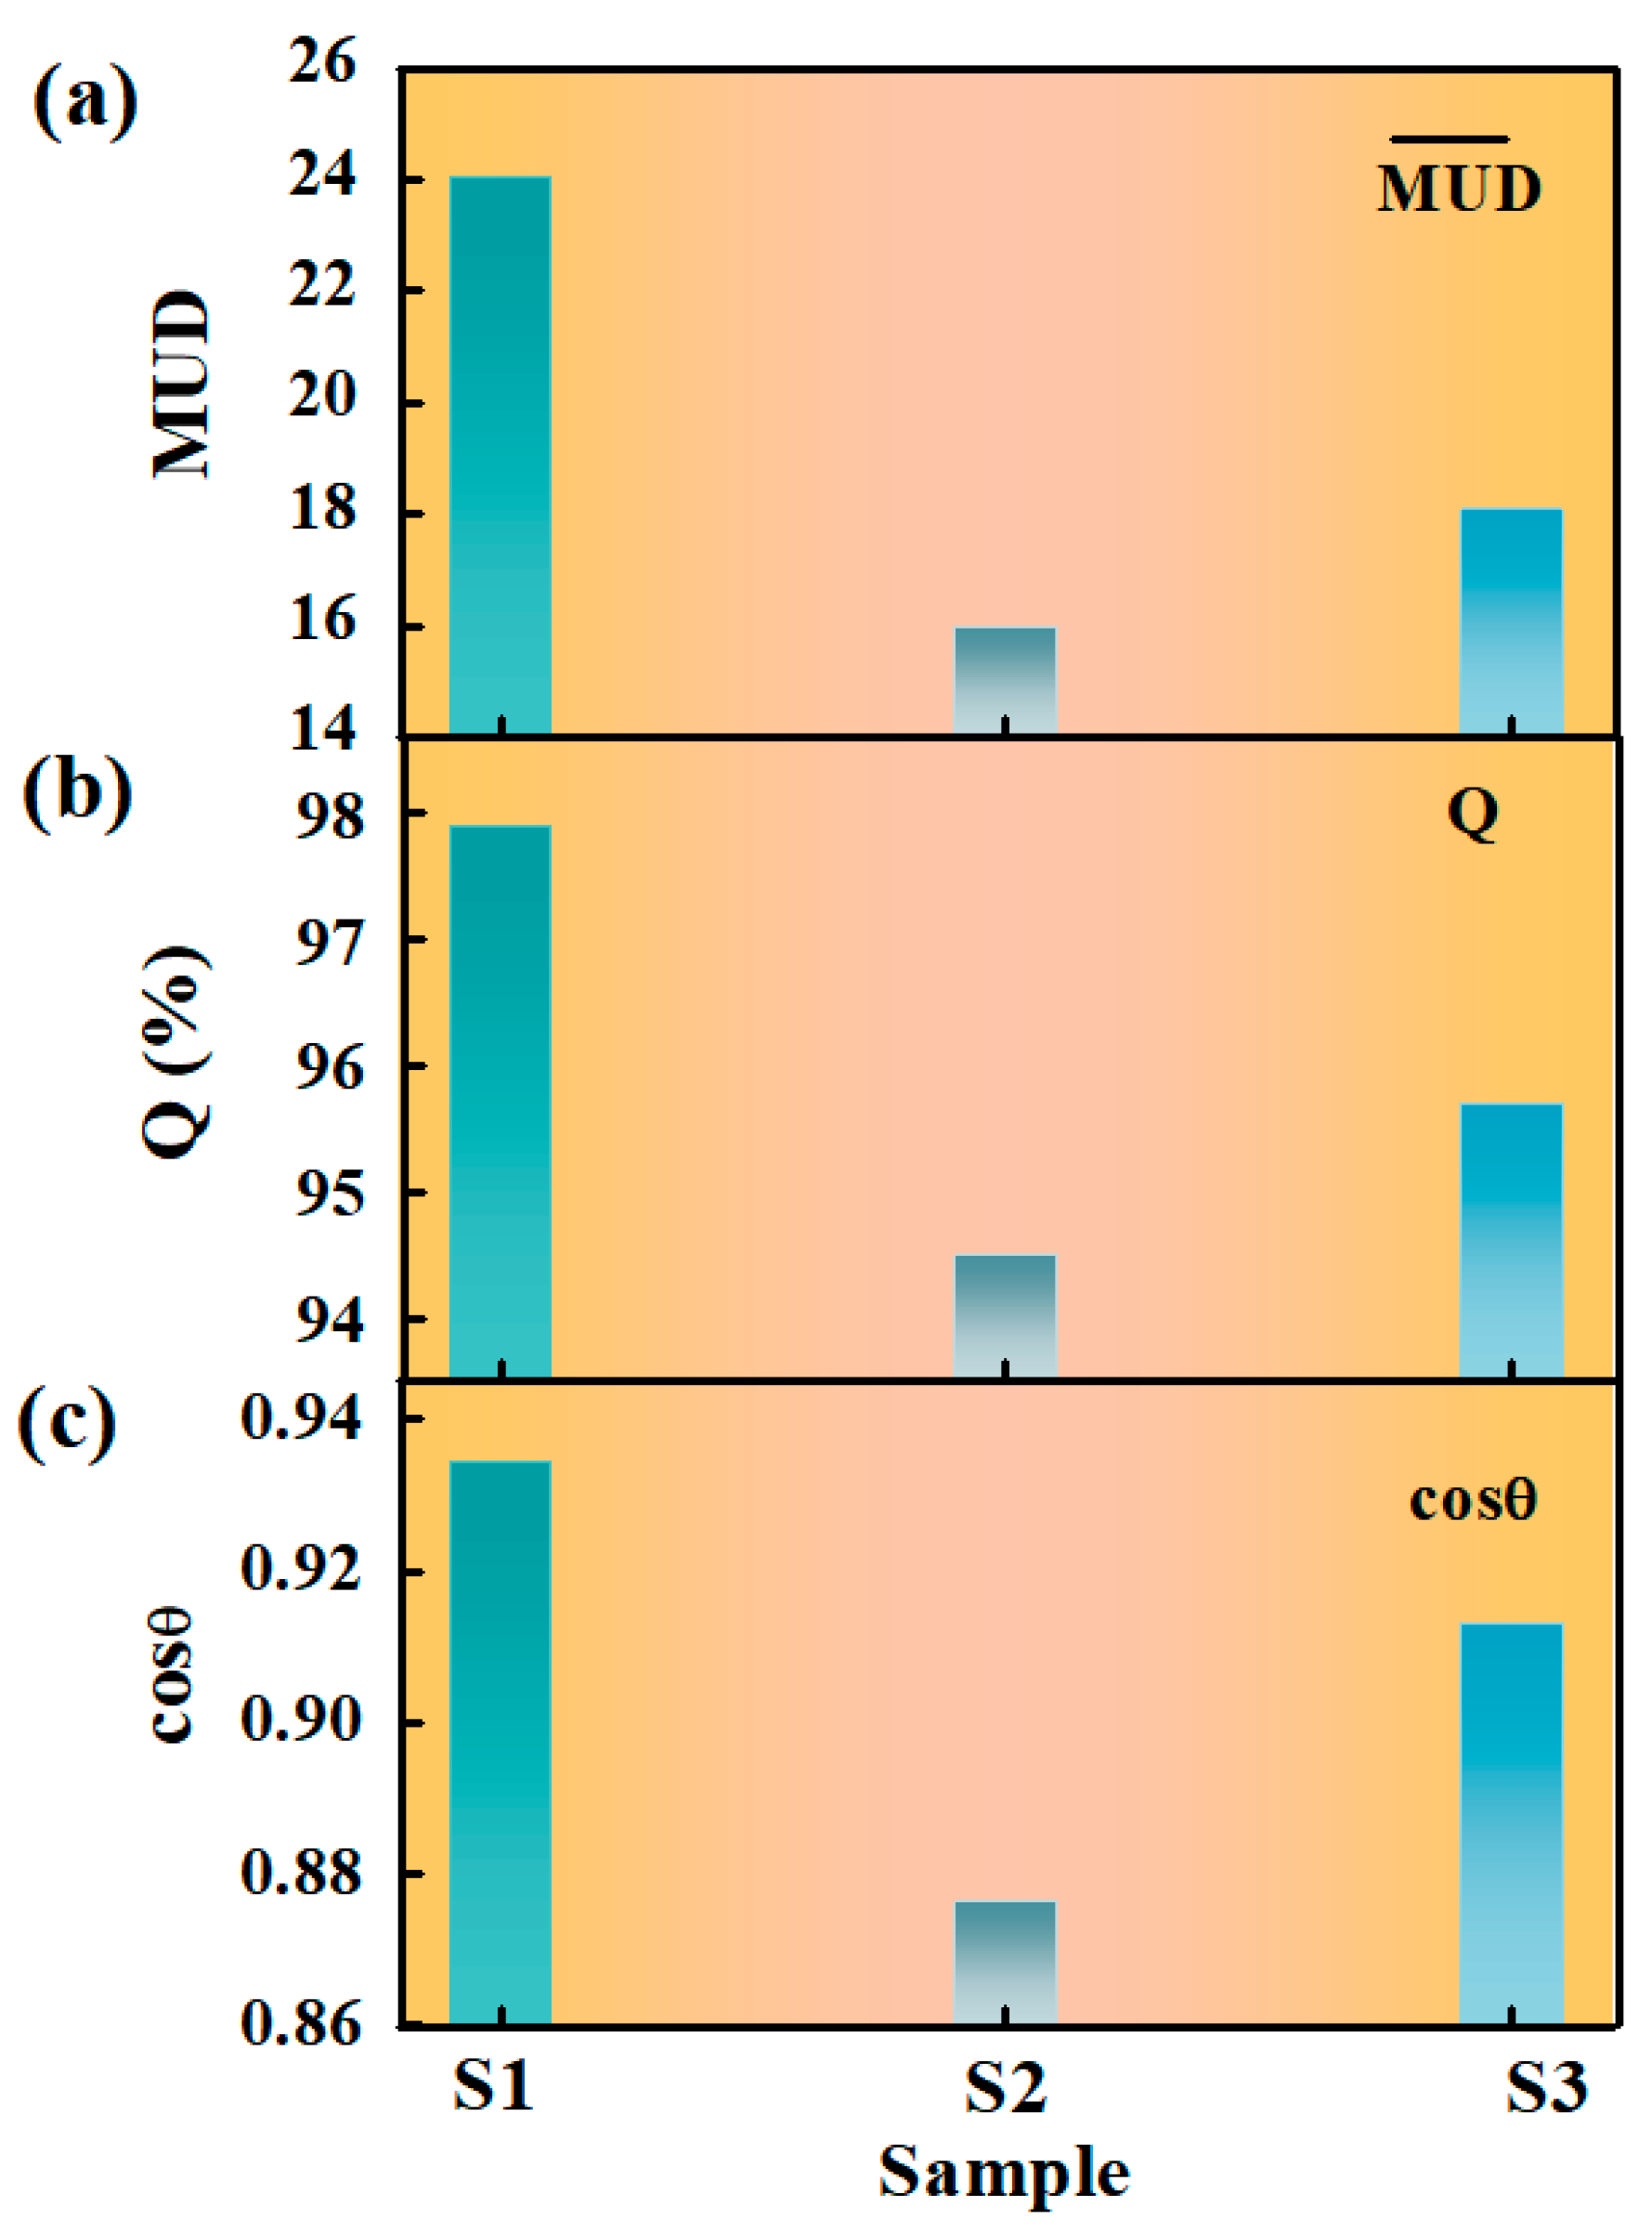
cosθ values of the S1, S2, and S3 samples are 0.9345, 0.8745, and 0.9131, respectively. The squareness factor Q obtained from the demagnetization curves is also the degree of texture orientation obtained from the experimental data. The Q values of 97.9%, 94.5%, and 95.7% are obtained for S1, S2, and S3 samples, respectively. Therefore, combining the data information on surface morphology and fractal dimension, the highest and lowest degrees of texture orientation are obtained for the S1 and S2 samples, which are consistent with the squareness factor obtained from the demagnetization curves.
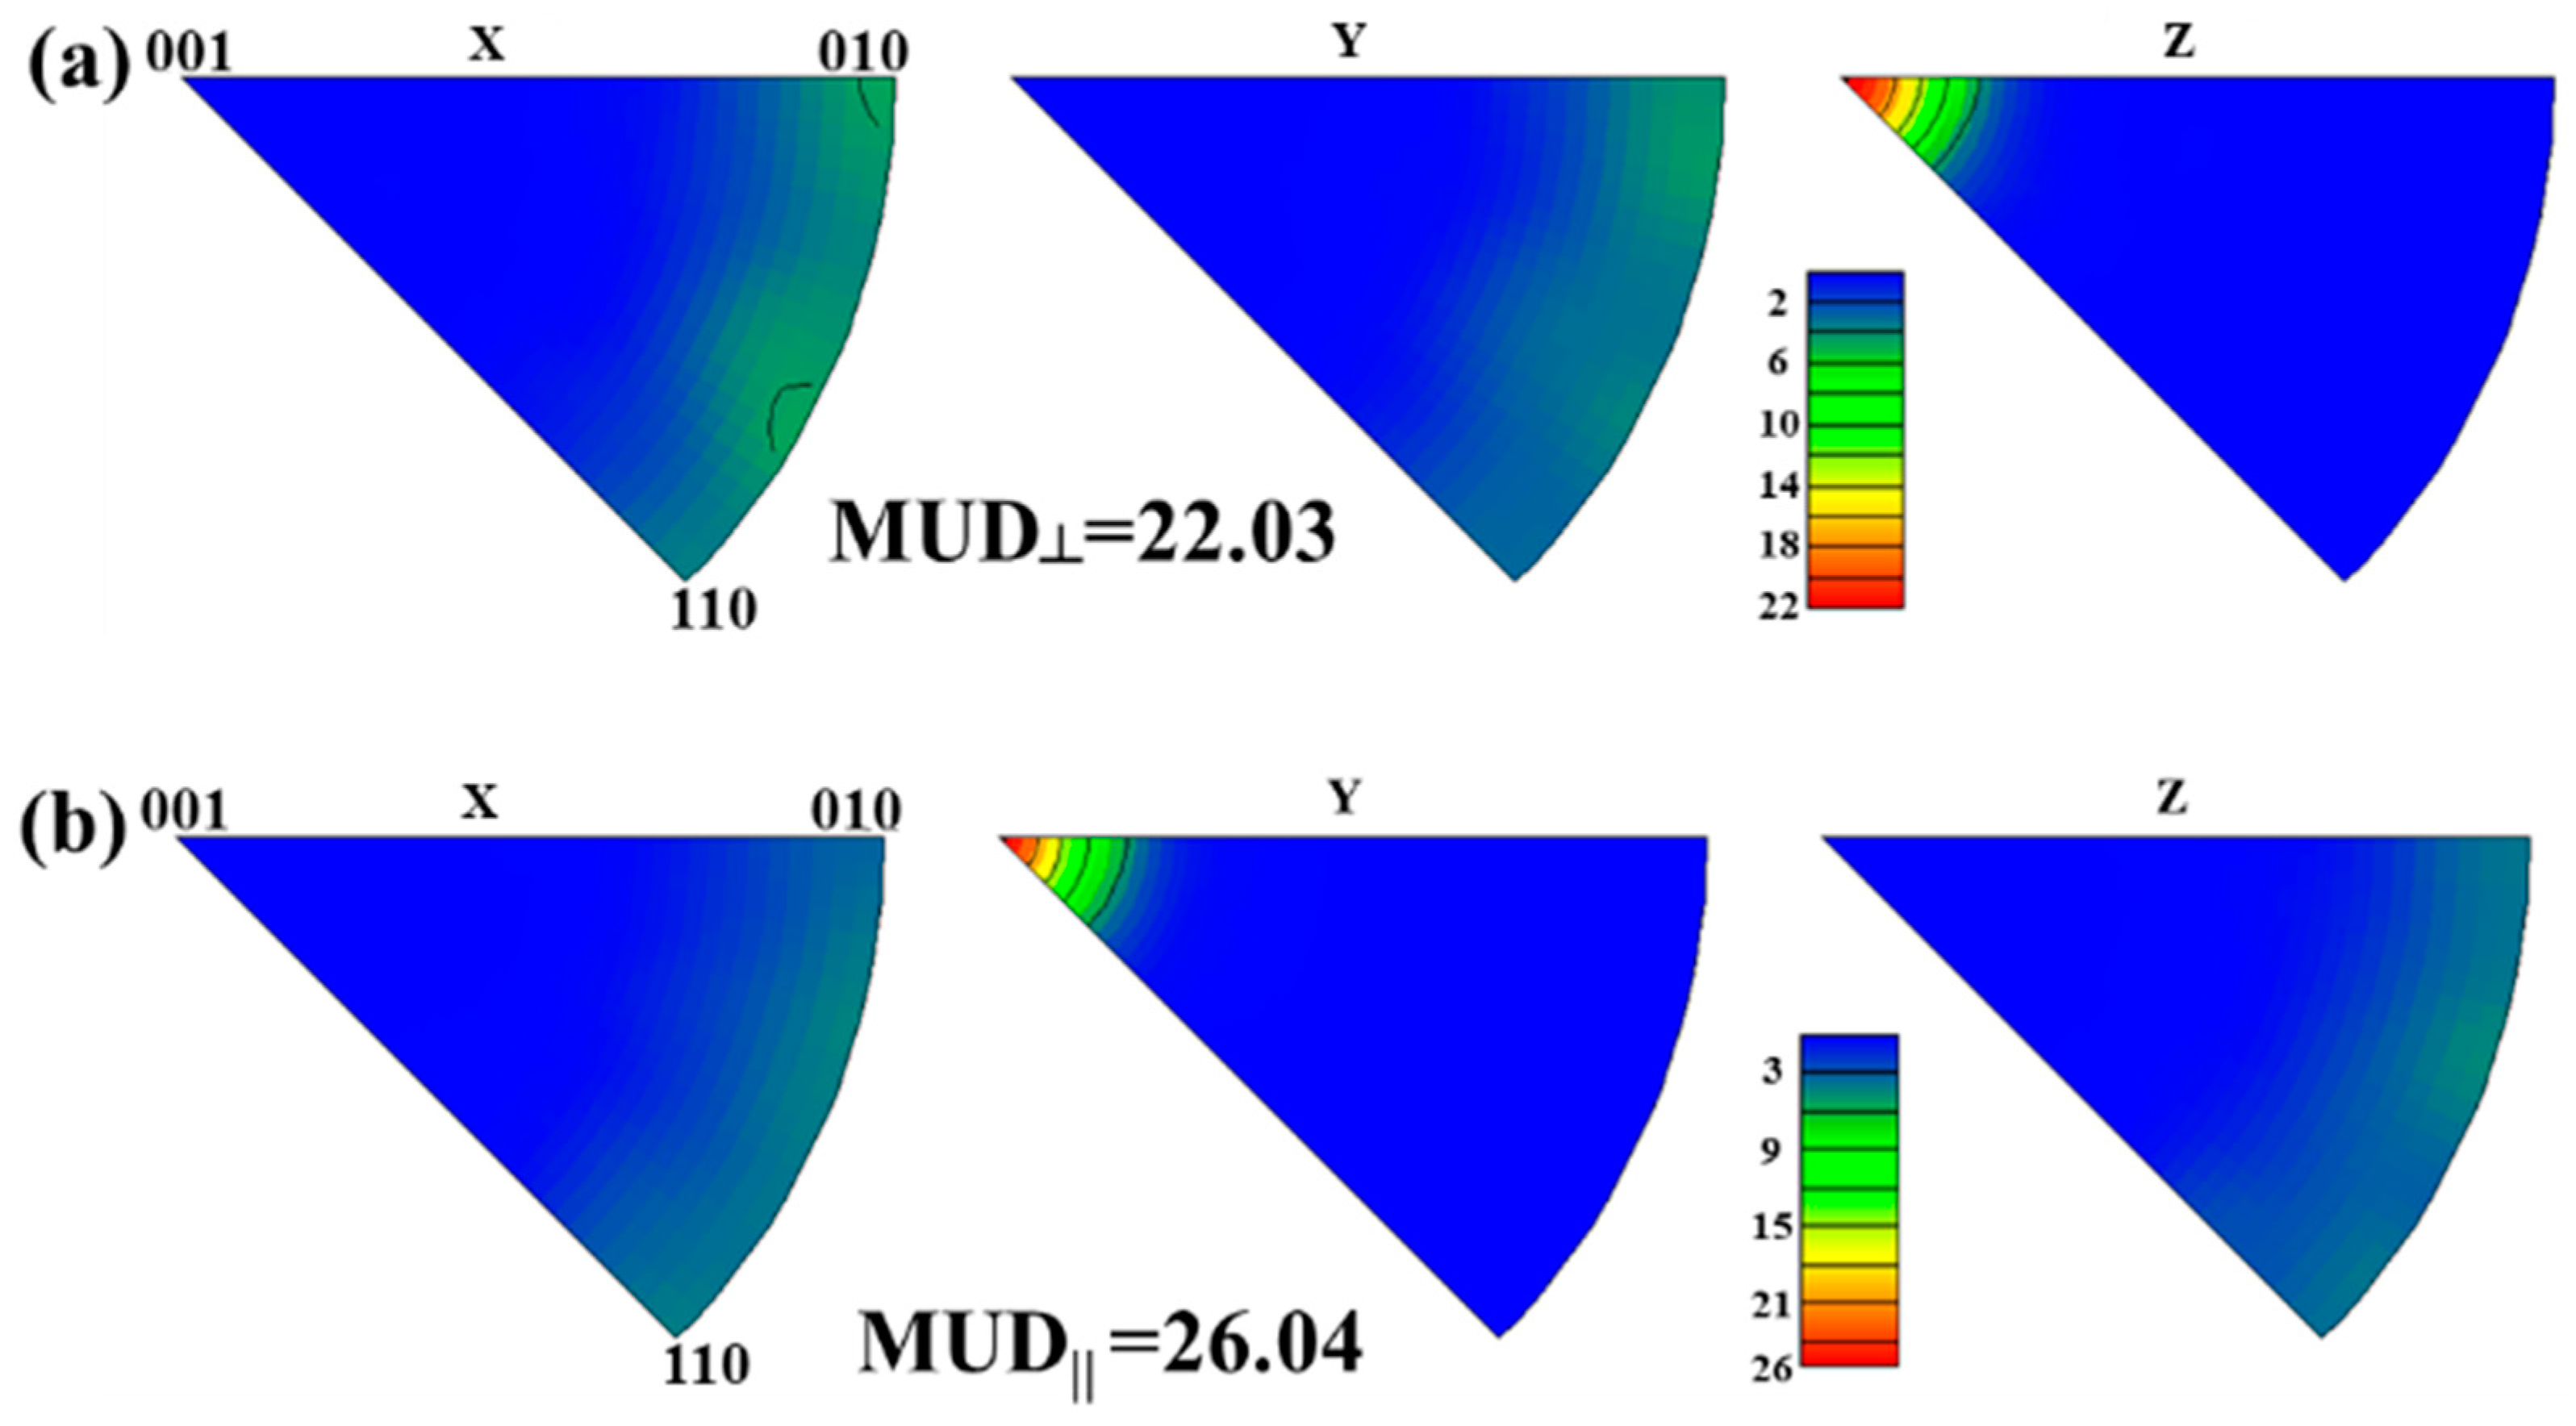
In order to have a further understanding of the degree of texture orientation through the experimental data, Figure 6 shows the inverse polar figures from the EBSD data. The MUD of the sample Z direction for the surface perpendicular to the c-axis direction of 22.03 and the MUD of the sample Y direction for the surface parallel to the c-axis direction of 26.04 are obtained for the S1 sample. 
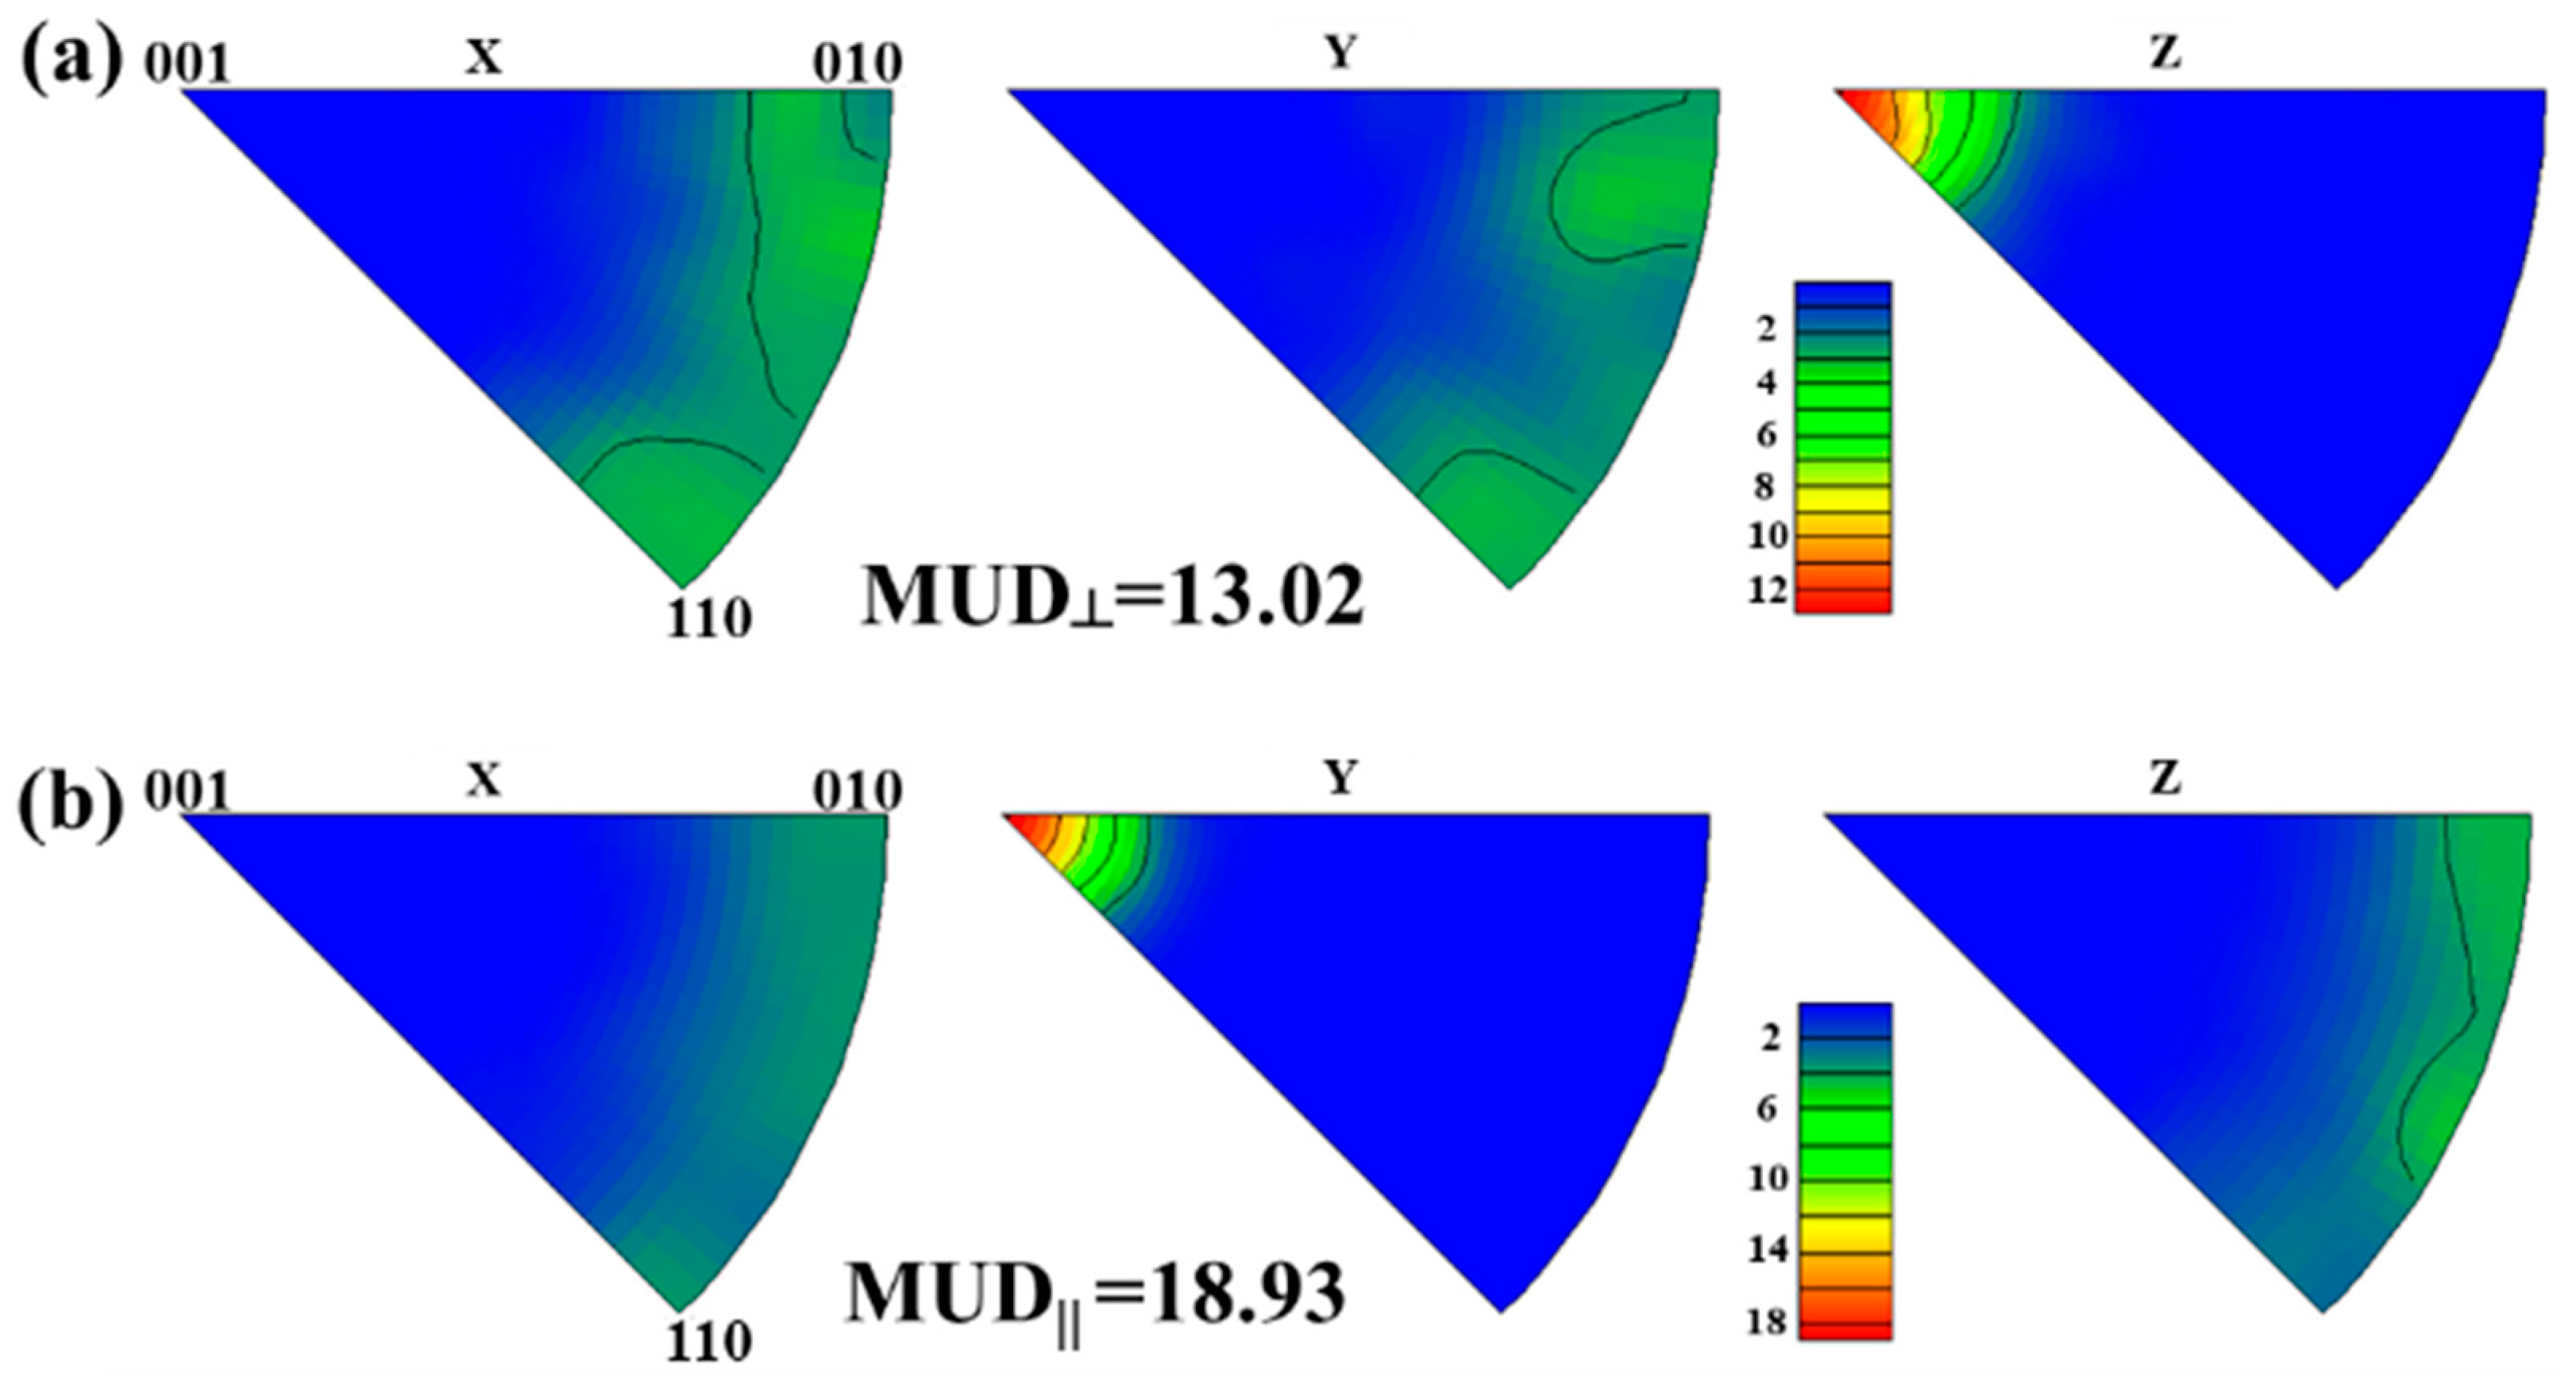
Figure 7 shows that the S2 sample has the MUD perpendicular to the c-axis direction of 13.02 and parallel to the c-axis direction of 18.93. 
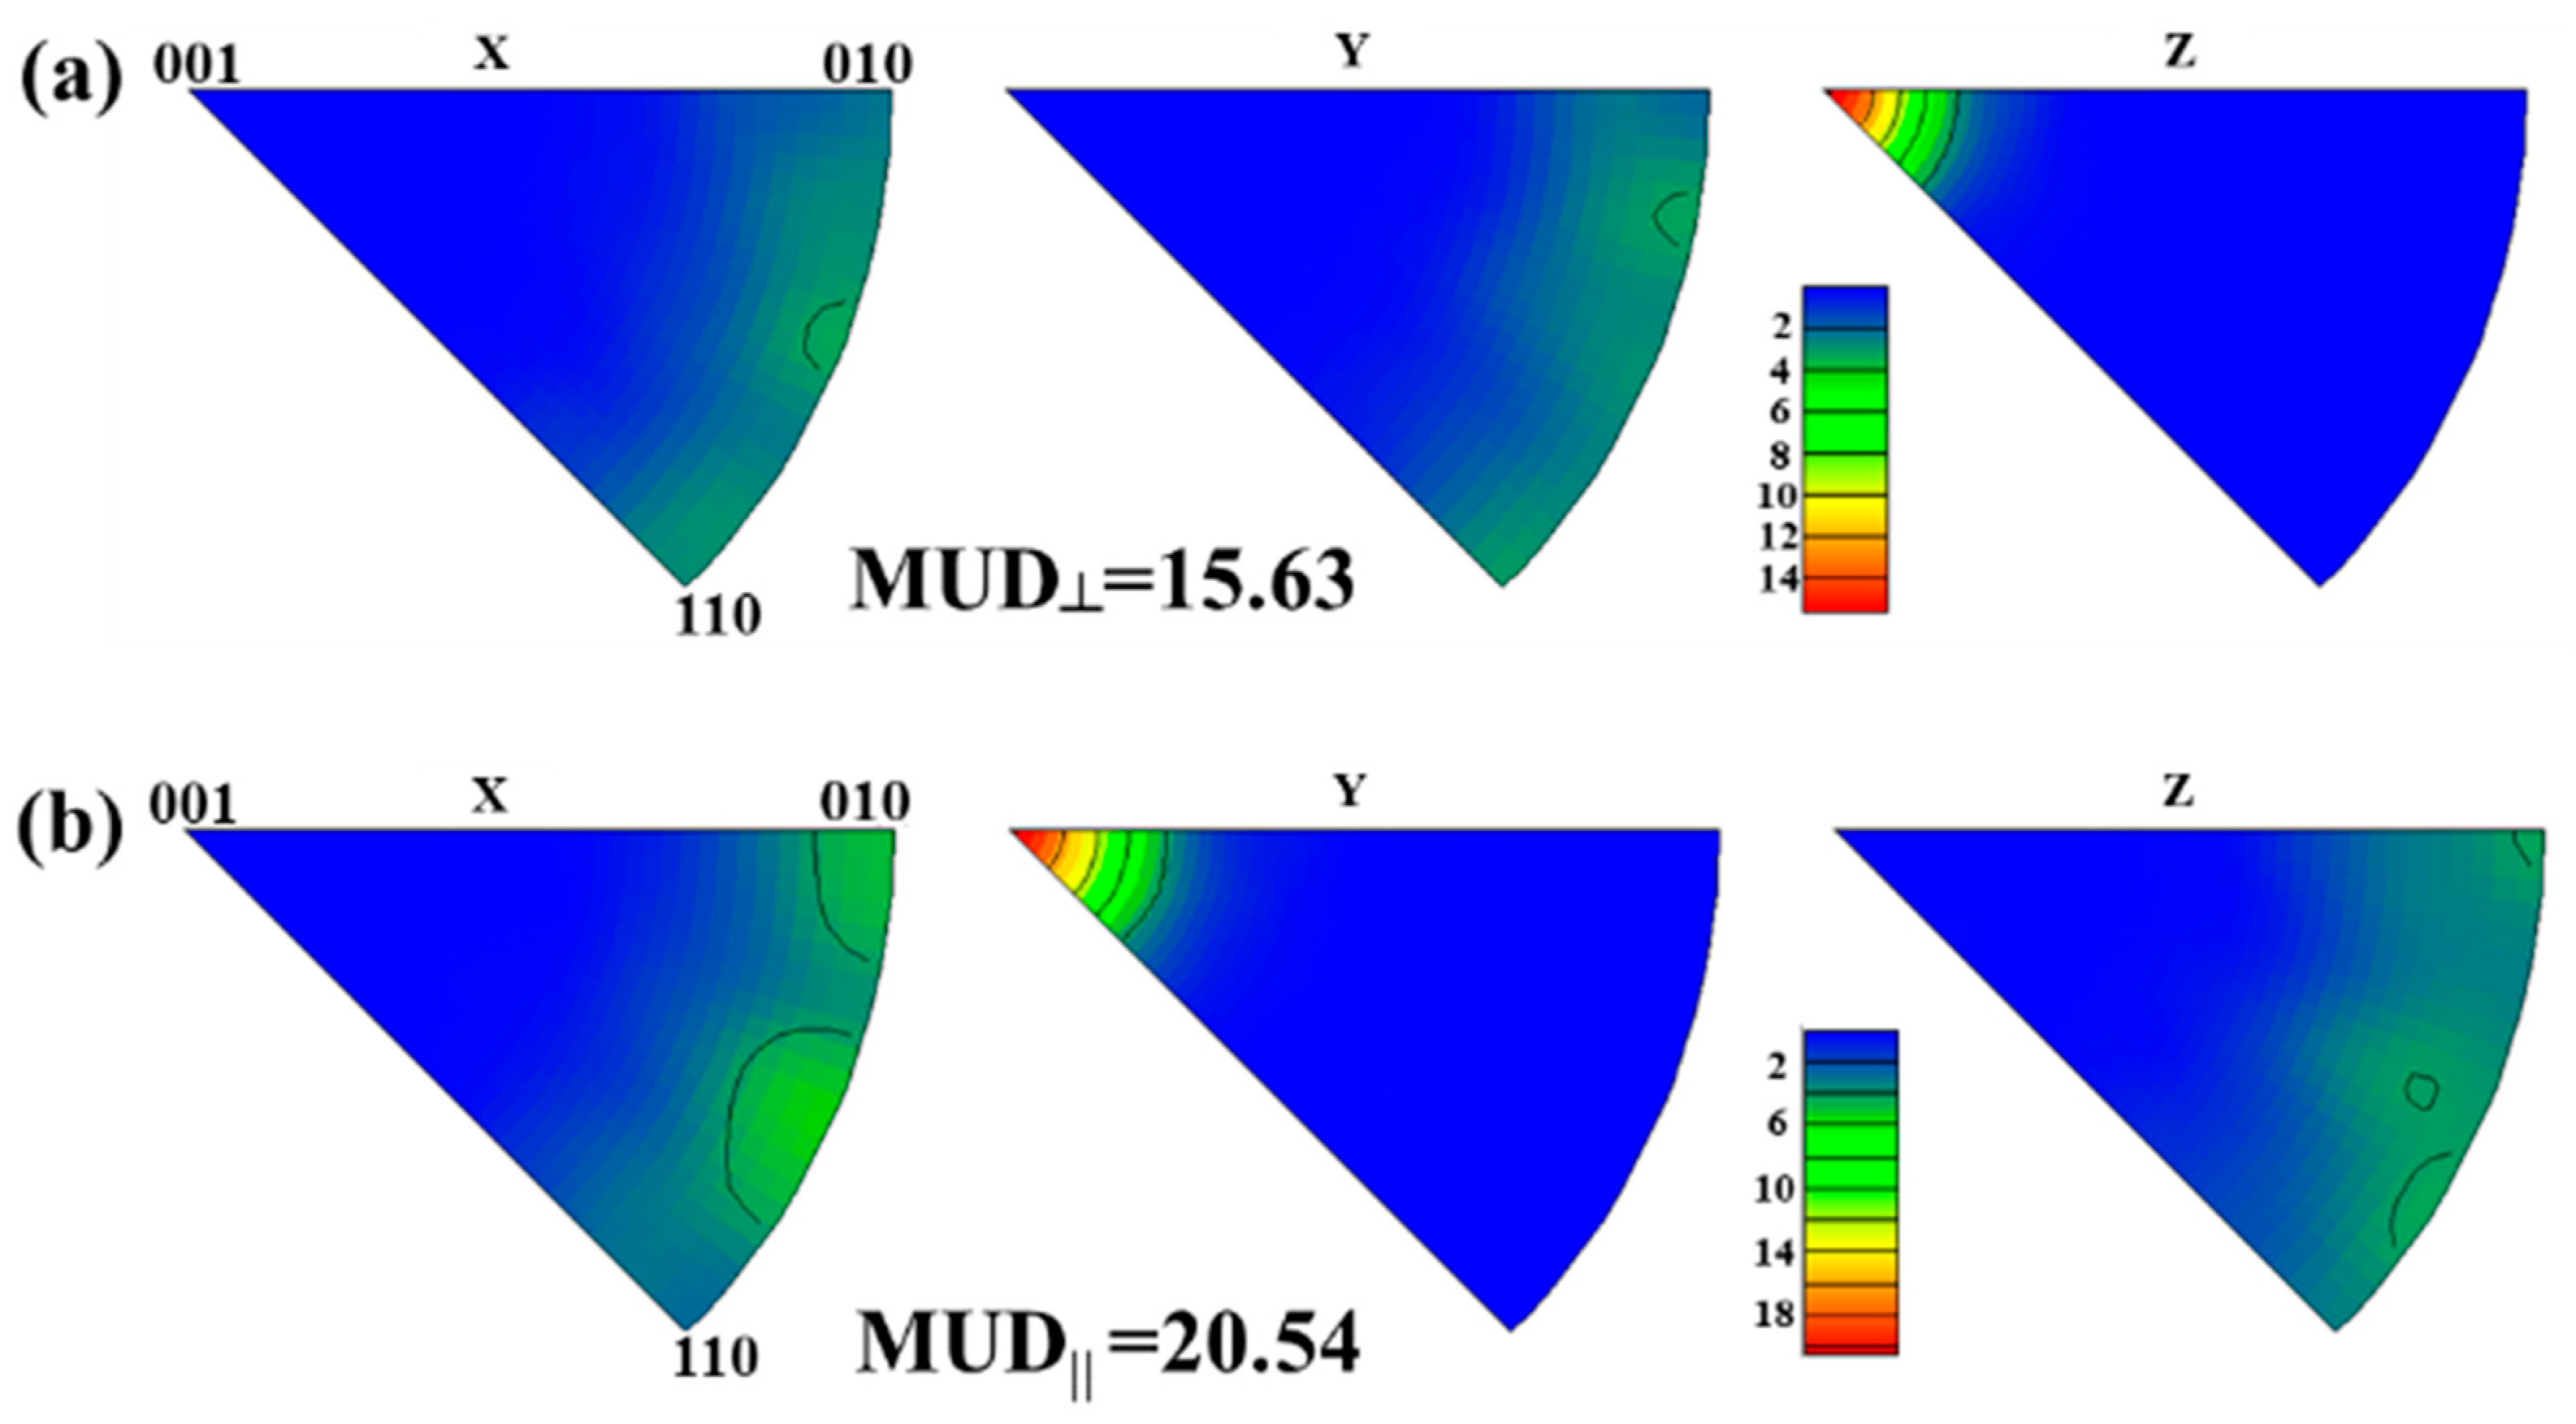
Figure 8 shows that the S3 sample has the MUD perpendicular to the c-axis direction of 15.63 and parallel to the c-axis direction of 20.54. The average MUD in two directions is defined as M U D = M U D + M U D 2 , which represents the degree of texture orientation obtained from experimental data. Figure 9 shows the different representations of the degrees of texture orientation for the three samples. It is obviously demonstrated in the figure that the degree of texture orientation obtained by combining the surface morphology with the fractal dimension is consistent with the MUD values measured by the EBSD experiment and the squareness factors obtained from demagnetization curves. This further indicates that the fractal dimension of the surface morphology can indeed be used to calculate the degree of texture orientation. The correlation between the remanence and the degree of texture orientation is obtained by the calculation of the fractal dimension. The novel insight will provide new ideas for the design of high-performance Nd-Fe-B permanent magnet materials with high remanence.
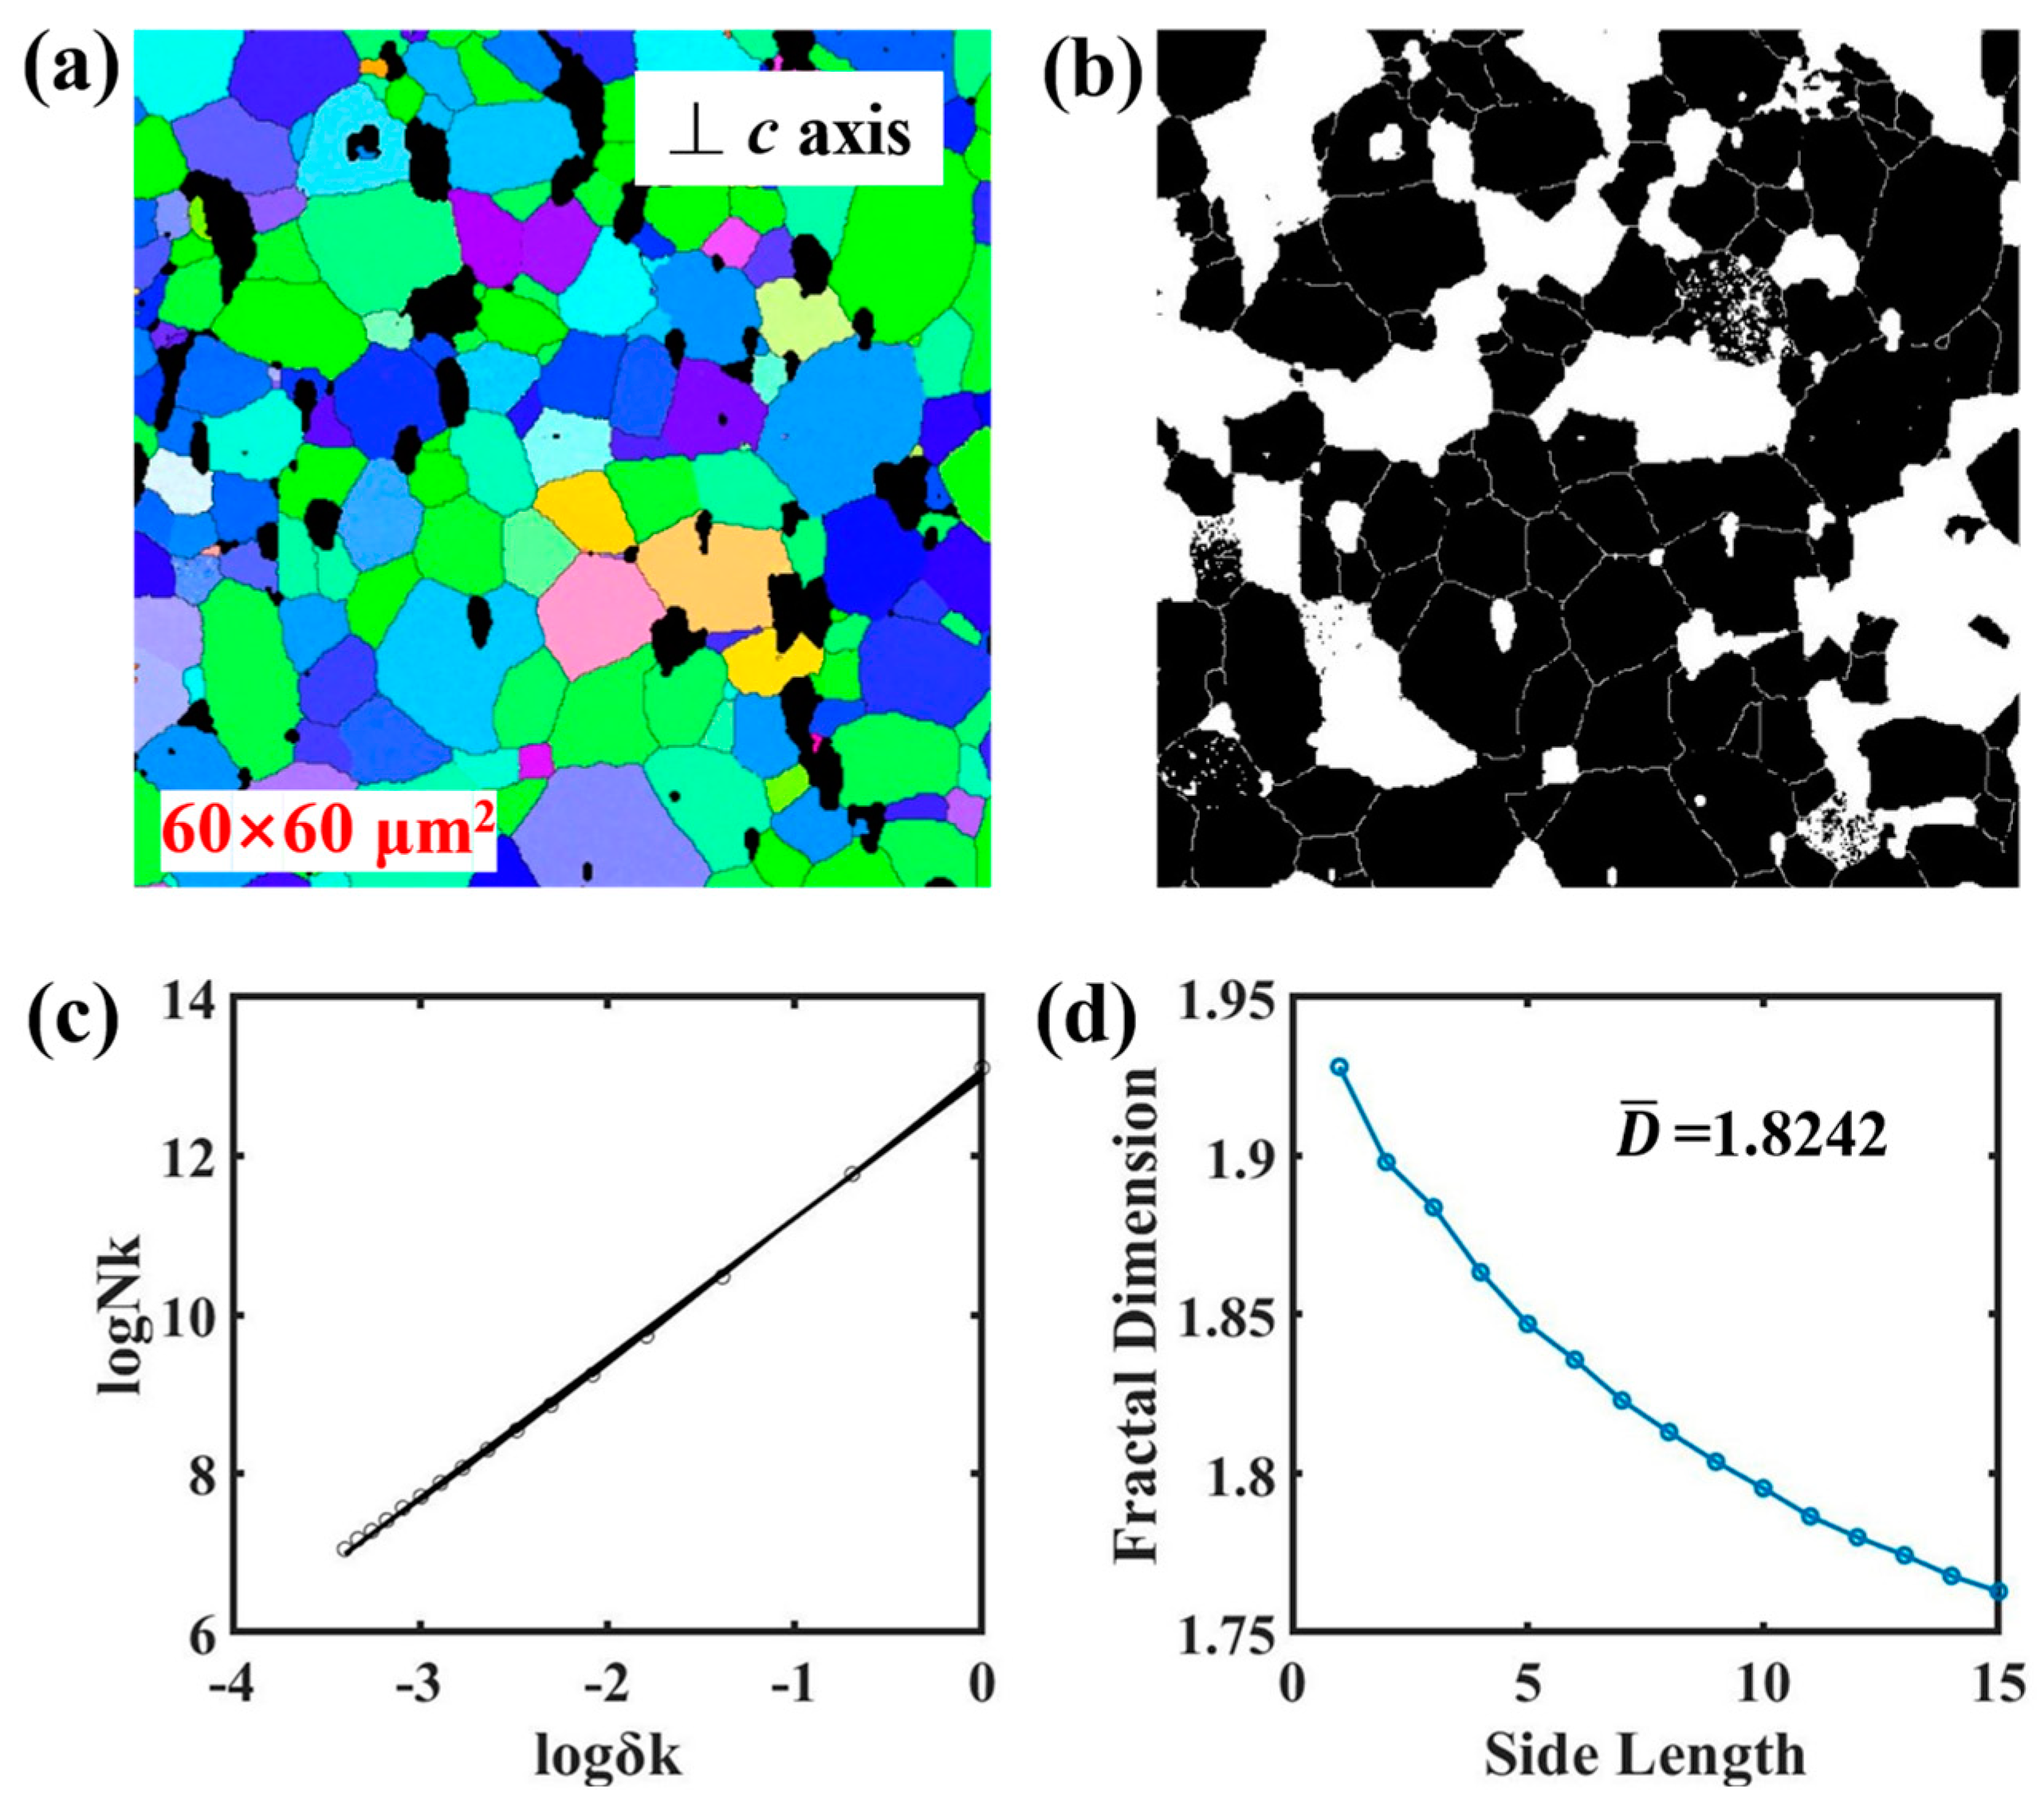
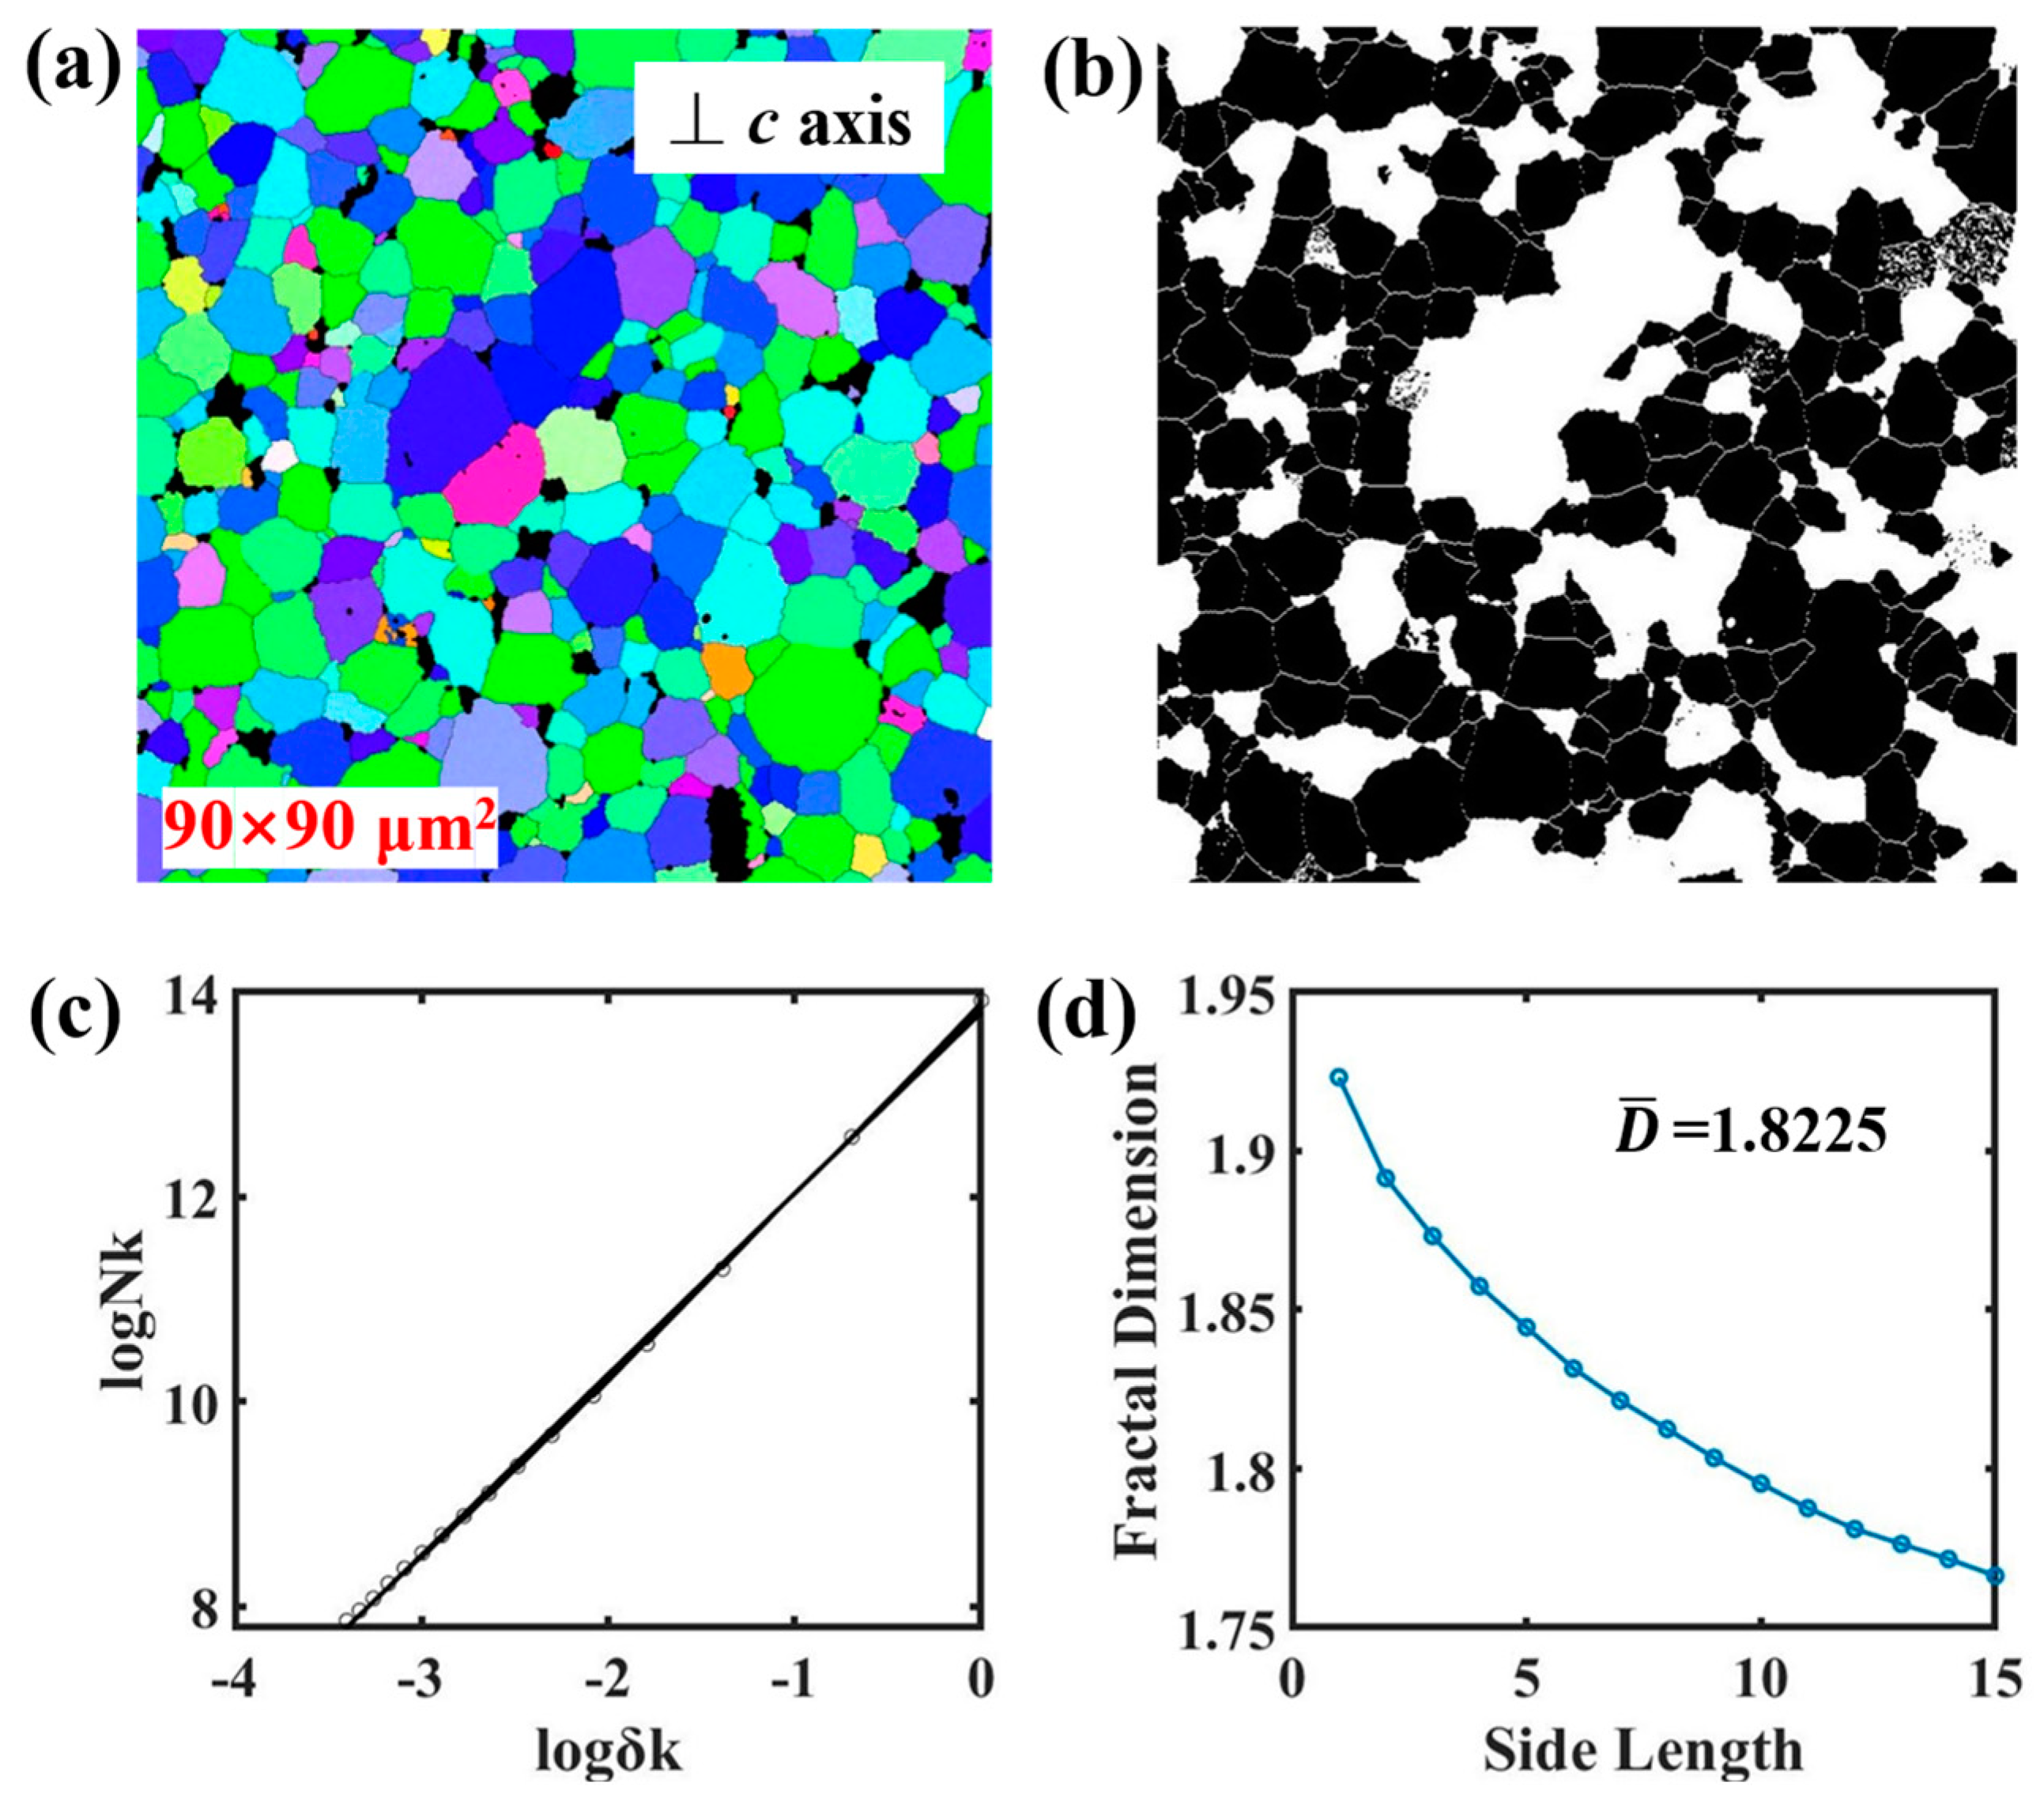
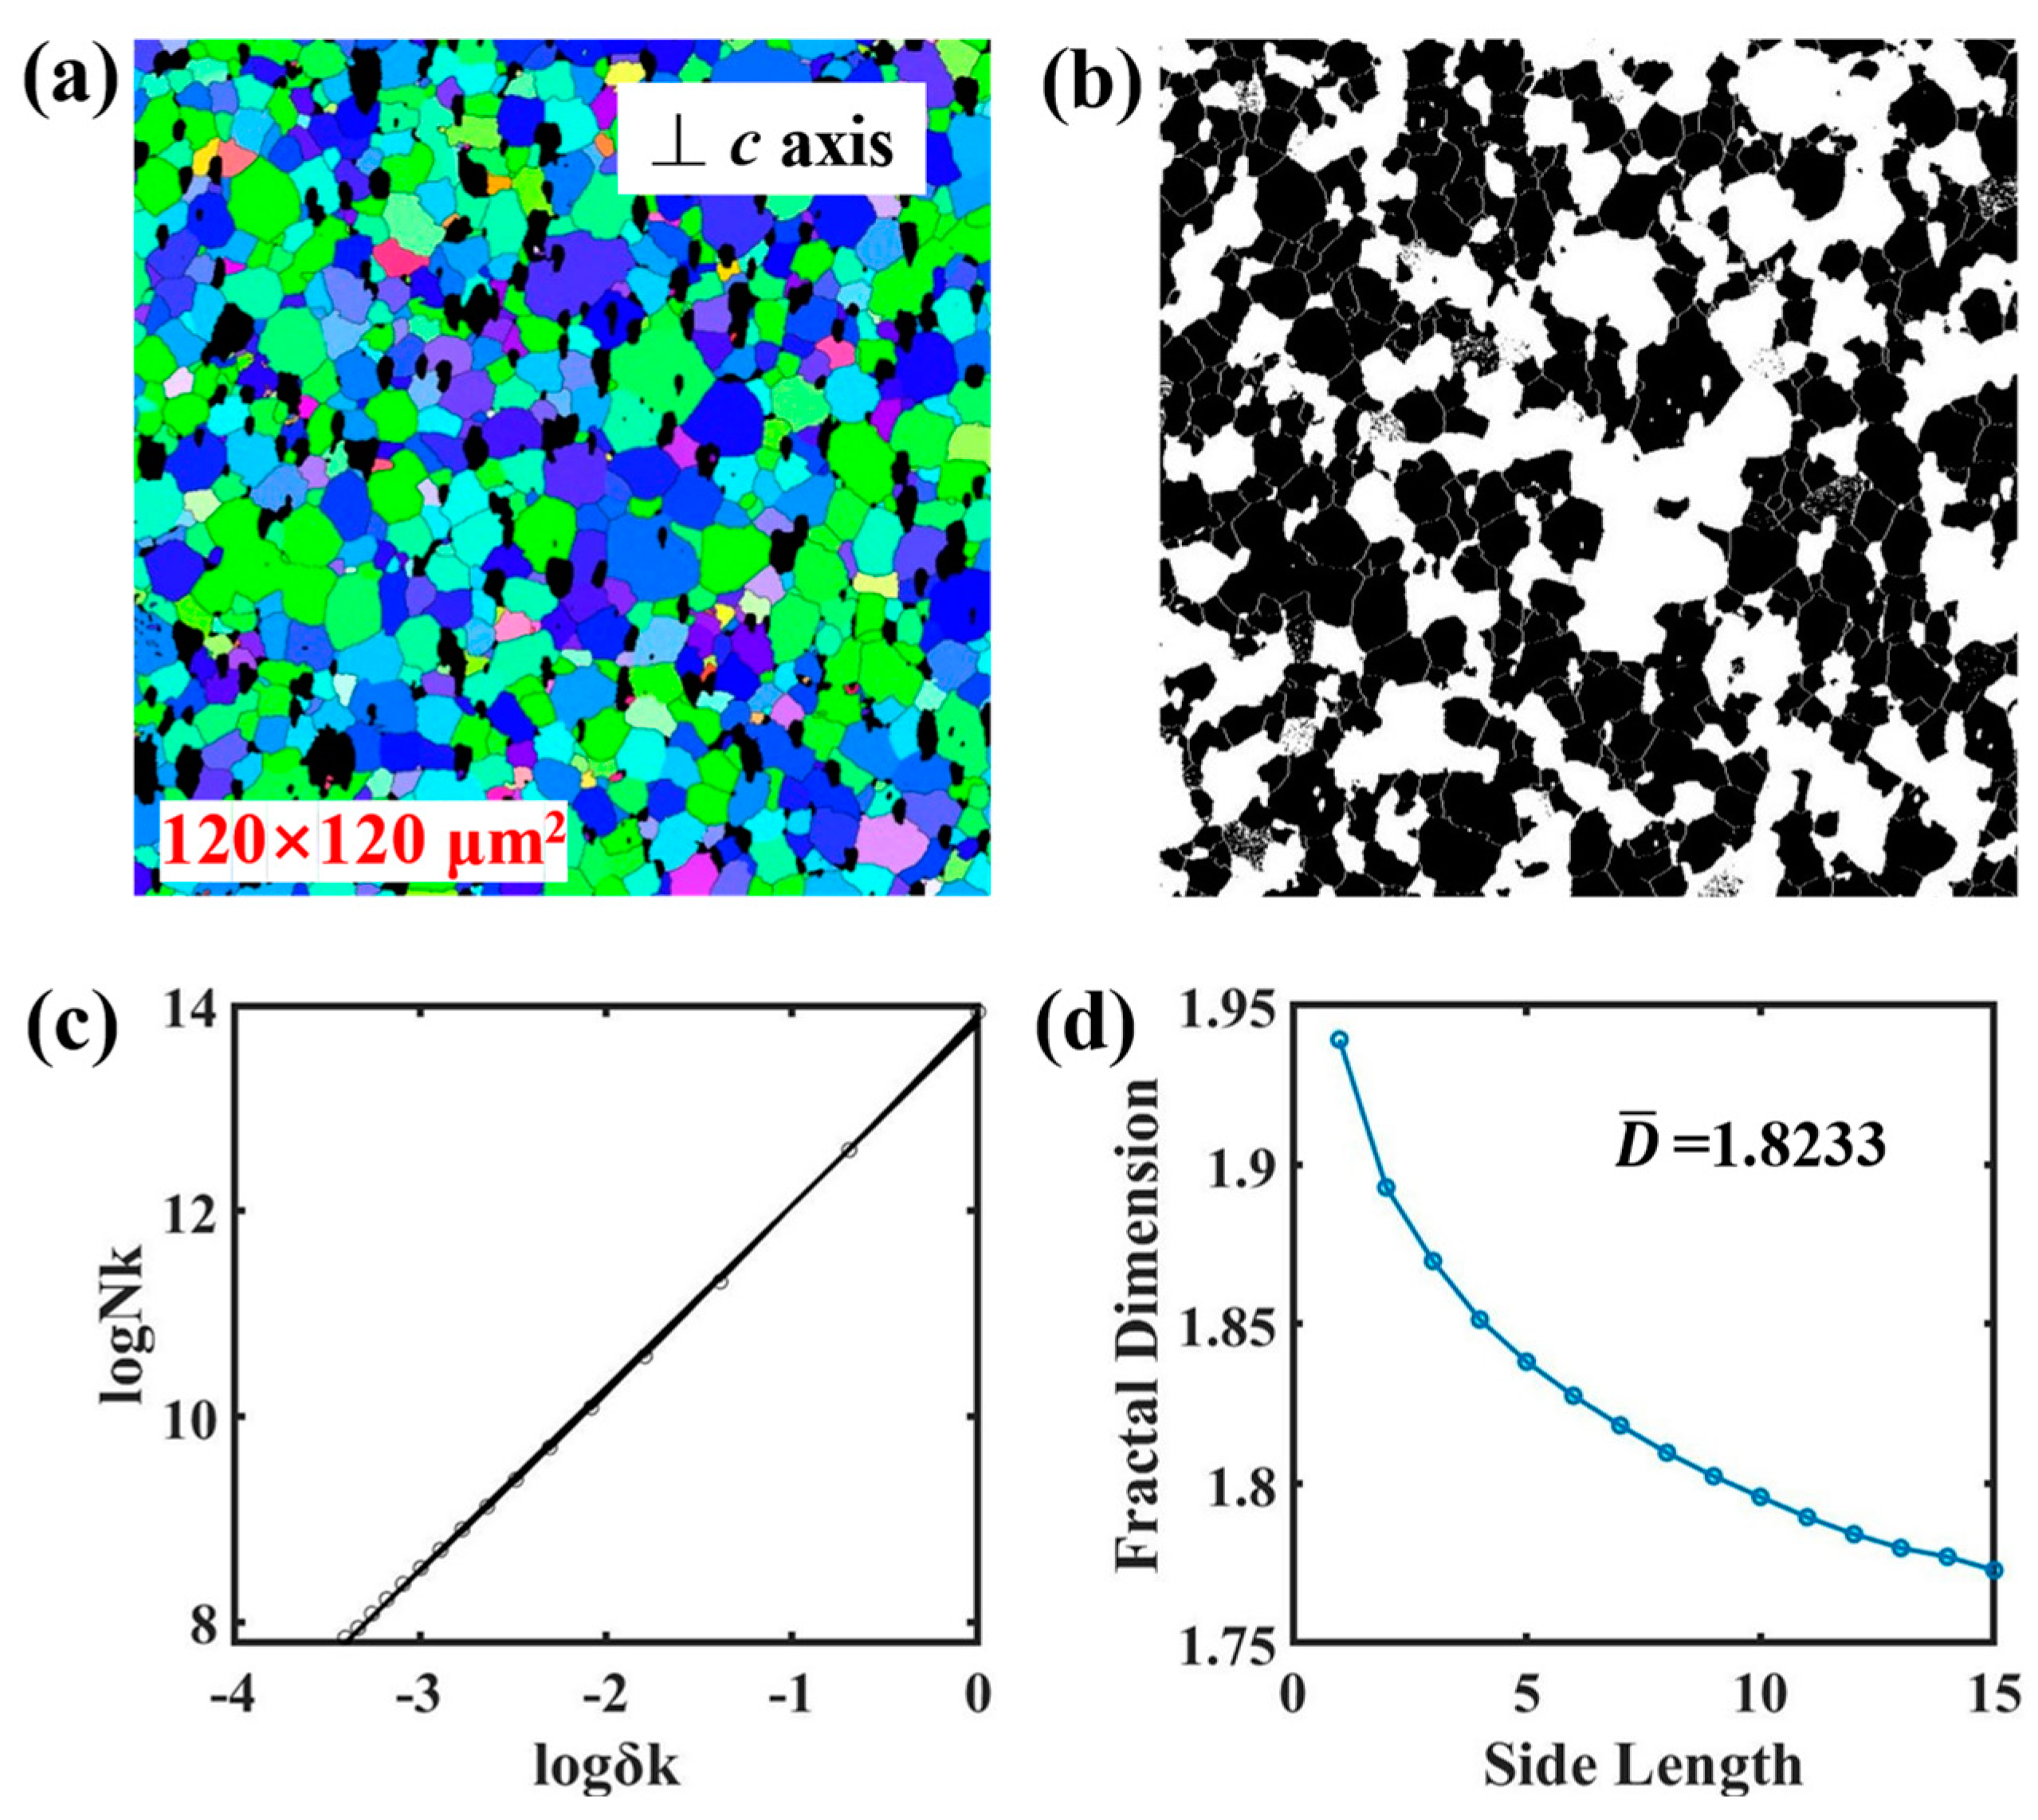
A strict fractal structure is scale-invariant, i.e., based on the self-similarity of fractal structure, the properties of tiny regions are consistent with those reflected by the overall part. In order to show the scale invariance, part of the micromorphology for S1 in Figure 10a is taken as an image of different scales to calculate the fractal dimension, and the results show that the fractal dimensions of the two are almost the same (1.7687 and 1.7699), and the standard deviation was 0.0006. In addition, Figure 11, Figure 12 and Figure 13 show the results of the EBSD test and fractal dimension calculation for one other sample with different scales. The processing results show that the fractal dimensions are 1.8242, 1.8225, and 1.8233, respectively, with a standard deviation of 0.0007. The above results indicate the existence of scale invariance within a certain range of fractal dimensions. But for Nd-Fe-B permanent magnet materials, there are scale-free ranges of fractal dimensions, as in natural or artificial materials, beyond which (larger or smaller ranges) it may lose the significance of representing the material as a whole, such as the atomic scale of the crystal structure and the nanoscale of the transmission electron microscope. The critical scales at both ends (large and small scales) are key scientific topics worth exploring for all natural or artificial materials.

4. Conclusions

The Nd-Fe-B, Pr-Nd-Fe-B, and Nd-Ce-Fe-B samples exhibit diverse remanence magnitudes, with Nd-Fe-B having the highest remanence. The fractal dimension of all three samples parallel to the c-axis orientation direction is smaller than that perpendicular to the c-axis orientation direction. The correlation between remanence and micromorphology of Nd-Fe-B permanent magnets revealed by fractal theory and EBSD data. The values of cosθ representing the degree of texture orientation are 0.9345, 0.8745, and 0.9131, respectively. The trend of the squareness factor Q obtained from the demagnetization curves agrees well with the calculated degree of texture orientation, proving the accuracy of the calculated results. The value of the multiples of uniform density representing the degree of texture orientation obtained from the EBSD data further demonstrates the accuracy of the degree of texture orientation calculated by the fractal dimension. The correlation between remanence and micromorphology of magnets contributes to the research and development of high-performance Nd-Fe-B permanent magnets. In addition, the results provide strong evidence to confirm the accuracy of fractal dimensions as well as the existence of scale invariance within a certain range of fractal dimensions.

Author Contributions

Conceptualization, M.Z.; formal analysis, Q.S. and J.B.; funding acquisition, M.Z.; investigation, Q.W.; methodology, M.Z.; project administration, M.Z.; supervision, M.Z. and Q.W.; validation, J.B.; visualization, Q.W.; writing—original draft, Q.S.; writing—review and editing, Q.S. All authors have read and agreed to the published version of the manuscript.

Funding

This work was supported by the National Key Research and Development Program of China (Grant No. 2022YFB3505600; 2021YFB3503003), the National Natural Science Foundation of China (Grant No. 51871063), the Key Technology Research and Development Program of Shandong (Grant No. 2019JZZY020210), and the Major Projects in Inner Mongolia Autonomous Region.

Data Availability Statement

No new data were created or analyzed in this study. Data sharing is not applicable to this article.

Conflicts of Interest

The authors declare that they have no conflicts of interest in this work.

References

  1. Sagawa, M.; Fujimura, S.; Togawa, N.; Yamamoto, H.; Matsuura, Y. New material for permanent magnets on a base of Nd and Fe. J. Appl. Phys. 1984, 55, 2083–2087. [Google Scholar] [CrossRef]
  2. Gutfleisch, O.; Willard, M.A.; Brück, E.; Chen, C.H.; Sankar, S.G.; Liu, J.P. Magnetic materials and devices for the 21st century: Stronger, lighter, and more energy efficient. Adv. Mater. 2011, 23, 821–842. [Google Scholar] [CrossRef] [PubMed]
  3. Hirota, K.; Nakamura, H.; Minowa, T.; Honshima, M. Coercivity enhancement by the grain boundary diffusion process to Nd–Fe–B sintered magnets. IEEE Trans. Magn. 2006, 42, 2909–2911. [Google Scholar] [CrossRef]
  4. Zhu, M.G.; Li, W.; Wang, J.D.; Zheng, L.Y.; Li, Y.F.; Zhang, K.; Feng, H.B.; Liu, T. Influence of Ce content on the rectangularity of demagnetization curves and magnetic properties of Re-Fe-B magnets sintered by double main phase alloy method. IEEE Trans. Magn. 2014, 50, 1000104. [Google Scholar] [CrossRef]
  5. Sun, Q.S.; Zhu, M.G.; Song, X.L.; Zhang, K.Q.; Xia, F.; Wu, Y.P.; Bai, J.M.; Liu, T.; Fang, Y.K.; Hou, D.L.; et al. Insight into the intrinsic magnetic properties of dual-main-phase Ce magnets through Ce chemical state. J. Magn. Magn. Mater. 2022, 564, 170180. [Google Scholar] [CrossRef]
  6. Sun, Q.S.; Zhu, M.G.; Wang, Q.; Zhu, C.Y.; Yang, J.B.; Li, W. Design of novel quasi-trivalent dual-main-phase Ce magnets with high performance by manipulating the chemical state of Ce. Acta Mater. 2023, 246, 118703. [Google Scholar] [CrossRef]
  7. Périgo, E.A.; Takiishi, H.; Motta, C.C.; Faria, R.N.; Lima, N.B. Determination of the crystallographic texture of sintered PrFeB magnets based on X-ray diffraction patterns. J. Magn. Magn. Mater. 2008, 320, 40–42. [Google Scholar] [CrossRef]
  8. Sawatzki, S.; Woodcock, T.G.; Güth, K.; Müller, K.H.; Gutfleisch, O. Calculation of remanence and degree of texture from EBSD orientation histograms and XRD rocking curves in Nd–Fe–B sintered magnets. J. Magn. Magn. Mater. 2015, 382, 219–224. [Google Scholar] [CrossRef]
  9. Dingley, D.J.; Field, D.P. Electron backscatter diffraction and orientation imaging microscopy. Mater. Sci. Technol. 1997, 13, 69–78. [Google Scholar] [CrossRef]
  10. Schwarzer, R.A. Crystallography and microstructure of thin films studied by X -ray and electron diffraction. Mater. Sci. Forum 1998, 287–288, 23–60. [Google Scholar] [CrossRef]
  11. Lillywhite, S.J.; Williams, A.J.; Davies, B.E.; Harris, I.R. A preliminary electron backscattered diffraction study of sintered NdFeB-type magnets. J. Microsc. 2002, 205, 270–277. [Google Scholar] [CrossRef]
  12. Woodcock, T.G.; Gutfleisch, O. Multi-phase EBSD mapping and local texture analysis in NdFeB sintered magnets. Acta Mater. 2011, 59, 1026–1036. [Google Scholar] [CrossRef]
  13. Woodcock, T.G.; Khlopkov, K.; Walther, A.; Dempsey, N.M.; Givord, D.; Schultz, L.; Gutfleisch, O. Interaction domains in high-performance NdFeB thick films. Scr. Mater. 2009, 60, 826–829. [Google Scholar] [CrossRef]
  14. Khlopkov, K.; Gutfleisch, O.; Hinz, D.; Müller, K.H.; Schultz, L. Evolution of interaction domains in textured fine-grained Nd2Fe14B magnets. J. Appl. Phys. 2007, 102, 023912. [Google Scholar] [CrossRef]
  15. Khlopkov, K.; Gutfleisch, O.; Eckert, D.; Hinz, D.; Wall, B.; Rodewald, W.; Müller, K.H.; Schultz, L. Local texture in Nd–Fe–B sintered magnets with maximised energy density. J. Alloy Compd. 2004, 365, 259–265. [Google Scholar] [CrossRef]
  16. Hauegen, C.G.; Silva, F.R.S.D.; Silva, F.A.S.D.; Lins, J.F.C.; Campos, M.F.D. EBSD Texture Analysis of NdFeB Magnets. Mater. Sci. Forum 2012, 727–728, 135–139. [Google Scholar] [CrossRef]
  17. Mandelbrot, B.B.; Passoja, D.E.; Paullay, A.J. Fractal character of fracture surfaces of metals. Nature 1984, 308, 721–724. [Google Scholar] [CrossRef]
  18. Li, D.; Zheng, D.J.; Zhou, Y.; Han, B.S. Formation of multi-branched domains and the calculation of their fractal dimension. Acta Phys. Sin-Ch. Ed. 1999, 48, S250-07. [Google Scholar]
  19. Catalan, G.; Béa, H.; Fusil, S.; Bibes, M.; Paruch, P.; Barthélémy, A.; Scott, J.F. Fractal dimension and size scaling of domains in thin films of multiferroic BiFeO3. Phys. Rev. Lett. 2008, 100, 027602. [Google Scholar] [CrossRef]
  20. Zhu, M.G.; Li, W.; Fang, Y.K.; Zhang, W.C.; Zhao, R.; Wang, J.D.; Li, A.H.; Feng, H.B.; Guo, Z.H.; Zhou, M.G.; et al. Fractal study for the fractured surface of Nd-Fe-B permanent magnets. J. Appl. Phys. 2011, 109, 07A706. [Google Scholar] [CrossRef]
  21. Semenova, E.M.; Lyakhova, M.B.; Kuznetsova, Y.V.; Karpenkov, D.Y.; Ivanova, A.I.; Karpenkov, A.Y.; Ivanov, D.V.; Antonov, A.S.; Sdobnyakov, N.Y. A comparative analysis of magnetic properties and microstructure of high coercivity Sm(CoCuFe)5 quasi-binary alloys in the framework of fractal geometry. J. Phys. Conf. Ser. 2020, 1658, 012050. [Google Scholar] [CrossRef]
  22. Zigert, A.D.; Dunaeva, G.G.; Semenova, E.M.; Ivanova, A.I.; Karpenkov, A.Y.; Sdobnyakov, N.Y. Fractal Dimension Behaviour of Maze Domain Pattern in Ferrite-Garnet Films During Magnetisation Reversal. J. Supercond. Nov. Magn. 2022, 35, 2187–2193. [Google Scholar] [CrossRef]
  23. Xing, Y.L.; Sun, Q.S.; Zhu, M.G.; Bai, J.M.; Wang, Q. Correlation between anisotropic fractal dimension of fracture surface and coercivity for Nd-Fe-B permanent magnets. J. Mater. Res. Technol. 2021, 15, 745–753. [Google Scholar] [CrossRef]
  24. Zhang, Y.J.; Ma, T.Y.; Yan, M.; Jin, J.Y.; Liu, X.L.; Xu, F.; Miao, X.F.; Liu, C.Y. Squareness factors of demagnetization curves for multi-main-phase Nd-Ce-Fe-B magnets with different Ce contents. J. Magn. Magn. Mater. 2019, 487, 165355. [Google Scholar] [CrossRef]
  25. Zhou, S.Z.; Dong, Q.F. Super Strong Permanent Magnets—Rare Earth Iron-Based Permanent Magnet Materials; Metallurgical Industry Press: Beijing, China, 1999. [Google Scholar]
  26. Coey, J.M.D. Magnetism and Magnetic Material; Cambridge University: Cambridge, UK, 2010. [Google Scholar]
  27. Herbst, J.F. R2Fe14B materials: Intrinsic properties and technological aspects. Rev. Mod. Phys. 1991, 63, 819–898. [Google Scholar] [CrossRef]
Figure 1. Schematic diagram of sample for EBSD and the EBSD results. (a,c) The test surfaces are perpendicular to (parallel to) the c-axis orientation direction. (b) EBSD orientation map of the surface perpendicular to the c-axis orientation direction, where sample Z direction is the c-axis orientation direction. (d) EBSD orientation map of the surface parallel to the c-axis orientation direction, where sample Y direction is the c-axis orientation direction.
Fractalfract 07 00393 g001
Figure 2. Demagnetization curves of all samples at room temperature. M is the magnetization and Mr is the remanent magnetization.
Fractalfract 07 00393 g002
Figure 3. The micromorphology of S1 sample is perpendicular to the c-axis direction (a) and parallel to the c-axis direction (e). Binary images of the surface in the direction perpendicular to the c-axis direction (b) and parallel to the c-axis direction (f). Fitted plots of surface fractal data in the direction perpendicular to c-axis direction (c) and parallel to c-axis direction (g). The dependence of the fractal dimensions on the side length of the box, of which the surface is in the direction perpendicular to c-axis direction (d) and parallel to c-axis direction (h).
Fractalfract 07 00393 g003
Figure 4. The micromorphology of S2 sample perpendicular to the c-axis direction (a) and parallel to the c-axis direction (e). Binary images of the surface in the direction perpendicular to the c-axis direction (b) and parallel to the c-axis direction (f). Fitted plots of surface fractal data in the direction perpendicular to c-axis direction (c) and parallel to c-axis direction (g). The dependence of the fractal dimensions on the side length of the box, of which the surface is in the direction perpendicular to c-axis direction (d) and parallel to c-axis direction (h).
Fractalfract 07 00393 g004
Figure 5. The micromorphology of S3 sample perpendicular to the c-axis direction (a) and parallel to the c-axis direction (e). Binary images of the surface in the direction perpendicular to the c-axis direction (b) and parallel to the c-axis direction (f). Fitted plots of surface fractal data in the direction perpendicular to c-axis direction (c) and parallel to c-axis direction (g). The dependence of the fractal dimensions on the side length of the box, of which the surface in the direction perpendicular to c-axis direction (d) and parallel to c-axis direction (h).
Fractalfract 07 00393 g005
Figure 6. Inverse pole figures (IPFs) of S1 surface perpendicular to c-axis direction (a) parallel to c-axis direction (b).
Fractalfract 07 00393 g006
Figure 7. Inverse pole figures (IPFs) of S2 surface perpendicular to c-axis direction (a) parallel to c-axis direction (b).
Fractalfract 07 00393 g007
Figure 8. Inverse pole figures (IPFs) of S3 surface perpendicular to c-axis direction (a) parallel to c-axis direction (b).
Fractalfract 07 00393 g008
Figure 9. The multiple parameters (MUD, Q, and cosθ) indicating the degree of texture orientation for S1, S2, and S3 samples. (a) Multiples of uniform density (MUD); (b) Squareness factor (Q); (c) Calculated cosθ. The different colors represent different samples.
Fractalfract 07 00393 g009
Figure 10. The micromorphology of S1 sample perpendicular to the c-axis direction (a). Binary images of the surface in the direction perpendicular to the c-axis direction (b). Fitted plots of surface fractal data in the direction perpendicular to c-axis direction (c). The dependence of the fractal dimensions on the side length of the box, of which the surface in the direction perpendicular to c-axis direction (d). (eh) The calculation of fractal dimension for part of the morphology in (a), which is marked with the box with red dotted line.
Fractalfract 07 00393 g010
Figure 11. Results of micromorphology and calculation of fractal dimension for 60×60 μm2 scales of one other sample. (a) Micromorphology; (b) Binary image; (c) Fitted plot; (d) The dependence of the fractal dimensions on the side length of the box.
Fractalfract 07 00393 g011
Figure 12. Results of micromorphology and calculation of fractal dimension for 90×90 μm2 scales of one other sample. (a) Micromorphology; (b) Binary image; (c) Fitted plot; (d) The dependence of the fractal dimensions on the side length of the box.
Fractalfract 07 00393 g012
Figure 13. Results of EBSD micromorphology and calculation of fractal dimension for 120 × 120 μm2 scales of one other sample. (a) Micromorphology; (b) Binary image; (c) Fitted plot; (d) The dependence of the fractal dimensions on the side length of the box.
Fractalfract 07 00393 g013
Table 1. Magnetic properties of S1, S2, and S3 magnets at room temperature.
SamplesMr (kGs)Hcj
(kOe)
(BH)max (MGOe)Hk
(kOe)
Q
Hk/Hcj %
S114.7413.8551.8613.5697.9
S213.7314.6544.8113.8494.5
S312.9912.2339.5311.7095.7
Disclaimer/Publisher’s Note: The statements, opinions and data contained in all publications are solely those of the individual author(s) and contributor(s) and not of MDPI and/or the editor(s). MDPI and/or the editor(s) disclaim responsibility for any injury to people or property resulting from any ideas, methods, instructions or products referred to in the content.

