Article

Comparison between the Influence of Finely Ground Phosphorous Slag and Fly Ash on Frost Resistance, Pore Structures and Fractal Features of Hydraulic Concrete

1
School of Intelligent Construction, Wuchang University of Technology, Wuhan 430002, China
2
School of Civil and Hydraulic Engineering, Huazhong University of Science and Technology, Wuhan 430002, China
3
State Key Laboratory of Water Resources and Hydropower Engineering Science, Wuhan University, Wuhan 430072, China
*
Authors to whom correspondence should be addressed.
Fractal Fract. 2022, 6(10), 598; https://doi.org/10.3390/fractalfract6100598
Submission received: 10 September 2022 / Revised: 11 October 2022 / Accepted: 12 October 2022 / Published: 15 October 2022
(This article belongs to the Section Engineering)

Abstract

:
Hydraulic concrete in cold regions is necessary for good frost resistance. The utilization of finely ground PS (FGPS) in the construction of hydropower projects could solve the pollution issue and the fly ash shortage problem. In this work, the influence of FGPS and fly ash on frost resistance, pore structure and fractal features of hydraulic concretes was investigated and compared. The main results are: (1) The inclusion of 15–45% FGPS reduced the compressive strength of plain cement concretes by about 21–52%, 7–23% and 0.4–8.2% at 3, 28 and 180 days, respectively. (2) The inclusion of FGPS less than 30% contributed to the enhancement of 180-day frost resistance. At the same dosage level, the FGPS concrete presented larger compressive strengths and better frost resistance than fly ash concrete at 28 and 180 days. (3) At 3 days, both the addition of FGPS and fly ash coarsened the pore structures. FGPS has a much stronger pore refinement effect than fly ash at 28 and 180 days. The correlation between frost resistance of hydraulic concrete and pore structure is weak. (4) At 28 days, the incorporation of FGPS and fly ash weakened the air void structure of hydraulic concrete. At 180 days, the presence of FGPS and fly ash was beneficial for refining the air void structure. The optimal dosage for FGPS and fly ash in terms of 180-day air void refinement was 30% and 15%, respectively. The frost resistance of hydraulic concretes is closely correlated with the air void structure. (5) The pore surface fractal dimension (Ds) could characterize and evaluate the pore structure of hydraulic concretes, but it was poorly correlated with the frost resistance.

1. Introduction

Hydropower is one kind of renewable, clean and cheap energy. According to the 14th five-year plan (from 2021 to 2025) for renewable energy development in China, the installed hydropower capacity will be as high as 442 million kW in China, including 86% of conventional hydropower installed capacity and 14% of pumped storage power installed capacity [1]. In recent years, a large number of huge hydropower stations is being built in northwestern and northern parts of China, including the Liangjiangkou Station (295 m) in Sichuan province, Fengning Station (120.3 m) in Hebei province, Aertashi Station (164.8 m) and Dashixia Station (247 m) in Xinjiang province, etc. In Northern and Northwestern China, the temperature is very low (usually below −20 °C) during the winter months and the temperature differences between day and night are large (usually greater than 20 °C); consequently, the frost damage to hydraulic concrete is very severe in these regions during winter seasons [2,3]. The frost damage of concrete will cause cracks and other serious durability problems, such as water and ion permeability. Some dams and hydraulic structures in service need great expense every year to repair the frost-related damages. Therefore, the hydraulic concrete in cold regions is necessary to have good frost resistance.
Fly ash is a by-product of power plants, which comprises mainly crystalline phases and some glassy phases [4,5,6,7,8]. Fly ash is extensively utilized in hydraulic concretes to reduce the hydration heat [9,10,11], erase the shrinkage development [12,13,14,15], as well as improve the durability, including the frost resistance [16,17]. It is widely accepted that a small amount of fly ash could improve the frost resistance of concretes, while the high dosage of fly ash would negatively affect the durability [18,19]. For instance, Yoon et al. [17] demonstrated that adding 10–20% fly ash to replace cement would improve the frost resistance of face slab concretes. Shen et al. [20] reported that the frost resistance of roller compacted concretes (RCCs) was significantly weakened as the fly ash content increased from 20% to 35%. However, the fly ash resources are very limited in Western and Northwestern China, where a large number of hydropower stations are being built [21,22]. Thus, it is necessary to find some other materials to partially or completely replace the fly ash in the construction of hydraulic concretes.
Phosphorous slag (PS) is a by-product from the yellow phosphorus industry. PS contains a proportion of larger than 90% glassy phases by weight and a small amount of P2O5; therefore, it has potential pozzolanic reactivity [7,23,24]. The annual production of PS is huge in Western and Northern China but it is commonly disposed of as landfill waste, which causes serious environmental pollution. In addition, the P2O5 phase in PS retards the setting time of cement and concrete and reduces the early concrete strength; hence, PS is seldomly directly used in concrete as mineral admixtures [25,26,27]. The mechanical grinding technique can produce finely ground PS (FGPS). FGPS has a strong pozzolanic reactivity since its specific surface area is large. In addition, the super-fine FGPS particles could act as nucleation sites to facilitate the generation of cement hydration products. The aforementioned effects work together to accelerate the cement hydration [7,28]. It is reported that the proper addition of FGPS could improve the mechanical property and durability of concrete, such as the frost resistance [7,22,24]. Peng et al. [23] proved that the reactive powder concrete (W/B = 0.16) added with 30–35% dosage of FGPS exhibited good frost resistance after 350 cycles of freezing and thawing. Allahverdi et al. [29] stated that the frost resistance of mortar containing 80% FGPS (303 m2/kg) was reduced, whereas its compressive strength was larger than the plain cement mortar. The usage of FGPS in the construction of hydraulic concrete is helpful for solving the pollution issue and the fly ash shortage problem. Nevertheless, the effects of FGPS with various dosages on the frost resistance of concrete, especially the hydraulic concrete, are unknown.
It is well known that the frost resistance of concretes is governed by the pore structures. The pores with a size exceeding 10 μm, which are often termed as air voids [30], are considered to significantly affect the frost resistance of concretes [31,32]. Some studies found that the increase in fly ash dosage in hardened engineered cementitious composite (ECC) mixtures led to an obvious decrease in spacing factor [18]. In addition, shon et al. [19] reported the inclusion of fly ash into concrete, which reduced the number of air voids smaller than 300 µm and, therefore, weakened the frost resistance of concrete. However, the literature is limited with regard to the influences of FGPS on the pore structures of concretes.
The objective of the present study is to deal with the two issues above. The effects of FGPS with three dosages (15%, 30% and 45%) on the frost resistance were studied. For the purpose of comparison, the influences of fly ash with the same dosages, i.e., 15%, 30% and 45%, were compared correspondingly. In addition, the difference in frost resistance caused by the FGPS and fly ash addition was investigated and compared through pore structural and fractal analysis. Moreover, fractal theory is a good method to study the complexity and irregularity of the pore structure [33,34], which provides a new standpoint to analyze the influences of FGPS on frost resistance of concretes in this study. The findings presented in this work may provide an experimental and a theoretical guide for the engineers to utilize FGPS to design hydraulic concrete with good frost resistance.

2. Materials and Analytical Methods
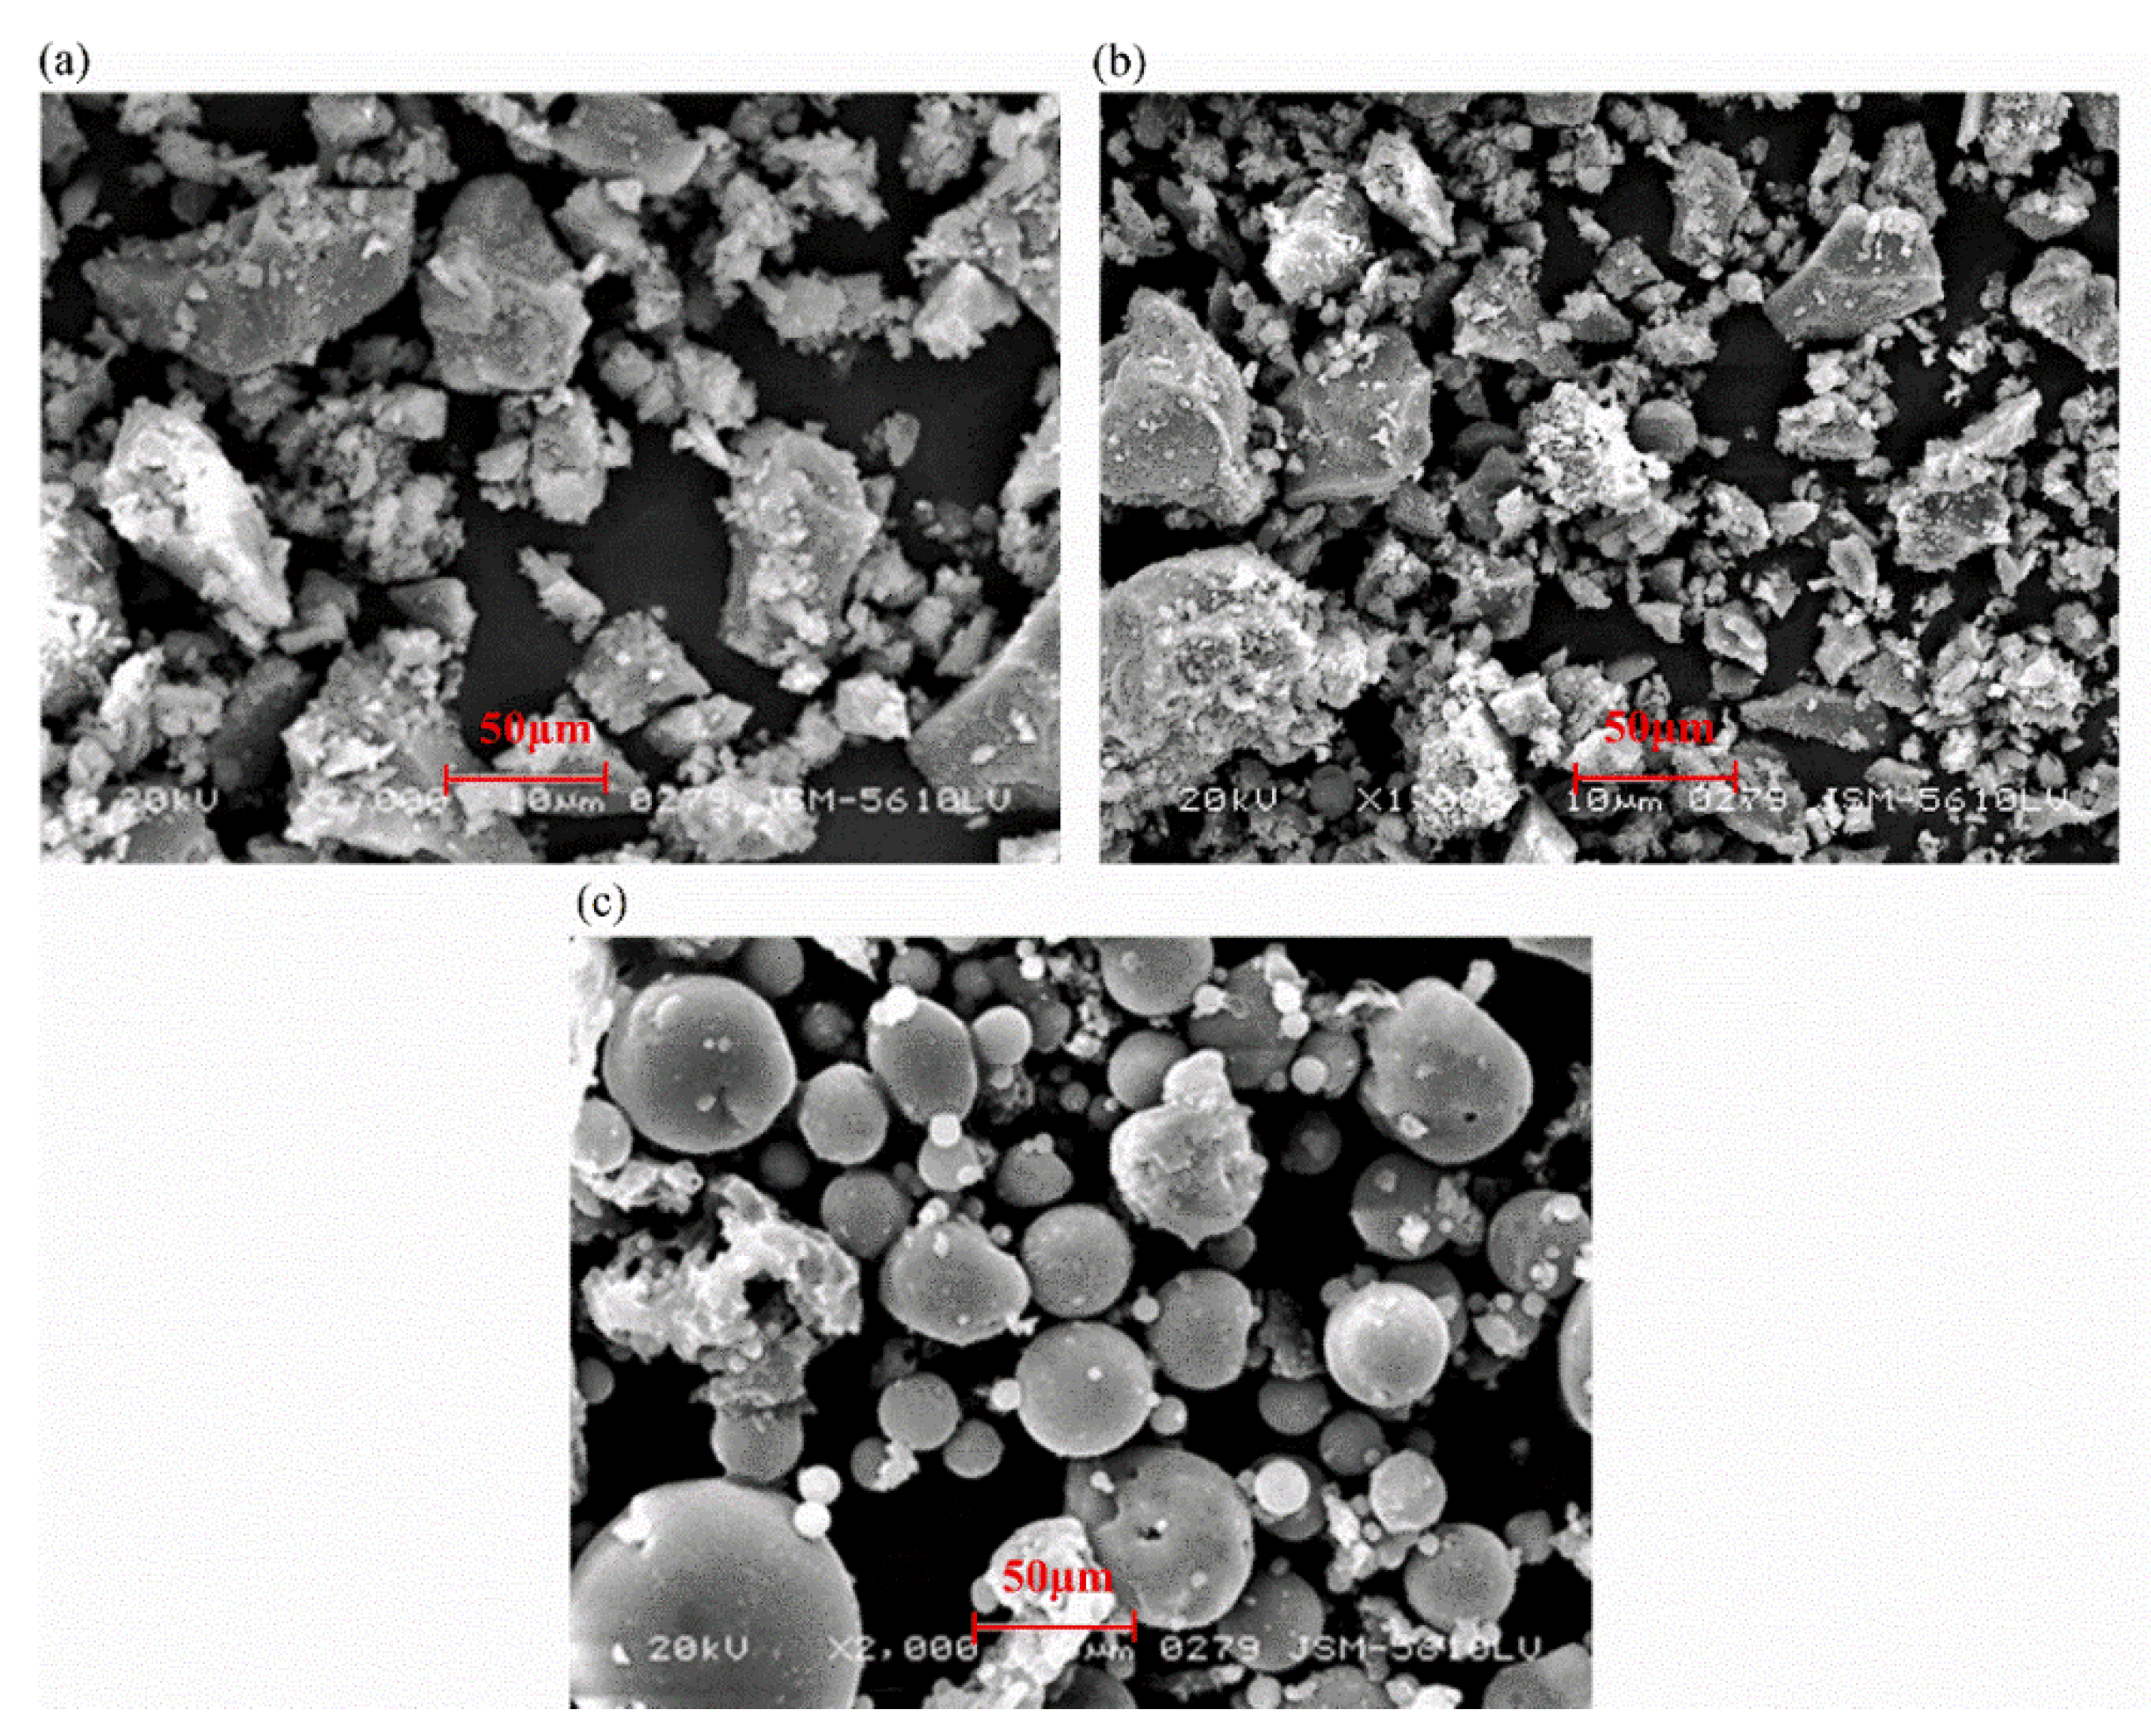
2.1. Raw Materials

In the present work, a Portland cement (CEM I) conforming to GB 175 [35] with a compressive strength of 48.6 MPa at 28 days was utilized for preparing concretes. The FGPS was provided by Guizhou WongFu yellow phosphorus Company, Guiyang City, China. This FGPS was produced by mechanically grinding the raw granulated electric furnace phosphorous slag into fine powders. An ASTM Type F Fly ash sourced from a power station in Yunnan province, China, was utilized. The physical features and oxide compositions of cement, FGPS and fly ash are shown in Table 1.
The morphology of cement, FGPS and fly ash particles by using scanning electron microscopy (SEM) is shown in Figure 1. Figure 1 shows that the morphology of FGPS is much different from that of fly ash. Cement and FGPS particles are composed primarily of fragmented and irregular polygonal particles. The irregular morphology of FGPS, just like that of cement, is caused by the mechanical grinding that could promote the pozzolanic activity of PS. Fly ash particles are mostly smooth spheres, which are caused by the rapid cooling process during its production.
In this work, both the coarse and fine aggregate were crushed limestone with a specific gravity of 2.67. According to the Chinese standard DL/T 5330 [36], the hydaulic concrete is featured by the utilization of coarse aggregate with a relatively large maximum size of 40 mm for two-graded (namely 5–20 mm and 20–40 mm) concrete or 80 mm for three-graded (namely 5–20, 20–40 and 40–80 mm) concrete. Herein, the two-graded concrete was prepared in this study. The particle size range of coarse aggregate is 5–40 mm and the weight ratio of 5–20 mm aggregate to 20–40 mm aggregate is 4:6. The fineness modulus and the maximum particle size of fine aggregate are 2.71 and 5 mm, respectively. The aggregates were kept at a saturated surface dry (SSD) condition and then used to mix concrete.

2.2. Mix Proportion Design

The mixture proportions of hydraulic concrete were designed complying with Chinese standard DL/T 5330 [36]. A control concrete PC0 was designed to have a 28-day compressive strength of about 45 MPa. Three concrete mixtures incorporating 15%, 30% and 45% of FGPS, by weight of binder, were named after CPS15, CPS30 and CPS45, respectively. For the purpose of comparison, the concretes containing the same fly ash dosages, i.e., 15%, 30% and 45%, were also prepared and designated as CFA15, CFA30 and CFA45, respectively. These seven concrete mixtures were added with some water reducer and air-entraining agent (AEA) to obtain a slump value around 60 mm and an air content about 5%. The water reducer is a polycarboxylate-based type containing some retarding compositions. The mixture proportions are exhibited in Table 2.

2.3. Test Methods

2.3.1. Setting Time Test

The initial and final setting time of hydraulic concrete containing setting time of plain cement concrete and concrete with PS and fly ash were determined by the penetration resistance method according to DL/T 5150 (test code for hydraulic concrete) [37]. The testing process and fundamentals of this method are identical to those described in ASTM C403/C403M-1999 [38]. During the test, the fresh concretes were sieved through a 50 mm aperture size sieve; then, the penetration resistance was measured by using a penetration resistance meter. By manually plotting the penetration resistance values versus elapsed time, the initial and final setting time of hydraulic concrete, which correspond to the penetration resistance of 3.5 MPa and 28 MPa, can be determined.

2.3.2. Compressive Strength Test

Compressive strengths of hydraulic concretes containing FGPS and fly ash were determined at 3, 28 and 180 days, following the method specified by DL/T 5150 [37]. These three hydration times represent the early hydration time, the middle hydration time and the long-term hydration time, respectively. After mixing, the fresh concrete was placed into 150 mm × 150 mm × 150 mm steel molds. The concrete samples were demolded after 24 h and then cured in a foggy room (20 ± 2 °C and relative humidity > 95%). Six cubic specimens were tested for each concrete mixture and the average value was adopted as a final compressive strength.

2.3.3. Frost Resistance Test

The frost resistance of hydraulic concretes containing FGPS and fly ash was evaluated at 28 and 180 days, by adopting the rapid freezing and thawing method according to DL/T 5150 [37]. The method is completely the same with Method A specified in ASTM C666 [39]. The weight loss and transverse frequency are two parameters characterizing the frost resistance of concrete.
For each concrete proportion, three specimens with dimensions of 100 mm × 100 mm × 400 mm were used to test the frost resistance and the average value was adopted as the test result. Before the test, the initial weight and transverse frequency of concrete samples were tested by using a platform scale with a precision of 3 g and a dynamic elastic modulus tester with a test range of 100 Hz–10,000 Hz, respectively. After that, the concrete samples were immersed into water in the instrument and underwent 300 cycles of freezing and thawing. Each cycle lasted for 4 h and contained two stages, the first one was a freezing stage that lasted for 2.5 h and kept at –17 °C, followed by a thawing stage during which the temperature was rapidly increased from –17 °C to 8 °C and maintained for 1.5 h. During this test, the weight and transverse frequency of concrete samples were tested every 50 cycles. After each 50 cycles, the concrete specimens were fetched from water, the surface water was dried by a cotton cloth. Then, the weight and transverse frequency of specimens were tested.

2.3.4. Pore Structure Test

According to Mindess et al.’s classical method [30], the size of pores in concretes can be classified into four domains, namely large capillary pores with a size range of 50 nm–10 μm, medium capillary pores with a size range of 10 nm–50 nm, small capillary (or gel) pores with a size range of 2.5 nm–10 nm, as well as air voids with a size larger than 10 μm, respectively.
In this study, the pore structure (2.5 nm < pore diameter < 10 μm) parameters such as porosity, pore size distribution and critical pore diameter of hydraulic concretes hydrated at 3, 28 and 180 days were tested by mercury intrusion porosimeter (MIP), using a Micromeritics AutoPore IV 9500 (manufactured by Micromeritics Instruments Corporation, Norcross, GA, USA) porosimeter. The mercury intrusion pressure of this porosimeter ranged between 0 and 414 MPa, which could test the pores with a size from about 2 nm to 10 μm. The samples used for MIP tests were the small pieces with a dimension around 6 mm. These pieces were directly cut from the inner part of the concrete samples with a size of 150 mm × 150 mm × 150 mm. The coarse aggregates should be moved from the MIP samples to prevent the influence of coarse aggregates on the accuracy of the test results. For each MIP test, four small pieces were placed into the sample tube with a volume of 5 cm3 to minimize the influence of sample variations on the accuracy of the test results.
The air void structure (10 μm < pore diameter < 2000 μm) parameters of concretes are believed to affect the frost resistance significantly [19,32,40,41]. In this study, the air void parameters of hydraulic concretes hydrated at 28 and 180 days, including the total number of air voids (N), the average air void diameter (D) and the spacing factor ( L ¯ ), were evaluated according to the linear traverse method complying with ASTM C 457 [42], by using a Rapidair 457 automatic air void analyzer. This air void analyzer could be used to probe the air voids with a size range of 10–2000 μm. The concrete specimens with dimensions of 150 mm × 150 mm × 150 mm were adopted in this test. Before the test, the cubic concrete samples were cut into some thin slices with a thickness of about 10 mm. Then, the slices were polished to generate a very smooth surface and thereafter the polished surfaces were painted with a layer of fluorescer. The air voids filled up with fluorescer in the sample surfaces can be clearly distinguished and tested under the exposure of ultraviolet radiated by the air void analyzer. For each concrete proportion, three cubic concrete samples were prepared and three slices cut from different concrete samples were measured and the average air void values were adopted as the final air void results. For each concrete mixture, seven linear traverses were tested for each slice and each traverse is 150 mm in length. Thus, the total length of linear traverses is 3150 mm for each mixture.

2.3.5. Fractal Dimension Calculation Method

The pores in concrete that are complex and inhomogeneous usually play an important role in influencing the frost resistance of concrete. The fractal dimension can characterize and illustrate the roughness and irregularities of pores in concrete very well. The fractal dimensions of materials are also considered to be closely related with the concrete macro-properties [41,43,44,45]. Many fractal models have been developed to calculate the fractal dimensions based on different physical fundamentals, among which the Zhang’s fractal model [46,47] on the basis of the MIP results can be used to calculate the fractal dimension of pore surfaces (Ds).
Herein, the Zhang’s fractal model was used to determine Ds values of hydraulic concretes. Based on Zhang’s theory, during the MIP test, there is a logarithmical correlation between the accumulated injection work on mercury ( W n ) and the total injected mercury volume ( V n ). This correlation is shown in Equation (1):
ln W n r n 2 = D s ln V n 1 / 3 r n + C
where r n refers to the pore radius, m; n means the n-th mercury injection; C represents a regression constant.
W n can be determined by Equation (2):
W n = i n p i V i
where the index i refers to the i–th mercury injection, which is between 1 and n; p i denotes the mercury pressure, Pa; V i represents the injected volume of mercury at the i-th injection, m3.
The values of W n , V n , ln W n r n 2 and ln V n 1 / 3 r n can be determined by using the MIP results and Equation (2). Then, the Ds, which is the slope of the straight line in Equation (1), can be calculated by Equation (1).

3. Results and Discussion

3.1. Setting Time of Fresh Hydraulic Concrete

Table 3 shows the setting time of hydraulic concrete added with FGPS and fly ash.
Table 3 shows that both the FGPS and fly ash inclusion could retard the setting time, including the initial setting time and the final setting time, whereas a stronger retarding effect of FGPS than fly ash can be observed. For example, the initial and final setting times of CPS30 concrete were 13 h 10 min and 18 h 30 min, respectively, which were retarded by about 1 h 50 min and 1 h 35 min compared with those of CFA30 concrete and about 2 h 50 min and 3 h 40 min retarded compared with those of PC0 concrete, respectively. This is because the P2O5 phase in FGPS would retard the cement hydration and prolong the setting time of cement [25,26,27]. In addition, from Table 3, 3 h longer initial setting time and 4 h 36 min longer final setting time can be observed due to the increase in FGPS dosage from 15% to 45%, indicating the retarding effect became stronger with increasing FGPS content. A similar result was reported by other studies [22,25,26], which pointed out that the negative retarding effect would enhance with the PS dosage for concrete.

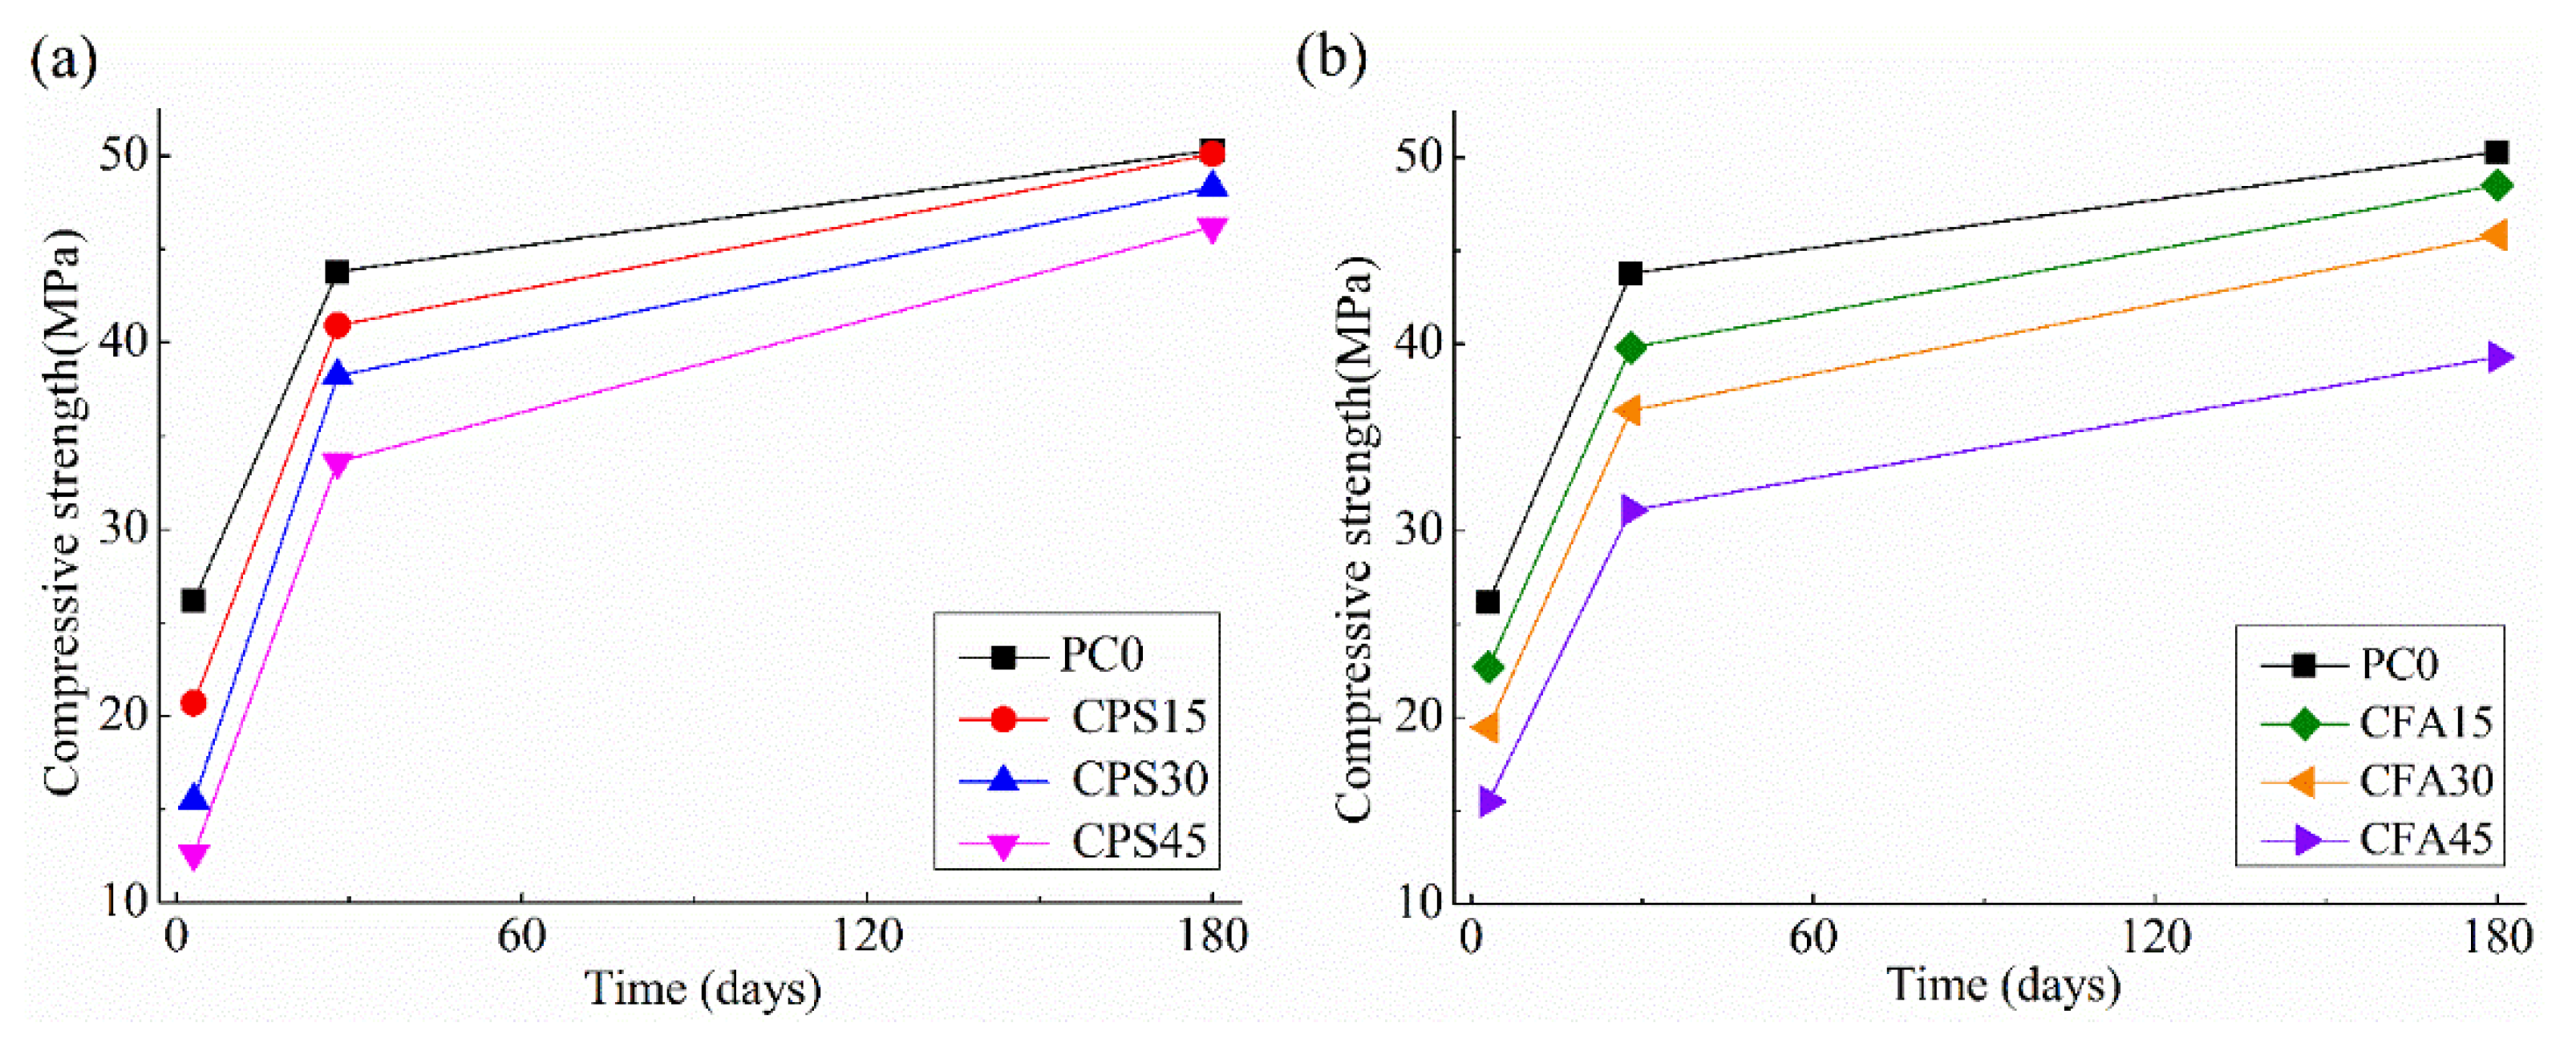
3.2. Compressive Strength of Hydraulic Concrete

Figure 2 shows the compressive strength of PC0 concrete and concretes containing FGPS and fly ash with different dosages at 3, 28 and 180 days. Form Figure 2, the compressive strengths of all the concretes enhanced with the progress of hydration. Figure 2 also shows that the FGPS and fly ash have different influences on the compressive strength development of hydraulic concrete.
In addition, Figure 2 shows that both the FGPS and fly ash addition reduced the compressive strength of hydraulic concrete at 3 days and the higher content of FGPS and fly ash led to a larger reduction in compressive strength. For instance, the compressive strengths of CPS15 and CFA15 concretes were declined by about 21% and 13% compared with that of PC0 concrete at 3 days, respectively. As for 45% dosage level, the reductions in strengths for CPS45 and CFA45 concretes were 52% and 41% at 3 days, respectively. The reductions in early strength of both FGPS concrete and fly ash concrete were mainly owing to the dilution effect of FGPS and fly ash on cement amount; that is, the cement amount was reduced and, consequently, the compressive strength development was slowed down [22,48]. Nevertheless, Figure 2 indicates that the 3-day strength of FGPS concrete was weaker than that of fly ash concrete under the same dosage level. The weaker strength of FGPS concrete than fly ash concrete can be attributed to the retarding effect of FGPS, which inhibited the cement hydration and, hence, weakened the early mechanical strength of concrete. These results correspond well with the setting time results above and the data in other studies [22,48,49,50].
As hydration proceeded, the compressive strengths of both FGPS concrete and fly ash concrete increased. It can be observed that the strength gap between FGPS concrete and PC concrete was reduced from 21–52% at 3 days to 7–23% at 28 days. At 180 days, CPS15 and CPS30 concretes exhibited only 0.4% and 4.0% smaller compressive strength than PC0 concrete, respectively, while CPS45 concrete showed about 8.2% reduction in compressive strength over PC0. These findings are in line with the strength development trend of FGPS-cement pastes/mortars/concretes reported by other studies [7,22,24,48]. For instance, Zhang et al. [48] confirmed that the compressive strength of PS-cement mortars added with 15–30% FGPS at 90 days was similar to that of plain cement mortars. Hu et al. [7] obtained the same trend for concretes with W/B ratios of 0.35 and 0.45 at 90 and 360 days. The results above verified that the retardation effect of FGPS no longer took effect after the initial several days and the presence of FGPS subsequently promoted the cement hydration. It was reported that the fine FGPS particles provided nucleation sites for the precipitation of hydration products and accelerated the cement hydration [24,28]. In addition, previous investigations have shown that the fine mechanical grinding produced lots of lattice distortion and chemical bond breakages on FGPS particle surfaces, which largely enhanced the pozzolanic reactivity of FGPS [23,27]. As expected, the pozzolanic reaction between FGPS and Ca(OH)2 would produce more hydration products at 28 and 180 days of hydration, which could densify the microstructure and, consequently, enhance the mechanical strength of concrete [22,25,27,51,52,53,54,55,56].
Similar improvements in strength of fly ash concrete can be found at 28 and 180 days. The gap between fly ash concrete and PC0 concrete was reduced from 13–41% at 3 days to 9–29% at 28 days and this gap was further reduced to 3.6–21.9% at 180 days, indicating that the presence of fly ash increased the strength at 28 and 180 days. A similar long-term compressive strength increase in fly ash concrete was reported by Hu et al. [57] and Matos et al. [58]. As other quantitative studies [13,28,59,60] demonstrated, the reaction degrees of fly ash in concrete were 9–23% at 28 days and were 26–33% at 180 days [13,59]. Obviously, the largely occurring pozzolanic reaction is helpful for the strength increment of concrete at 28 and 180 days. An interesting comparison of the strength data indicates that the compressive strengths of FGPS concrete are 2.6–7.4% larger at 28 days and 3.2–15.0% larger at 180 days than those of fly ash concrete, indicating that FGPS exhibited much higher pozzolanic reactivity than fly ash after the initial several days.

3.3. Frost Resistance of Hydraulic Concrete

The frost resistance results of concrete containing FGPS and fly ash hydrated at 28 and 180 days are exhibited in Figure 3 and Figure 4, respectively. It can be seen from Figure 3 and Figure 4 that FGPS and fly ash have different effects on the frost resistance of concrete.
Figure 3 shows that, at 28 days, the frost resistance of hydraulic concretes was gradually weakened with the FGPS content increasing from 0 to 45%. Specifically, the mass loss increased from 3.75% to 5.62% and the relative dynamic elastic modulus decreased from 72% to 41.3% at the same time, indicating the FGPS addition in concrete at 28 days was detrimental to the frost resistance of hydraulic concretes. This result is consistent with the study conducted by Allahverdi et al. [29], who observed that the cement mortar added with 80% FGPS showed weaker frost resistance than the plain cement mortar at 28 and 56 days. They ascribed the weakened frost resistance of FGPS mortar hydrated at middle age to the coarse internal pore structure, in which the freezable water caused great expansive pressure on the pore wall when exposed to freeze–thaw cycles.
Similarly, the fly ash concrete hydrated at 28 days exhibited the same weakened frost resistance when the fly ash content increased from 0 to 45%. The same trend for concrete hydrated at 28 days due to fly addition was reported by Shon et al. [19], Shen et al. [20] and Şahmaran et al. [31]. This is because the reactivity of fly ash at middle hydration age is still weak; the fly ash addition at this time deteriorated the micro-structure development and raised the fraction of large pores in the concrete mixture [20]. In addition, as the fly ash dosage increased, the fly ash inclusion was detrimental to the strength development and increasingly weakened the resistance of concrete to surface scaling [19]. The superposition of the two negative effects above inevitably weakened the frost resistance of fly ash concrete at middle hydration age.
At 180 days, it can be observed from Figure 3 and Figure 4 that, under the dosage of 30%, the frost resistance of hydraulic concretes enhanced with the FGPS dosage, indicating that the inclusion of FGPS less than 30% contributed to the enhancement of frost resistance. A similar finding was observed by Peng et al. [23], who stated that the good resistance of concrete added with less than 30% FGPS was due to the small capillary pore size and the low porosity after the FGPS addition. However, beyond a 30% dosage, CPS45 concrete exhibited slightly weaker frost resistance (i.e., about 9% larger weight loss and 8% smaller relative dynamic elastic modulus) than the PC0 one, suggesting that the optimal FGPS dosage in terms of frost resistance enhancement for hydraulic concrete may be around 30%.
As for fly ash, it can be observed from Figure 3 and Figure 4 that the optimal fly ash dosage may be 15%, since CFA15 presented better frost resistance than PC0 at 180 days. This optimal value is in accordance with the finding by Yoon et al. [19]. They reported that the incorporation of fly ash less than 20% improved the frost resistance of face slab concrete. When the fly ash content exceeds this optimal value (15%) in this study, the frost resistance of hydraulic concrete is largely weakened. For instance, the weight loss and relative dynamic elastic modulus of CFA45 concrete were about 31% larger and 25% smaller than those of PC0 concrete, respectively. Similar largely weakened frost resistance has been reported for roller compacted concrete (RCC) when the fly ash dosage increased from 20% to 35% [20] and for ordinary concrete as the fly ash dosage raised from 33% to 50% [18].
Nevertheless, a comparison between the frost resistance of FGPS concretes and fly ash concretes at 28 and 180 days revealed that, at the same dosage level, the FGPS concrete presented better frost resistance than fly ash concrete. For example, as shown in Figure 4, CFA45 concrete has about 21% larger weight loss and 18% smaller relative dynamic elastic modulus than the CPS45 one. This difference in frost resistance can be explained by the stronger reactivity of FGPS than fly ash after the initial several days. As evidenced in Section 3.2, FGPS concrete exhibited larger compressive strength than fly ash concrete at 28 and 180 days. The difference in reactivity may produce different pore structures in concrete, which may have different influences on frost resistance of concrete. This opinion will be further verified in the next section.

3.4. Pore Structures at Different Scales

3.4.1. Pore Structure (3 nm < Pore Diameter < 10 μm) Parameters

Table 4 presents the pore structure (3 nm < pore diameter < 10 μm) parameters of hydraulic concrete incorporated with FGPS and fly ash hydrated at 3, 28 and 180 days, including the critical pore diameter, porosity and the pore size distribution. Table 4 indicates that the pore structure of all the concretes in this study refined with the curing time.
Table 4 also shows that FGPS concrete has a different development in pore structure with the fly ash concrete at various hydration times. At 3 days, both the addition of FGPS and fly ash coarsened the pore structures. As Table 4 indicates, with increasing the dosage of FGPS and fly ash from 15% to 45%, the critical pore diameter and porosity kept increasing and the pore structure kept shifting towards the large pore diameter fraction, indicating the addition of FGPS and fly ash has negative effects on early pore structures of concrete at 3 days. A similar finding of coarsened pore structure by FGPS and fly ash was reported elsewhere, which could be attributed to the inert nature of FGPS [24,25,48] and fly ash [10,61,62] at early age as well as their dilution effects on cement amount. Nevertheless, it can be found that the coarsening effect of FGPS was more prominent than fly ash. Specifically, CPS45 concrete exhibited the critical pore diameter, porosity and fraction of large capillary pores (shortened as V50 nm–10 μm thereafter) of 320 nm, 42.5 nm and 81.7% at 3 days, which were 84 nm, 5.2 nm and 5.4% larger than those of the CPA45 one, respectively. This is because, despite the dilution effect, FGPS has a retarding effect on the early cement hydration; as a consequence, more large capillary pores cannot be filled sufficiently by the hydration products at early age [24,48]. Since the mechanical strength of concrete is negatively correlated with the porosity [63], the largely coarsened pore structure could inevitably lead to a decrease in mechanical strength.
At 28 days, Table 4 shows the difference in pore structure parameters between CPS15 concrete and PC0 concrete was minor. Additionally, Table 4 presents that, at the same dosage level, FGPS concrete exhibited smaller critical pore diameter, porosity and V50 nm–10 μm values. These results, which are in accordance with the strength result before, suggest that the addition of FGPS began to refine the pores at 28 days and FGPS had a strong pozzolanic reactivity than fly ash. As discussed before, FGPS has no retardation effect on cement hydration after the initial several days of hydration [26,48]. Peng et al. [23] reported that the pozzolanic reaction between FGPS and Ca(OH)2 produced a large quantity of C-S-H that can fill up the pores of concrete, resulting in a refined pore structure. However, beyond a dosage of 15%, Table 4 displays that the FGPS concrete presented much coarser pore structure than the PC0 concrete, suggesting the pozzolanic effect of FGPS was not strong at 28 days.
At 180 days, the pore refinement effect of FGPS became more notable than that at 28 days. Table 4 shows that all of the FGPS concretes presented smaller critical pore diameter, porosity and V50 nm–10 μm values than the C0 one at 180 days. Moreover, Table 4 illustrates that this pore refinement effect enhanced with the FGPS dosage. For instance, as the FGPS dosage increased from 15% to 40%, the critical pore diameter, porosity and V50 nm–10 μm values of FGPS concrete declined significantly from 20 nm, 42.5 nm and 81.7% to 84 nm, 5.2 nm and 5.4%. As revealed by Gao et al. [64], the large pores in concrete can be converted and divided into small ones, owing to the inclusion of FGPS at long-term age.
Regarding fly ash, the results in Table 4 show that the porous structure of CFA15 and CFA30 concretes was more refined than that of PC0 concrete, because the pozzolanic reaction of fly ash at long-term age could also produce lots of secondary C-S-H to fill up the pores [5,60]. Nevertheless, a careful comparison of the results in Table 4 shows that CFA15 and CFA30 exhibited coarser pore structures than CPS15 and CPS 30 concretes, respectively. Moreover, much different from FGPS, when the fly ash dosage increased to 45%, the refinement effect of fly ash disappeared and the pore structures of CFA45 concrete were largely coarsened compared with the C0 and CFA30 concretes. These experimental phenomena demonstrate that FGPS has a much stronger pore refinement effect than fly ash, suggesting the maximal dosage of FGPS in practical hydraulic concrete could be increased to 45% in terms of pore refinement.

3.4.2. Air Void (10 μm < Pore Diameter < 2000 μm) Parameters

The air void parameters of hydraulic concrete cured at 28 and 180 days, including N, D and L ¯ , are shown in Table 5. Table 5 shows that all of the hardened concrete mixtures have almost the same air content, around 5%, by adjusting the AEA dosage. Nevertheless, Table 5 clearly exhibits that these concretes have obviously different air void parameters. As Hasholt et al. [18] pointed out, concretes with the same air content may have quite different air void structures, such as D and L ¯ .
Table 5 indicates that both FGPS and fly ash have a significant impact on the development of air void in concrete. At 28 days, increasing FGPS dosage from 0 to 45% reduced the N value from 721 to 573 and increased D and L ¯ values from 164 μm to 198 μm and from 239 μm to 297 μm, respectively. Generally, at the same air content level, a smaller D and a larger N value would lead to a smaller L ¯ and, therefore, better frost resistance [32]. Hence, the reduced N values and enlarged D and L ¯ values due to FGPS addition at 28 days were detrimental to the frost resistance of hydraulic concrete.
A similar weakened air void structure can be found when adding fly ash into concrete. Table 5 shows that adding fly ash from 0 to 45% reduced the N values and raised the D and L ¯ values continuously, indicating the fly ash addition was harmful to the 28-day frost resistance of hydraulic concrete. The decrease in N due to fly ash addition was also reported by Shon et al. [19], who stated that adding fly ash to concrete reduced the number of air voids, especially the air void smaller than 300 µm at middle hydration age. They attributed this finding to the fact that the carbon residue in fly ash would adsorb the AEA and inhibit the generation of micro-air bubbles. As supported by the data in Table 2, regarding the higher dosage of fly ash in concrete, a higher AEA amount is needed to achieve the same air content.
At 180 days, it can be found that the addition of FGPS under a dosage of 30% was beneficial for the refinement on air void structure, viz. the increase in N values and decrease in D and L ¯ values. However, this refinement on air void structure disappeared when the FGPS dosage increased to 45%. Table 5 indicates that, when the FGPS dosage increased from 0 to 30%, the N value increased from 748 to 851 and the further increase in FGPS dosage to 45% decreased the N to 654, suggesting that there seems to be an optimal dosage of 30% for FGPS in terms of air void refinement.
As for fly ash, Table 5 indicates that the addition of fly ash below a 15% dosage refined the air void structure of concretes. Specifically, N and L ¯ value of CFA15 concrete was 49 larger and 11 μm smaller than those of the PC0 one, respectively. The refinement of fly ash on air void structure could be attributed to the pozzolanic reaction of fly ash. As Şahmaran et al. [31] stated, the reaction products of fly ash could fill the large pores and transform the system containing large pores into smaller ones. Beyond a fly ash dosage of 15%, the air void structures of concretes were weakened when the fly ash dosage increased up to 45%. Thus, an optimal dosage of fly ash in terms of air void refinement seems to be about 15%. The difference in optimal dosage between FGPS and fly ash above could be explained by their pozzolanic reactivity difference and FGPS with a stronger pozzolanic reactivity can refine the air void more effectively than fly ash.

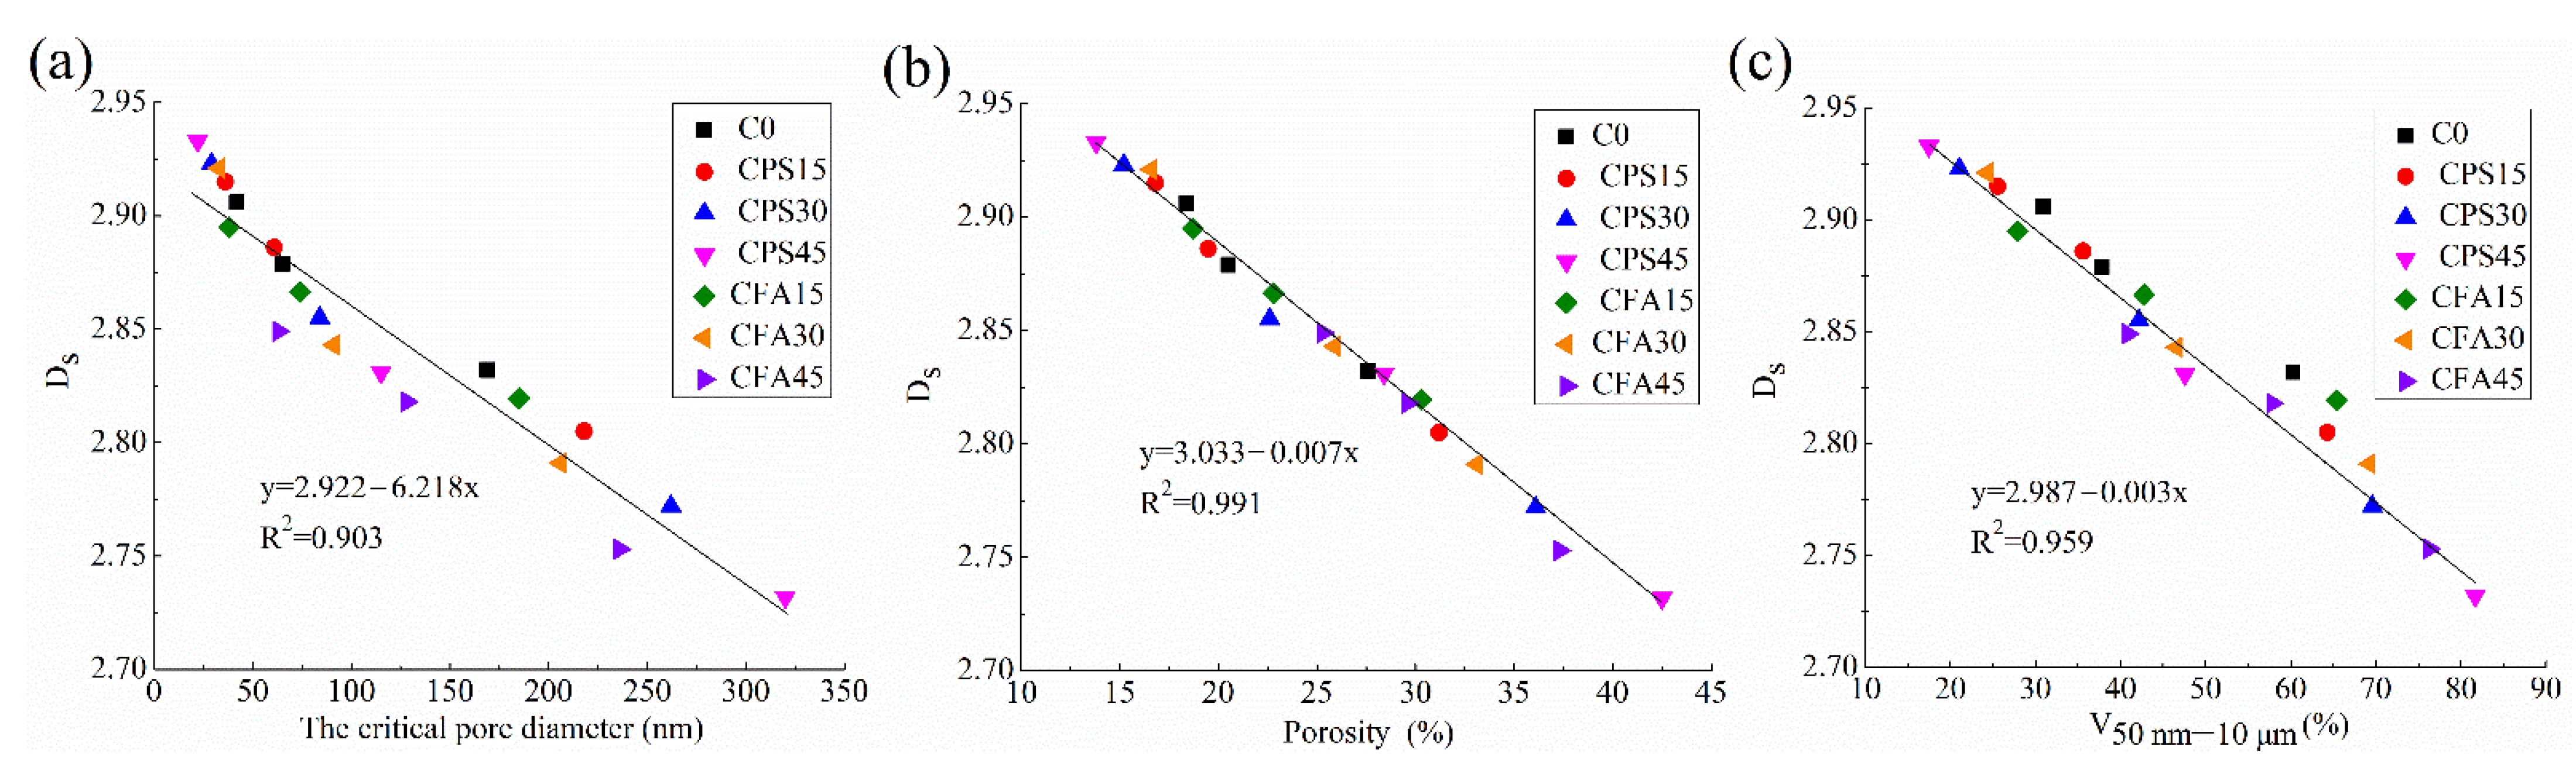
3.5. Pore Surface Fractal Dimension (Ds) of Concrete

Ds values of hydraulic concretes added with FGPS and fly ash at 3, 28 and 180 days are shown in Table 6. The high R2 values approaching 1.0 in Table 6 verify that the calculated Ds values through Equation (1) possess adequate accuracy and reliability.
According to the fractal theory [33,65,66], Ds is meaningful only in a range between 2.0 and 3.0; if the object has a smooth surface, it has a Ds of 2.0, whereas a Ds value approaching 3.0 implies that the pore surface of the object becomes rougher and more complex. Table 6 shows that the Ds values in this work are between 2.732 and 2.933, demonstrating that the hydraulic concretes added with FGPS and fly ash exhibited typical fractal characteristics.
In addition, the relationship between Ds and the pore structure parameters of hydraulic concretes, including the critical pore diameter, porosity and V50 nm–10 μm, are displayed in Figure 5. Figure 5 indicates that the critical pore diameter, porosity and V50 nm–10 μm are negatively linearly correlated with Ds, with high R2 values of 0.903, 0.991 and 0.959, respectively, revealing the Ds could characterize and evaluate the pore structure of hydraulic concretes. This finding is consistent with other fractal studies [33,34,66], which proposed that the Ds can reflect and evaluate, comprehensively and accurately, the pore structure of concrete.

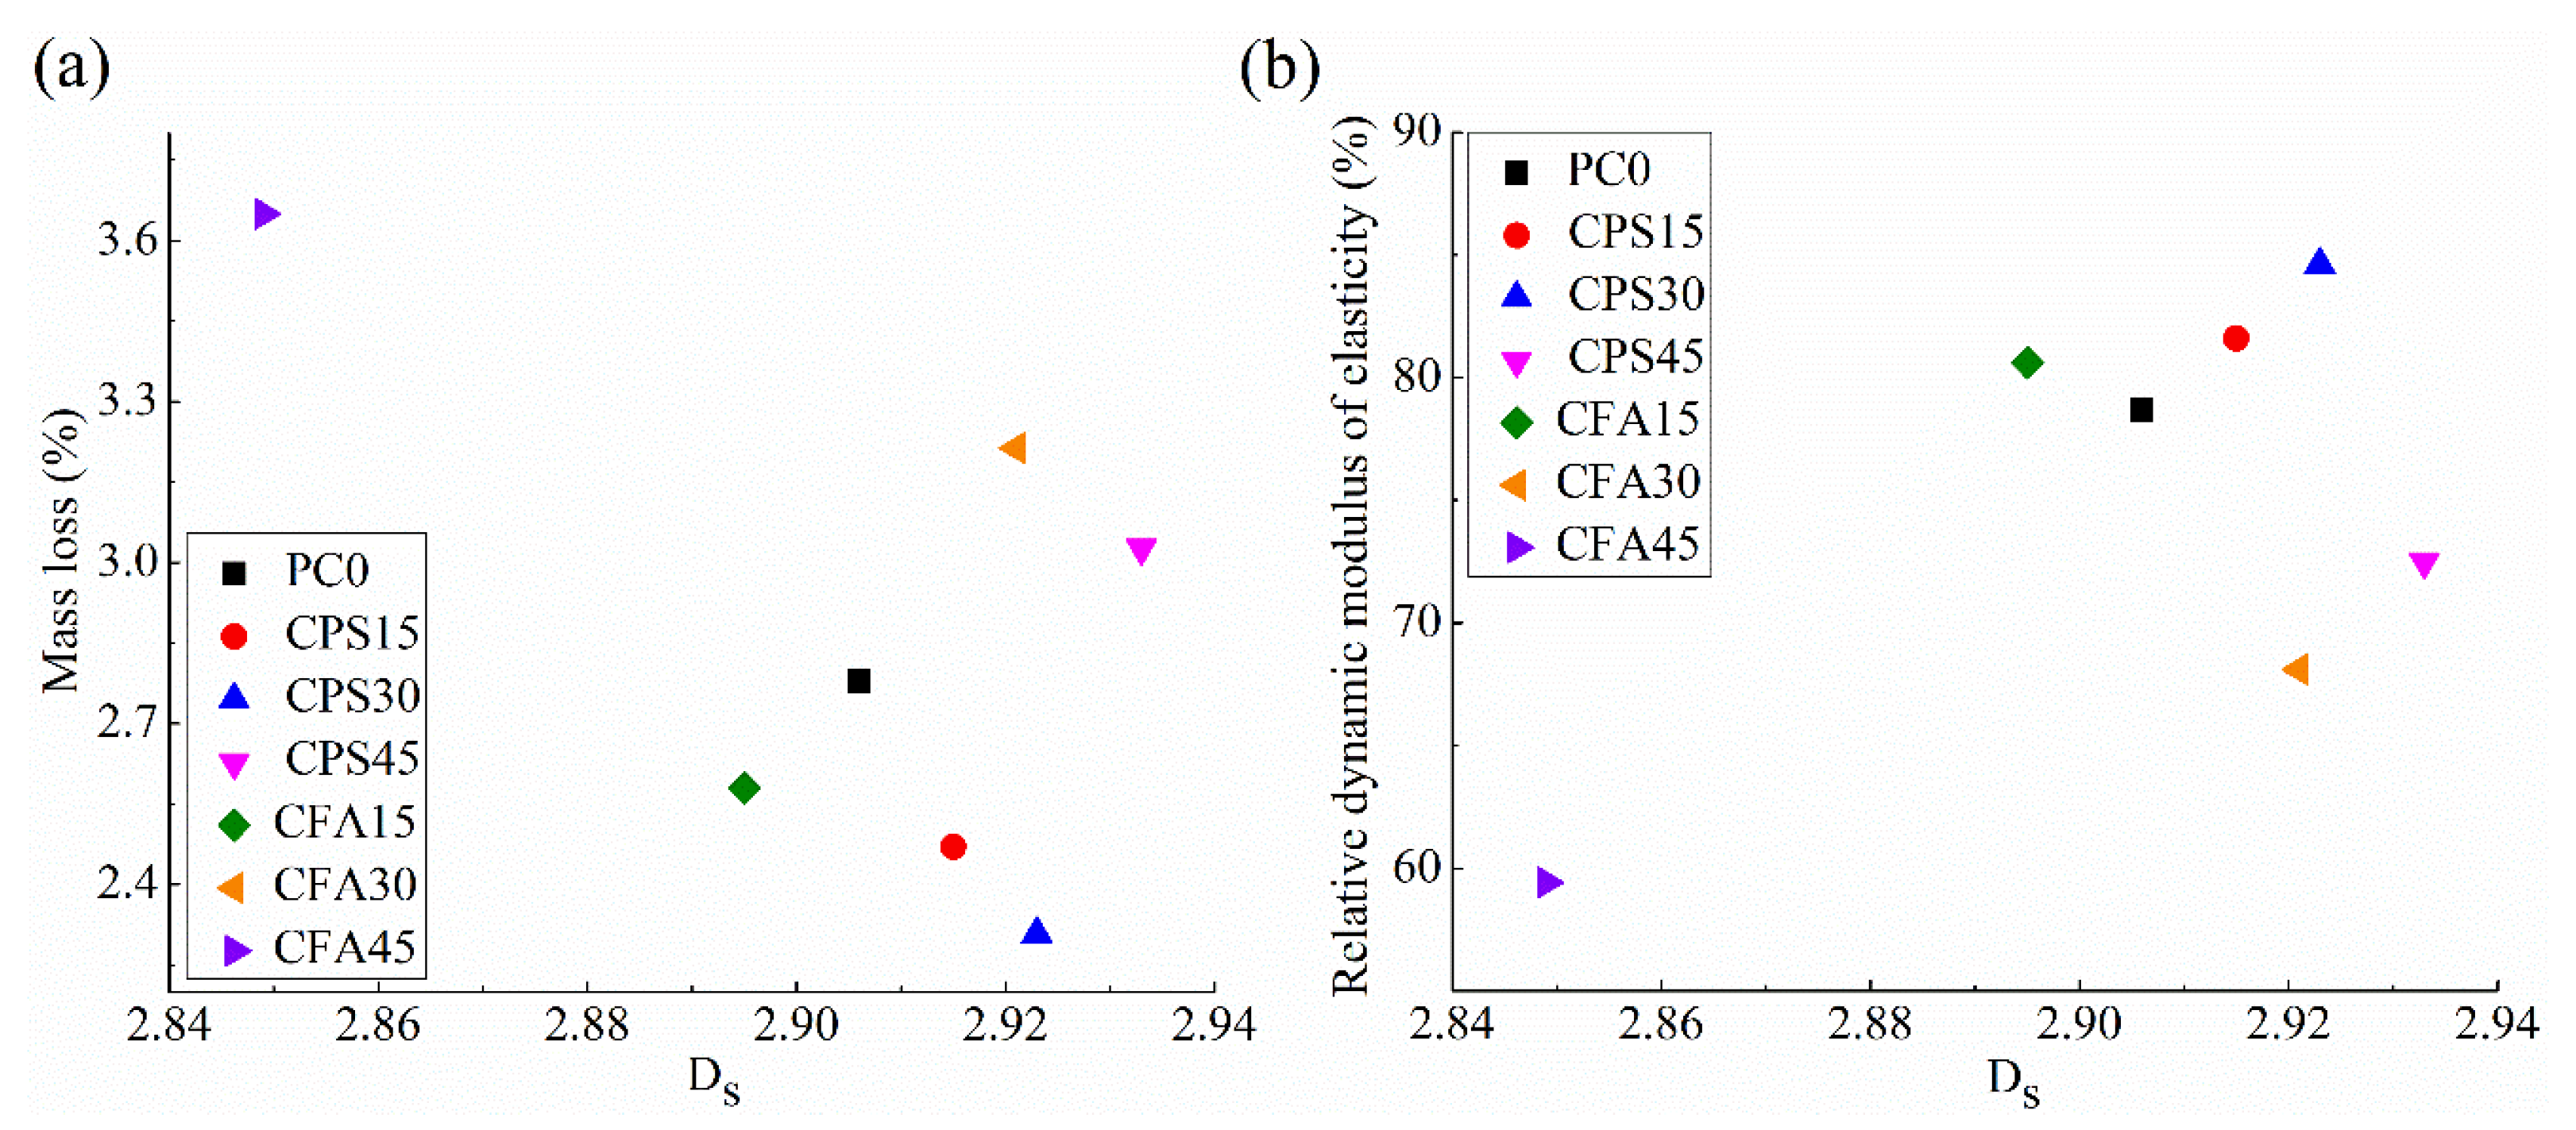
3.6. Pore Structural and Fractal Analysis of Frost Resistance

3.6.1. Pore Structural Analysis

In order to better understand the influences of FGPS and fly ash with different dosages on the frost resistance of hydraulic concretes, the frost resistance was analyzed from the viewpoints of pore structure, air void and fractal dimension, respectively.
The relationship between pore structures (the porosity and V50 nm–10 μm) and the frost resistance is displayed in Figure 6. Taking into account the fact that the pore structures of concretes at 28 days developed not so maturely since the pozzolanic reactions of FGPS and fly ash were not so sufficient, the pore structure parameters at 180 days were solely considered in the relationship analysis in this work.
Figure 6 indicates that all of the points in this figure are so scattered that there is no clear correlation between the frost resistance and pore structural parameters of hydraulic concrete. For instance, CPS45 concrete that presented the smallest porosity and V50 nm–10 μm at 180 days did not exhibit the best frost resistance. Similarly, CPS35 concrete showed the best frost resistance but its porosity and V50 nm–10 μm at 180 days were not the smallest. This is because the small capillary pores (3 nm < pore diameter < 10 μm) evaluated by the MIP technique are not so closely related with the frost resistance of concrete [31]. Many researchers demonstrated that the pores with diameters greater than 50 μm [40] or around 300 μm [19] determined the frost resistance of concrete, all of which can be classified as air voids.

3.6.2. Air void Analysis of Frost Resistance

The relationship between frost resistance (i.e., mass loss and relative dynamic modulus of elasticity) and air void structures of hydraulic concrete (i.e., N and L ¯ ) is shown in Figure 7. Figure 7 clearly shows that the frost resistance of hydraulic concrete is closely correlated with the air void parameters.
The difference in the effects between FGPS and fly ash on the frost resistance of concrete can be, therefore, explained from the point of air void parameters. Based on the relationship in Figure 7, it can be concluded that under the same dosage level, the addition of FGPS refined the air voids of hydraulic concrete more effectively than fly ash, leading to larger N and smaller L ¯ values and, thus, better frost resistance. As another study [67] reported, more closed, small and evenly distributed entrained air voids can provide more internal space for ice expansion to achieve better frost resistance in concrete. As a consequence, CPS35 concrete that exhibited the largest N and the smallest L ¯ at 180 days presented the best frost resistance. By contrast, CFA45 concrete, which has the smallest N and the largest L ¯ , exhibited the weakest frost resistance in this study.
As for the influence of FGPS dosage, Figure 7 clearly validates the optimal FGPS dosage of 35% in regard to air void refinement and frost resistance enhancement. Under this optimal dosage, the pozzolanic reaction of FGPS can divide the large air voids into small ones, inducing large N values and small L ¯ values and, consequently, better frost resistance. Beyond this optimal dosage, N began to decrease and L ¯ started to increase, which was accompanied by a great loss in frost resistance.

3.6.3. Fractal Analysis of Frost Resistance

Figure 8 displays the relationship between the frost resistance of hydraulic concrete and Ds values in this study.
It can be observed from Figure 8 that all of the points are so scattered that they do not obey any clear functional formula. Thus, it can be summarized that there are no definite and clear correlations between the frost resistance and Ds. This can be explained as follows. The addition of FGPS and fly ash strongly affected the pore structure of concrete and the corresponding Ds, while pore structure cannot affect the frost resistance as obviously and significantly as the air void structure did. Thus, Ds characterizing and reflecting the complexity and roughness of pore surfaces was poorly correlated with the frost resistance. Consequently, it can be concluded that the frost resistance cannot be analyzed from the point of Ds.

4. Conclusions

The following conclusions can be obtained:
(1)
The increase in FGPS dosage from 15% to 45% prolonged the initial setting time and the final setting time by about 3 h and 4 h 36 min compared with the plain cement concrete, respectively. The retarding effect of FGPS is stronger than fly ash.
(2)
The inclusion of 15–45% FGPS reduced the compressive strength of plain cement concrete by about 21–52%, 7–23% and 0.4–8.2% at 3, 28 and 180 days, respectively. The compressive strengths of FGPS concrete are 2.6–7.4% larger at 28 days and 3.2–15.0% larger at 180 days than those of fly ash concrete, since the pozzolanic reactivity of FGPS is much stronger than fly ash after the initial several days.
(3)
The frost resistance of hydraulic concrete at 28 days was gradually weakened with the FGPS or fly ash dosage increasing from 15% to 45%. At 180 days, the inclusion of FGPS less than 30% contributed to the enhancement in frost resistance. At the same dosage level, the FGPS concrete presented better frost resistance than fly ash concrete at 28 and 180 days.
(4)
At 3 days, both the inclusion of FGPS and fly ash coarsened the pore structures and the coarsening effect of FGPS was more prominent than fly ash. The incorporation of 15–45% FGPS began to refine the concrete pores at 28 days. At 180 days, the pore refinement effect of FGPS became notable and enhanced with the FGPS dosage. FGPS has a much stronger pore refinement effect than fly ash at 28 and 180 days. The correlation between frost resistance of hydraulic concrete and pore structure is weak.
(5)
At 28 days, the increase in FGPS dosage from 0 to 45% reduced the total number of air voids from 721 to 573 and increased the spacing factor from 239 μm to 297 μm. At 180 days, the presence of FGPS and fly ash was beneficial for refining the air void structure. The optimal dosage of FGPS and fly ash in terms of 180-day air void refinement was 30% and 15%, respectively. The frost resistance of hydraulic concrete is closely correlated with the air void parameters.
(6)
Hydraulic concretes containing FGPS and fly ash present obvious fractal features. The fractal dimension of the pore surface (Ds) could characterize and evaluate the pore structure of hydraulic concretes, but it was poorly correlated with the frost resistance. It is suggested that the frost resistance of hydraulic concrete cannot be analyzed from the point of Ds.

Author Contributions

Conceptualization, writing—original draft, writing—review and editing, investigation, formal analysis, supervision, project administration and funding acquisition, L.W.; investigation and formal analysis, Y.H., F.Z., T.H., E.C. and S.T. All authors have read and agreed to the published version of the manuscript.

Funding

This work was financially supported by the CRSRI Open Research Program (Program SN: CKWV20221021/KY).

Institutional Review Board Statement

Not applicable.

Informed Consent Statement

Not applicable.

Data Availability Statement

The data that support the findings of this study are available from the corresponding author upon reasonable request.

Acknowledgments

The authors would like to thank all the anonymous referees for their constructive comments and suggestions.

Conflicts of Interest

The authors declare no conflict of interests.

References

  1. Li, Y.; Li, Y.B.; Ji, P.F.; Yang, J. The status quo analysis and policy suggestions on promoting China’s hydropower development. Renew. Sust. Energy Rev. 2015, 51, 1071–1079. [Google Scholar] [CrossRef]
  2. Wang, Z.J.; Liu, S.H.; Vallejo, L.; Wang, L.J. Numerical analysis of the causes of face slab cracks in Gongboxia rockfill dam. Eng. Geol. 2014, 181, 224–232. [Google Scholar] [CrossRef]
  3. Qin, Z.P.; Lai, Y.M.; Tian, Y.; Yu, F. Frost-heaving mechanical model for concrete face slabs of earthen dams in cold regions. Cold Reg. Sci. Technol. 2019, 161, 91–98. [Google Scholar] [CrossRef]
  4. Zhang, P.; Kang, L.; Zheng, Y.; Zhang, T.; Zhang, B. Influence of SiO2/Na2O molar ratio on mechanical properties and durability of metakaolin-fly ash blend alkali-activated sustainable mortar incorporating manufactured sand. J. Mater. Res. Technol. 2022, 18, 3553–3563. [Google Scholar] [CrossRef]
  5. Oner, A.; Akyuz, S.; Yildiz, R. An experimental study on strength development of concrete containing fly ash and optimum usage of fly ash in concrete. Cem. Conc. Res. 2005, 35, 1165–1171. [Google Scholar] [CrossRef]
  6. Zhang, P.; Han, X.; Hu, S.; Wang, J.; Wang, T. High-temperature behavior of polyvinyl alcohol fiber-reinforced metakaolin/fly ash-based geopolymer mortar. Compos. Part B Eng. 2022, 244, 110171. [Google Scholar] [CrossRef]
  7. Hu, J. Comparison between the effects of superfine steel slag and superfine phosphorus slag on the long-term performances and durability of concrete. J. Therm. Anal. Calorim. 2017, 128, 1251–1263. [Google Scholar] [CrossRef]
  8. Yang, B.B.; Liu, J.W.; Zhao, X.M.; Zheng, S. Evaporation and cracked soda soil improved by fly ash from recycled materials. Land Degrad. Dev. 2021, 32, 2823–2832. [Google Scholar] [CrossRef]
  9. Wang, L.; Zhou, S.H.; Shi, Y.; Tang, S.W.; Chen, E. Effect of silica fume and PVA fiber on the abrasion resistance and volume stability of concrete. Compos. Part B Eng. 2017, 130, 28–37. [Google Scholar] [CrossRef]
  10. Atis, C.D. Heat evolution of high-volume fly ash concrete. Cem. Conc. Res. 2002, 32, 751–756. [Google Scholar] [CrossRef]
  11. Wang, L.; He, Z.; Cai, X.H. Characterization of pozzolanic reaction and its effect on the C-S-H gel in fly ash-cement paste. J. Wuhan Univ. Technol. 2011, 26, 320–325. [Google Scholar] [CrossRef]
  12. Altoubat, S.; Talha Junaid, M.; Leblouba, M.; Badran, D. Effectiveness of fly ash on the restrained shrinkage cracking resistance of self-compacting concrete. Cem. Conc. Compos. 2017, 79, 9–20. [Google Scholar] [CrossRef]
  13. Termkhajornkit, P.; Nawa, T.; Nakai, M.; Saito, T. Effect of fly ash on autogenous shrinkage. Cem. Conc. Res. 2005, 35, 473–482. [Google Scholar] [CrossRef]
  14. Hu, X.; Shi, C.J.; Shi, Z.G.; Tong, B.H.; Wang, D.H. Early age shrinkage and heat of hydration of cement-fly ash-slag ternary blends. Constr. Build. Mater. 2017, 153, 857–865. [Google Scholar] [CrossRef]
  15. Yang, B.B.; Li, D.D.; Yuan, S.C.; Jin, L.C. Role of biochar from corn straw in influencing crack propagation and evaporation in sodic soils. Catena 2021, 204, 105457. [Google Scholar] [CrossRef]
  16. Woo, S.K.; Song, Y.C.; Won, J.P. Enhanced durability performance of face slab concrete in concrete-faced rock-filled dam using fly ash and PVA fibre. KSEC J. Civ. Eng. 2011, 15, 875–882. [Google Scholar] [CrossRef]
  17. Yoon, Y.S.; Won, J.P.; Woo, S.K. Enhanced durability performance of fly ash concrete for concrete-faced rockfill dam application. Cem. Conc. Res. 2002, 32, 23–30. [Google Scholar] [CrossRef]
  18. Hasholt, M.T.; Christensen, K.U.; Pade, C. Frost resistance of concrete with high contents of fly ash—A study on how hollow fly ash particles distort the air void analysis. Cem. Conc. Res. 2019, 119, 102–112. [Google Scholar] [CrossRef]
  19. Shon, C.S.; Abdigaliyev, A.; Bagitova, S.; Chung, C.W.; Kim, D. Determination of air-void system and modified frost resistance number for freeze-thaw resistance evaluation of ternary blended concrete made of ordinary Portland cement/silica fume/class F fly ash. Cold Reg. Sci. Technol. 2018, 155, 127–136. [Google Scholar] [CrossRef]
  20. Shen, L.H.; Li, Q.H.; Ge, W.; Xu, S.L. The mechanical property and frost resistance of roller compacted concrete by mixing silica fume and limestone powder: Experimental study. Constr. Build. Mater. 2020, 239, 117882. [Google Scholar] [CrossRef]
  21. Peng, S.; Li, X.; Wu, Z.; Chen, J.; Lu, X. Study of the key technologies of application of tuff powder concrete at the Daigo hydropower station in Tibet. Constr. Build. Mater. 2017, 156, 1–8. [Google Scholar] [CrossRef]
  22. Yang, R.; Yu, R.; Shui, Z.H.; Gao, X. Low carbon design of an ultra-high performance concrete (UHPC) incorporating phosphorous slag. J. Clean. Prod. 2019, 240, 118157. [Google Scholar] [CrossRef]
  23. Peng, Y.Z.; Zhang, J.; Liu, J.Y.; Ke, J.; Wang, F.Z. Properties and microstructure of reactive powder concrete having a high content of phosphorous slag powder and silica fume. Constr. Build. Mater. 2015, 101, 482–487. [Google Scholar] [CrossRef]
  24. Wang, Q.; Huang, Z.X.; Wang, D.Q. Influence of high-volume electric furnace nickel slag and phosphorous slag on the properties of massive concrete. J. Therm. Anal. Calorim. 2017, 131, 873–885. [Google Scholar] [CrossRef]
  25. Li, D.X.; Shen, J.L.; Mao, L.X.; Xue, Q. The influence of admixtures on the properties of phosphorous slag cement. Cem. Conc. Res. 2000, 30, 1169–1173. [Google Scholar] [CrossRef]
  26. Chen, X.; Zeng, L.; Fang, K.H. Anti-crack performance of phosphorus slag concrete. J. Wuhan Univ. Technol. 2009, 14, 80–86. [Google Scholar] [CrossRef]
  27. Yang, J.; Huang, J.X.; He, X.Y.; Su, Y.; Oh, S.K. Shrinkage properties and microstructure of high volume ultrafine phosphorous slag blended cement mortars with superabsorbent polymer. J. Build. Eng. 2020, 52, 101121. [Google Scholar] [CrossRef]
  28. Jiang, D.B.; Li, X.G.; Lv, Y.; Zhou, M.K.; Li, C.J. Utilization of limestone powder and fly ash in blended cement: Rheology, strength and hydration characteristics. Constr. Build. Mater. 2020, 232, 117228. [Google Scholar] [CrossRef]
  29. Allahverdi, A.; Abadi, M.M.B.R.; Anwar Hossain, K.M.; Lachemi, M. Resistance of chemically-activated high phosphorous slag content cement against freeze–thaw cycles. Cold Reg. Sci. Technol. 2014, 103, 107–114. [Google Scholar] [CrossRef]
  30. Mindess, S.; Young, J.F.; Darwin, D. Concrete; Prentice-Hall: Murray Hill, NJ, USA, 2003. [Google Scholar]
  31. Şahmaran, M.; Özbay, E.; Yücel, H.E.; Lachemi, M.; Li, V.C. Frost resistance and microstructure of engineered cementitious composites: Influence of fly ash and micro polyvinyl alcohol fiber. Cem. Conc. Compos. 2012, 34, 156–165. [Google Scholar] [CrossRef]
  32. Zhang, P.; Liu, G.G.; Pang, C.M. Influence of pore structures on the frost resistance of concrete. Mag. Concr. Res. 2017, 69, 271–279. [Google Scholar] [CrossRef]
  33. Zeng, Q.; Luo, M.Y.; Pang, X.Y.; Li, L.; Li, K.F. Surface fractal dimension: An indicator to characterize the microstructure of cement-based porous materials. Appl. Surf. Sci. 2013, 282, 302–307. [Google Scholar] [CrossRef]
  34. Jin, S.S.; Zhang, J.X.; Han, S. Fractal analysis of relation between strength and pore structure of hardened mortar. Constr. Build. Mater. 2017, 135, 1–7. [Google Scholar] [CrossRef]
  35. GB 175-2007; Common Portland Cement, China. China Standard Press: Beijing, China, 2007.
  36. DL/T 5330-2015; Code for Mix Design of Hydraulic Concrete, China. China Electric Power Press: Beijing, China, 2015.
  37. DL/T 5150-2017; Test Code for Hydraulic Concrete, China. China Electric Power Press: Beijing, China, 2017.
  38. ASTM C403/C403M-1999; Standard Test Method for Time of Setting of Concrete Mixtures by Penetration Resistance. ASTM International: West Conshohocken, PA, USA, 2019.
  39. ASTM C666/666M-15; Standard test method for resistance of concrete to rapid freezing and thawing. ASTM International: West Conshohocken, PA, USA, 2015.
  40. Neville, A.M. Properties of Concrete, 4th ed.; Longman: London, UK, 2000. [Google Scholar]
  41. Jin, S.S.; Zhang, J.X.; Huang, B.S. Fractal analysis of effect of air void on freeze–thaw resistance of concrete. Constr. Build. Mater. 2013, 47, 126–130. [Google Scholar] [CrossRef]
  42. ASTM C457/457M-16; Standard Test Method for Microscopical Determination of Parameters of the Air-Void System in Hardened Concrete. ASTM International: West Conshohocken, PA, USA, 2016.
  43. Yuan, B.; Li, Z.; Chen, W.; Zhao, J.; Lv, J.; Song, J.; Cao, X. Influence of groundwater depth on pile–soil mechanical properties and fractal characteristics under cyclic loading. Fractal Fract. 2022, 6, 198. [Google Scholar] [CrossRef]
  44. Yang, B.; Liu, Y. Application of fractals to evaluate fractures of rock due to mining. Fractal Fract. 2022, 6, 96. [Google Scholar] [CrossRef]
  45. Xiao, J.; Qu, W.J.; Jiang, H.B.; Li, L.; Huang, J.; Chen, L. Fractal characterization and mechanical behavior of pile-soil interface subjected to sulfuric acid. Fractals 2021, 29, 2140010. [Google Scholar] [CrossRef]
  46. Zhang, B.Q.; Li, S.F. Determination of the surface fractal dimension for porous media by mercury porosimetry. Ind. Eng. Chem. Res. 1995, 34, 1383–1386. [Google Scholar] [CrossRef]
  47. Zhang, B.Q.; Liu, W.; Liu, X. Scale-dependent nature of the surface fractal dimension for bi- and multi-disperse porous solids by mercury porosimetry. Appl. Surf. Sci. 2006, 253, 1349–1355. [Google Scholar] [CrossRef]
  48. Zhang, Z.Q.; Wang, Q.; Yang, J. Hydration mechanisms of composite binders containing phosphorus slag at different temperatures. Constr. Build. Mater. 2017, 147, 720–732. [Google Scholar] [CrossRef]
  49. Zhang, X.; Zhang, P.; Wang, T.; Zheng, Y.; Qiu, L.; Sun, S. Compressive strength and anti-chloride ion penetration assessment of geopolymer mortar merging PVA fiber and nano-SiO2 using RBF–BP composite neural network. Nanotechnol. Rev. 2022, 11, 1181–1192. [Google Scholar] [CrossRef]
  50. Wang, X.; Wu, D.; Zhang, J.; Yu, R.; Hou, D.; Shui, Z. Design of sustainable ultra-high performance concrete: A review. Constr. Build. Mater. 2021, 307, 124643. [Google Scholar] [CrossRef]
  51. Zhang, P.; Gao, Z.; Wang, J.; Guo, J.; Wang, T. Influencing factors analysis and optimized prediction model for rheology and flowability of nano-SiO2 and PVA fiber reinforced alkali-activated composites. J. Clean. Prod. 2022, 366, 132988. [Google Scholar] [CrossRef]
  52. Yuan, B.; Chen, W.; Zhao, J.; Yang, F.; Luo, Q.; Chen, T. The effect of organic and inorganic modifiers on the physical properties of granite residual soil. Adv. Mater. Sci. Eng. 2022, 2022, 9542258. [Google Scholar] [CrossRef]
  53. Yuan, B.; Chen, M.; Chen, W.; Luo, Q.; Li, H. Effect of pile-soil relative stiffness on deformation characteristics of the Laterally loaded pile. Adv. Mater. Sci. Eng. 2022, 2022, 4913887. [Google Scholar] [CrossRef]
  54. Yuan, B.; Li, Z.; Chen, Y.; Hong, N.; Zhao, Z.; Chen, W.; Zhao, J. Mechanical and microstructural properties of recycling granite residual soil reinforced with glass fiber and liquid-modified polyvinyl alcohol polymer. Chemosphere 2021, 268, 131652. [Google Scholar] [CrossRef]
  55. Wang, J.; Guo, Z.; Zhang, P.; Yuan, Q.; Guan, Q. Fracture properties of rubberized concrete under different temperature and humidity conditions based on digital image correlation technique. J. Clean. Prod. 2020, 276, 124106. [Google Scholar] [CrossRef]
  56. Wang, J.; Guo, Z.; Yuan, Q.; Zhang, P.; Fang, H. Effects of ages on the ITZ microstructure of crumb rubber concrete. Constr. Build. Mater. 2020, 254, 119329. [Google Scholar] [CrossRef]
  57. Hu, X.; Shi, Z.G.; Shi, C.J.; Wu, Z.M.; Tong, B.H.; Ou, Z.H.; de Schutter, G. Drying shrinkage and cracking resistance of concrete made with ternary cementitious components. Constr. Build. Mater. 2017, 149, 406–415. [Google Scholar] [CrossRef]
  58. de Matos, P.R.; Foiato, M.; Prudêncio, L.R. Ecological, fresh state and long-term mechanical properties of high-volume fly ash high-performance self-compacting concrete. Constr. Build. Mater. 2019, 203, 282–293. [Google Scholar] [CrossRef]
  59. Termkhajornkit, P.; Nawa, T.; Kurumisawa, K. Effect of water curing conditions on the hydration degree and compressive strengths of fly ash–cement paste. Cem. Conc. Compos. 2006, 28, 781–789. [Google Scholar] [CrossRef]
  60. Poon, C.S.; Lam, L.; Wong, Y.L. A study on high strength concrete prepared with large volumes of low calcium fly ash. Cem. Concr. Res. 2000, 30, 447–455. [Google Scholar] [CrossRef]
  61. Wang, L.; Yang, H.Q.; Zhou, S.H.; Chen, E.; Tang, S.W. Mechanical properties, long-term hydration heat, shinkage behavior and crack resistance of dam concrete designed with low heat Portland (LHP) cement and fly ash. Constr. Build. Mater. 2018, 187, 1073–1091. [Google Scholar] [CrossRef]
  62. Yin, B.; Kang, T.; Kang, J.; Chen, Y.; Wu, L.; Du, M. Investigation of the hydration kinetics and microstructure formation mechanism of fresh fly ash cemented filling materials based on hydration heat and volume resistivity characteristics. Appl. Clay Sci. 2018, 166, 146–158. [Google Scholar] [CrossRef]
  63. Arribas, I.; Vegas, I.; García, V.; Vigil de la Villa, R.; Martínez-Ramírez, S.; Frías, M. The deterioration and environmental impact of binary cements containing thermally activated coal mining waste due to calcium leaching. J. Clean. Prod. 2018, 183, 887–897. [Google Scholar] [CrossRef]
  64. Gao, P.W.; Lu, X.L.; Yang, C.X.; Li, X.Y.; Shi, N.N.; Jin, S.C. Microstructure and pore structure of concrete mixed with superfine phosphorous slag and superplasticizer. Constr. Build. Mater. 2008, 22, 837–840. [Google Scholar] [CrossRef]
  65. Xie, H.; Ni, G.; Li, S. The influence of surfactant on pore fractal characteristics of composite acidized coal. Fuel 2019, 253, 741–753. [Google Scholar] [CrossRef]
  66. Zeng, Q.; Li, K.F.; Teddy, F.C.; Patrick, D.L. Surface fractal analysis of pore structure of high-volume fly-ash cement pastes. Appl. Surf. Sci. 2010, 257, 762–768. [Google Scholar] [CrossRef]
  67. Chen, Y.; Cen, G.P.; Cui, Y.H. Comparative study on the effect of synthetic fiber on the preparation and durability of airport pavement concrete. Constr. Build. Mater. 2018, 184, 34–44. [Google Scholar] [CrossRef]
Figure 1. SEM micrographs of (a) cement, (b) FGPS and (c) fly ash.
Fractalfract 06 00598 g001
Figure 2. Compressive strengths of hydraulic concretes at 3, 28 and 180 days. (a) concretes containing FGPS; (b) concretes containing fly ash.
Fractalfract 06 00598 g002
Figure 3. Frost resistance results of concretes hydrated at 28 days; (a,b) mass loss of FGPS concrete and fly ash concrete, (c,d) relative dynamic elastic modulus of FGPS concrete and fly ash concrete.
Fractalfract 06 00598 g003
Figure 4. Frost resistance results of concrete hydrated at 180 days; (a,b) mass loss of FGPS concrete and fly ash concrete, (c,d) relative dynamic elastic modulus of FGPS concrete and fly ash concrete.
Fractalfract 06 00598 g004
Figure 5. The correlation between Ds and (a) the critical pore diameter, (b) porosity and (c) V50 nm–10 μm of concrete.
Fractalfract 06 00598 g005
Figure 6. The correlations between frost resistance and pore structure (a) mass loss and porosity, (b) mass loss and V50 nm–10 μm, (c) relative dynamic elastic modulus and porosity and (d) relative dynamic elastic modulus and V50 nm–10 μm.
Fractalfract 06 00598 g006
Figure 7. The correlation between frost resistance and air void structure: (a) mass loss and N, (b) mass loss and L ¯ , (c) relative dynamic elastic modulus and N and (d) relative dynamic elastic modulus and L ¯ .
Fractalfract 06 00598 g007
Figure 8. The correlation between frost resistance and Ds (a) mass loss and Ds and (b) relative dynamic elastic modulus and Ds.
Fractalfract 06 00598 g008
Table 1. Physical characteristics and oxide compositions of cement and fly ash.
OxidesOxides (% by Weight)
CEM I PCFly AshFGPS
CaO62.723.0248.21
SiO220.3253.6939.15
Fe2O34.4610.870.85
Al2O34.4224.961.96
MgO3.922.851.89
SO32.370.351.46
P2O5003.31
R2O *0.411.071.32
Ignition loss (%)1.042.321.58
Physical features
Density (g/cm3)3.222.332.93
Blaine Specific surface area (m2/kg)332395505
Median particle size (D50, μm)18.413.210.1
Fineness (residue on 80 µm sieve%)1.20.40.4
Strength activity index-8192
* Alkali content (R2O) = Na2O + 0.658K2O.
Table 2. Mix proportion and notation of hydraulic concrete.
NotationW/B RatioMix Proportion (kg/m3)Air Content (%)Slump
(mm)
WaterCementFly AshFGPSSandCoarse
Aggregate
Water-ReducerAEA
PC00.391233150062113242.210.065.055
CPS150.3912326804761913211.890.064.956
CPS300.3912322109561813182.210.064.955
CPS450.39123173014261713162.210.064.851
CFA150.3912326847061613132.210.095.056
CFA300.3912322195061113031.890.114.958
CFA450.39123173142060612931.890.134.859
Table 3. Setting time of hydraulic concretes added with FGPS and fly ash.
NotationW/B RatioSetting Time (h:min)
InitialFinal
C00.3810:2014:50
CPS150.3811:5016:10
CPS300.3813:1018:30
CPS450.3814:5020:46
CFA150.3810:5516:20
CFA300.3811:2016:55
CFA450.3811:4817:25
Table 4. Pore structures of hydraulic concretes added with FGPS and fly ash.
NotationCuring Time (Days)Critical Pore Diameter (nm)Porosity (%)Pore Size Distribution
<10 nm (%)10–50 nm (%)50 nm–10 μm (%)
C0316927.68.131.260.3
286520.514.546.937.8
1804218.418.550.230.9
CPS15321831.26.828.664.3
286119.515.548.335.6
1803616.821.652.325.6
CPS30326236.15.324.569.6
288422.613.244.142.2
1802915.223.854.721.1
CPS45332042.53.514.581.7
2811528.411.540.247.6
1802213.825.456.517.5
CFA15318530.37.327.165.4
287422.813.343.542.8
1803818.720.551.127.9
CFA30320633.15.824.269.3
289125.912.540.346.6
1803316.622.253.124.3
CFA45323637.34.518.676.3
2812829.69.632.557.8
1806325.316.442.640.9
Table 5. Air void structures of hydraulic concretes added with FGPS and fly ash.
NotationCuring Time (Days)Total Number of Air Voids NTraverse Length through Air Ta (mm)Hardened Air Content A (%)Average Chord Length (μm)Average Air Void Diameter D (μm)Spacing Factor L ¯ (μm)
PC0287211585.0218164239
1807481585.0211158230
CPS15286721544.9230172254
1807961544.9194145215
CPS30286261544.9247185274
1808511544.9181136202
CPS45285731514.8264198297
1806541514.8231173260
CFA15286291585.0250188277
1807971585.0198148219
CFA30285651544.9273205309
1806141544.9251189284
CFA45285451514.8277208320
1805681514.8266200307
Table 6. Ds of hydraulic concretes added with FGPS and fly ash.
NotationCuring Time (Days)DsR2
C032.8320.989
282.8790.969
1802.9060.978
CPS1532.8050.986
282.8860.979
1802.9150.986
CPS3032.7720.978
282.8550.984
1802.9230.969
CPS4532.7320.986
282.8310.992
1802.9320.978
CFA1532.8200.963
282.8670.983
1802.8950.971
CFA3032.7910.968
282.8430.976
1802.9210.985
CFA4532.7530.966
282.8180.959
1802.8490.979
Publisher’s Note: MDPI stays neutral with regard to jurisdictional claims in published maps and institutional affiliations.

