1. Introduction
New technologies and their multidimensional applications using the Internet and cloud servers are growing steadily [
1]. Social networks, mail services, video streaming, and games, all kinds of applications that use data centers, have one common factor: the need for electric power. In fact, the constant growth of these applications means that a larger number of data centers is required. As a consequence, more energy is used to operate these data centers, demanding new techniques to reduce their electric consumption.
The application of artificial intelligence (AI) to server management can lead to increased energy efficiency. By analyzing the intrinsic information patterns in service usage data, it is possible to anticipate both the behavior of individual users and the general stress of the servers, allowing for optimization of the charge over them. These improved efficiencies are achieved thanks to AI techniques but require a set of training data for the implementation of these tools. This represents the condition for the application of machine learning (ML) techniques to a previously organized dataset.
There are many open repositories to find suitable datasets for different areas and tasks [
2]. The increase in demand for services and application development drives growth for a larger community and expands the dataset market [
3]. Sometimes, even the data are provided openly in order to support new initiatives for developers to create services for specific tasks. It is not always intended for commercial purposes, but to create competition to drive research even further. This is beneficial for a whole stack of sectors: students starting to learn about AI, developers expanding their knowledge and driving research, and private organizations that would benefit from the creativity of the created solutions.
However, energy datasets are not open and freely shared [
4] with the community. Security issues are the main concern, as any uncontrolled access to data centers represents a risk for companies because they store private data of great value. Furthermore, energy consumption patterns can provide information about the services and applications that are held in a data center. This leads to the unavailability of energy datasets, which prevents the development of ML algorithms for energy efficiency optimization.
Additionally, the requirement for data acquisition, from a technical point of view, involves the coordination about a set of technologies and qualified staff, i.e., physical layer availability (infrastructure, hardware, sensors, etc.); software layer development, including process monitoring and flexible and adaptable configuration (software developer); interconnection between operating systems and data management services (DevOps); and data processing and analysis (data scientists).
Most of the procedures proposed to date are focused on a specific applications; however, the generation pf energy consumption data could represent a scalable solution. The method presented in this work is useful in more general cases because it allows for the extraction of energy consumption data from one device or from a complete set of devices used in a data center.
The goal of this research is to offer a public method for the creation of datasets focused on server processing stimuli, electrical consumption, and data collection. An open repository offers the opportunity to reproduce and customize this approach for the community in other environments, which is made possible by taking advantage of the open-source tools used by this technique. The following sections explain how to implement and create an energy-specific dataset.
According to the proposed goal, the idea is to create an energy consumption dataset as a starting point for research on applications oriented to optimize energy requirements in data centers and server farms. The combination of several machines enables the generation of data for different purposes, which can be analyzed and used as aggregated data or fractioned by type of application.
Therefore, this article presents a complete method that integrates different components for the creation of a dataset. This approach enables monitoring of energy consumption in real time. The contributions of this work are summarized as follows:
A brief description of the software and hardware architectures for energy measurements;
System stimuli through benchmarks used as charge tests;
Extraction and processing of the obtained data;
Analysis and results on the dataset itself;
Analysis of possible future applications through energy efficiency optimization services, leveraging concepts like network function virtualization (NFV), software-defined networking (SDN), and dynamic resource allocation.
This paper is organized as follows, starting with the related work in
Section 2.
Section 3 shows the methodology adopted to choose a measurement architecture (software/hardware); apply a stimulus to the servers; plan some charge tests to obtain and store the energy consumption data; and, finally, process all the acquired information to generate the dataset. In
Section 4, the obtained results are described and presented graphically to improve comprehension.
Section 5 and
Section 6 discuss and analyze the obtained results and presents some proposals for future work, providing final conclusions of the work.
2. Related Work
This section of the article reviews other work related to our proposed data collection methodology and dataset creation. The need for good datasets to obtain accurate analysis and AI applications has been proven to be of high importance. This means that several works have been conducted with respect to this task.
In [
5], a complete review of real and synthetic non-intrusive load monitoring (NILM) of energy datasets was introduced. The authors described the strengths and weaknesses of both approaches and depicted a complete dataset list. The dataset scenarios were mainly residential and home appliances, while only a few datasets included office appliances. Furthermore, to improve the results, the authors encouraged the running of a real-world measurement campaign.
A tool capable of generating extended semisynthetic data in real time was developed and presented in [
6]. The authors focused on household appliances to characterize their consumption behavior, generating synthetic data on major appliances, such as electrical space heaters (ESHs) and electrical water heaters (EWHs). A statistical analysis of real-world data was used to create probabilistic models, taking into account the energy needs of the main appliances of a smart home. Furthermore, a simulation structure was developed to characterize the power consumption profiles and generate semisynthetic data.
In [
7], a study was presented with a focus on the strengths and weaknesses of existing solar radiation datasets. The authors highlighted the importance of these data from a financial point of view in studying the performance of a solar project and in understanding the percentage of projects that can be financed, considering the uncertainty of solar resources. The development of a bankable dataset was proposed to understand the importance of resource variability and the nature of uncertainties in the various constituents of the data. Various datasets were also analyzed, introducing a methodology to validate them either through the use of concurrent ground-measured data or correlation with a longer-term ground-based dataset.
A very complete work was presented in [
8], where the authors reviewed recent issues in dataset development, focusing on computer vision and natural language processing. In fact, datasets have been mythologized but could be impacted by errors and limitations. Errors such as incorrect content, haphazard collection, incorrect annotation, etc., may arise from data collection and annotation. Another problem is related to dataset maintenance is the difficulty of researchers in controlling dataset repositories if they are not closely supervised by an institution. Other one is the potential aspect about legal restrictions, as all images may not be protected by license or copyright. Although the author found critiques of insufficiently careful data annotation and documentation practice, which reduce the reliability of scientific inquiries of datasets, they hoped that their optimization and improvement would distribute data in a better way, supporting accuracy and respecting intellectual properties and privacy.
An overview of research on sustainable data modeling was presented in [
9]. The authors discussed model energy efficiency, computational requirements in learning, and new algorithm approaches that use fewer resources in terms of memory requirements and computational processing. In addition, some interesting classifications were analyzed. A type of data classification (environmental, health biomedical field, universe, and space) was introduced by analyzing the amount of memory used to store the dataset. Further classification analysis of the modeling methodologies was reported. The main focus was on data modeling issues, including the relation between data models and characteristics. Some recommendations were provided, with the goal of increasing the accuracy of learning, reducing computational costs, and improving the large amount of data processing in a rapid and efficient way.
A complete pilot to generate data sets was described in [
10]. Pereira et al. developed a system based on economic hardware to perform NILM over a typical building to generate a dataset. In addition, a software implementation was developed to read the measures by event from the sensors and save the data in the dataset. Furthermore, the authors evaluated the performance of the system using precision, recall, and F1 indicators that form the contingency matrix.
A ML approach was presented to detect home absence based on the electrical usage of appliances in [
11]. The authors modified the UK-DALE dataset, including artificial outing events, generating a NILM dataset. Many ML algorithms were tested, and the obtained results prove that it is possible to use the power consumption of appliances to detect absence from the home.
In the same way, the authors of [
12] presented the Reference Energy Disaggregation Data Set (REDD) to monitor the power consumption of several homes. The main objective of this dataset is the energy disaggregation of devices in different homes. To accomplish this task, a specific circuit device was implemented to monitor the energy consumption of the houses. The basic algorithms and data are available on a website.
In [
13], a generic system identification tool was developed. The authors used a data-based modeling approach to optimize electrical power and resource consumption for a given load. The developed identification method focuses on a machine-independent approach to various types of machines and systems. Automated feature engineering and network configuration introduce the advantage of reduced effort and time to model a real system compared to physical modeling. The tool is capable of mapping the behavior of a system based on the measured input and output data of the system. Highly accurate data-based models were created for the energy and resource consumption of a machine or a system.
In [
14], the authors investigated a model to optimize energy efficiency in multithread architectures. Some benchmarks were performed to generate datasets and analyze multithread behavior. This allowed the authors to develop a technique that automatically determines the best configuration for any application, with the goal of optimizing efficiency and energy consumption using ML algorithms. The proposed approach uses hardware performance information during the multithread runtime of applications and predicts and proposes the best energy-efficient configuration, setting the number of threads and the operating frequency.
Power measurement was introduced in [
15]. The authors used the Chauffeur framework to create stimuli. This Java multiplatform benchmark is used to create a load on the server system while a power analyzer is examining the power consumption. The core of this work is represented by PTDaemon, a special program that is loaded in the system and is able to launch the Chauffeur framework and communicate with the power analyzer to examine the server power need as a function of the provided stimuli.
The application of datasets for the analysis of data-driven power systems is explained in [
16], where an algorithm based on the separation of hyperplanes was used. According to the authors, this method allows for management of high input dimensionality with an itemized description of the security boundary. The dataset was used to perform optimal power flows of power systems with more than 125 control variables.
There are some works where a review of datasets, tools, models, and metrics were introduced. First, a work [
17] provides a detailed overview of the open-source dataset model and tools that can be used in real-world energy communities oriented toward local energy communities (LECs). In other hand [
18], this work is focused on NILM, which suggests not only datasets and benchmarking frameworks but also performance metrics for a complete evaluation of energy consumption estimation for NILM systems.
A novel regression-based modeling method was proposed in [
19] to characterize the I-V characteristic curves of PV modules under different ambient conditions. The model uses a single hidden-layer feedforward neural network trained by a machine learning algorithm based on large datasets of I-V curves measured under operating conditions. The input of the model is meteorological data and the voltage, while the output is the current. The overall experimental results on six large datasets where the model was tested and optimized were reported.
In [
20], the authors provide a complete overview of the landscape, current approaches, core applications, and challenges associated with dataset creation, in addition to providing recommendations. The authors also analyzed ML applications, techniques, and datasets and provided a list of known low-voltage-level open datasets, addressing and encouraging the reader to follow further research and development.
A method of forecasting power consumption using high-dimensional datasets was presented in [
21]. The work shows that the ML models outperformed the benchmark models when regularized coefficients were adopted using high-dimensional datasets. In fact, the results obtained in this work show more accurate forecasts for all horizons.
The authors proposed a virtual sensing environment for smart building energy systems in [
22]. The virtual sensing method includes an autoencoder, a model that introduces a correspondence with the real environment. The virtual applications supported by this method close to a real sensing system are diverse, such as monitoring, control, automation, fault detection and diagnosis, in situ sensor calibration, and prognostics. Furthermore, this method can be applied to prepare reliable and informative datasets, for example, reconstructing missing values in operational datasets based on the autoencoder reconstruction capability. Another important feature is represented by the calibration of the dataset from based on data from physical and virtual sensors, using the output layer of system-level virtual sensing. Finally, this method can provide extended diagnostic information for fault detection and diagnosis of building energy systems, using the differences between the input and output layers of the virtual sensing structure for residual-based fault detection.
A work focusing on imputation methods was presented in [
23]. The authors evaluated the performance of five methods and imputation methods (two statistical and three ML) for the processing of electric power data over a two-year period. The experiment showed that the imputation methods generate higher error rates during the summer season compared to other periods. Furthermore, the test evidenced that ML methods represent a better choice for imputation of missing data during peak times, while statistical methods are more efficient during off-peak and semipeak times.
Other applications in which a dataset may be needed were presented in [
24]. This study evaluated the potential of transfer learning in response to the problem of real-time electricity price forecasting. A set of hybrid datasets of the New York Independent System Operator real-time electricity prices was developed to train the models. The authors carried out all three aspects of modeling, helping to improve accuracy and introducing the use of hybrid datasets to add meaningful variance and reduce and prevent overfitting of the networks.
Open-StreetMap datasets were used in [
25] to model and simulate energy systems of city district buildings. Using this GIS-based approach and the Python tool TEASER, an automated urban energy system model was generated. Building models include geometries, physical properties, and space-heating demand. The main objective of this method is the simplification of building data extraction and the rapid generation of city district models to perform simulations of space-heating loads on an urban scale.
Karantoumanis and Ploskas presented a study [
26] on the estimation of power consumption in data centers utilizing machine learning techniques. The authors explored the use of machine learning models to predict power consumption based on various factors and parameters. They discussed the process of collecting data and feature selection, as well as the application of eight regression methods to estimate power consumption. This research provides valuable information on the use of machine learning for energy efficiency and optimization in data centers, comparing various adopted methods to obtain accurate predictions using the smallest number of parameters.
In [
27], Uchechukwu et al. investigated energy consumption needs in cloud data centers. The authors provided formulas for calculating the total energy consumption of cloud environments, validating the models in six scenarios shown as examples. This research had the goal of designing energy-efficient infrastructure for data centers and server farms.
Another work focusing on a neural model for estimating the power consumption of virtual machines was presented in [
28]. The authors proposed a deep neural network model to estimate power consumption of virtual machines, considering the impact of CPU, memory, disk, and network resource utilization. They evaluated the performance of their model, called Lapem, using real-world data collected from typical cloud services and comparing the model with other power estimation approaches. Lapem achieves accurate predictions of the power consumption of virtual machines. It also provides insights into energy-efficient resource allocation and management in data centers.
Previous work shows the utility of using datasets to improve energy system efficiency. However, in most cases, the methodology used to create the datasets is not fully explained. This fact could reduce the reproducibility of the procedures described above. The main goal of this work is to present a method for the creation of an energy consumption dataset that is easy to reproduce and implement. Moreover, scripts and code are available online [
29,
30,
31] for download and testing. By launching the code mentioned above, it is possible to collect data for the creation of a new dataset, with the improvement of energy variations directly from the computing resources, enabling the analysis of the deployment of services. It is especially useful for virtualized environments, where everything is based on software instantiation and resource allocation.
3. Data Acquisition, Annotation, and Organization
3.1. Measurement System
To collect data on energy consumption, a system capable of monitoring the power demand of the equipment is needed. Many solutions are available to track and sense computer hardware. The software solution proposed in [
32] allows energy consumption data from motherboard sensors to be read. This system has the advantage that the data are ready to be recorded and written in the dataset just by calling the API or interconnecting with the sensor driver. On the other hand, even if computer motherboards have sensors, not every system has drivers to collect data from the software layer. Furthermore, the power consumption information could be peripherally specific and not applicable to the global system. In order to ensure an exact measure, a system similar to that proposed in [
33] with a hardware implementation could be recommended. This consists of a physical sensor introduced in the power line that measures the total power needs of the server.
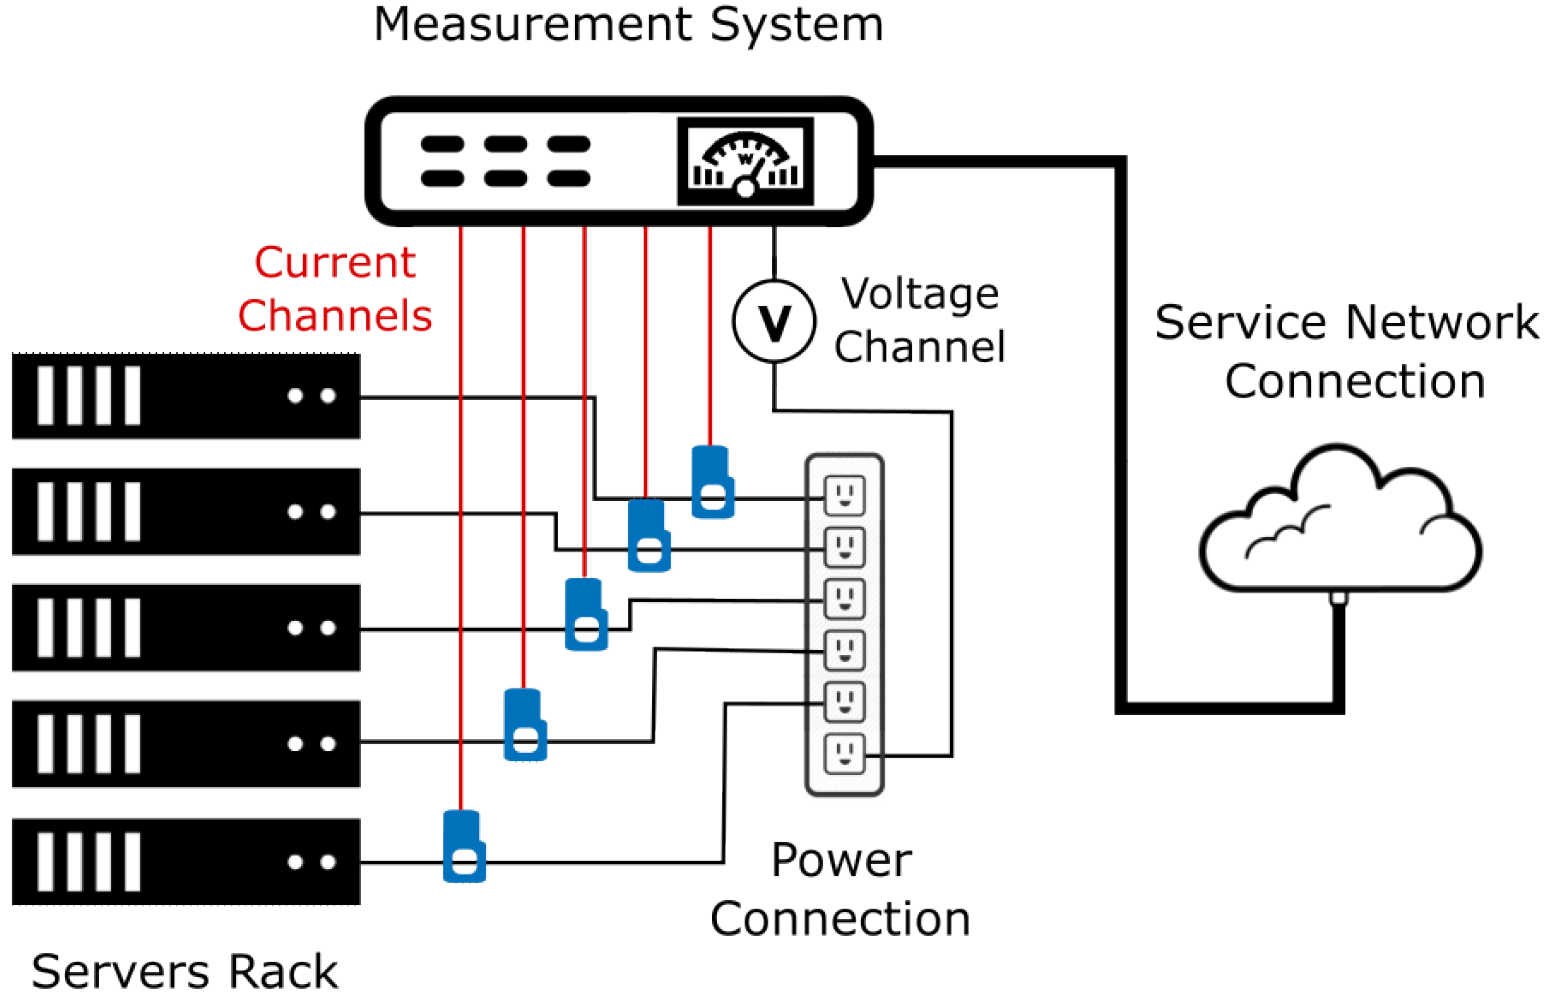
Figure 1 shows a simple schematic in which a sensor is connected to the line that detects power consumption across the line. The physical probe represents a flexible solution on the Internet of Things (IoT) for the servers to be measured, enabling more accurate measures, even if it needs a connection to a device that can interpret the power consumption data, transmit them to a server to record the data, and save them in the dataset. Both solutions are valid to create a power consumption dataset; the software version is easy to develop, while the hardware version requires more effort in terms of time and economic resources to implement it. Depending on the accuracy needed, the two solutions allow for the creation of a dataset and permit eventual ML algorithm training, providing a power consumption estimate.
To create a coherent dataset, some electrical measurements are necessary, the most important of which are voltage, current, active power, and power factor. These metrics represent the energy information that is needed as a training requirement for the generation of optimization algorithms. It is important to provide this information to achieve a system that can monitor energy consumption and act according to the situation.
In this work, a proprietary IoT hardware solution was used to acquire the measurement data. In fact, a custom multichannel measurement system was developed and is presented in [
34]. The device is connected through a power cable that feeds the server. Internally, a set of current transformer sensors acquire the servers’ power consumption, and a measurement chip is responsible for interpreting the analog waveform from the sensors mentioned above. Once these instant factors are obtained, the measurement system sends them to the next stage over a network connection, where they are saved in the dataset. A brief scheme that summarizes the hardware measurement system is shown in
Figure 2.
3.2. Stress Tests
The measurement system described in the previous section has the ability to detect energy variations because it has been previously calibrated. Therefore, these measurement probes can be connected to the equipment, allowing for measurement of its energy consumption while running. However, it is necessary to create the dataset considering the need to save energy consumption information of different applications running on the servers. The proposal is to apply various stress tests to the servers in order to identify different state conditions.
Phoronix [
35] is a software suite that provides a set of tests and benchmarks to evaluate the performance of servers, imposing stress on the machine at the desired level. The results of the tests are also entered into a ranking that permits a comparison of the different hardware architectures in terms of performance (CPU, disks, video cards, RAM, etc.). The Phoronix suite is easy to use; in fact, its architecture allows for management and installation of the stress tests. There are over 400 tests available—from CPU and memory to graphics—all based on simple command-line tools. In this specific case, since the servers do not have graphics cards with GPUs, tests have been chosen to increase the use of the CPU and memory.
Additionally, this software allows for automation of the scheduling and execution of the tests. Furthermore, it provides information logs on each test carried out, enabling verification of correct operation, as well as the performance of several of these tests in parallel.
Therefore, this test suite is responsible for pushing specific components of the PC to the limit, such as the system itself, the processor, or disk writing. The Phoronix suite can be automated through a mode called batch mode. The idea was to carry out different tests to vary the type of stress on the servers, analyzing the energy consumption, and to be able to simulate real situations as completely as possible.
3.3. Test Cases
The tests used and the types of stimuli that allow for simulation of real application consumption requirements are based on three Phoronix benchmarks (AsmFish, Radiance, and Sysbench). The following bullet list is organized in terms of use cases. Each use case describes the type of test, the corresponding benchmark used, and the reason for its selection. To facilitate understanding, a brief explanation or example is provided for each use case.
No charge. A script is launched that does not run any charge tests to monitor the consumption of operating system processes. These data are the base case, allowing for a comparison between the normal or idle system behavior and the rest of the charging scripts.
AsmFish. This is an advanced chess benchmark written in Assembler. This test spends the largest amount of resources, since its consumption is maximized for duration of the test. AsmFish simulates intensive applications that constantly request many resources, for example, multimedia processing in servers (YouTube, Twitch, etc.).
Radiance. This is a benchmark for NREL Radiance, an open-source synthetic imaging system developed by the Lawrence Berkeley National Laboratory in California. This test allows for alternation of high stress with a low stress, simulating applications that are related to hourly consumption, that is, applications for which, at certain times, few users connect and spend few resources, whereas at other times, many users connect and spend many resources, for example, video or file compression.
Sysbench. This is a Sysbench benchmark with built-in memory and CPU subtests. Sysbench is a scriptable multithreaded benchmark tool based on LuaJIT. This test places server resources at their maximum stress for a short time, allowing for the simulation of punctual charge applications, for example, Apache Server.
Hybrids. Since it is possible to run different types of applications on a server, further tests are proposed that combine the previous tests in an effort to simulate days with more punctual charge needs, days with more intense charge, and days where the charge is predominantly alternated.
3.4. System/CPU Information
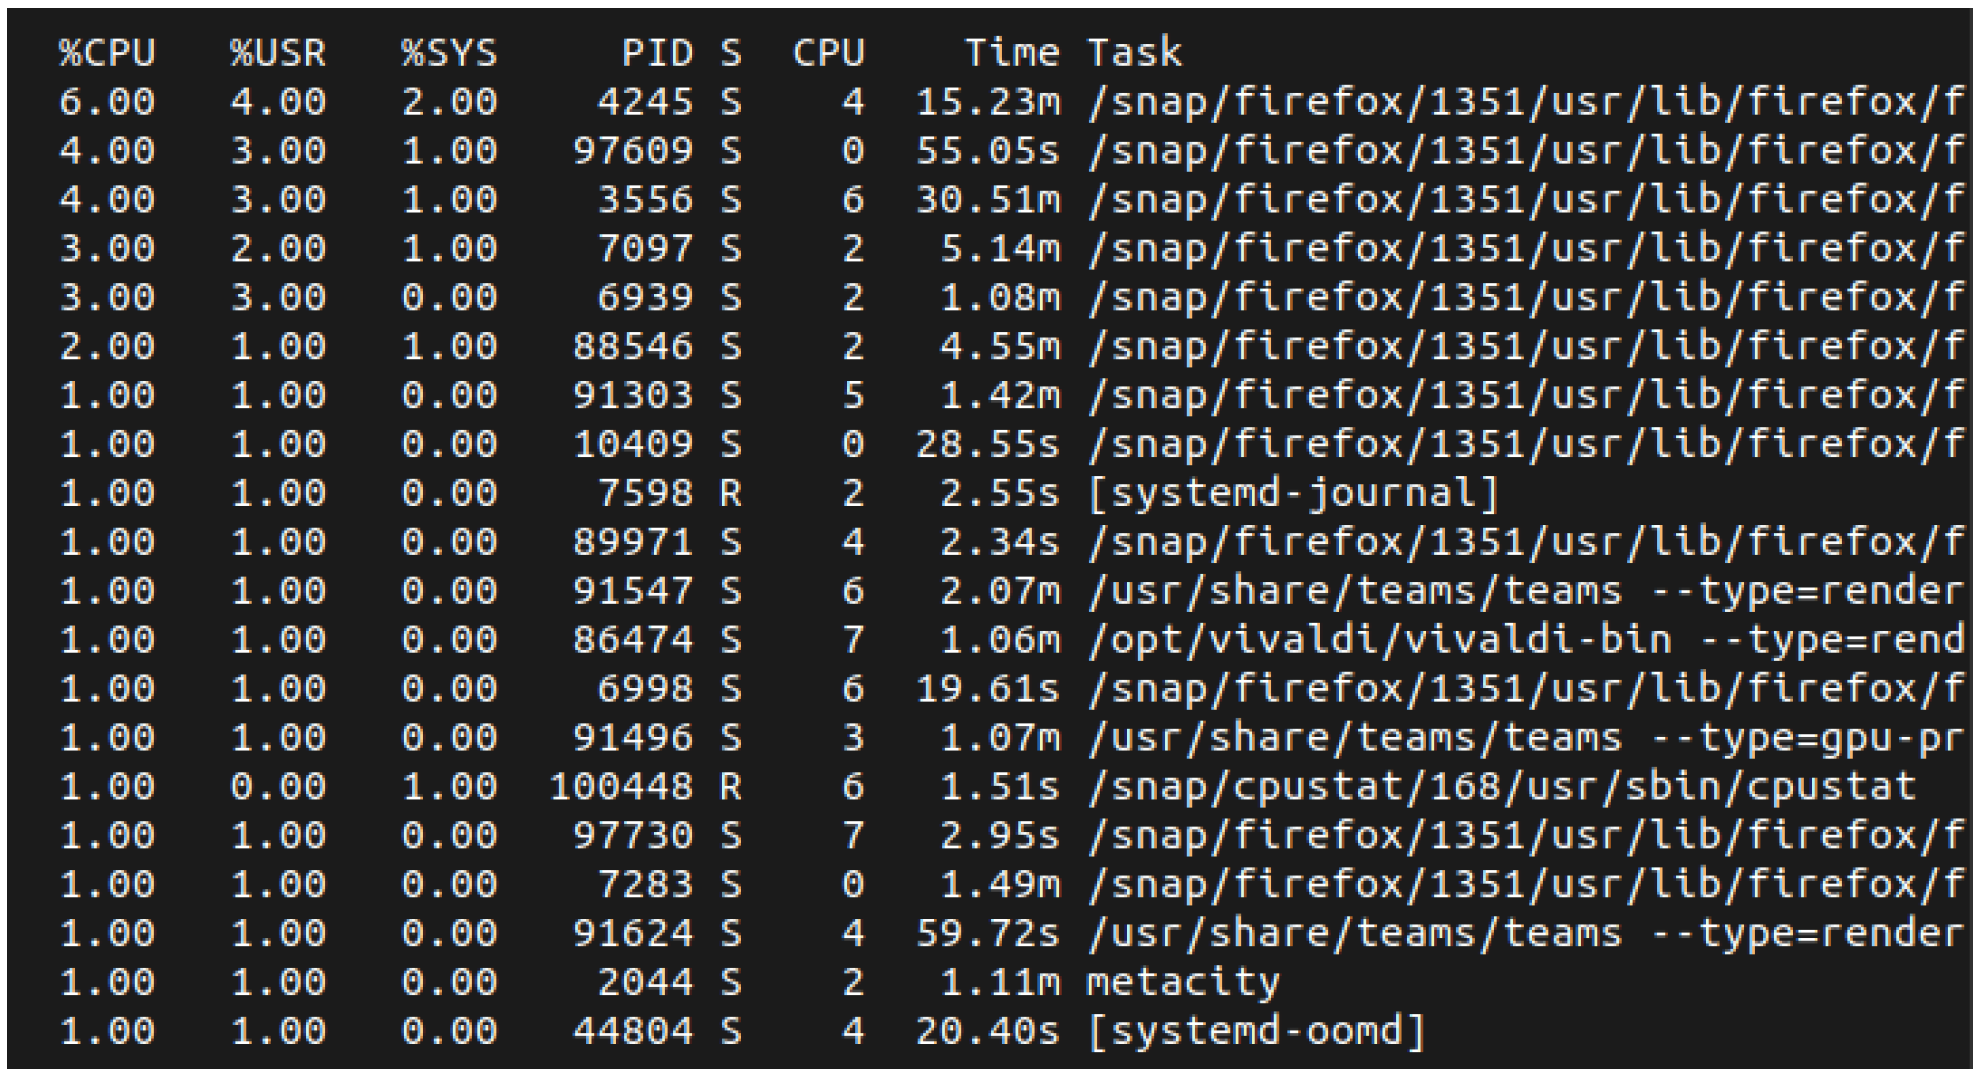
Once the stimulus is explained, it is important to gather the resource usage information to be saved and to create a log file to extract the data of interest. Energy and physical resource consumption are closely related, especially for virtualized environments, where deployment and execution of services are preassigned to virtual resources built upon physical resources. Therefore, the way the virtual resources are assigned and their use during the execution define the final energy consumption. The method adopted in this work is to start the Phoronix tests, monitor resource usage, and log into a file in order to associate the server’s resource utilization and energy consumption and generate the dataset. Many monitoring tools are available; in this case, our work is based on a Linux system, and two tools (htop and CPU stat) were chosen. However, the idea could be used in other operating systems just by finding equivalent tools.
3.4.1. Htop
Htop is a terminal-based system monitoring application that shows data on various system processes and their resource consumption in a structured and human-readable format.
Figure 3 shows a screen capture of the htop utility.
The information is organized, and a brief explanation of the data considered for this work is provided as follows.
PID represents the ID of the process;
CPU% represents the use of CPU;
MEM% is the use of memory;
Command is the name of the program that uses the resources.
The information presented by htop enable the collection of the relevant data for the creation of the dataset. The complete htop guide is available in [
36].
3.4.2. CPU Stat
Another utility that could be useful to extract resource utilization is represented by the command CPU stat shown in
Figure 4.
Similar to htop but more simple, this tool introduces the consumption of resources as follows (only the features relevant for this work are described):
%CPU represents the use of CPU;
PID represents the process ID;
CPU is number of threads used by the task;
Task is the name of the program that uses the resources.
Consult [
37] to access the complete CPU stat guide.
3.4.3. Bash Script
The Phoronix suite can run in batch mode, even if, once the tests are finished, they need to be restarted. To generate a complete dataset, the execution time should be set according to the needed analysis. Furthermore, the information provided by the Linux commands that monitor resource consumption presented in
Section 3.4.1 and
Section 3.4.2 must be stored and associated with the information about power consumption acquired with the hardware/software energy measurement system described in
Section 3.1.
To automate these tasks, some Linux Bash scripts were generated that allow for a relaunch of the test once it has finished for the entire established analysis execution time. Additionally, to store server resource consumption data, the scripts save the output of the htop/CPU stat commands as a log file, creating an archive with the consumption of each system process. This solution allows for automation of the tests for the time desired to create a dataset.
The script structure shown in
Figure 5 consists of a general loop that operates for the duration of the analysis time (
). In the time loop, the scripts launch the desired Phoronix test and check its execution. If the Phoronix test process stops, it is relaunched. This is possible because the scripts are able to identify the process of the Phoronix test; if the process is not present, it means that the test is not running and should be relaunched. Furthermore, the scripts launch the htop/CPU stat, saving their output in a log file and creating the resource power archive as explained in the previous section. The scripts used in this work are provided and can be downloaded from [
29].
With these scripts, it is possible to schedule a set of tests to analyze power consumption by simulating the power needs of various applications in a data center.
Table 1 shows an example of experiment planning using five servers with a different test day that simulates various power needs.
Test 1: the script does not run any tests and creates a log file with the consumption of server operating system resources, which is very useful to compare power needs with the other tests.
Test 2: the script simulates very intense applications that use 100% of the server resources.
Test 3: this configuration simulates applications with punctual charge needs.
Test 4: the test simulates applications that perform an intense task for a medium period of time and stop for a while.
Test 5: hybrid test with high resource use predominance.
Test 6: hybrid test in which medium-intensity tasks are launched.
Test 7: hybrid test with applications that make a punctual use of resources.
The previous example shows a possible solution to schedule a set of tests, but is possible to adapt the set of tests to a different situation, number of servers, etc. Furthermore, it is possible to change Phoronix tests by installing a new test and modifying the scripts, maintaining the script structure shown in
Figure 5 but changing the name of the test (command to be launched).
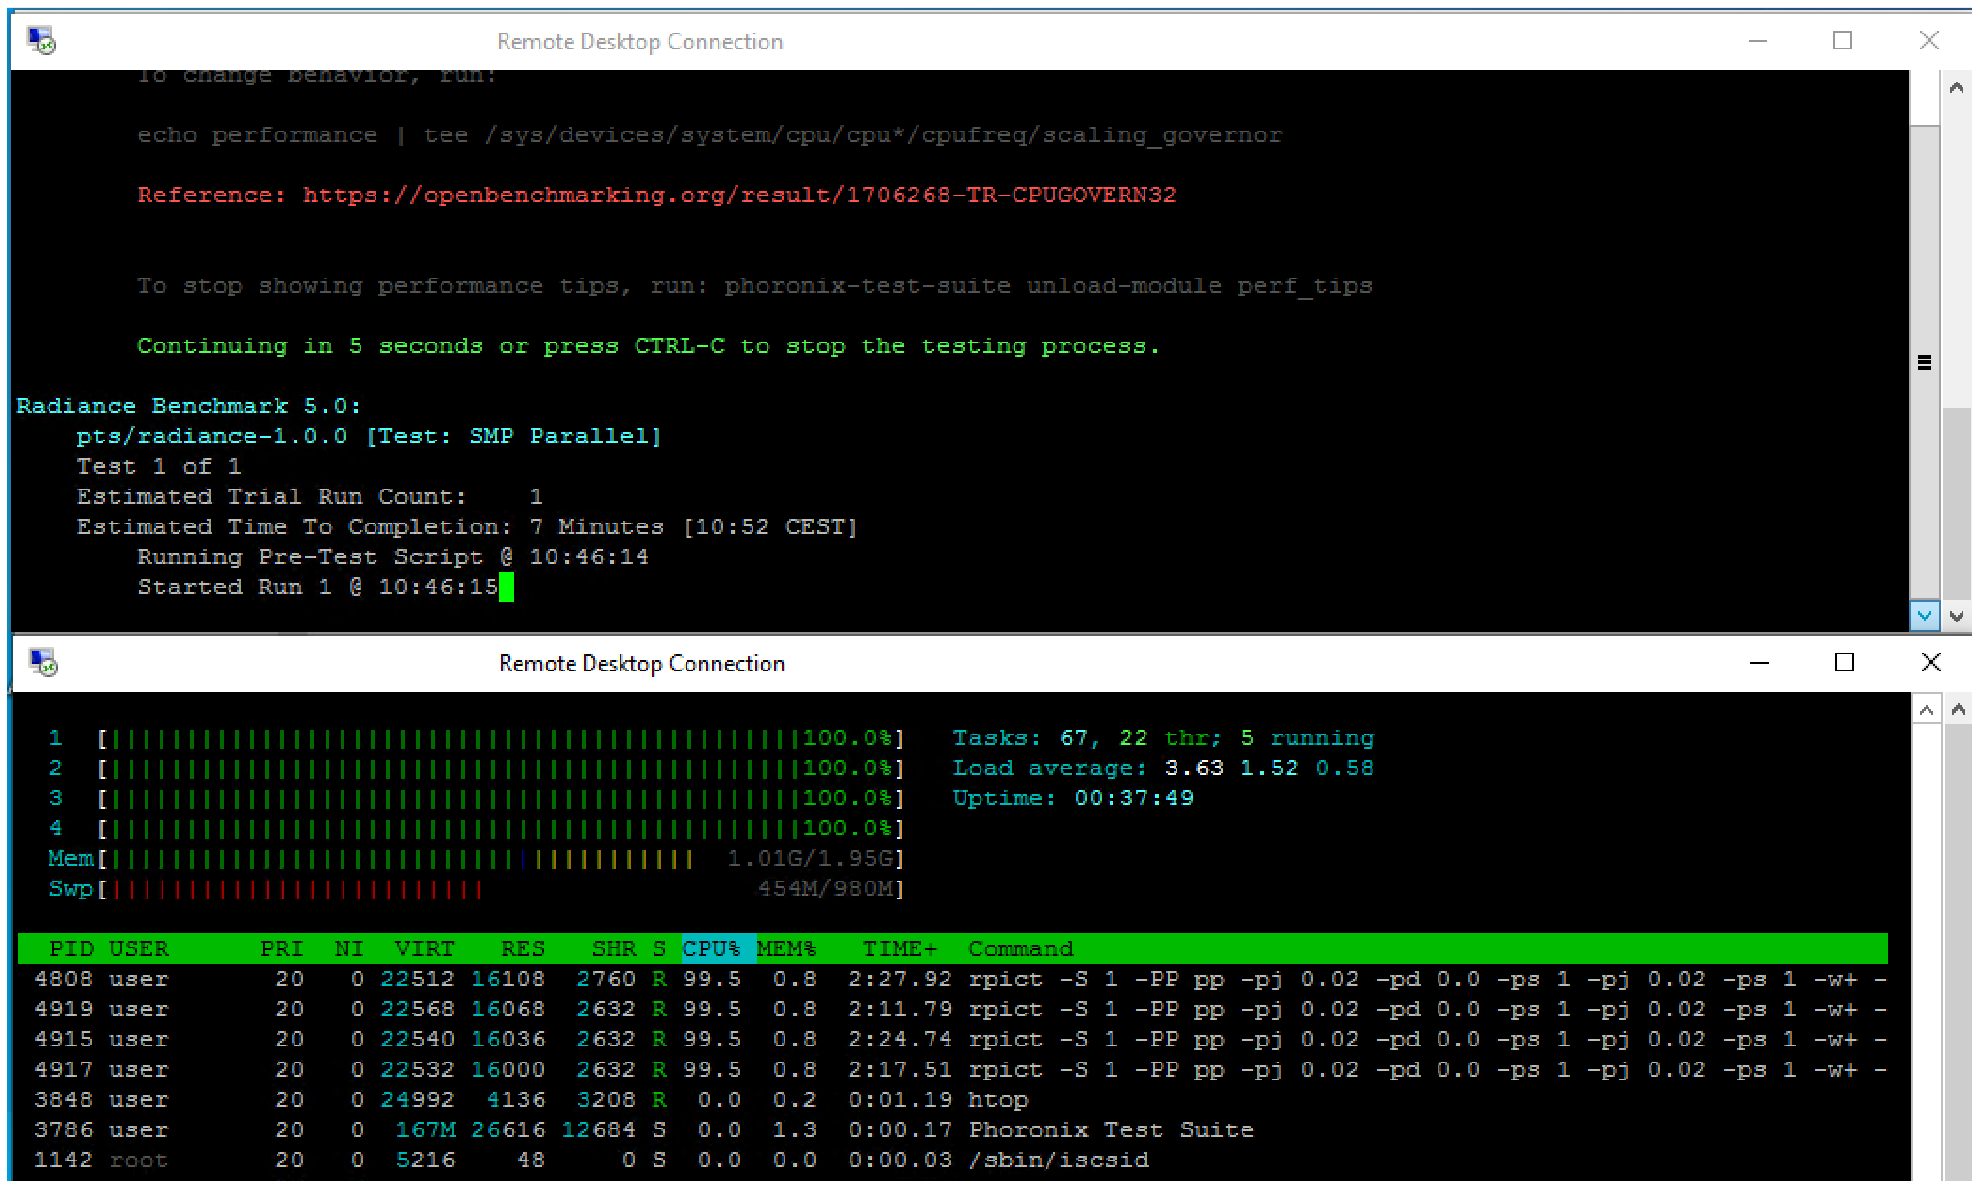
Figure 6 shows the Radiance test running. It is made up of two windows; in the upper part, it is possible to see the Radiance Phoronix test launched in the terminal and running, while in the lower part, the htop command is shown with the rpic processes that represent the Radiance test running on four threads (multithreading execution).
3.5. Dataset Creation
In certain fields, the low availability of datasets causes a decrease in future analysis and development. Specifically, in the energetic discipline, it is complex to find datasets that combine internal data from computers with energy data measured in real time. This work aims to offer a methodology and resources to build a dataset from scratch and to seek future energy solutions, taking the obtained datasets as a starting point.
The data generated in this study were collected in a university laboratory with specific resources dedicated to internal tasks and developments. It is not adequate to compare with larger data centers, such as the most-used cloud providers (Amazon Web Services, Google Cloud, Microsoft Azure, etc.) [
38], where a cloud structure has been created to offer services to a large community. The purpose of this research article is to provide a starting point and guidance for energy datasets.
Table 2 shows statistical measurements to help understand the scope and limits of the system.
The dataset creation process presented in this work follows the best practices presented in [
39,
40,
41] and the recommendations evaluated in [
8]. These steps are general in every field (e.g., [
42,
43]), such as data creation and extraction, data processing, and analysis and visualization to corroborate the obtained results. The data were obtained in various rounds of tests, and, thanks to this approach, the tool was refined. This helped to understand how to manage the benchmarks to obtain a diverse and complete dataset, using different stimuli to obtain various energy parameters.
In addition to the complete dataset, the information logs containing the raw data on the performed stress tests are also available as individual machine and test log files. Maintaining complete data accessibility is important because it allows the community to check the reliability of the dataset, in addition to supporting further development and knowledge about energy consumption, including a possible starting point for future AI projects. The code and individual datasets can be obtained from the project’s main repository [
30] or on Kaggle [
31]. The whole integration process is shown in
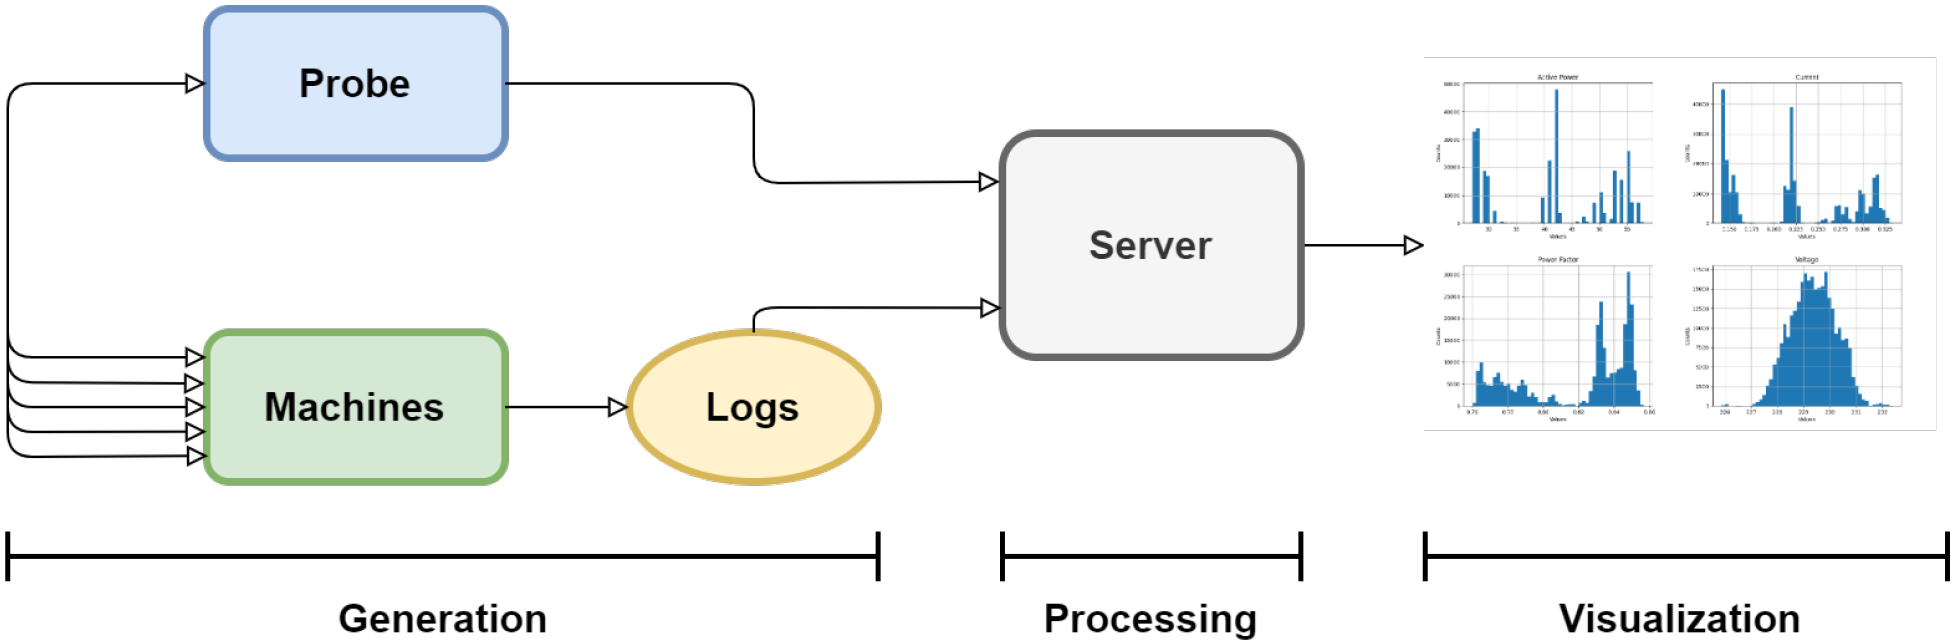
Figure 7, with the steps explained in the following points.
3.5.1. Data Generation
The data used in the analysis were obtained from two sources. First, values were obtained from the physical probe connected to the equipment. These measurements are periodically sent to a REST API server, as described in
Section 3.1. Second, the consumption data are generated by the server, where the Phoronix suite stress test is run, as described in
Section 3.2. Specifically, the data are obtained by launching the htop system command and saving its output process as log files.
Data are extracted in parallel at the same time, allowing for synchronization with data sources and the creation of a data record filtered by timestamp. This practice permits the CPU values of the systems to be obtained and correlated with the energy parameters measured at the same time.
For every test conducted (as mentioned in
Section 3.4.3), individual datasets are formed test by test. The data files from each source are synchronized with the probe’s measurements in the following step. This allows the dataset to be filtered by test type and source number.
3.5.2. Data Processing
The initial stage consists of processing the data, analyzing the output log files, extracting relevant information, and merging them suitably. As discussed in the preceding section, data extraction was performed in parallel, integrating the data into a single record.
The probe sends raw data to the system, focusing on four parameters that characterize the energy measurements of servers in a data center: voltage, current, active power, and power factor. However, the system logs generated by the script described in
Section 3.4.3 contain additional information that includes all operation system processes (
Figure 3 and
Figure 4), which require data curation.
Analyzing the information from the htop and CPU stat tools contained in the log files, the CPU values used by the charge processes are needed to correlate with the values measured by the probe. The goal consists of extracting useful information from the raw data, creating a set of registers that can be varied, and analyzing the effects produced by the different charges on the systems.
3.5.3. Data Analysis and Visualization
The dataset is obtained by combining the two data sources. It is classified by probe measurement channel, where each channel corresponds to a server connection. The analysis focuses on power consumption and the types of tests performed. The seven tests carried out are described in
Section 3.4.3 and
Table 1. This categorization enables a detailed impact analysis of the system charging tests according to energy consumption and system process usage.
The no charge test was developed as a baseline for future analysis and comparison. Using this approach, it is possible to isolate the system processes from the benchmark techniques applied to stimulate the machines. Therefore, the no charge test served as a benchmark for comparison of the energy consumption of the other tests.
Graphical analysis helps to understand the relationship between the different identified characteristics. The conclusions drawn thanks to the evaluation enable the creation of a correct and reliable dataset. Data are analyzed with a special focus on finding possible information patterns of interest. Additionally, the evolution of measurements throughout the benchmarks is considered, taking into account the CPU progression for each test.
The dataset obtained by processing the power consumption information provides valuable insights into the impact of different stress tests on the system (statistics of a specific channel are presented in
Table 2).
The dataset consists of 29 columns, including timestamps, CPU usage for various tests, energy measurements, and the source of the energy. With a total of 294.910 rows, the data provide a comprehensive view of the energy consumption and performance of the system under various stress tests. Data can be analyzed to observe the effects of charging tests on the energy consumption of the system and the usage of internal resources. Additionally, the dataset is grouped by test case and source, and individual datasets are also provided for each test case, allowing for a more in-depth analysis of the results. A summary of this information is organized in
Table 3.
4. Results
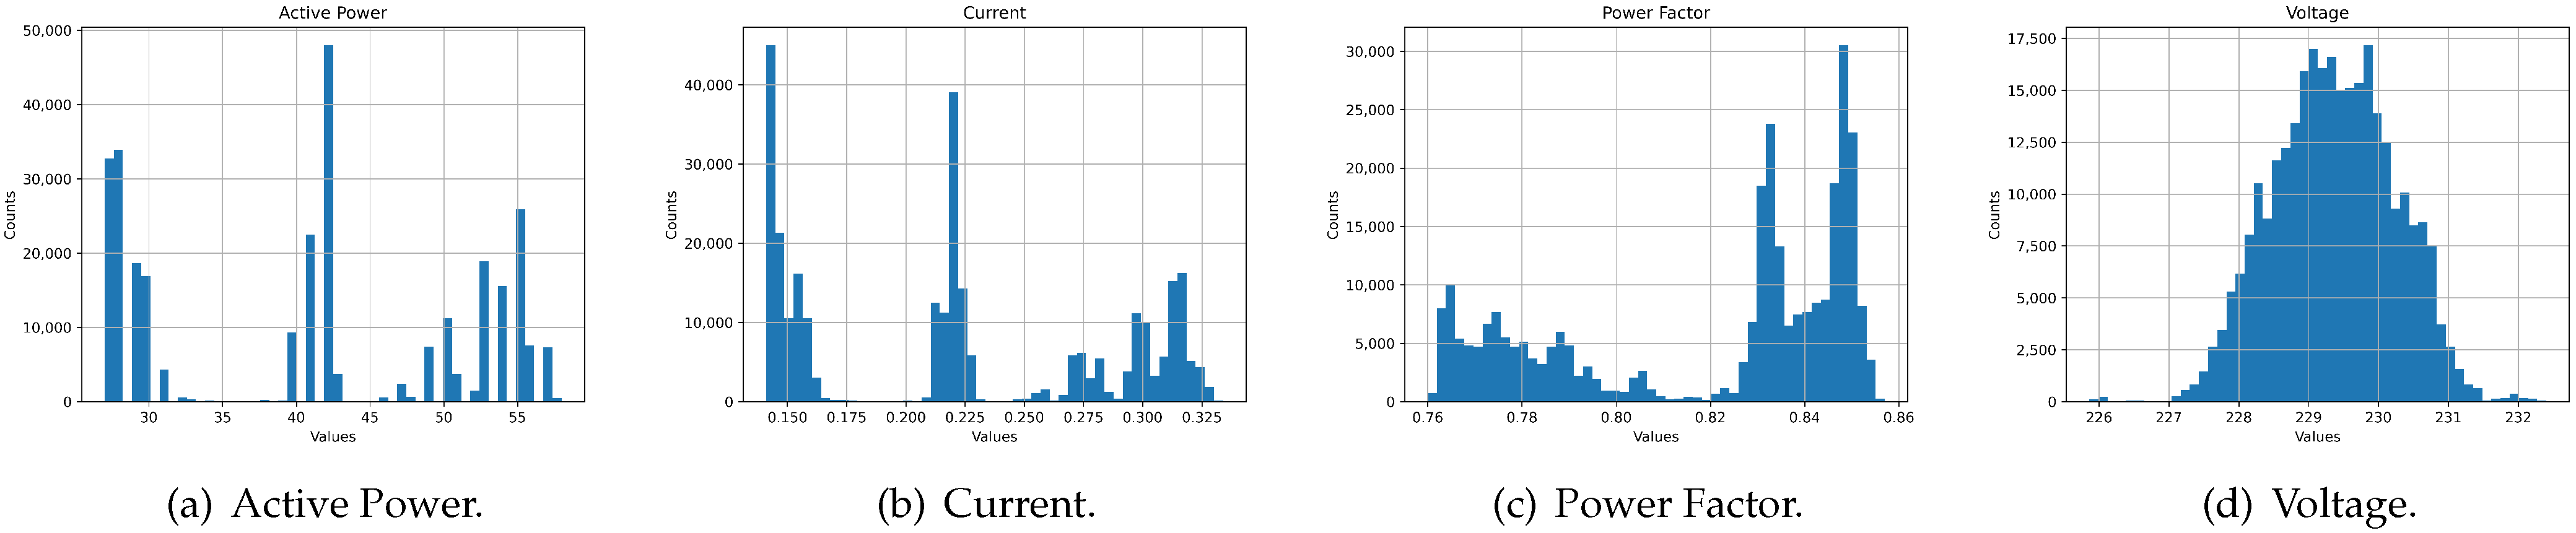
As an initial draft of the results, the histograms of the four primary energy features in the dataset are presented. The histograms presented in
Figure 8 provide a visual representation of the distribution of values for active power, current, power factor, and voltage. The graphical representation of these data helps to improve understanding of the energy parameter behavior. The complete dataset obtained in the previous sections was used to generate these histograms.
In detail, in
Figure 9, the distribution of energy characteristics is shown, corresponding to all the benchmark iterations. The distribution values support analysis of the behavior of the energy parameters according to the stress tests applied to the servers. In
Figure 9, a single test is considered that shows how the methodology can be applied, setting a starting point for further analysis.
By analyzing the distribution of values, behavioral knowledge is acquired according to each energy characteristic as it evolves over time, considering the stress from the benchmark techniques. This methodology is demonstrated using a single test case, which serves as an initial demonstration and provides a starting point for further analysis.
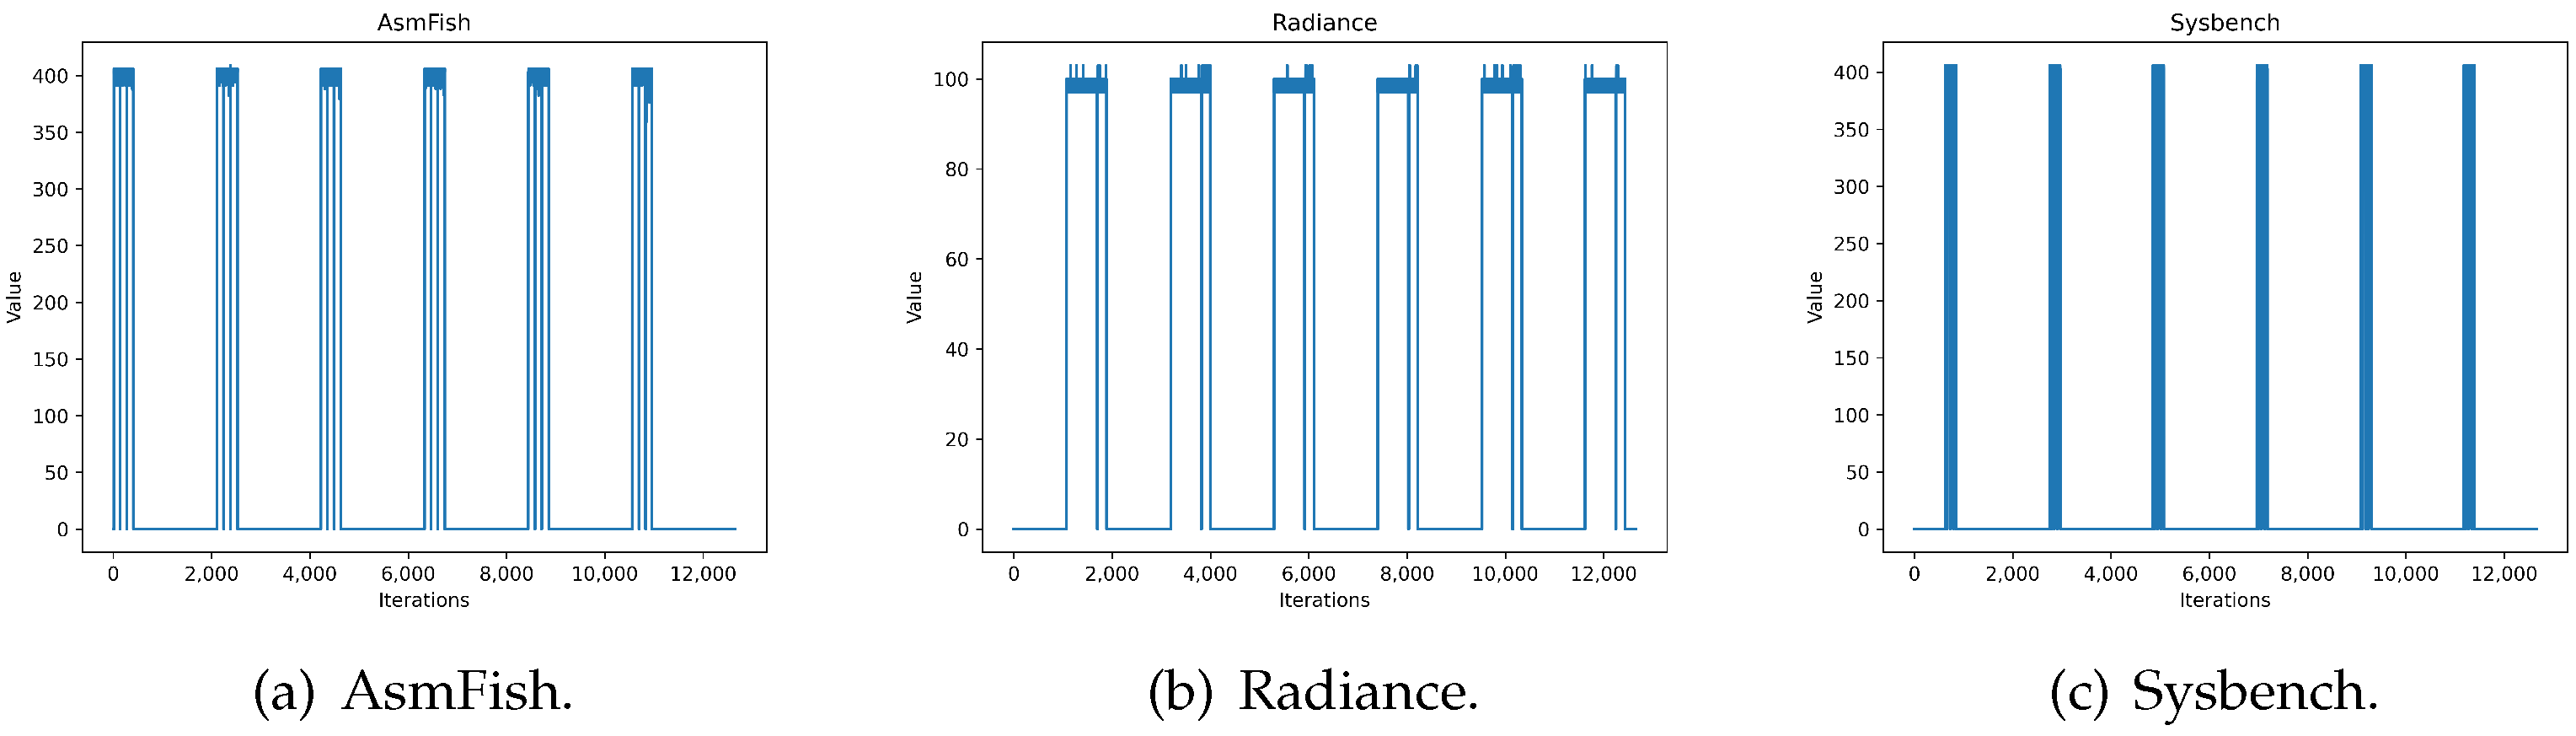
To evaluate the consumption of energy over a period of time, the CPU usage of the servers is considered. These values are acquired from the htop tool, where the range of 0–400 represents the usage of CPU threads (100 for each thread).
The energy consumption varies according to the stress test applied.
Figure 10 shows an example in which the stress tests are activated from the scripts according to the flow chart presented in
Figure 5.
When working with the complete dataset, it is crucial to identify the relationships between the variables. To ensure that the energy dataset accurately reflects the underlying energy characteristics, it is important to establish the degree of interdependence between the different features. One way to achieve this is to develop a correlation matrix by plotting the values on a heat map to examine the relationships between pairs of variables. The numerical values on the heat map represent the correlation coefficient, which measures the strength and direction of the relationship between the features. These values are presented in the range of −1.0 to 1.0 using the following interpretation:
A positive value represents a direct correlation between the characteristics. In fact, both characteristics grow in the same direction. This is expressed by positive numerical values (where 1.0 is the maximum obtainable value) in the correlation matrix;
A negative value represents an inverse relationship between the characteristics. This means, for example, that one characteristic is growing while the other is decreasing. This is expressed by negative numerical values, where −1.0 is the minimum obtainable value;
Values close to zero show a weaker correlation, where no trend is present between the variables.
The aim of this research was to gather the results accurately. This was achieved through a dedicated testing and data collection process, using server infrastructure exclusively for these purposes. The use of a private structure for this experiment allowed for the appropriate time conditions for data collection (estimated to be four hours per day). Following the plan shown in
Table 1, the results of each test case are presented as follows:
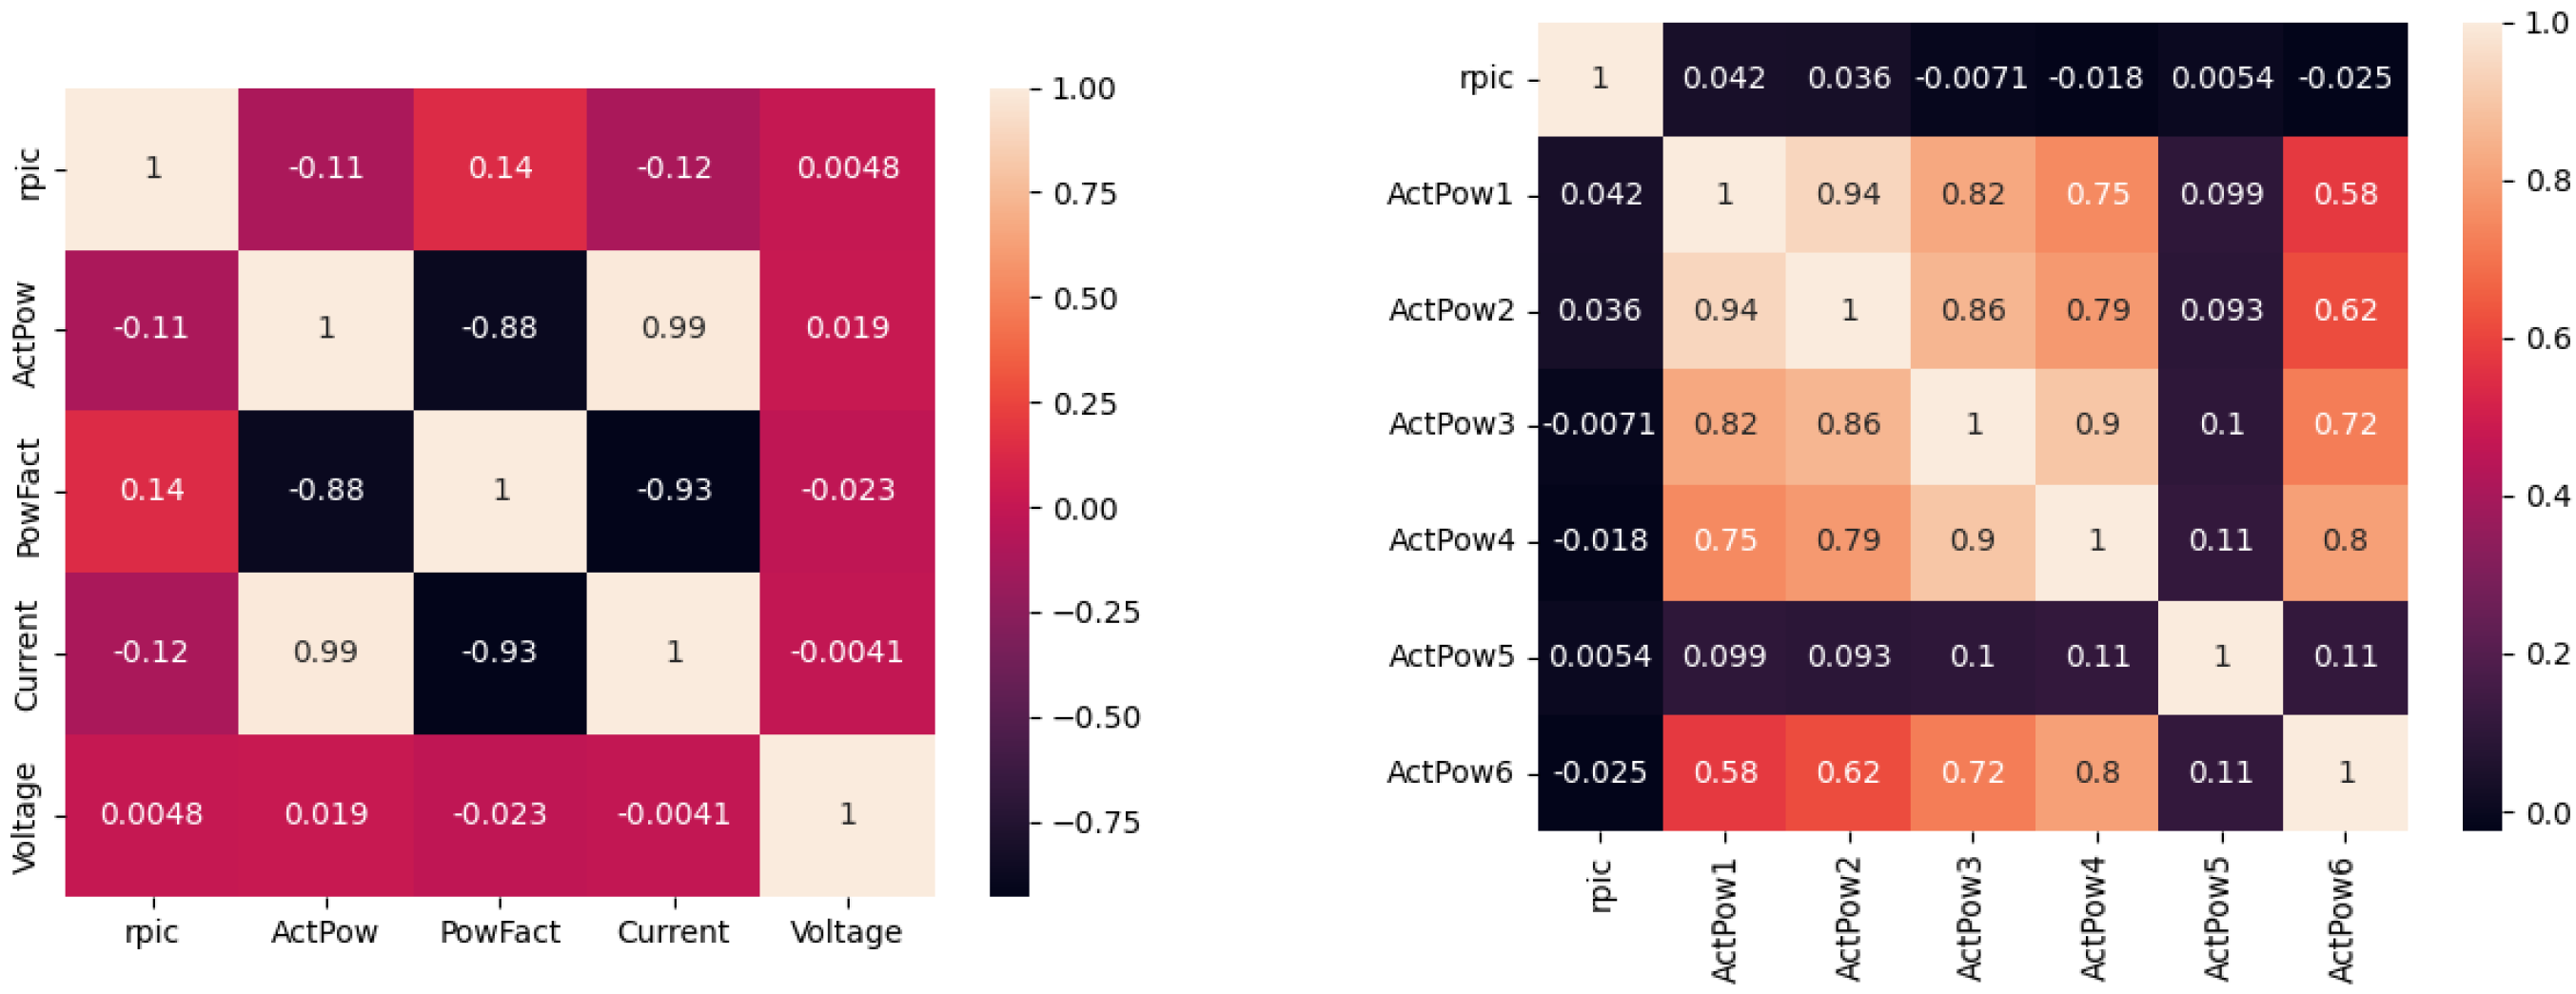
No charge. The purpose of the no charge test is to compare the operating system resource usage with other test cases and to examine the low correlation between parameters, as the benchmarks do not consume server resources. The energy behavior recorded by the probe during this test indicates the power consumption of the servers when they are in idle mode.
Figure 11 shows the results for the mentioned test case.
Radiance. This test shows a better relationship between the energy features, even though the correlation value is not particularly high. It is worth mentioning that all energy values have a complete correlation.
Figure 12 exposes the correlation between measurements.
Sysbench. The Sysbench test shows a noticeable improvement compared to the previous test. A stronger correlation is noticed between the system and the active power, with all energy values still fully correlated, except for voltage, which is expected to stay relatively stable. In
Figure 13 are presented the correlations between measurements.
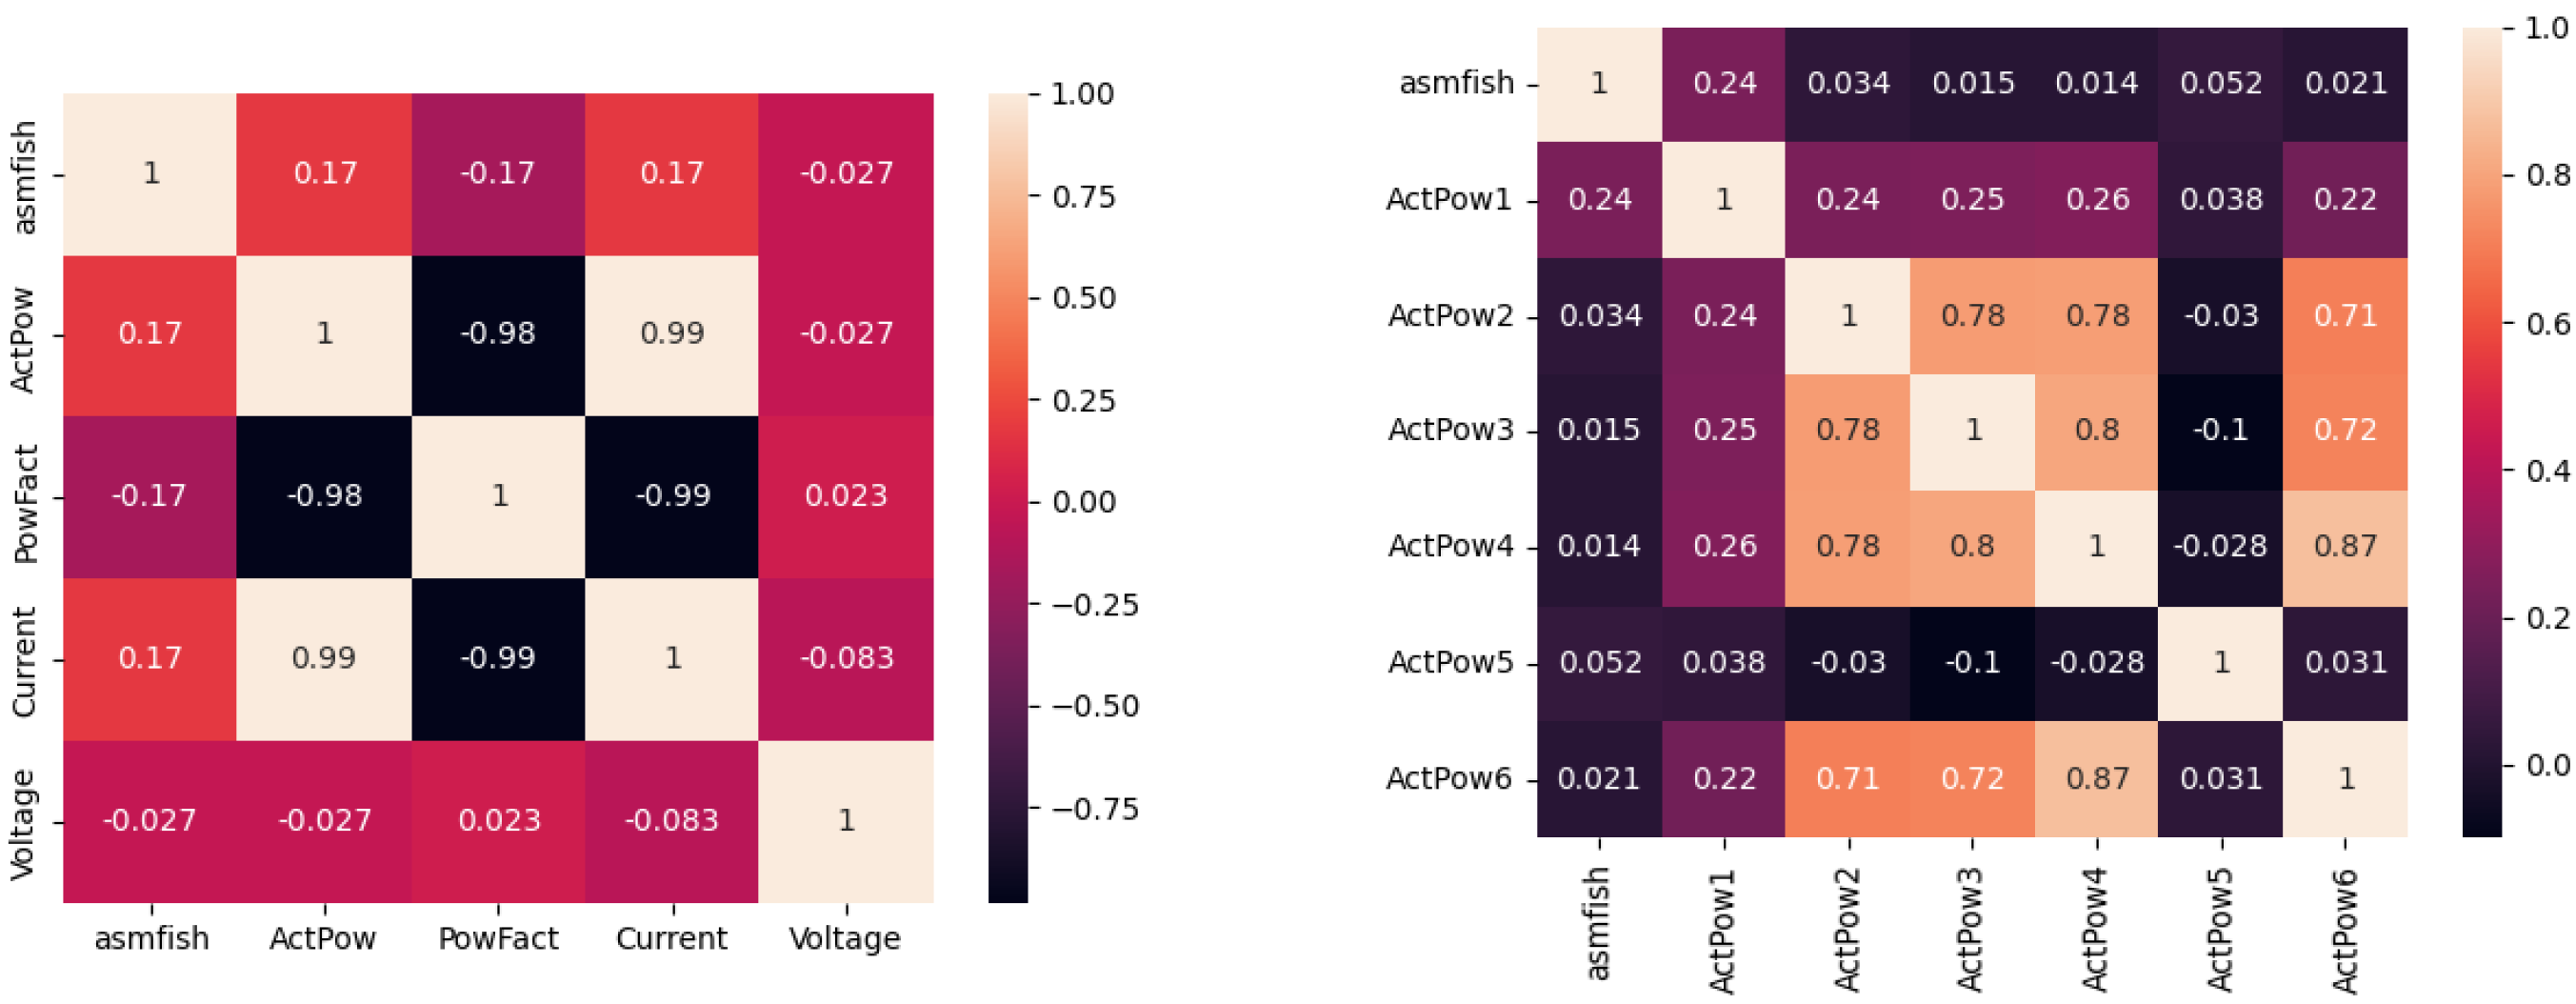
AsmFish. The enhanced correlation achieved in these tests, in comparison to the Sysbench test, is evident through the stronger correlation observed in the energy values. AsmFish test correlation values are expressed in
Figure 14.
Hybrid 1. The hybrid tests of this methodology represent a modality that combines the execution of the Radiance, Sysbench, and AsmFish tests. Hybrid 1 simulates the prevalence of high-intensity activities. The correlation between the energy values is strong, except for the results from the Sysbench process. First hybrid test correlation values are shown in
Figure 15.
Hybrid 2. This test simulates the prevalence of medium-intensity activities. The correlation between the outcomes improves for the AsmFish process; however, the correlation for the Sysbench process is not complete. Correlation values for the hybrid 2 test is presented in
Figure 16.
Hybrid 3. The final test features the prevalence of punctual resource utilization. The correlation between the results shows a decline in the Sysbench process compared to the other high-intensity tests, while Asmfish and Radiance still exhibit a strong correlation. Final correlation values are in
Figure 17.
5. Discussion
When considering the measurement system, two alternatives were initially proposed: a software version and a hardware version based on an IoT energy probe. For this particular study, the hardware version was selected due to its superior precision in recording data, despite requiring a more substantial effort to develop the hardware measurement system. This decision was made because the hardware measurement system can be customized to meet specific power consumption requirements, ensuring accurate and precise data acquisition. It was deemed that the benefits of the customized hardware system outweighed the additional effort involved in its creation.
The stress tests conducted in this study used the Phoronix benchmark suite, which specifically targets CPU and memory usage to simulate data centers for Internet applications, e-commerce usage, and more. It is worth noting that the Phoronix suite offers a diverse range of benchmarks, allowing for the simulation of various other data center applications.
The no charge test served as a reference point to evaluate the performance of other tests. From its correlation matrix, it was evident that all active power values were independent of each other.
In the Radiance test, the correlation between the active power values increased, while the relationship between the CPU usage of the test process and the active power was close to zero. This indicates that, on the basis of the measurement data, there was no significant correlation between the energy measurement values. These results may have been influenced by measurement lag, as launching the Radiance benchmark on multiple servers may cause variations in the start and end times, resulting in inaccurate measurements.
Similarly, in the Sysbench test, a correlation between the CPU usage of the test process and the energy measurements was observed, confirming the impact of the benchmark on the CPU. However, this benchmark generates punctual system stress, causing variations in the start and end times and potentially leading to measurement lag.
In the AsmFish test, an increase in the correlation between the active power values was observed, while there was a high correlation between the energy measurement values, albeit slightly lower than in the Sysbench test.
Hybrid tests, which involve a combination of stress tests, resolved the measurement lag issues existing in the previous tests. The continuous stress on the system over time due to a variety of benchmarks running concurrently reduced the lag in data collection and resulted in high correlation between the measurement values and active power. This can be seen in the high correlation in hybrid test 2, which is clearly depicted in its color map.
The active power measurement, which provided a more accurate assessment of energy consumption, is summarized in
Table 4 for all the test cases and two sources. The table showcases the statistical representation of the essential values obtained from AP_1 (active power from source 1) and AP_2 (active power from source 2) measurements. The statistical analysis encompasses several metrics, such as mean, standard deviation, and interquartiles. Additionally, it incorporates three comparative indicators in relation to the no charge test: mean difference (±NC), percentage of mean increase (%Mean), and increase in standard deviation (%Std).
Upon examining
Table 4, it becomes apparent that all the conducted tests exhibited a significant rise in active power. The minimum observed increase was 50% (hybrid 3), while the maximum reached nearly 96.5% in the case of the AsmFish test. Comparatively, the no charge test served as a reference point, yielding an average active power of 27.4 W. In stark contrast, the AsmFish test recorded an average of 54W, nearly doubling the baseline value. As evidenced by the findings, AsmFish exerted the most substantial influence on active power, despite not exhibiting the highest active power readings. Sysbench demonstrated the second-highest impact, while Radiance yielded the lowest impact among the three stress tests. The third hybrid test had the highest peak value for power source two, but its average was lower than the other two hybrid tests. The first and second hybrid tests showed results similar to the individual tests. Unlike the other tests, the hybrid tests did not reach the highest levels of active power, with AsmFish holding the record for the highest value.
6. Conclusions
This research aimed to address the scarcity of energy datasets that combine internal resource data with real-time energy measurements from an IoT module. By systematically collecting and analyzing energy data, the researchers aimed to fill this gap and provide valuable insights for energy consumption optimization in different systems and for different applications. The primary goal was to contribute to the understanding of energy consumption in real-world scenarios and establish a foundation for further research in this field.
The stress tests conducted in this study, as demonstrated in
Table 4, effectively increased the energy values, generating diverse and valuable data for the creation of the dataset. These tests successfully stressed the systems, creating varied conditions that proved instrumental for analysis. The reliability of the tests was evident in their ability to significantly increase the active power measurements.
Analysis of the dataset revealed a correlation between the charging processes and the energy measurements, indicating that impairment processes influence the systems, resulting in varying outcomes depending on the specific test and the level of stress applied. These findings underscore the influence of impairment processes on energy consumption and highlight the importance of considering stress levels in optimizing energy efficiency.
The work presented in this article allows the community to continue to research, using these data as a starting point (available from the GitHub project [
30] or from the Kaggle data repository [
31]), whether as a source of data for an intelligence application or as a source of inspiration for the creation of other datasets, encouraging new ones to emerge. The evolution of dataset views over time in our own Kaggle repository is demonstrated in
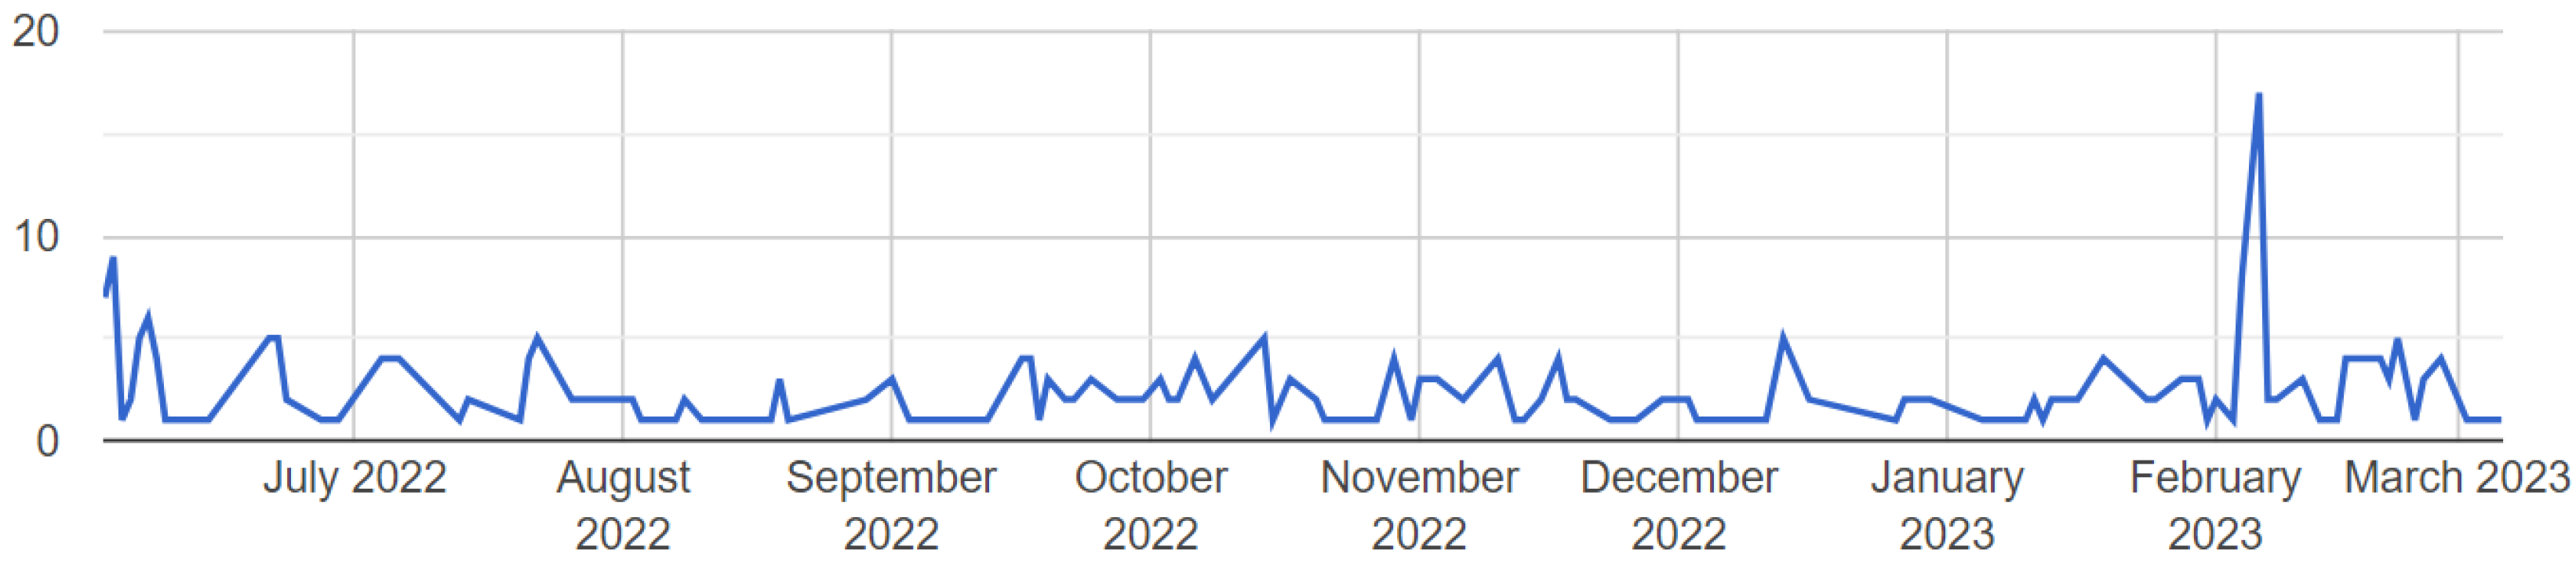
Figure 18, showing a stable interest in energy consumption and the performance of computing systems.
We have focused on the effects on CPU in particular, but the proposed method can be expanded to the rest of the components. As an example, in future work, it could be interesting to consider memory consumption, disk file read/write transactions, and possible uses of graphics cards (energy consumption, GPU usage, temperature, etc.). This can be applied with the same suite used in the present work, i.e., Phoronix, as it allows for the benchmarking of disks (for example, IOzone [
44]) useful for the simulation of backup and database application data centers, graphics rendering (Yquake or Left 4 Dead 2 games [
45,
46]) for games and hosting services, CUDA tests (NVIDIA CUDA Blender [
47]) for machine and deep learning training server farms, or other applications for which the power need can be simulated by installing the appropriate corresponding stress tests.
This implies that a more focused study of power consumption could be conducted based on a specific application feature or by selecting a group of different benchmarks to simulate the concurrent use of multiple applications in a data center. The variety of power consumption simulation scenarios proves the flexibility and scalability of the method presented in this work. In general, data that can be obtained from the systems can serve to increase the number of characteristics that add robustness to the data.
In addition to their utility in optimizing energy consumption, the collected data hold significant potential for AI applications. By leveraging these datasets, it becomes possible to develop models that can evaluate the achieved efficiency. Moreover, employing clustering techniques enables the differentiation of data points based on varying charge levels, providing valuable insights into the distribution patterns within the dataset.
The emergence of next-generation communication technologies, such as 5G and beyond, has introduced novel possibilities, such as service virtualization, dynamic scaling, dynamic orchestration, and service optimization. Optimization techniques in this context are typically focused on enhancing quality of experience (QoE) and quality of service (QoS). The data presented in this study offer a unique opportunity to optimize service energy consumption, leading to significant impacts not only from a sustainability perspective but also from an economic standpoint. By leveraging the insights gained from the data analysis, energy optimization measures can be implemented to achieve both environmental and cost-related benefits.
For these environments, optimization based on intelligent systems makes it possible to significantly improve the energy consumption derived from the use of physical resources associated with virtualization. In the ongoing effort to optimize energy consumption, a current preliminary development focuses on the softwarization of multiple domains and the increased use of virtualization. A paradigmatic case is the integration of multiaccess edge computing (MEC) capabilities in next-generation communication networks, where reducing latency and efficiently provisioning services are crucial. The configuration of virtualization parameters, resource allocation, and deployment of virtual network functions play a pivotal role in energy consumption. By carefully optimizing these factors, significant improvements in energy efficiency can be achieved, resulting in reduced environmental impact and enhanced operational cost-effectiveness. This ongoing work aims to develop novel approaches and techniques that intelligently manage virtualization in MEC environments, with the overarching goal of maximizing energy efficiency while maintaining optimal service performance. By addressing the intricate relationship between virtualization and energy consumption, this research endeavor aims to contribute to the development of sustainable and energy-efficient solutions for future communication networks.


 ,
, 


