

Transfer Learning Approach to Seed Taxonomy: A Wild Plant Case Study

 , ,
, ,  ,
,
Abstract
:1. Introduction
2. Review of the Literature
2.1. Classification Using Deep Learning
2.2. Clustering Using Deep Learning
- Deep learning is among the potential successful candidates in image feature extraction.
- In botanical studies, there is a dire need to investigate transfer learning algorithms for seed taxonomy.
- Hierarchical clustering algorithms can be investigated for automated clustering seeds that can set potential applications for classification in the future.
- The following are the most commonly used deep learning models for images: DenseNet121, DenseNet201, ResNet50V2, EfficientNetB6, EfficientNetB1, EfficientNetB0, MobileNetV2, EfficientNetB3, VGG16, VGG19, EfficientNetB5, EfficientNetB7, EfficientNetB2, and EfficientNetB4.
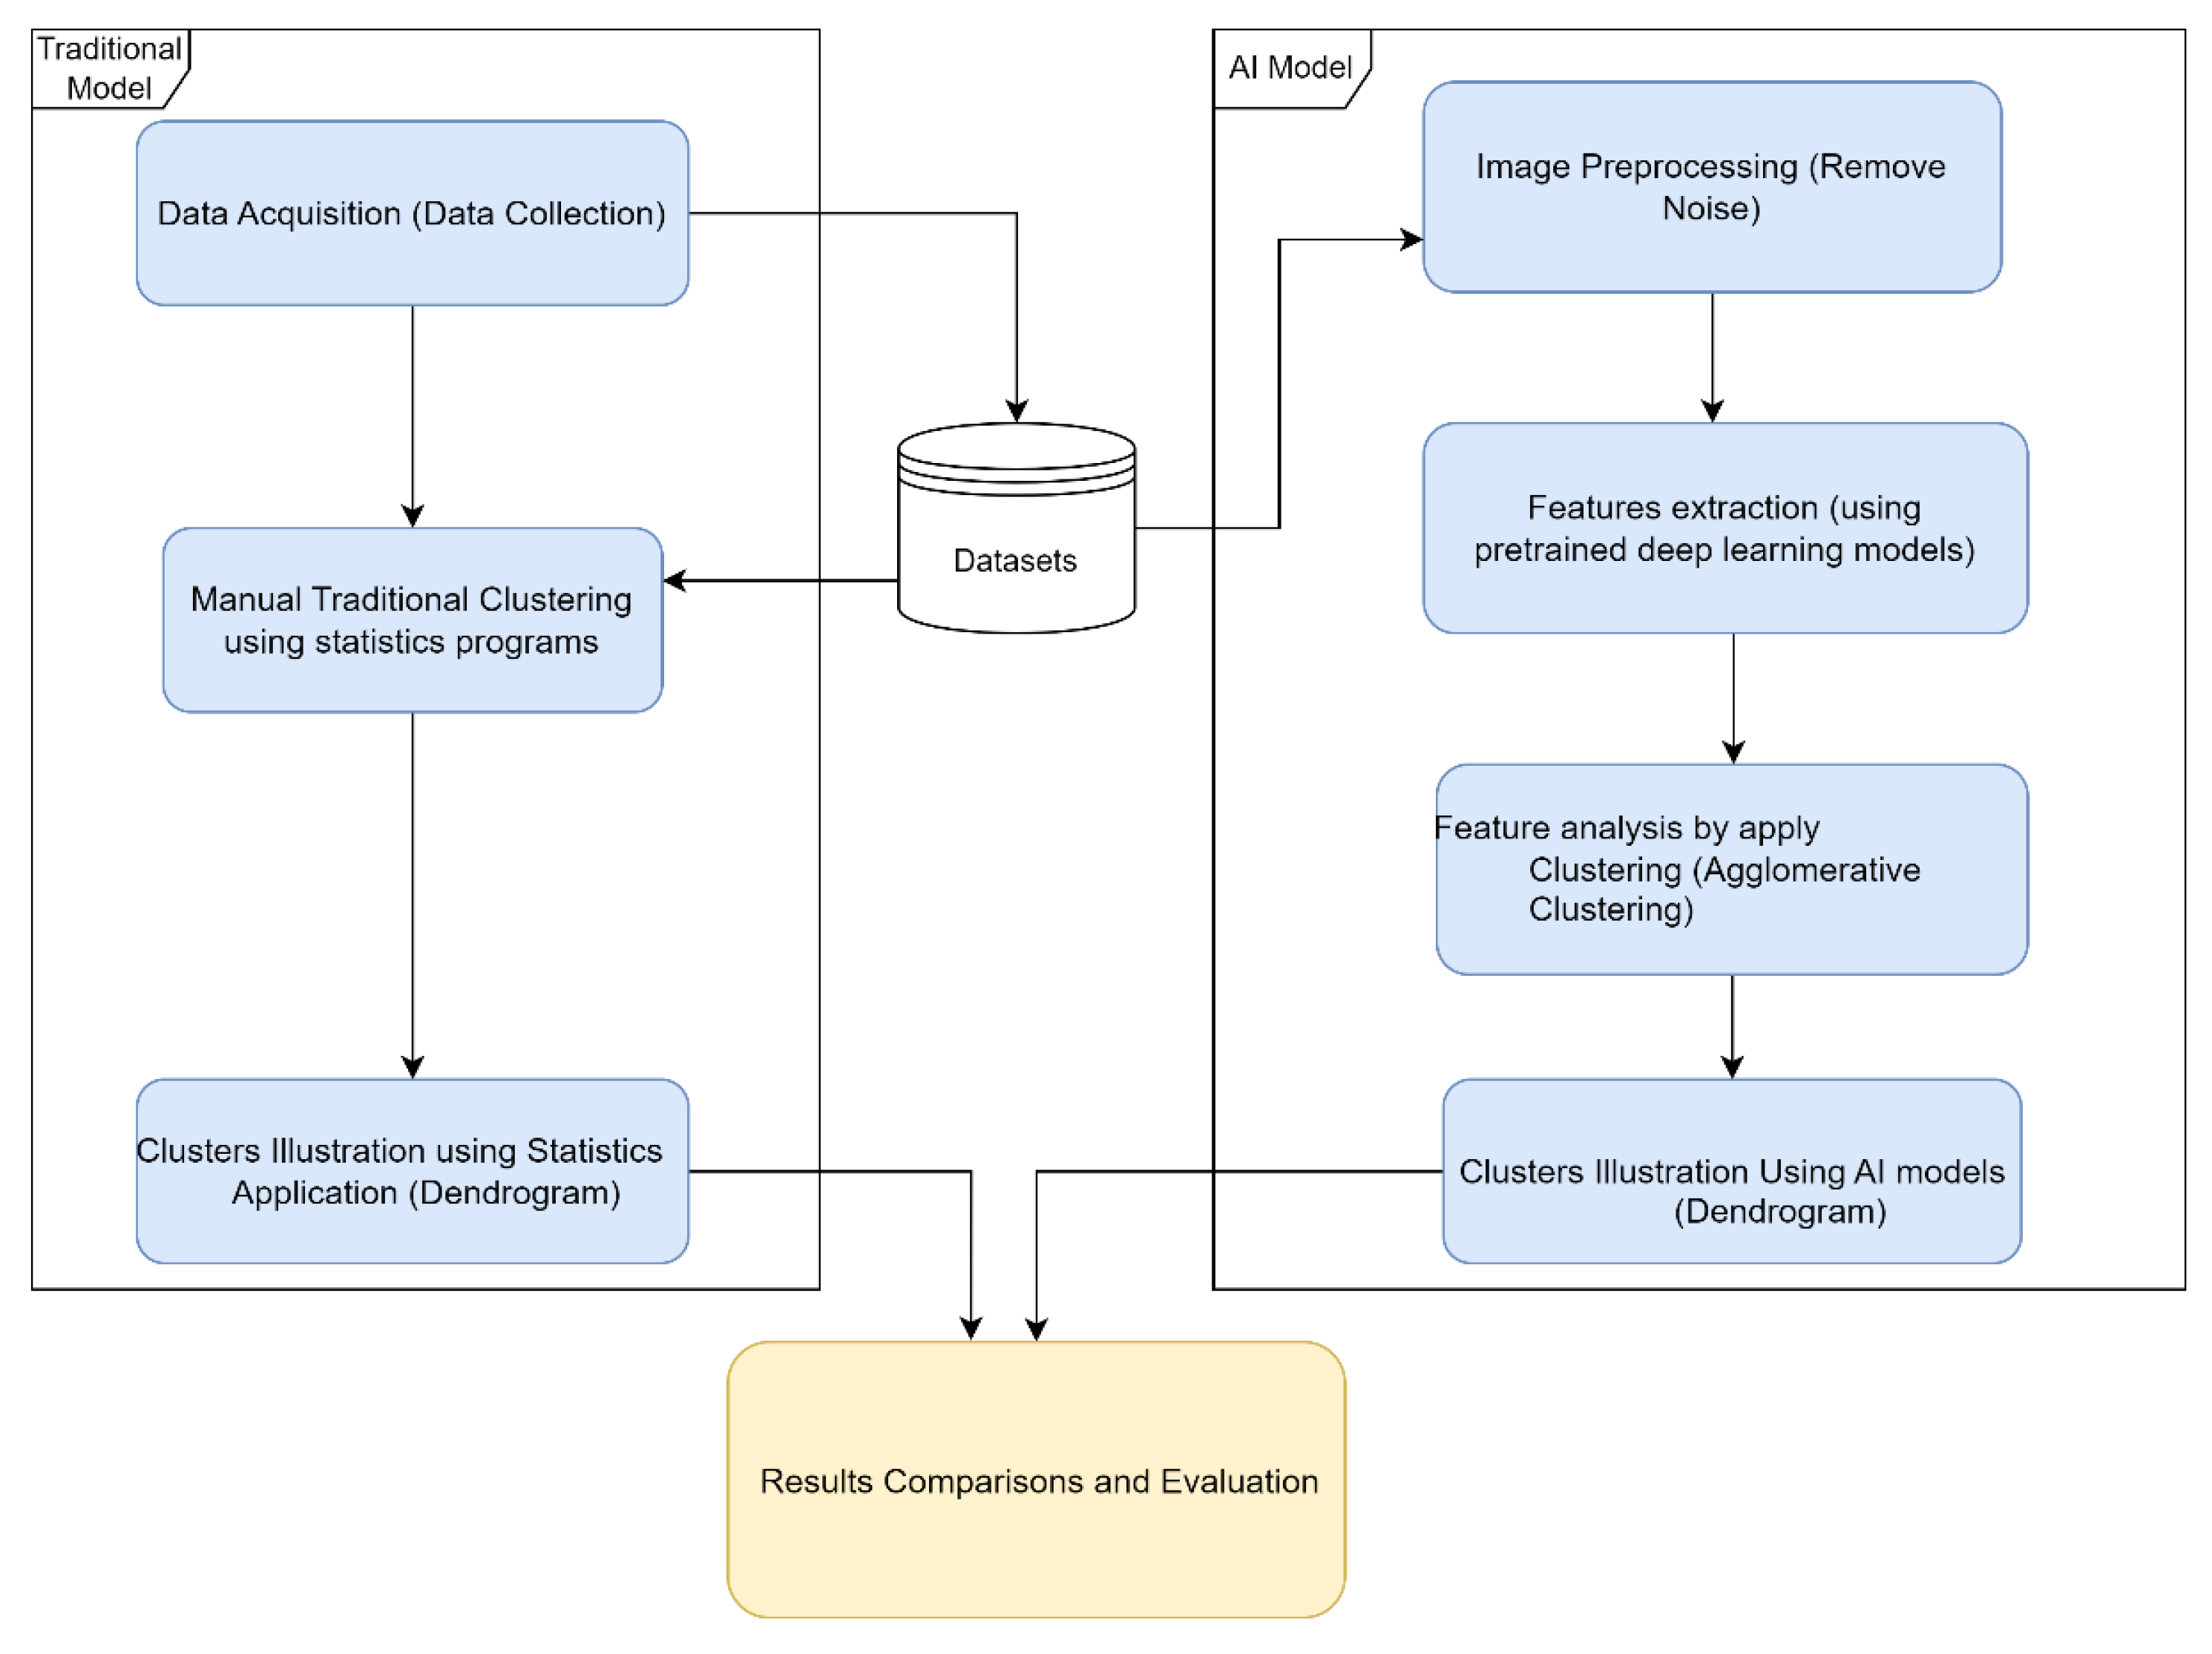
3. Proposed Transfer Learning Approach
- Common Processes:
- a.
- Data acquisition.
- Traditional Statistical Processes:
- a.
- Feature extraction;
- b.
- Clustering method.
- Deep Learning:
- a.
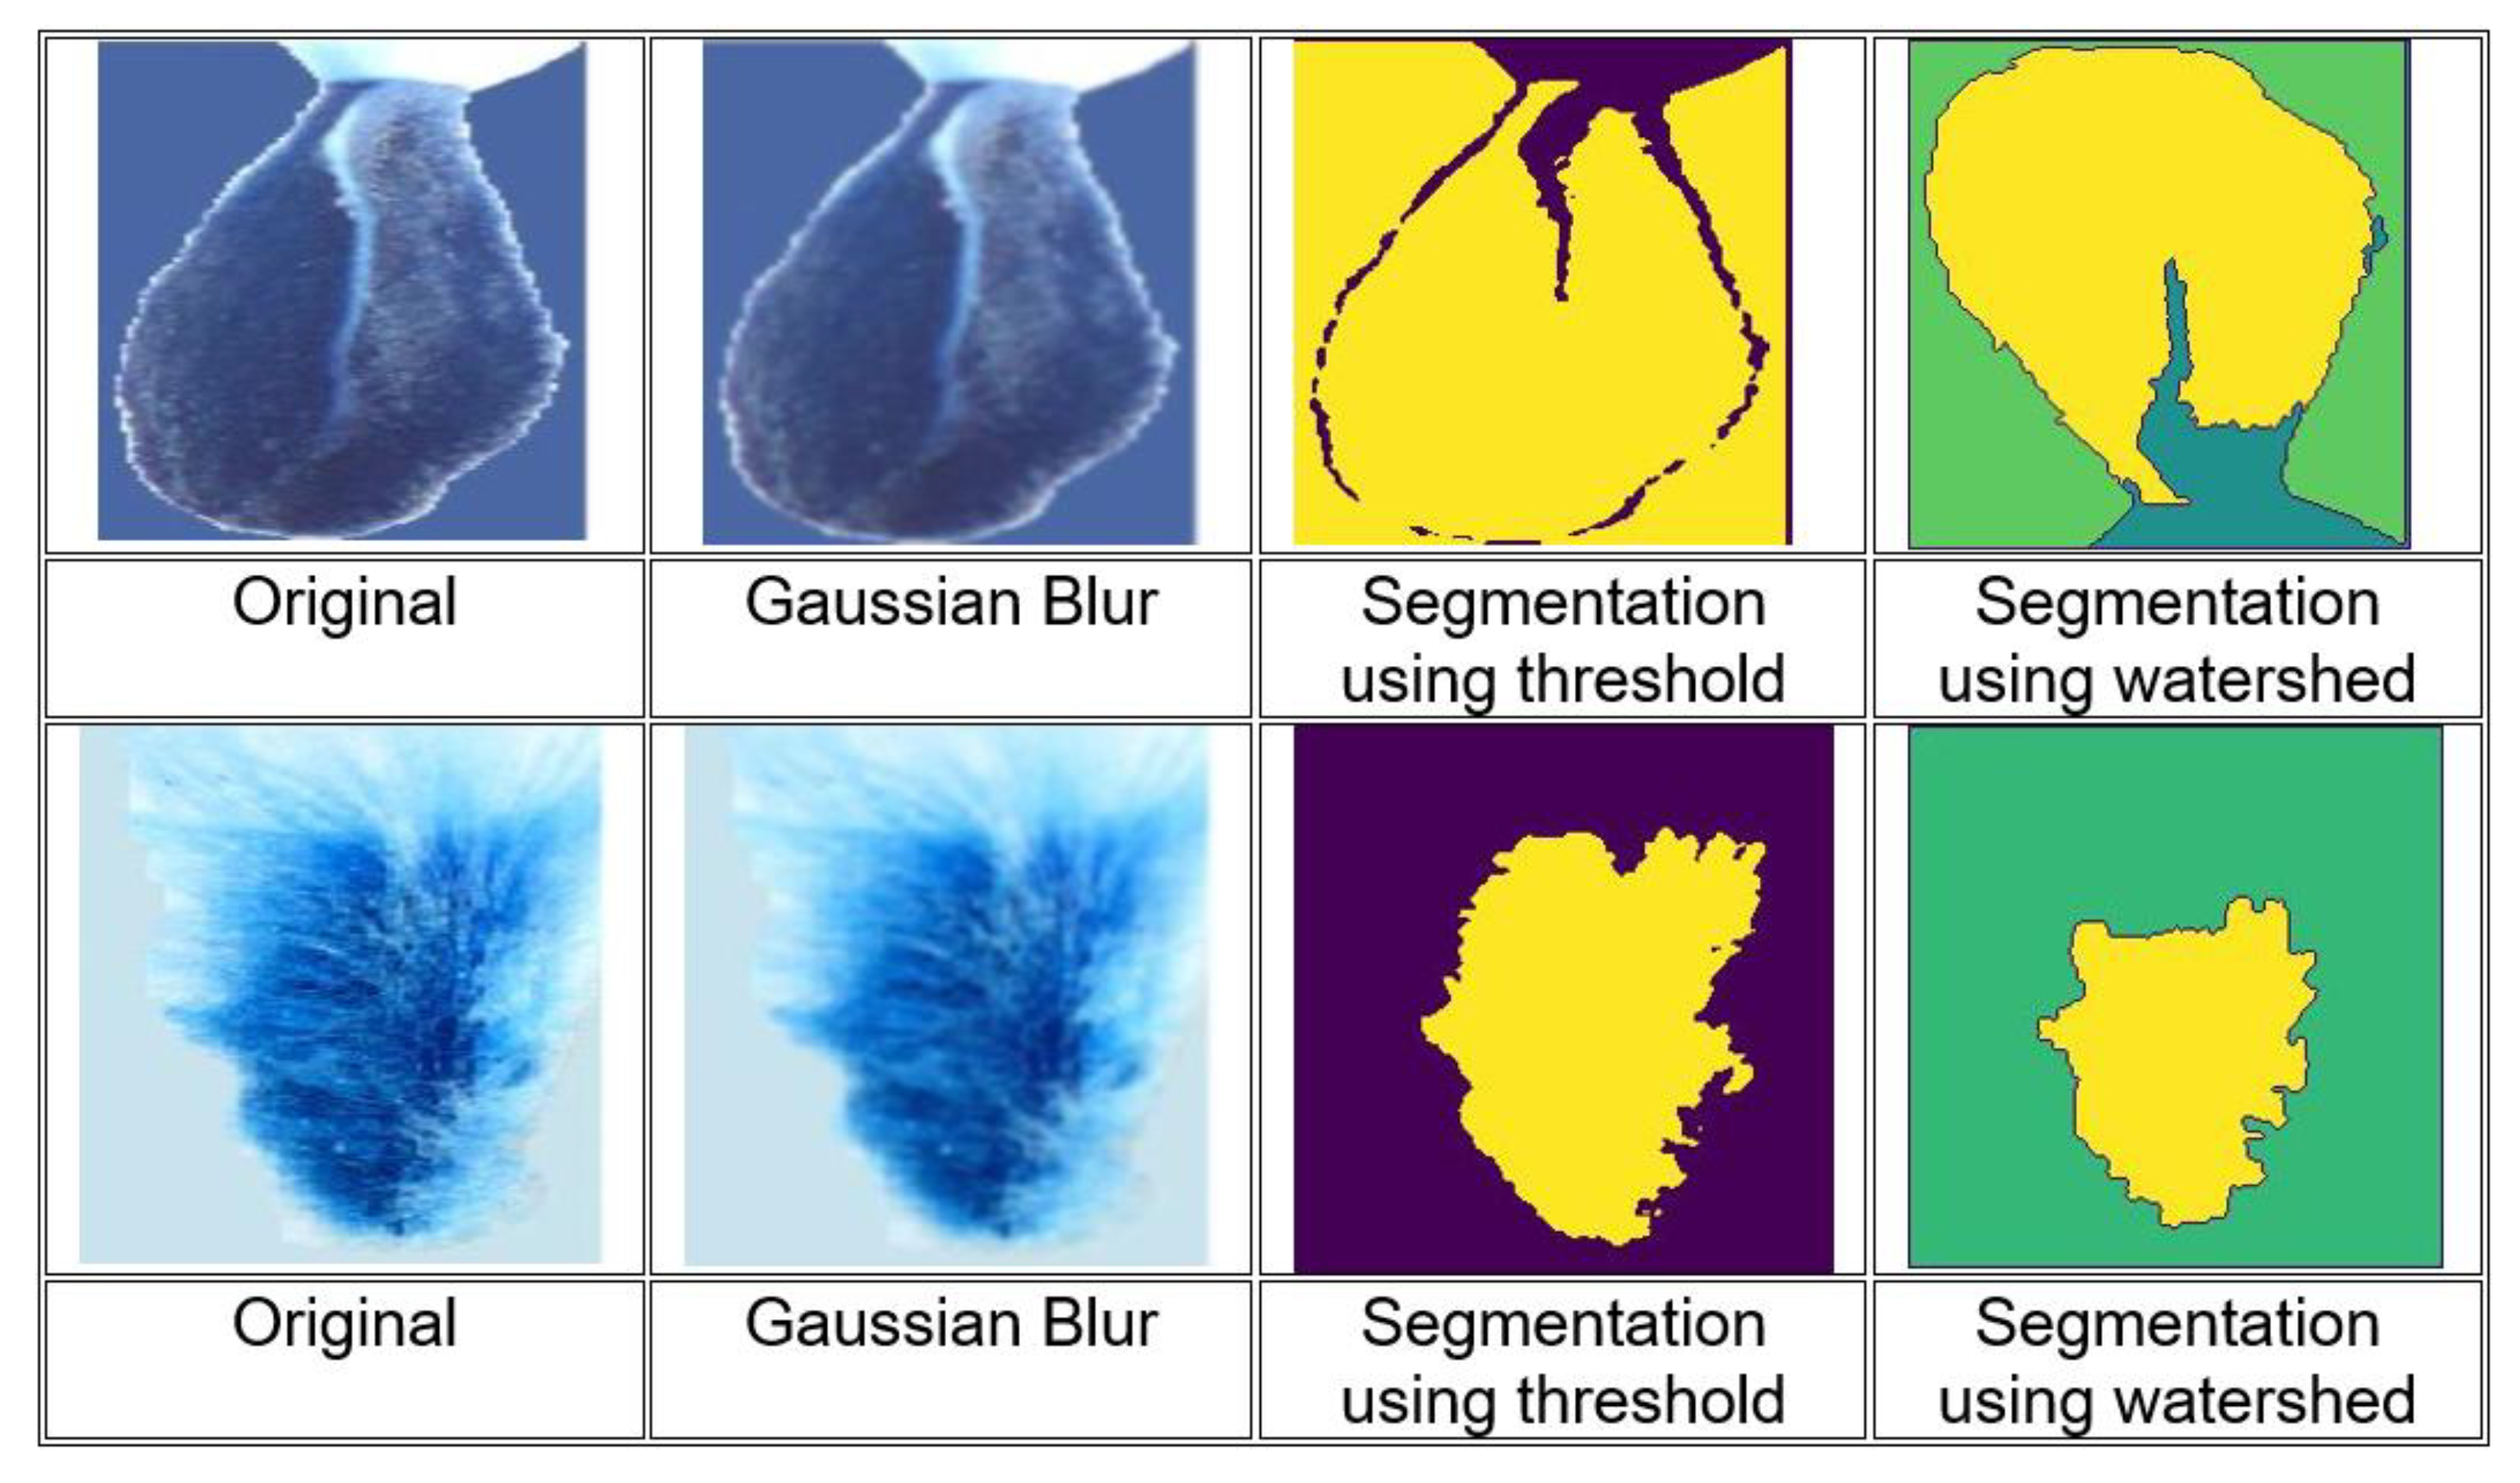
- Image preprocessing;
- b.
- Feature extraction;
- c.
- Deep learning clustering.
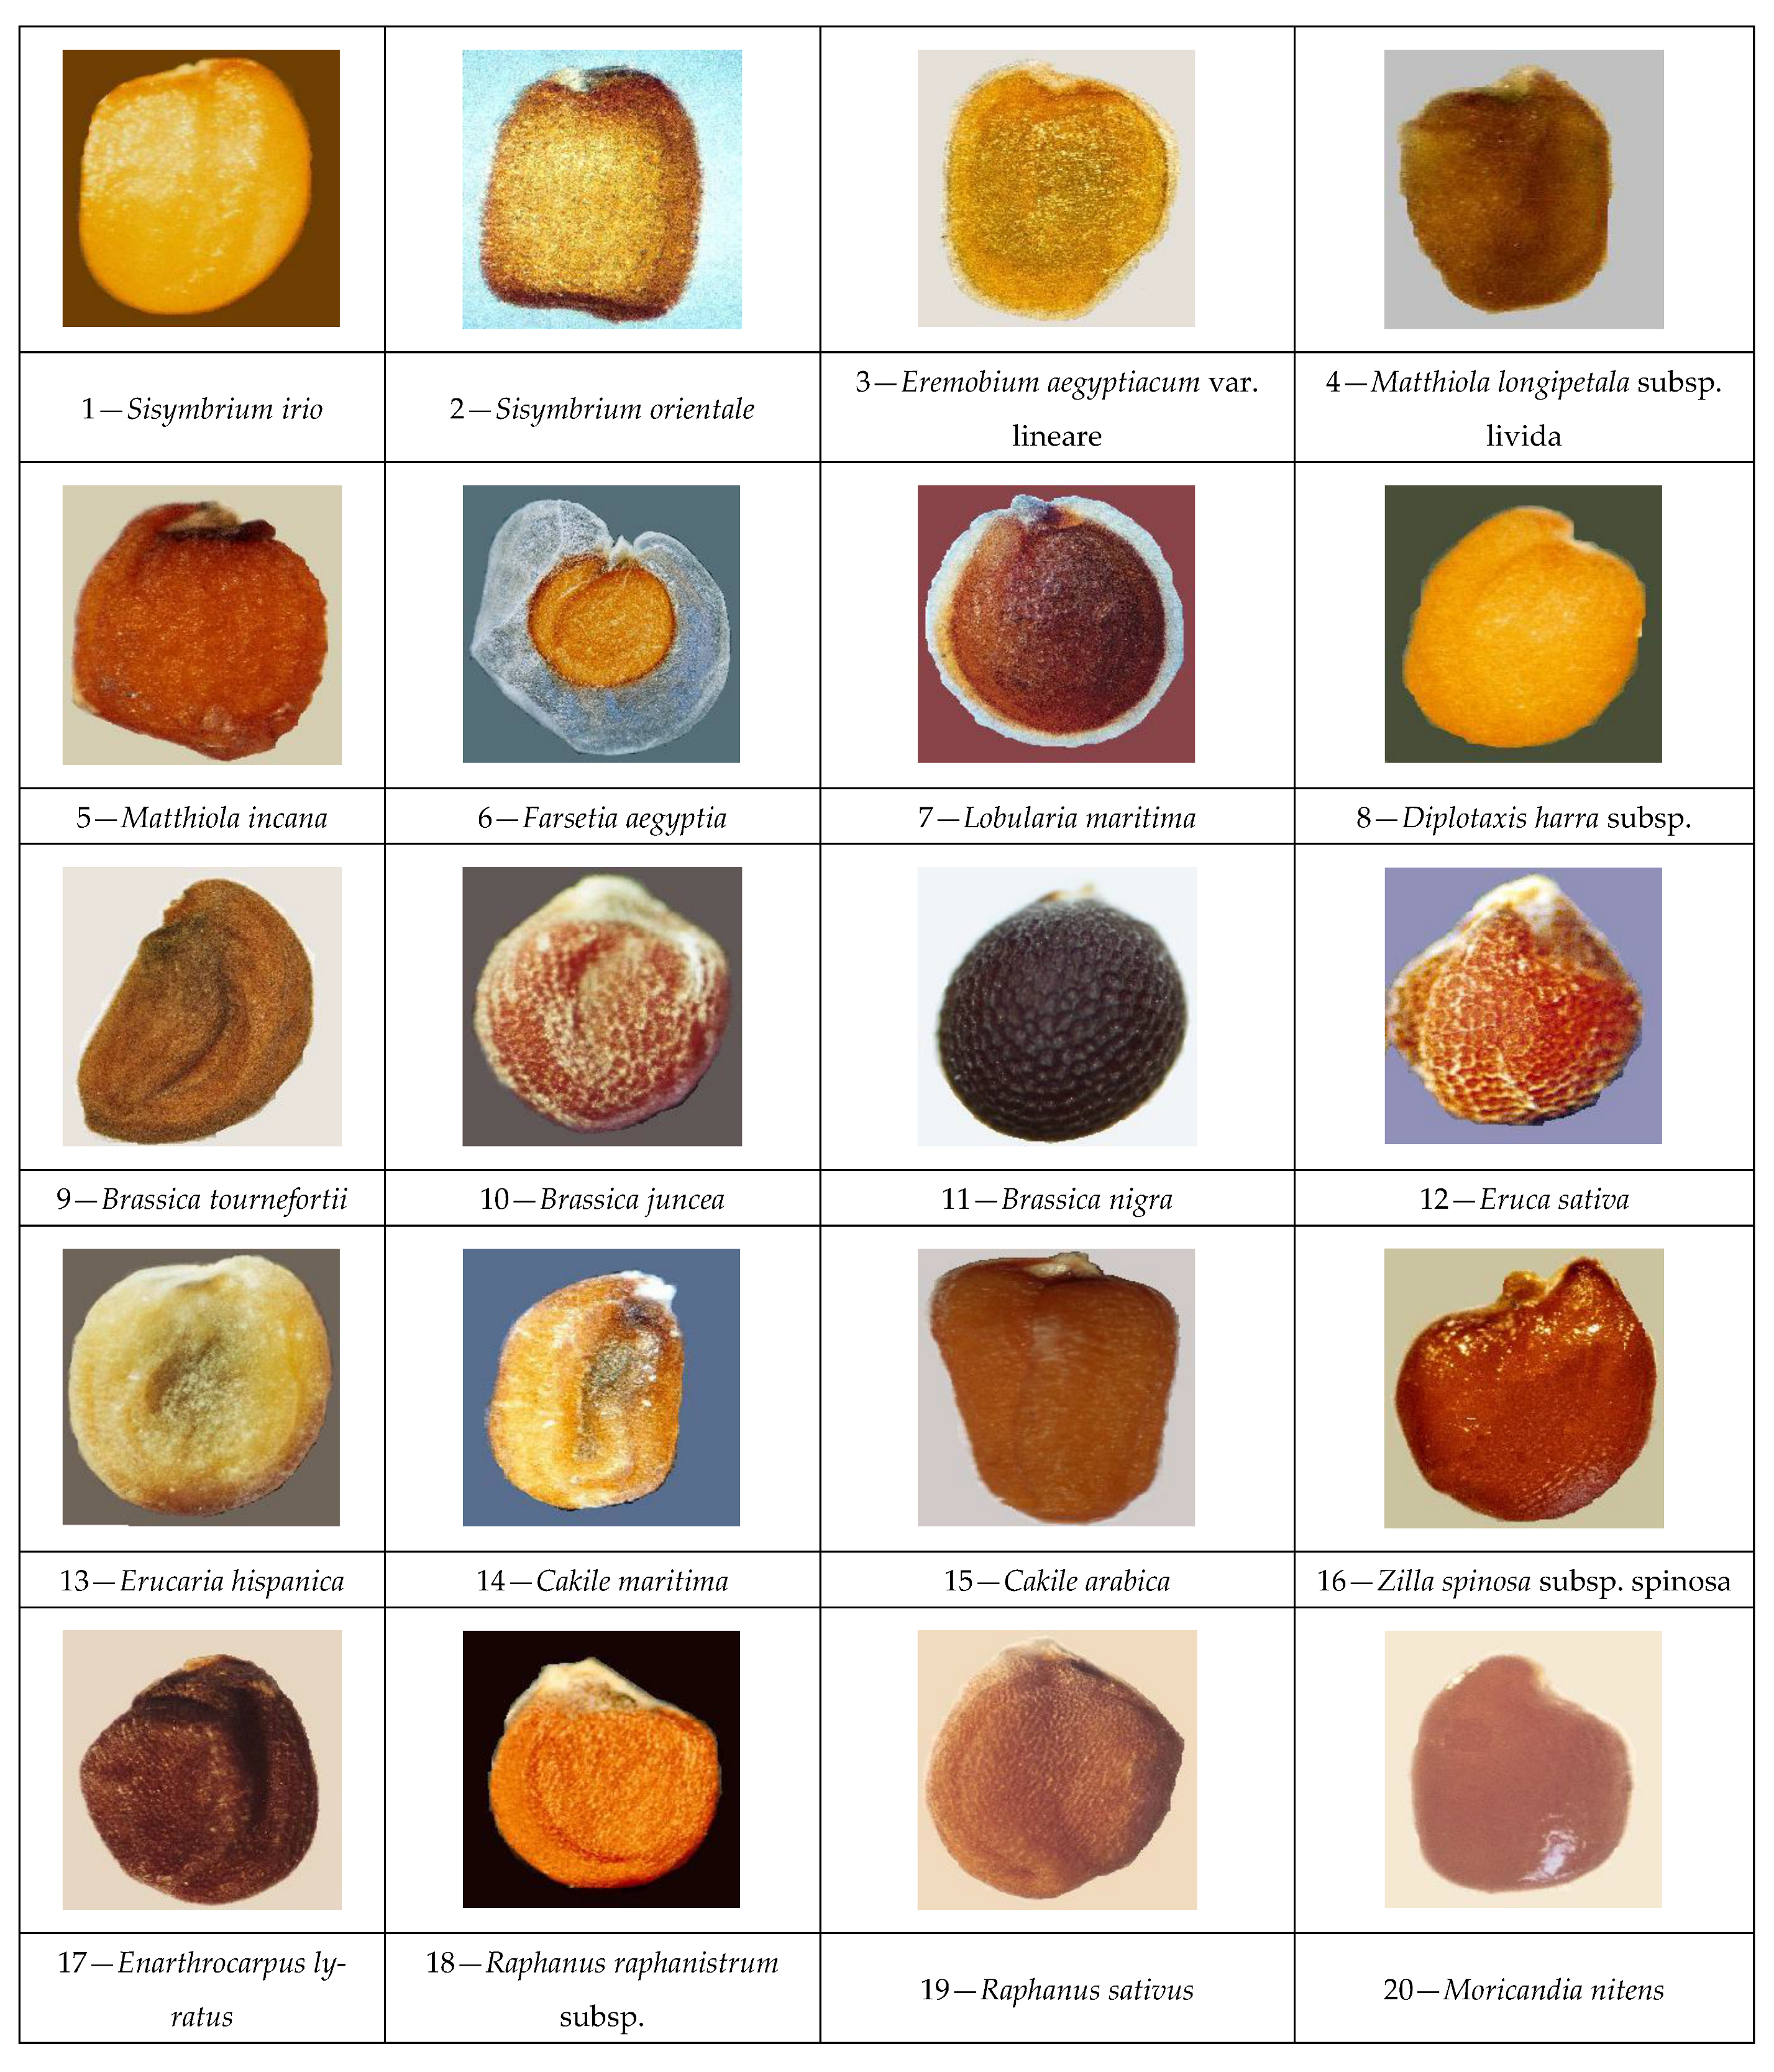
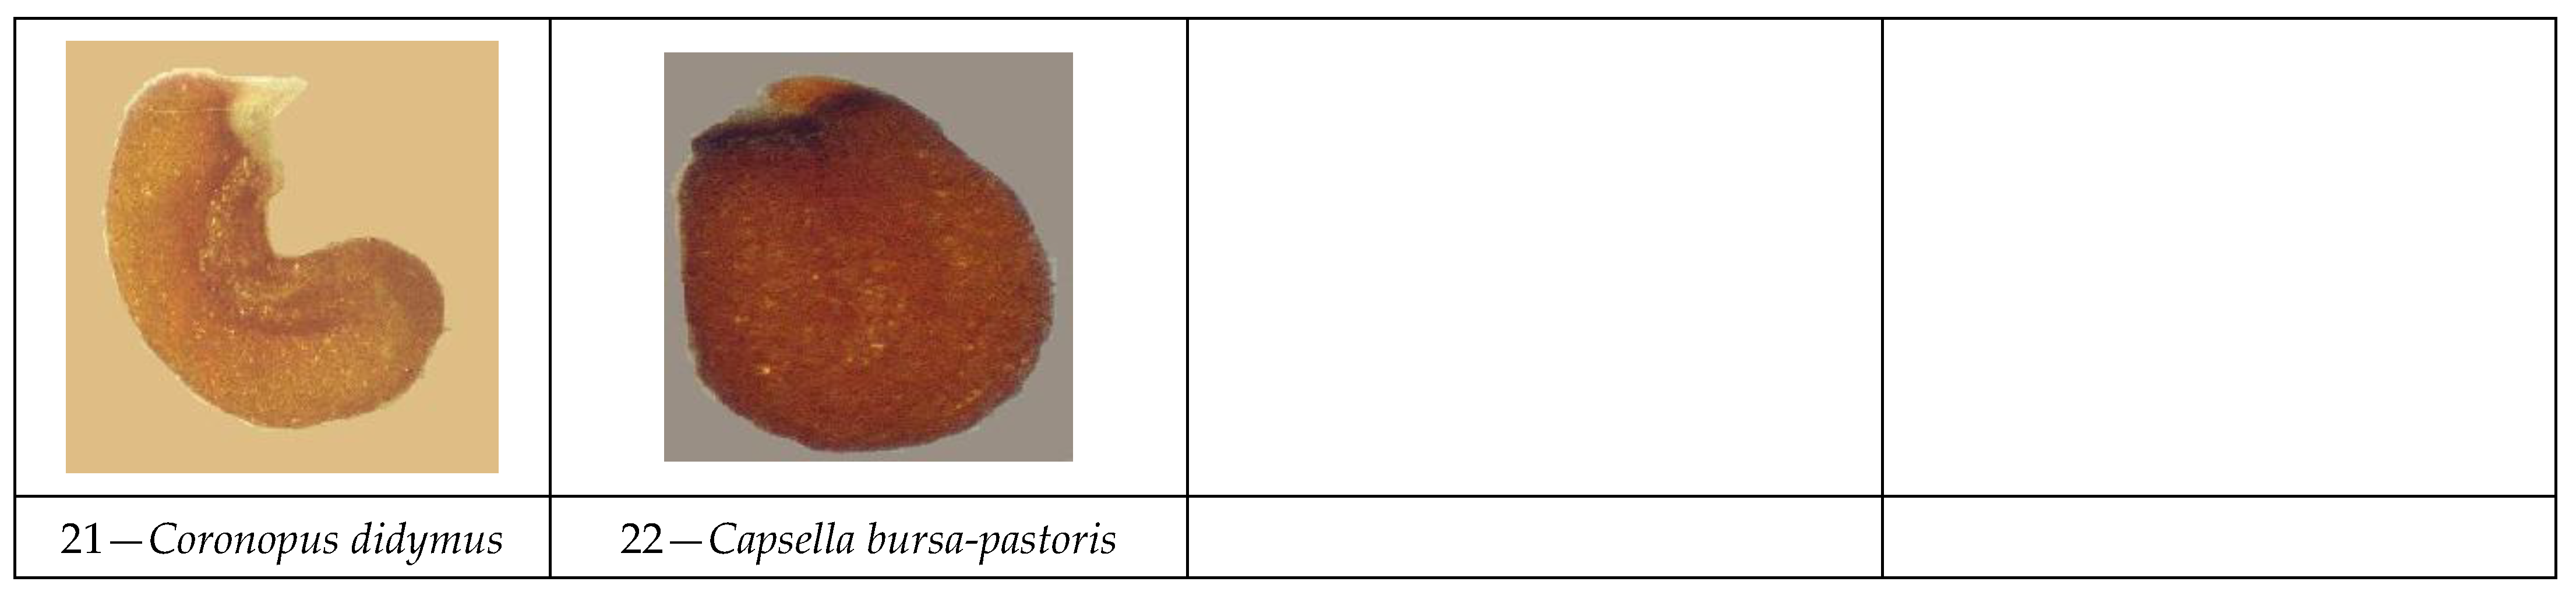
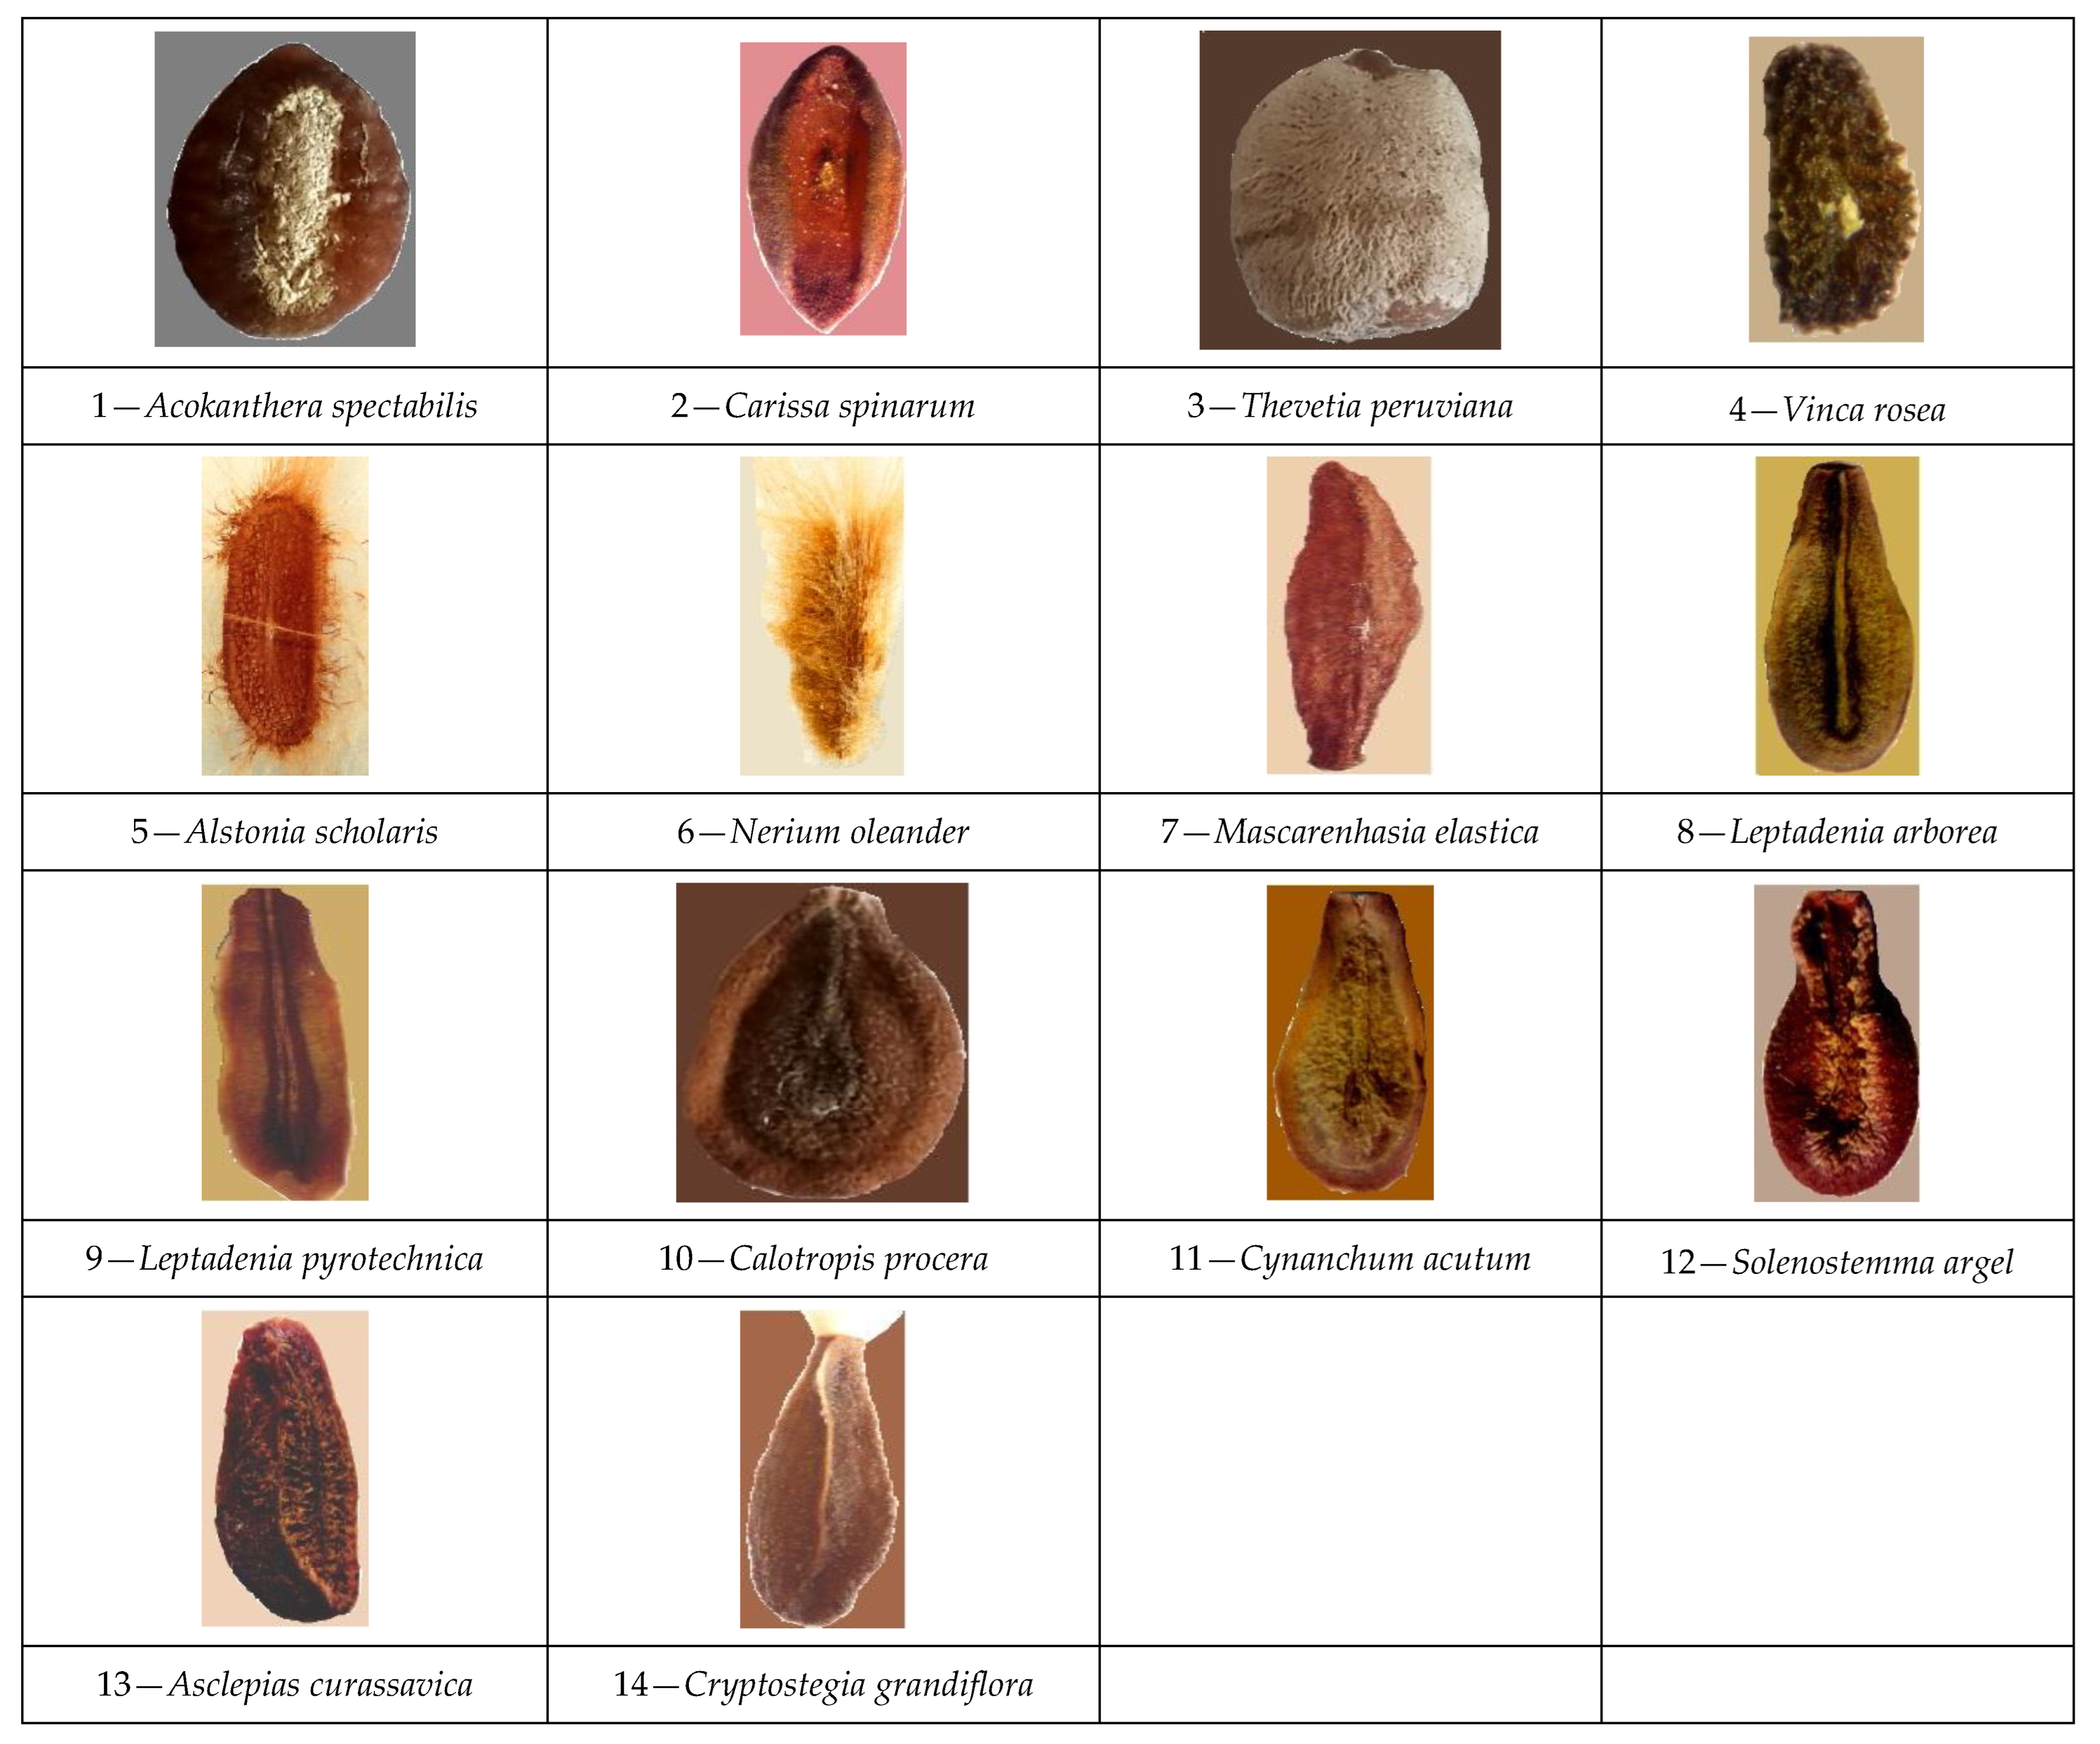
3.1. Data Acquisition
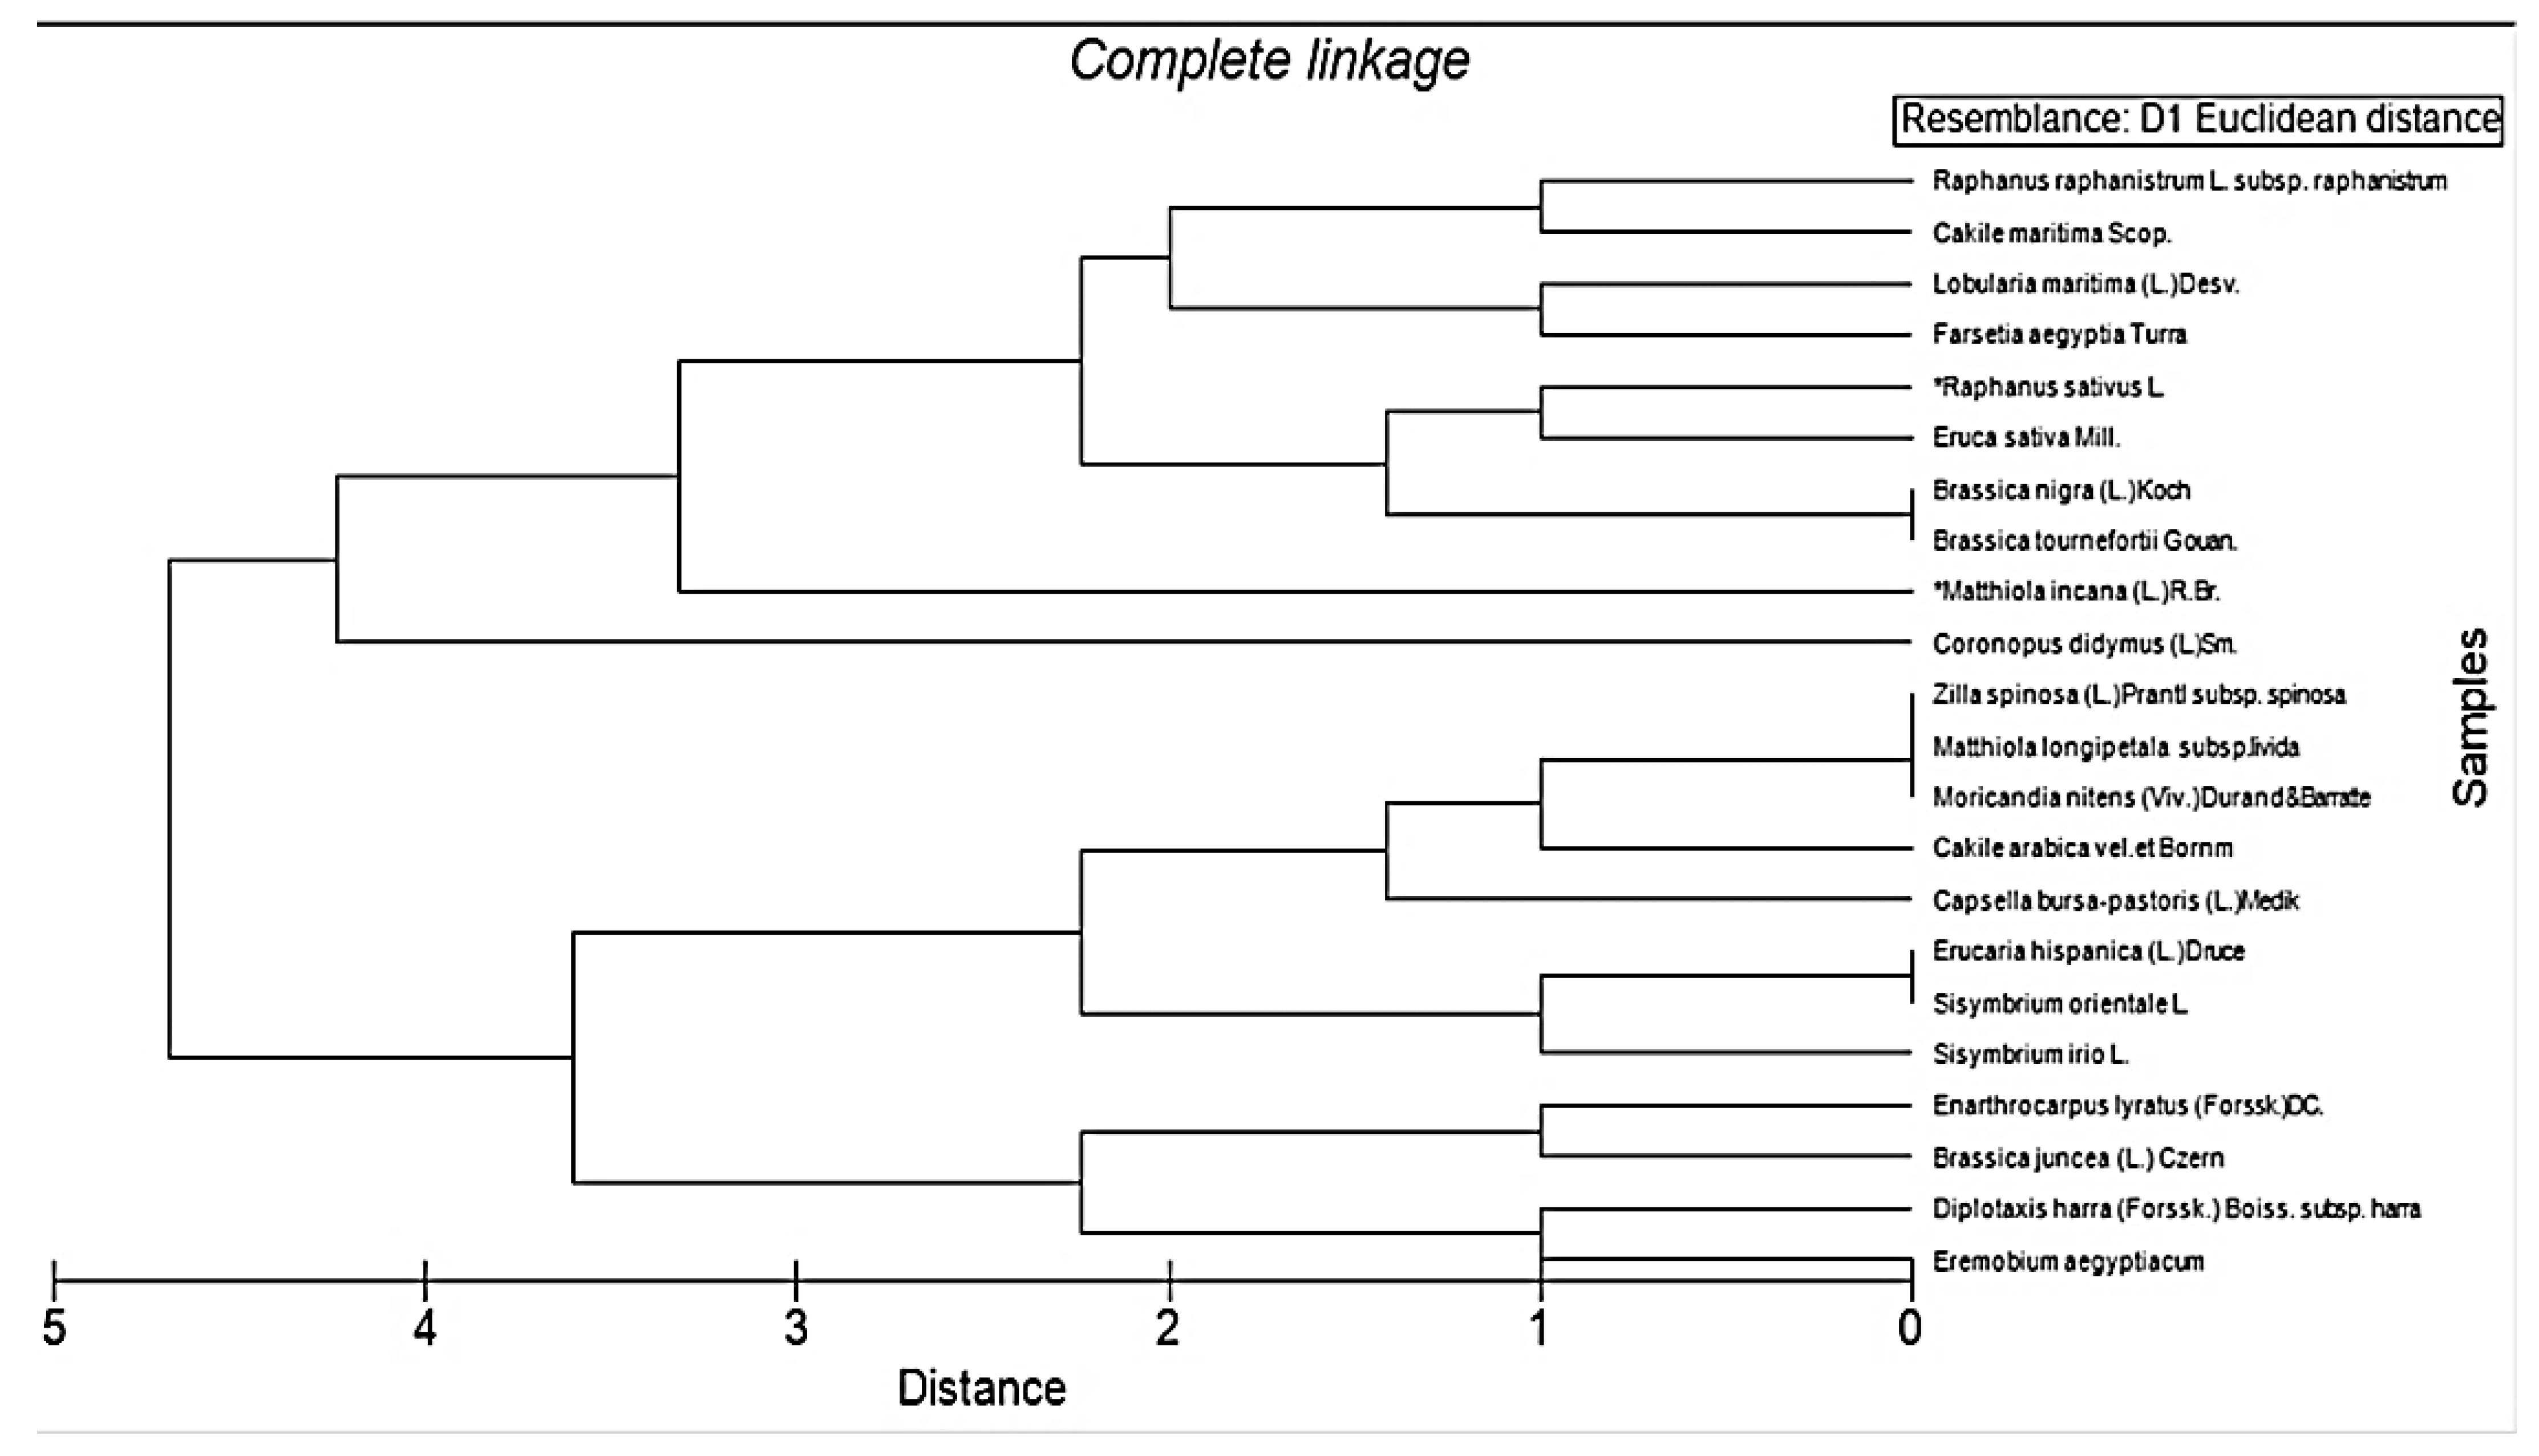
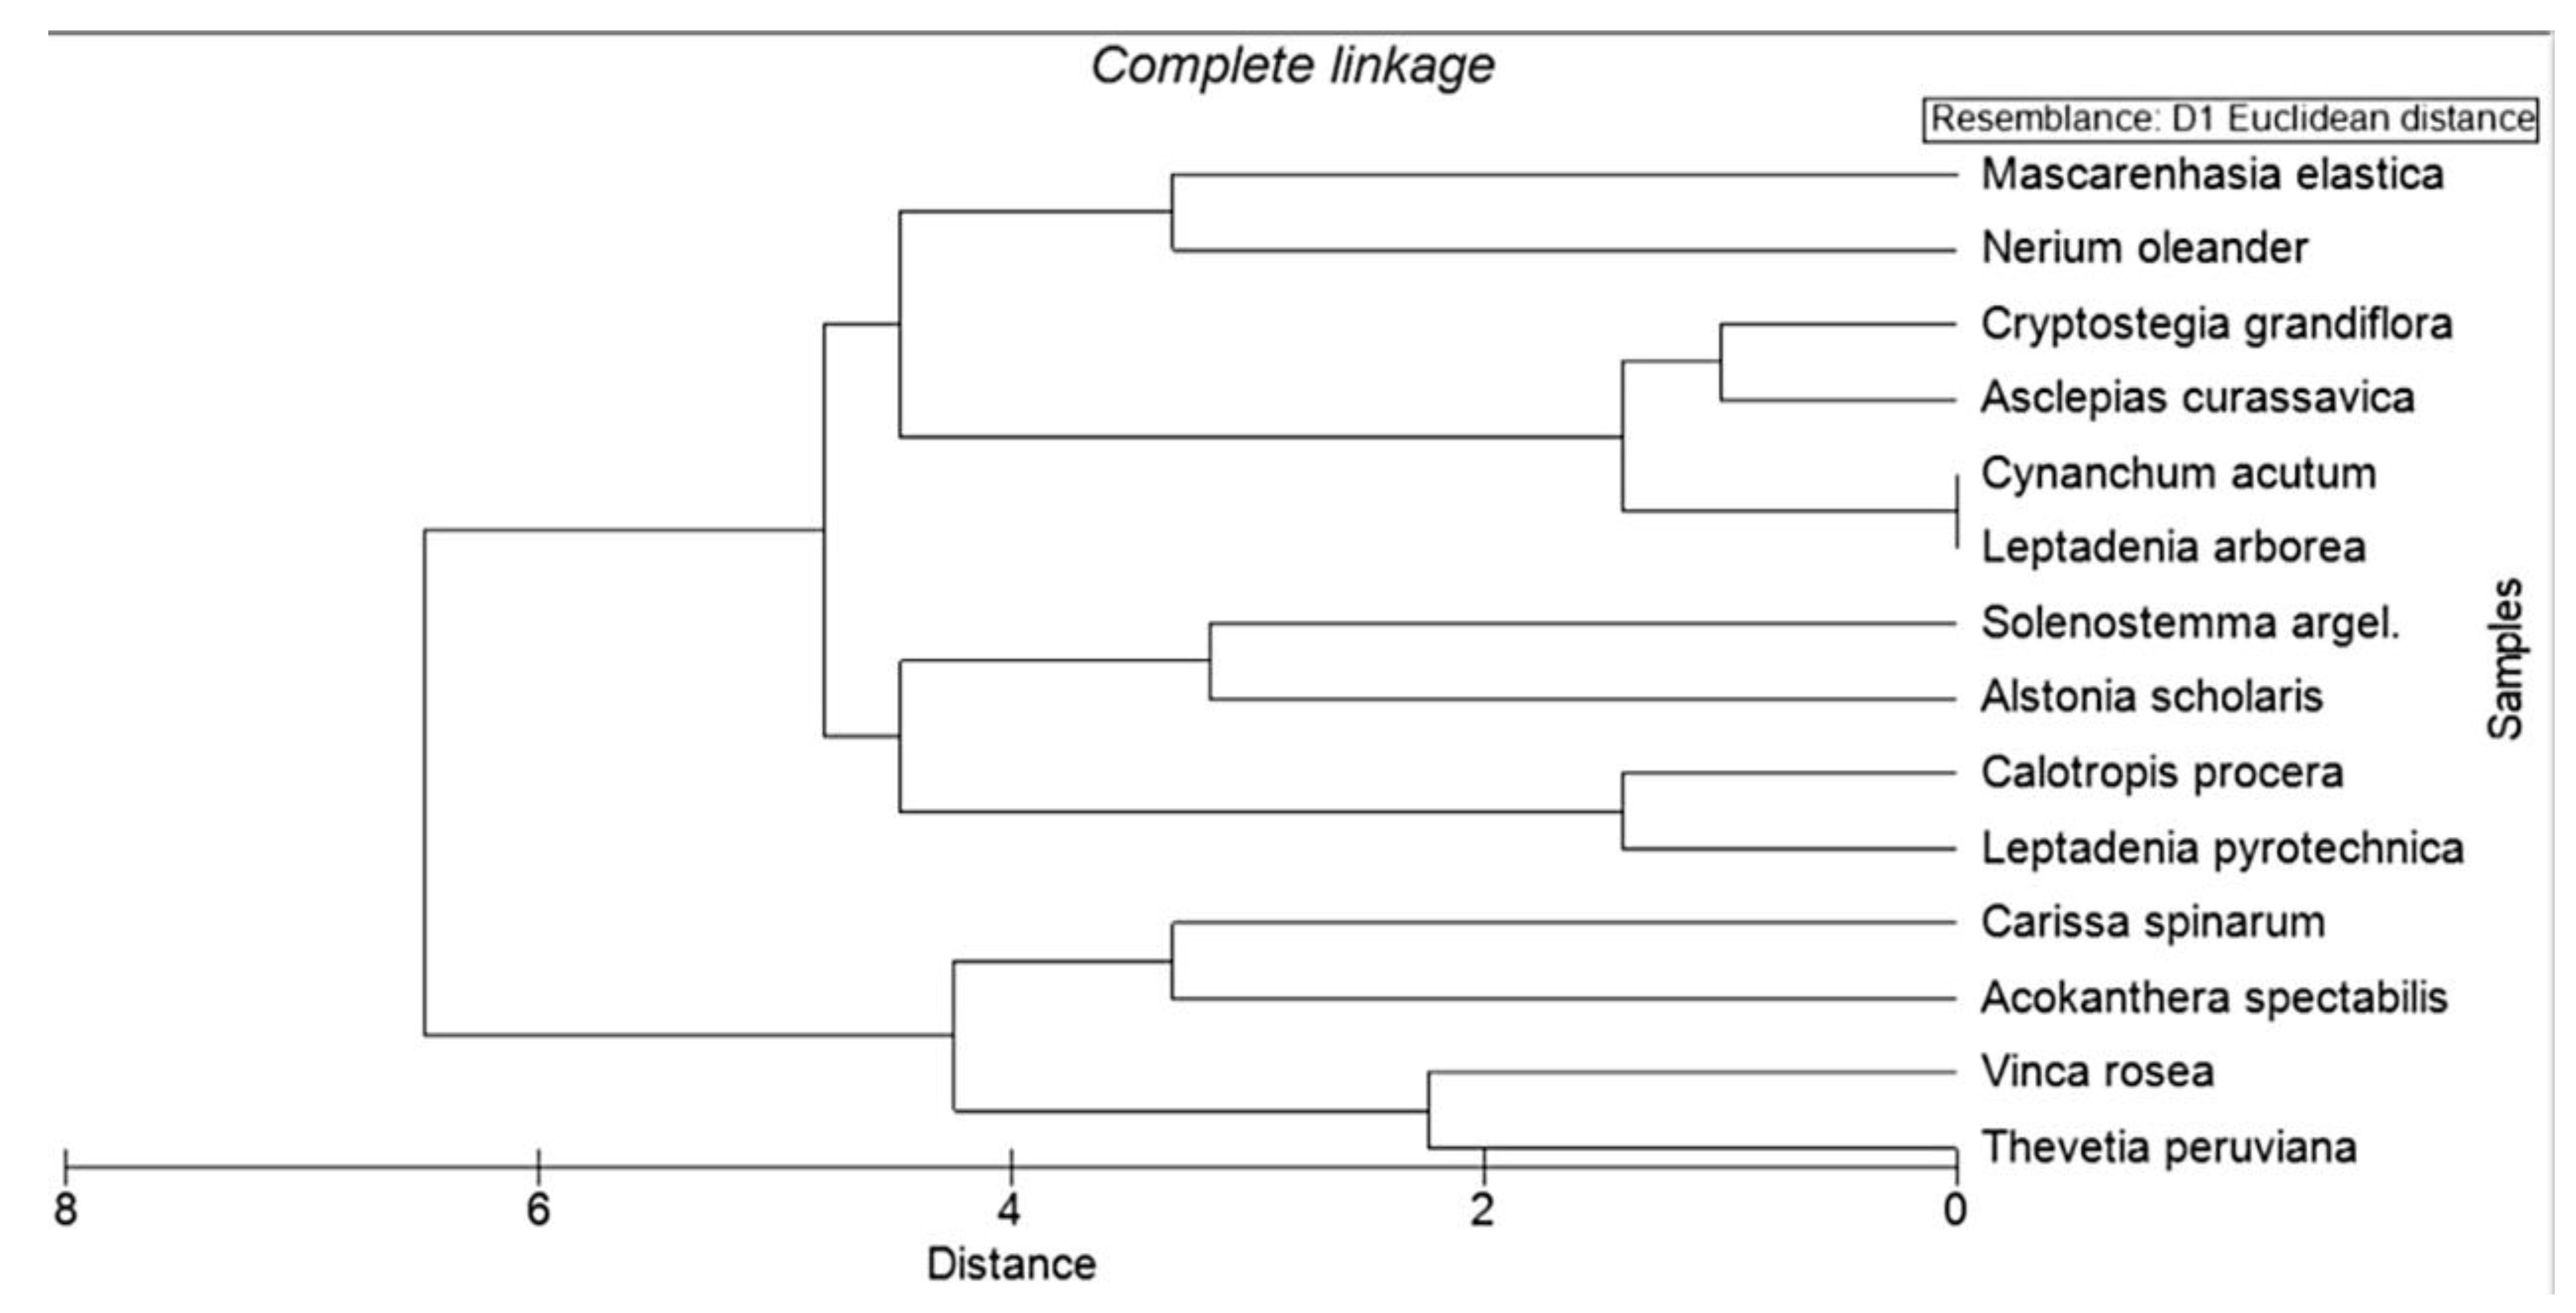
3.2. Traditional Statistical Clustering Approach
3.3. Clustering Using Statistical Applications
3.4. Deep Learning Model
3.4.1. Image Preprocessing
3.4.2. Feature Extraction
- Time Complexity:
- Space complexity:
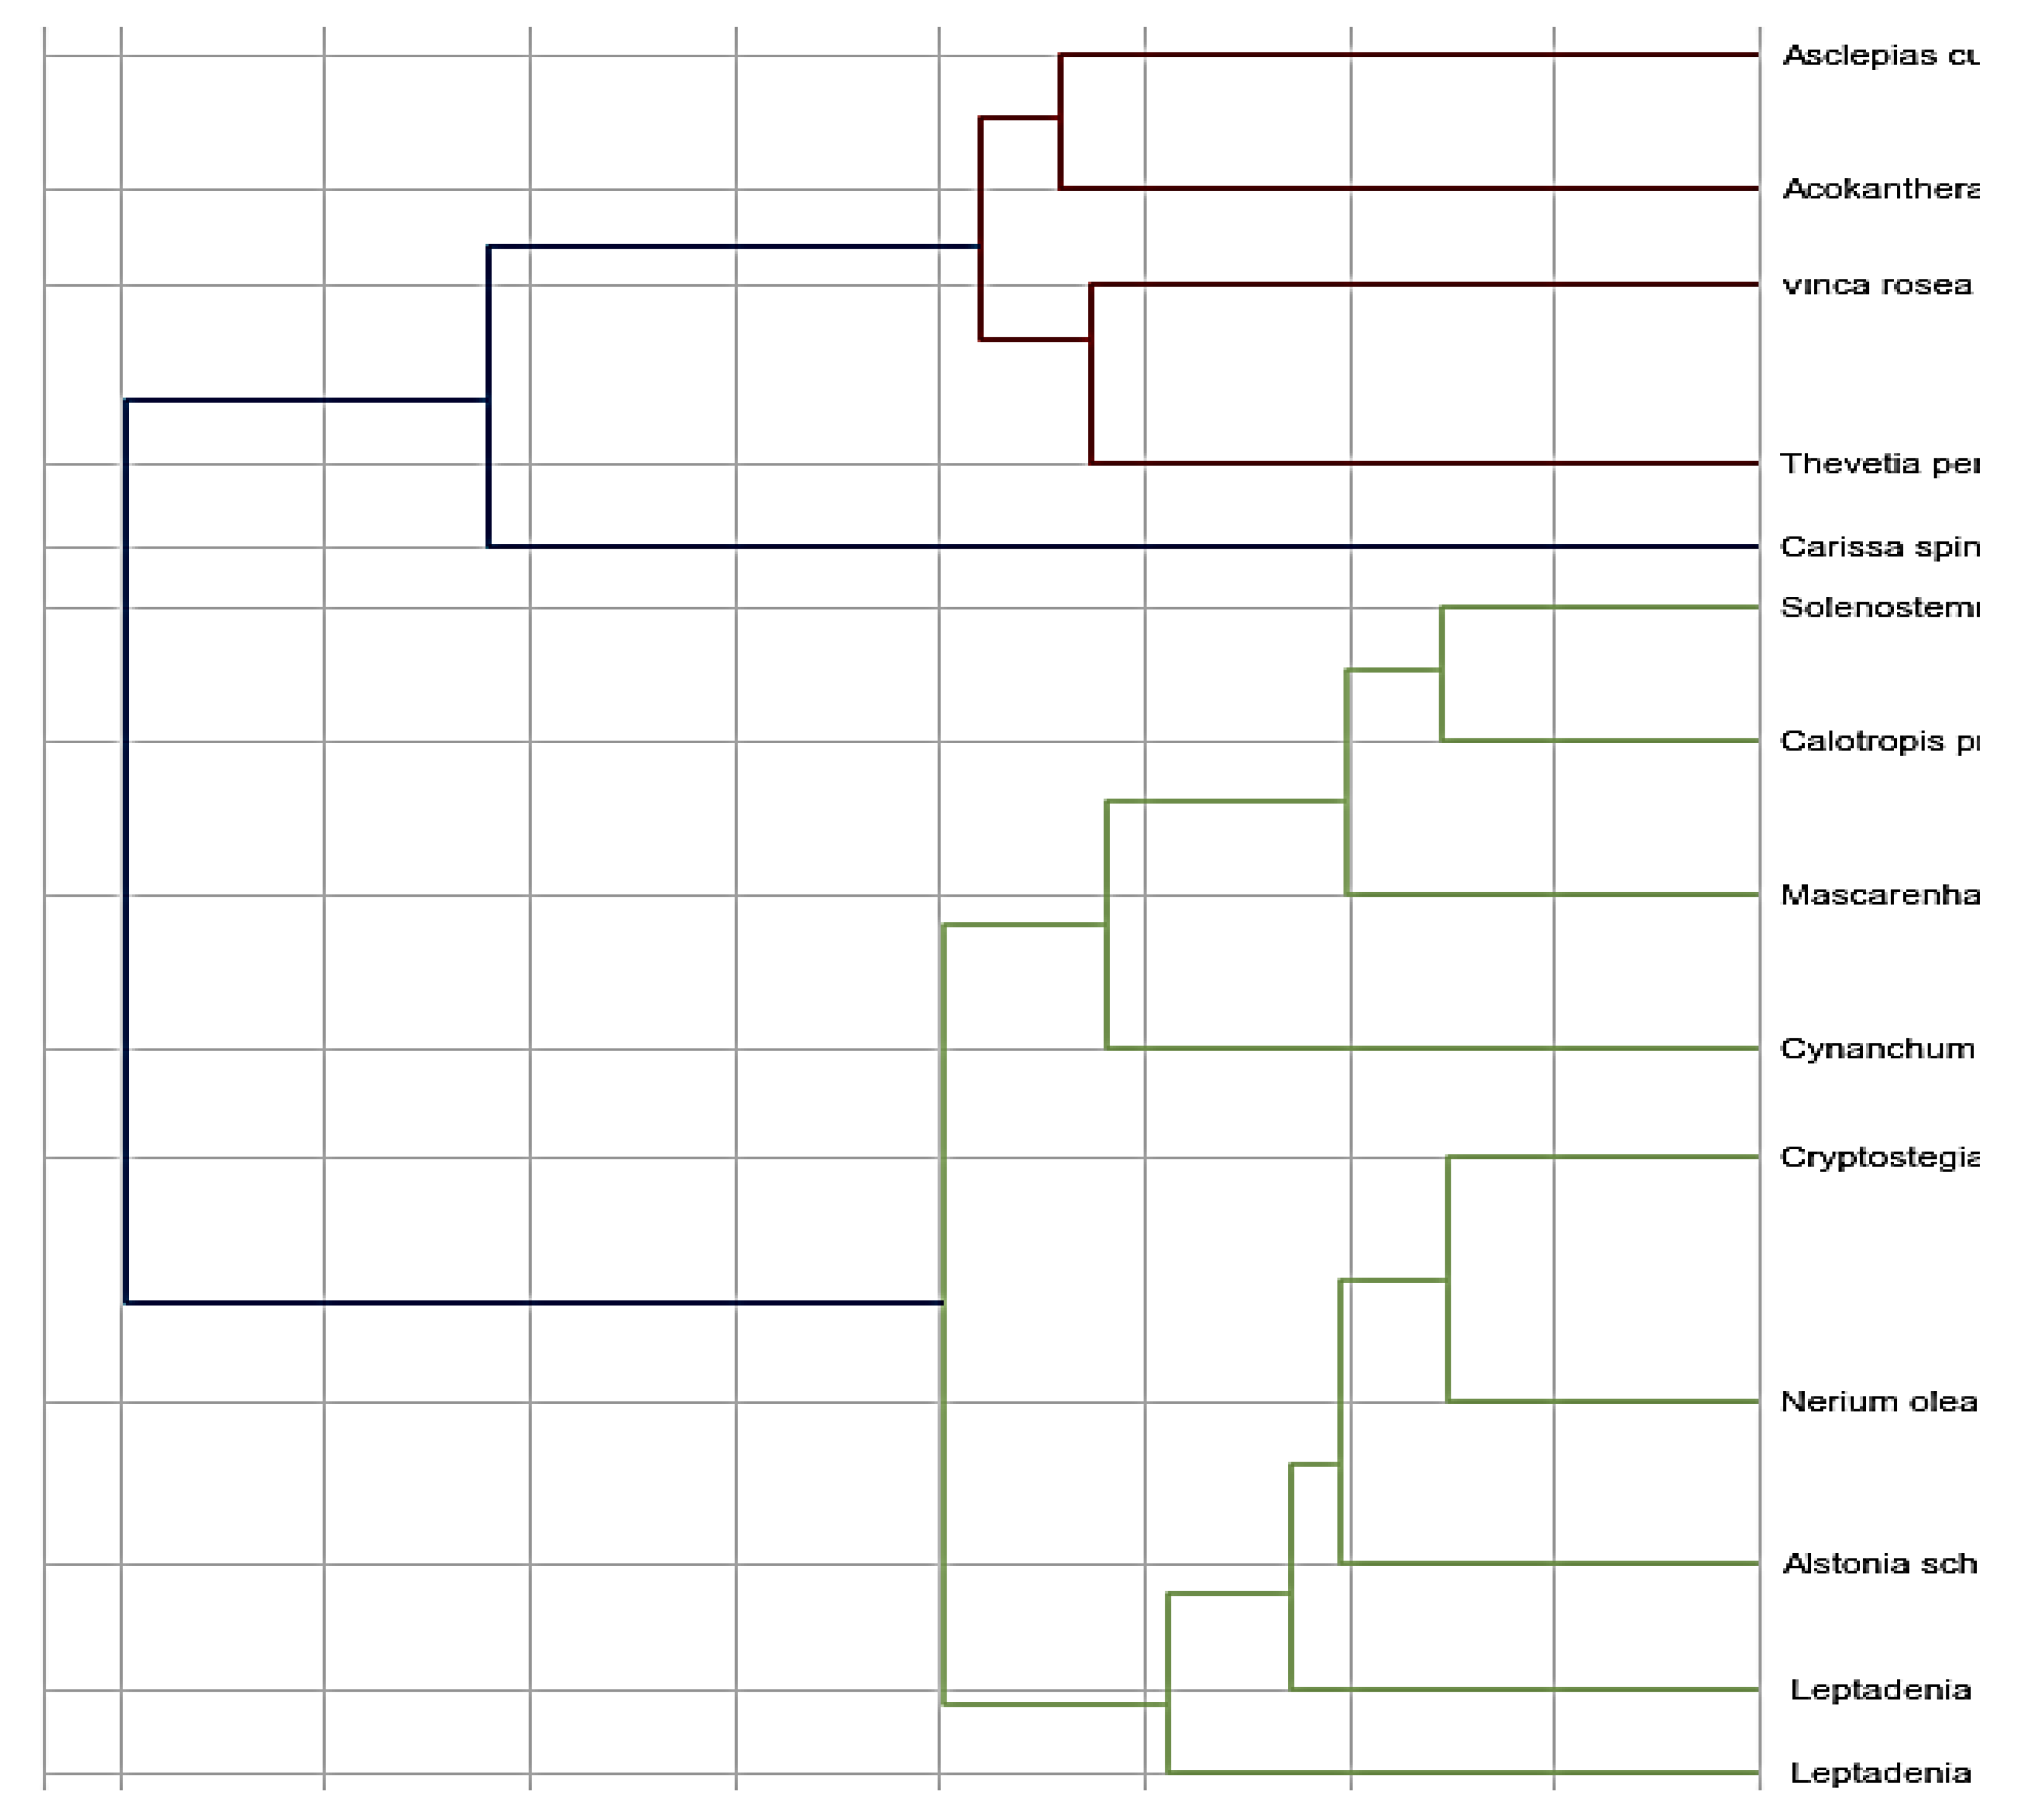
3.4.3. Deep Learning Clustering
- Time Complexity:
- Space complexity:
4. Results and Discussion
Evaluation Metrics
- Accuracy: The result of dividing the number of true classified outcomes by the whole of classified instances. The accuracy is computed by the equation:
- Recall: The percentage of positive tweets that are properly determined by the model in the dataset. The recall calculated by:
- Precision: The proportion of true positive tweets among all forecasted positive tweets. The equation of precision measure calculated by:
- F-score: A harmonic mean of precision and recall. The F-score measure equation is:
5. Conclusions
Author Contributions
Funding
Data Availability Statement
Acknowledgments
Conflicts of Interest
References
- Takamitsu, Y.; Orita, Y. Effect of glomerular change on the electrolyte reabsorption of the renal tubule in glomerulonephritis (author’s transl). Jpn. J. Nephrol. 1978, 20, 1221–1227. [Google Scholar]
- Wani, J.A.; Sharma, S.; Muzamil, M.; Ahmed, S.; Sharma, S.; Singh, S. Machine Learning and Deep Learning Based Computational Techniques in Automatic Agricultural Diseases Detection: Methodologies, Applications, and Challenges; Springer: Dordrecht, The Netherlands, 2021; Volume 29. [Google Scholar]
- Krizhevsky, A.; Sutskever, I.; Hinton, G. ImageNet Classification with Deep Convolutional Neural Networks. Commun. ACM 2017, 60, 84–90. [Google Scholar] [CrossRef] [Green Version]
- Simonyan, K.; Zisserman, A. Very deep convolutional networks for large-scale image recognition. In Proceedings of the 3rd International Conference on Learning Representations, ICLR 2015, San Diego, CA, USA, 7–9 May 2015; pp. 1–14. [Google Scholar]
- He, K.; Zhang, X.; Ren, S.; Sun, J. Deep Residual Learning for Image Recognition. In Proceedings of the 2016 IEEE Conference on Computer Vision and Pattern Recognition (CVPR), Las Vegas, NV, USA, 27–30 June 2016; pp. 770–778. [Google Scholar] [CrossRef] [Green Version]
- Huang, G.; Liu, Z.; Van Der Maaten, L.; Weinberger, K.Q. Densely Connected Convolutional Networks. In Proceedings of the 2017 IEEE Conference on Computer Vision and Pattern Recognition (CVPR), Honolulu, HI, USA, 21–26 July 2017; pp. 2261–2269. [Google Scholar] [CrossRef] [Green Version]
- Howard, A.G.; Zhu, M.; Chen, B.; Kalenichenko, D.; Wang, W.; Weyand, T.; Andreetto, M.; Adam, H. MobileNets: Efficient Convolutional Neural Networks for Mobile Vision Applications. arXiv 2017, arXiv:1704.04861. [Google Scholar]
- Lee, J.W.; Yoon, Y.C. Fine-Grained Plant Identification using wide and deep learning model 1. In Proceedings of the 2019 International Conference on Platform Technology and Service (PlatCon), Jeju, Republic of Korea, 28–30 January 2019; pp. 1–5. [Google Scholar] [CrossRef]
- Lee, S.H.; Chan, C.S.; Wilkin, P.; Remagnino, P. Deep-plant: Plant identification with convolutional neural networks. In Proceedings of the 2015 IEEE International Conference on Image Processing (ICIP), Quebec City, QC, Canada, 27–30 September 2015; pp. 452–456. [Google Scholar] [CrossRef] [Green Version]
- Gyires-Tóth, B.P.; Osváth, M.; Papp, D.; Szucs, G. Deep learning for plant classification and content-based image retrieval. Cybern. Inf. Technol. 2019, 19, 88–100. [Google Scholar] [CrossRef] [Green Version]
- Dileep, M.R.; Pournami, P.N. AyurLeaf: A Deep Learning Approach for Classification of Medicinal Plants. In Proceedings of the TENCON 2019—2019 IEEE Region 10 Conference (TENCON), Kochi, India, 17–20 October 2019; pp. 321–325. [Google Scholar] [CrossRef]
- Picon, A.; Alvarez-Gila, A.; Seitz, M.; Ortiz-Barredo, A.; Echazarra, J.; Johannes, A. Deep convolutional neural networks for mobile capture device-based crop disease classification in the wild. Comput. Electron. Agric. 2019, 161, 280–290. [Google Scholar] [CrossRef]
- Johannes, A.; Picon, A.; Alvarez-Gila, A.; Echazarra, J.; Rodriguez-Vaamonde, S.; Díez Navajas, A.; Ortiz-Barredo, A. Automatic plant disease diagnosis using mobile capture devices, applied on a wheat use case. Comput. Electron. Agric. 2017, 138, 200–209. [Google Scholar] [CrossRef]
- Tan, J.W.; Chang, S.W.; Abdul-Kareem, S.; Yap, H.J.; Yong, K.T. Deep Learning for Plant Species Classification Using Leaf Vein Morphometric. IEEE/ACM Trans. Comput. Biol. Bioinforma. 2020, 17, 82–90. [Google Scholar] [CrossRef]
- Haupt, J.; Kahl, S.; Kowerko, D.; Eibl, M. Large-scale plant classification using deep convolutional neural networks. CEUR Workshop Proc. 2018, 2125, 1–7. [Google Scholar]
- Reyes, A.K.; Caicedo, J.C.; Camargo, J.E.; Nari, U.A. Fine-tuning Deep Convolutional Networks for Plant Recognition. CLEF 2015, 1391, 467–475. [Google Scholar]
- Gajendran, M.K.; Khan, M.Z.; Khattak, M.A.K. ECG Classification using Deep Transfer Learning. In Proceedings of the 2021 4th International Conference on Information and Computer Technologies (ICICT), Kahului, HI, USA, 11–14 March 2021; pp. 1–5. [Google Scholar] [CrossRef]
- Choi, S. Plant identification with deep convolutional neural network: SNUMedinfo at LifeCLEF plant identification task 2015. CEUR Workshop Proc. 2015, 1391, 2–5. [Google Scholar]
- Sun, Y.; Zhu, L.; Wang, G.; Zhao, F. Multi-Input Convolutional Neural Network for Flower Grading. J. Electr. Comput. Eng. 2017, 2017, 9240407. [Google Scholar] [CrossRef] [Green Version]
- Low, D.G. Distinctive image features from scale-invariant keypoints. Int. J. Comput. Vis. 2004, 60, 91–110. Available online: https://www.cs.ubc.ca/~lowe/papers/ijcv04.pdf (accessed on 6 January 2023). [CrossRef]
- Xiao, J.; Wang, J.; Cao, S.; Li, B. Application of a Novel and Improved VGG-19 Network in the Detection of Workers Wearing Masks Application of a Novel and Improved VGG-19 Network in the Detection of Workers Wearing Masks. J. Phys. Conf. Ser. 2020, 1518, 012041. [Google Scholar] [CrossRef] [PubMed]
- Zhang, S.; Huang, W.; Huang, Y.; Zhang, C. Neurocomputing Plant species recognition methods using leaf image: Overview. Neurocomputing 2020, 408, 246–272. [Google Scholar] [CrossRef]
- Ullah, M.I.; Attique, M.; Sharif, M.; Ahmad, S.; Bukhari, C. Data in brief A citrus fruits and leaves dataset for detection and classi fi cation of citrus diseases through machine learning. Data Brief 2019, 26, 104340. [Google Scholar] [CrossRef]
- Wang, X.; Yang, Y.; Guo, Z.; Zhou, Z.; Liu, Y.; Pang, Q.; Du, S. Real-World Image Super Resolution via Unsupervised Bi-directional Cycle Domain Transfer Learning based Generative Adversarial Network. arXiv 2022, arXiv:2211.10563. [Google Scholar]
- Ibrahim, N.M.; Gabr, D.G.I.; Rahman, A.-U.; Dash, S.; Nayyar, A. A deep learning approach to intelligent fruit identification and family classification. Multimed. Tools Appl. 2022, 81, 27783–27798. [Google Scholar] [CrossRef]
- Khan, T.A.; Fatima, A.; Shahzad, T.; Rahman, A.U.; Alissa, K.; Ghazal, T.M.; Al-Sakhnini, M.M.; Abbas, S.; Khan, M.A.; Ahmed, A. Secure IoMT for Disease Prediction Empowered with Transfer Learning in Healthcare 5.0, the Concept and Case Study. IEEE Access 2023, 11, 39418–39430. [Google Scholar] [CrossRef]
- Asif, R.N.; Abbas, S.; Khan, M.A.; Rahman, A.U.; Sultan, K.; Mahmud, M.; Mosavi, A. Development and Validation of Embedded Device for Electrocardiogram Arrhythmia Empowered with Transfer Learning. Comput. Intell. Neurosci. 2022, 2022, 5054641. [Google Scholar] [CrossRef] [PubMed]
- Nasir, M.U.; Zubair, M.; Ghazal, T.M.; Khan, M.F.; Ahmad, M.; Rahman, A.-u.; Hamadi, H.A.; Khan, M.A.; Mansoor, W. Kidney Cancer Prediction Empowered with Blockchain Security Using Transfer Learning. Sensors 2022, 22, 7483. [Google Scholar] [CrossRef]
- Rousseeuw, P.J. Silhouettes: A graphical aid to the interpretation and validation of cluster analysis. J. Comput. Appl. Math. 1987, 20, 53–65. [Google Scholar] [CrossRef] [Green Version]
- Vinh, N.X.; Epps, J.; Bailey, J. Information theoretic measures for clusterings comparison: Variants, properties, normalization and correction for chance. J. Mach. Learn. Res. 2010, 11, 2837–2854. [Google Scholar]
- Xie, J.; Girshick, R.; Farhadi, A. Unsupervised deep embedding for clustering analysis. In Proceedings of the 33rd International Conference on International Conference on Machine Learning ICML, New York, NY, USA, 19–24 June 2016; Volume 1, pp. 740–749. [Google Scholar]
- Ahmed, M.I.B.; Zaghdoud, R.; Ahmed, M.S.; Sendi, R.; Alsharif, S.; Alabdulkarim, J.; Saad, B.A.A.; Alsabt, R.; Rahman, A.; Krishnasamy, G. A Real-Time Computer Vision Based Approach to Detection and Classification of Traffic Incidents. Big Data Cogn. Comput. 2023, 7, 22. [Google Scholar] [CrossRef]
- Guo, X.; Liu, X.; Zhu, E.; Yin, J. Deep clustering with convolutional autoencoders. In Proceedings of the 25th ACM International Conference on Multimedia, Mountain View, CA, USA, 23–27 October 2017; pp. 582–590. [Google Scholar]
- Yang, J.; Parikh, D.; Batra, D. Joint unsupervised learning of deep representations and image clusters. In Proceedings of the IEEE Conference on Computer Vision and Pattern Recognition, Las Vegas, NV, USA, 27–30 June 2016; pp. 5147–5156. [Google Scholar]
- Pathak, A.K.; Parsai, M. A Study of Various Image Fusion Techniques. Int. J. Eng. Trends Technol. 2014, 15, 59–62. [Google Scholar] [CrossRef]
- Gogul, I.; Kumar, V.S. Flower species recognition system using convolution neural networks and transfer learning. In Proceedings of the 2017 4th International Conference on Signal Processing, Communication and Networking (ICSCN), Chennai, India, 16–18 March 2017; pp. 1–6. [Google Scholar] [CrossRef]
- Robnik-Šikonja, M.; Kononenko, I. Theoretical and Empirical Analysis of ReliefF and RReliefF. Mach. Learn. 2003, 53, 23–69. Available online: http://lkm.fri.uni-lj.si/xaigor/slo/clanki/MLJ2003-FinalPaper.pdf (accessed on 10 January 2023). [CrossRef] [Green Version]
- Sembiring, R.W.; Zain, J.M.; Embong, A. A Comparative Agglomerative Hierarchical Clustering Method to Cluster Implemented Course. arXiv 2011, arXiv:1101.4270. [Google Scholar]
- Alghamdi, A.S.; Rahman, A. Data Mining Approach to Predict Success of Secondary School Students: A Saudi Arabian Case Study. Educ. Sci. 2023, 13, 293. [Google Scholar] [CrossRef]
- Alqarni, A.; Rahman, A. Arabic Tweets-Based Sentiment Analysis to Investigate the Impact of COVID-19 in KSA: A Deep Learning Approach. Big Data Cogn. Comput. 2023, 7, 16. [Google Scholar] [CrossRef]
- Vallabhajosyula, S.; Sistla, V.; Kolli, V.K.K. Transfer learning-based deep ensemble neural network for plant leaf disease detection. J. Plant Dis. Prot. 2022, 129, 545–558. [Google Scholar] [CrossRef]
- Aydin, K.; Ali Seydi, K.; Cagatay, C.; Hamdi, Y.Y.; Huseyin, T.; Bedir, T. Analysis of transfer learning for deep neural network based plant classification models. Comput. Electron. Agric. 2019, 158, 20–29. [Google Scholar] [CrossRef]
- Velasco, J.S.; Catipon, J.V.; Monilar, E.G.; Amon, V.M.; Virrey, G.C. Classification of Skin Disease Using Transfer Learning in Convolutional Neural Networks. arXiv 2023, arXiv:2304.02852. [Google Scholar] [CrossRef] [PubMed]
- Velasco, J.; Pascion, C.; Alberio, J.W.; Apuang, J.; Cruz, J.S.; Gomez, M.A.; Jorda, R.A., Jr. Smartphone-Based Skin Disease Classification Using MobileNet CNN International Journal of Advanced Trends in Computer Science and Engineering. Int. J. Adv. Trends Comput. Sci. Eng. 2019, 8, 2–8. Available online: http://www.warse.org/IJATCSE/static/pdf/file/ijatcse116852019.pdf (accessed on 23 January 2023).
- Narvekar, C.; Rao, M. Flower classification using CNN and transfer learning in CNN- Agriculture Perspective. In Proceedings of the 2020 3rd International Conference on Intelligent Sustainable Systems (ICISS), Thoothukudi, India, 3–5 December 2020; pp. 660–664. [Google Scholar] [CrossRef]


| Feature | Values |
|---|---|
| Color | Brown [1]/yellowish-brown [2]/yellow [3]/dark brown [4]. |
| Texture | Smooth [1]/reticulate [2]/tuberculate [3]/rough [4]. |
| Shape | Oblong [1]/globose [2]/broad ovate–subglobose [3]/D-shaped [4]/kidney [5]. |
| Margin | Seed winged [1]/not winged [2]. |
| Hilum position | Subterminal [1]/terminal [2]. |
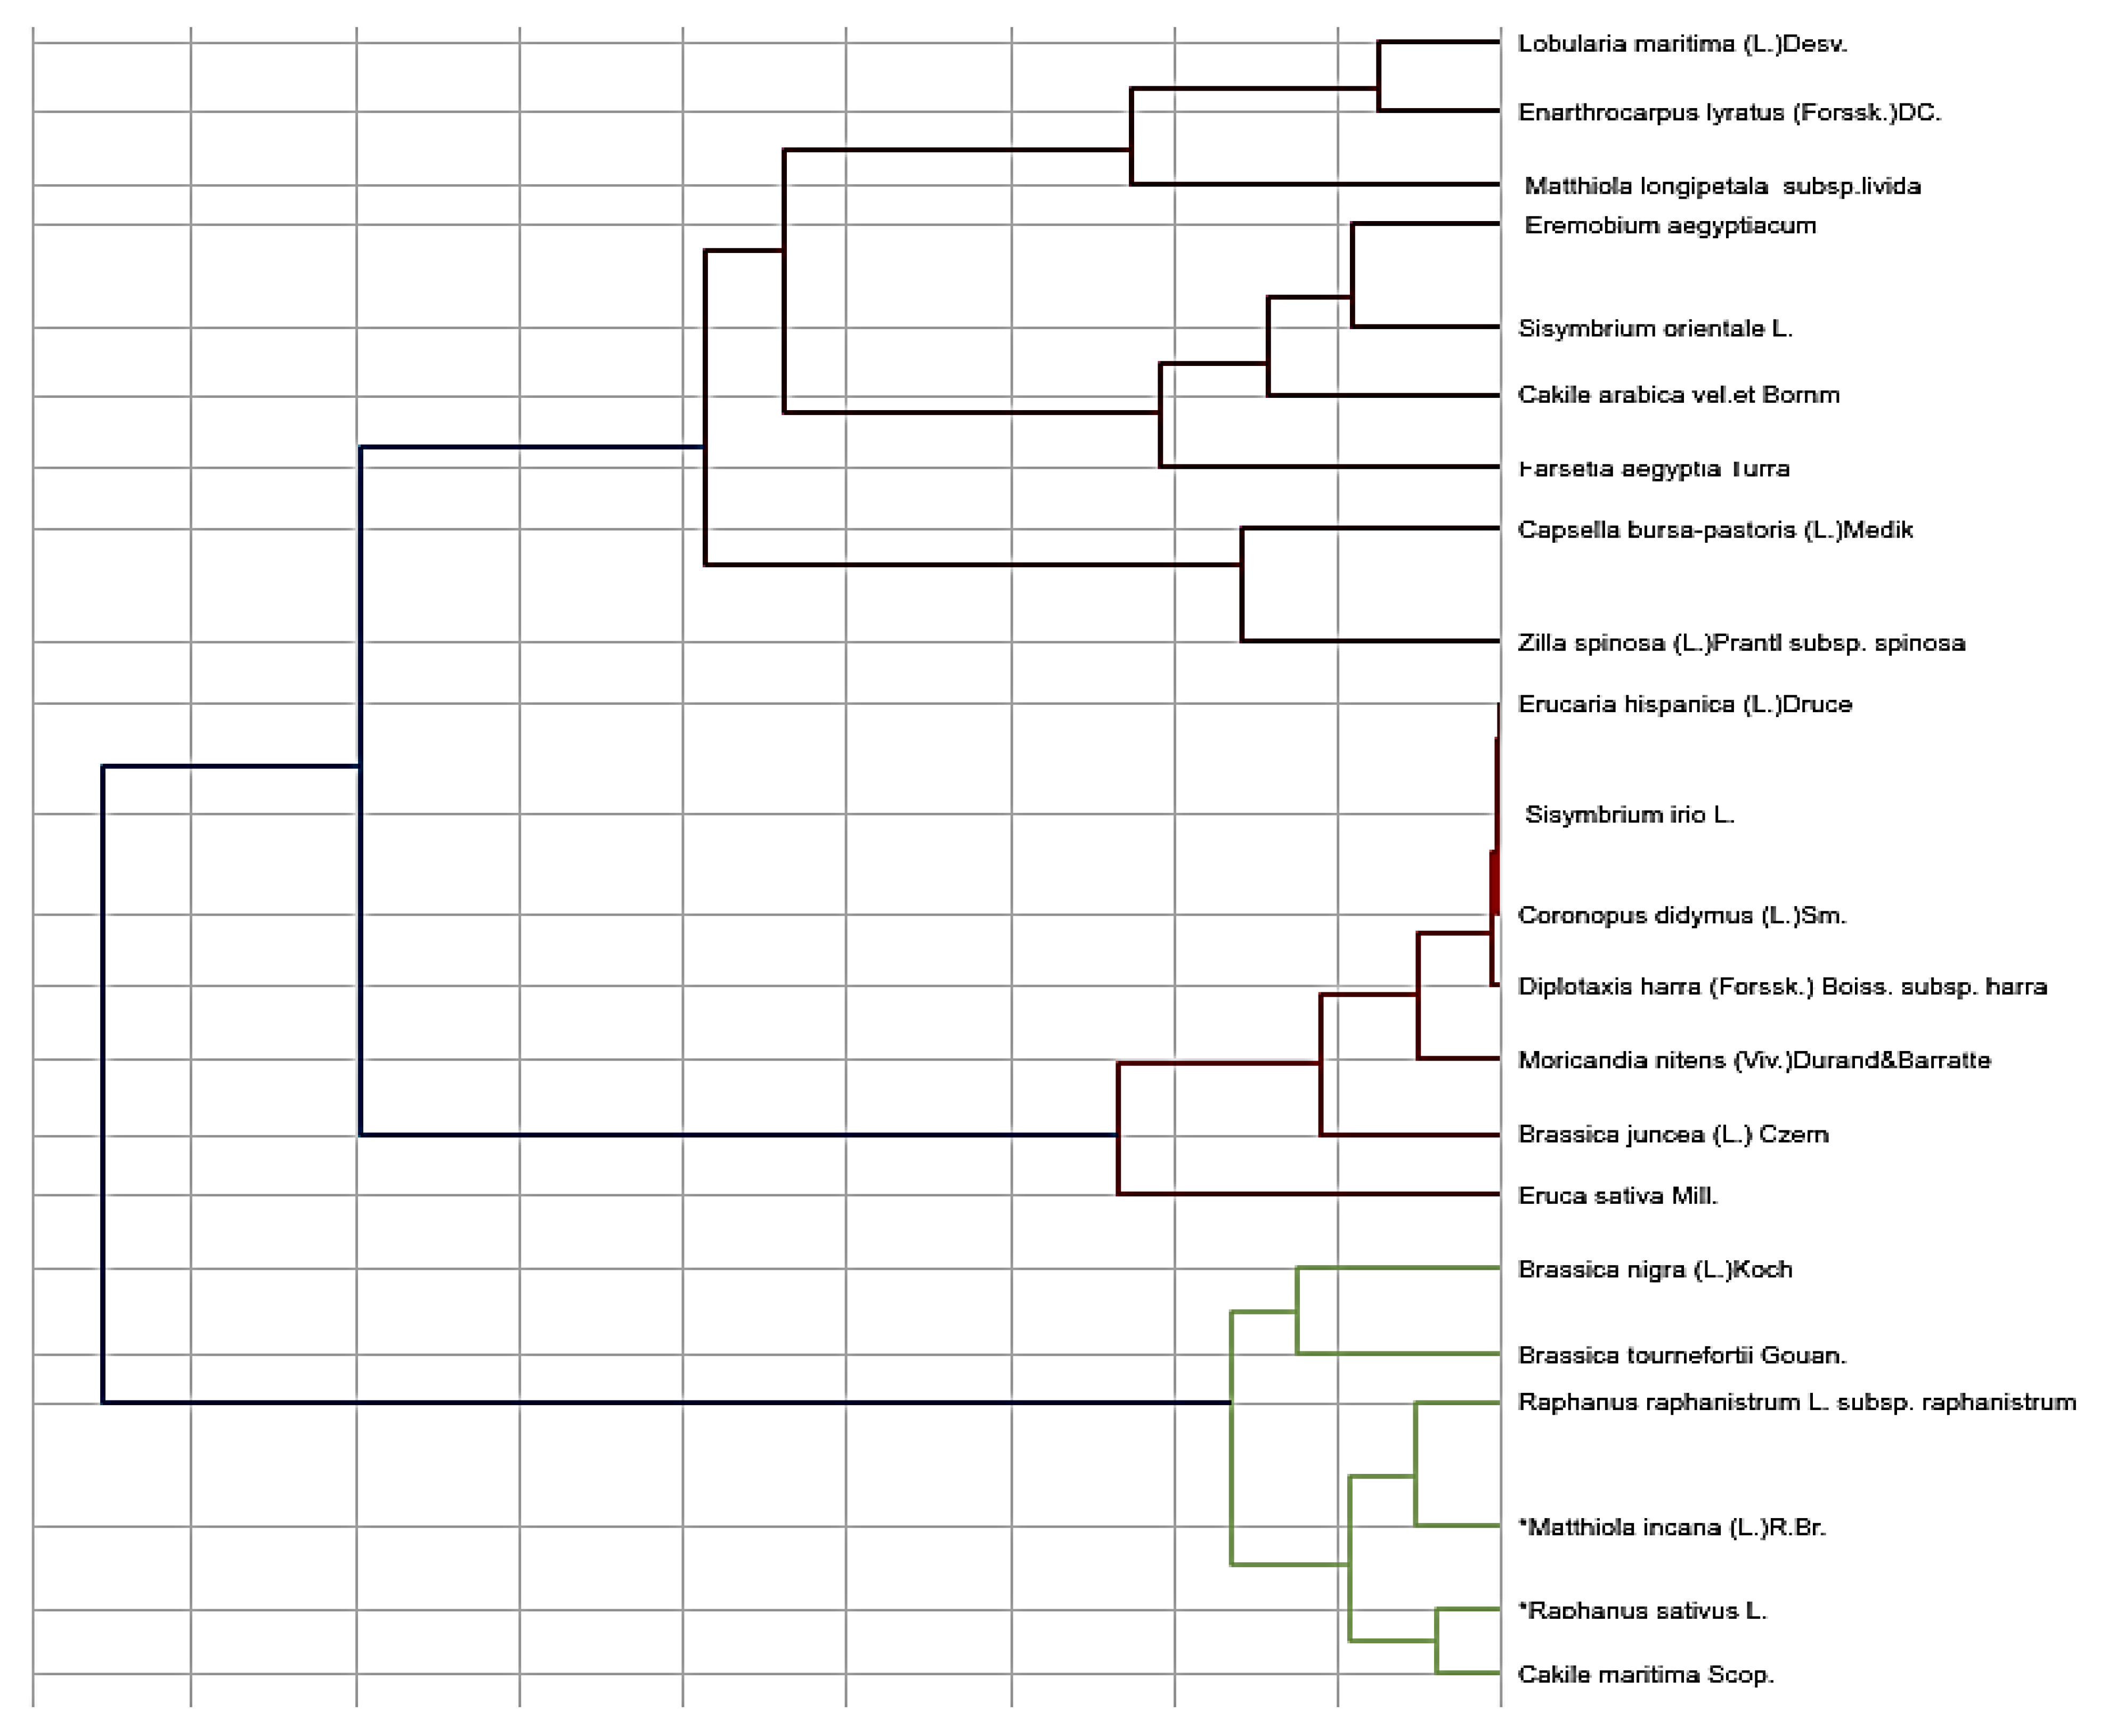
| # | Sisymbrium irio | Sisymbrium orientale | Eremobium aegyptiacum var. lineare | Matthiola longipetala subsp. livida | Matthiola incana | Farsetia aegyptia | Lobularia maritima | Diplotaxis harra subsp. harra | Brassica tournefortii | Brassica juncea | Brassica nigra | Eruca sativa | Erucaria hispanica | Cakile maritima | Cakile arabica | Zilla spinosa subsp. spinosa | Enarthrocarpus lyratus | Raphanus raphanistrum subsp. raphanistrum. | Raphanus sativus | Moricandia nitens | Coronopus didymus | Capsella bursa-pastoris |
|---|---|---|---|---|---|---|---|---|---|---|---|---|---|---|---|---|---|---|---|---|---|---|
| 1 | 3 | 2 | 3 | 1 | 1 | 1 | 1 | 3 | 1 | 4 | 1 | 2 | 2 | 1 | 1 | 1 | 4 | 1 | 1 | 1 | 3 | 1 |
| 2 | 1 | 1 | 3 | 1 | 4 | 1 | 1 | 3 | 2 | 2 | 2 | 2 | 1 | 2 | 1 | 1 | 2 | 2 | 2 | 1 | 1 | 1 |
| 3 | 1 | 1 | 1 | 1 | 3 | 3 | 3 | 1 | 2 | 2 | 2 | 3 | 1 | 4 | 1 | 1 | 1 | 3 | 3 | 1 | 5 | 1 |
| 4 | 2 | 2 | 1 | 2 | 2 | 1 | 1 | 2 | 2 | 2 | 2 | 2 | 2 | 2 | 1 | 2 | 2 | 2 | 2 | 2 | 2 | 2 |
| 5 | 1 | 1 | 1 | 1 | 1 | 2 | 1 | 1 | 2 | 2 | 2 | 2 | 1 | 1 | 1 | 1 | 2 | 1 | 2 | 1 | 2 | 2 |
| Type | Feature | Values |
| Seed | Color | Brown [1]/off-white [2]/black [3]. |
| Texture | Warty [1]/tuberculate [2]/irregular striated [3]/hairy [4]/smooth [5]. | |
| Shape | Globose [1]/flattened [2]. | |
| Margin | Wingless [1]/winged [2]/folded [3]/hairy [4]. | |
| Hilum | Position | Terminal [1]/central [2]. |
| Shape | Oblong [1]/elliptic [2]/conical [3]/linear [4]/oblong–ovate [5]. | |
| Level | Depressed [1]/semidepressed [2]/elevated [3]/superficial [4]. | |
| Coma | Color | Brown [1]/off-white [2]/absent [3]. |
| Duration | Deciduous [1]/persistence [2]/absent [3]. | |
| Position | Terminal [1]/peripheral [2]/covering the whole seed’s surface [3]/absent [4]. |
| # | Acokanthera spectabilis | Carissa spinarum | Thevetia peruviana | Vinca rosea | Alstonia scholaris | Nerium oleander | Mascarenhasia elastica | Leptadenia arborea | Leptadenia pyrotechnica | Calotropis procera | Cynanchum acutum | Solenostemma argel. | Asclepias curassavica | Cryptostegia grandiflora |
|---|---|---|---|---|---|---|---|---|---|---|---|---|---|---|
| 1 | 1 | 1 | 2 | 3 | 1 | 1 | 1 | 1 | 1 | 1 | 1 | 1 | 1 | 1 |
| 2 | 1 | 2 | 3 | 2 | 2 | 4 | 2 | 2 | 5 | 4 | 2 | 2 | 1 | 2 |
| 3 | 1 | 2 | 1 | 1 | 2 | 2 | 2 | 2 | 2 | 2 | 2 | 1 | 2 | 2 |
| 4 | 1 | 3 | 1 | 1 | 4 | 1 | 1 | 2 | 2 | 2 | 2 | 3 | 1 | 1 |
| 5 | 2 | 2 | 1 | 2 | 2 | 2 | 2 | 2 | 2 | 2 | 2 | 2 | 2 | 2 |
| 6 | 1 | 2 | 3 | 2 | 2 | 2 | 1 | 4 | 4 | 5 | 4 | 4 | 4 | 4 |
| 7 | 3 | 1 | 4 | 3 | 2 | 3 | 2 | 4 | 2 | 2 | 4 | 1 | 4 | 4 |
| 8 | 3 | 3 | 3 | 3 | 1 | 1 | 1 | 2 | 2 | 2 | 2 | 2 | 2 | 2 |
| 9 | 3 | 3 | 3 | 3 | 2 | 2 | 1 | 1 | 1 | 1 | 1 | 1 | 1 | 1 |
| 10 | 4 | 4 | 4 | 4 | 2 | 3 | 1 | 1 | 1 | 1 | 1 | 1 | 1 | 1 |
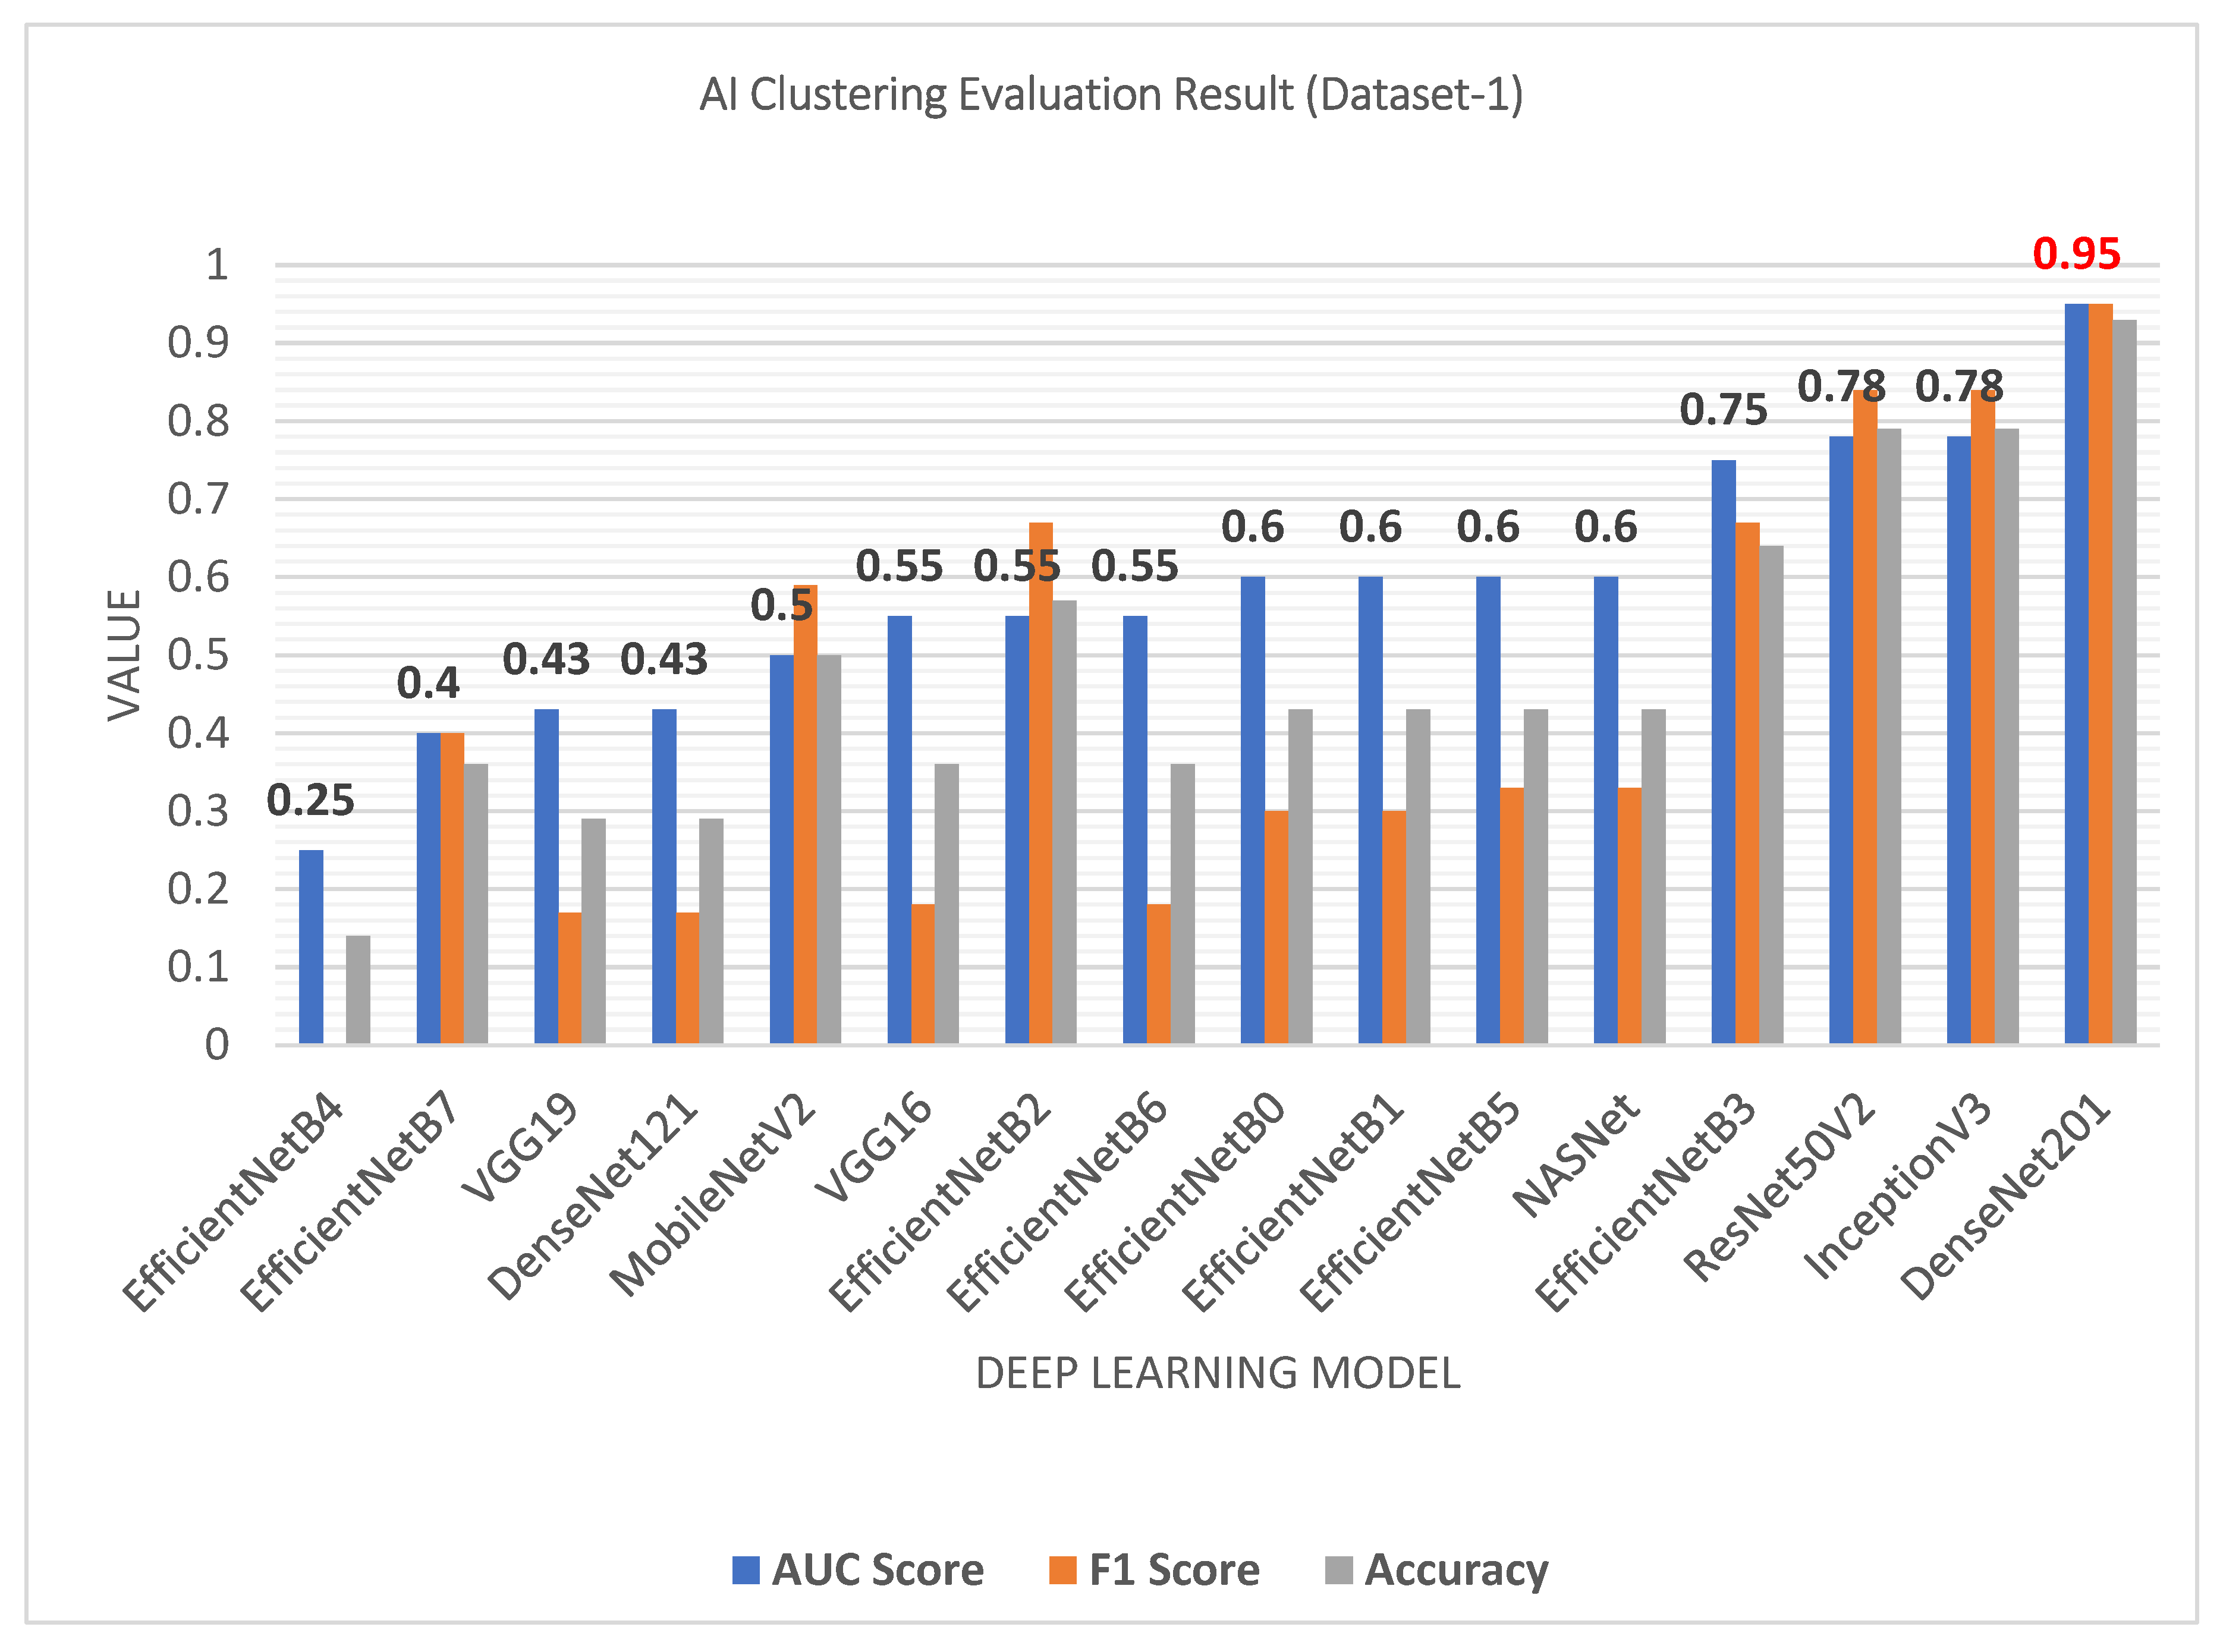
| # | Method | AUC Score | F1-Score | Accuracy Score | Random Score | Mean Square Error |
|---|---|---|---|---|---|---|
| 1 | EfficientNetB4 | 0.25 | 0 | 0.14 | 0.35 | 0.86 |
| 2 | EfficientNetB7 | 0.4 | 0.4 | 0.36 | 0.03 | 0.64 |
| 3 | VGG19 | 0.43 | 0.17 | 0.29 | 0.03 | 0.71 |
| 4 | DenseNet121 | 0.43 | 0.17 | 0.29 | 0.03 | 0.71 |
| 5 | MobileNetV2 | 0.5 | 0.59 | 0.5 | 0 | 0.5 |
| 6 | VGG16 | 0.55 | 0.18 | 0.36 | 0.04 | 0.64 |
| 7 | EfficientNetB2 | 0.55 | 0.67 | 0.57 | 0.01 | 0.43 |
| 8 | EfficientNetB6 | 0.55 | 0.18 | 0.36 | 0.04 | 0.64 |
| 9 | EfficientNetB0 | 0.6 | 0.3 | 0.43 | 0.09 | 0.57 |
| 10 | EfficientNetB1 | 0.6 | 0.3 | 0.43 | 0.09 | 0.57 |
| 11 | EfficientNetB5 | 0.6 | 0.33 | 0.43 | 0.09 | 0.57 |
| 12 | NASNet | 0.6 | 0.33 | 0.43 | 0.09 | 0.57 |
| 13 | EfficientNetB3 | 0.75 | 0.67 | 0.64 | 0.26 | 0.36 |
| 14 | ResNet50V2 | 0.78 | 0.84 | 0.79 | 0.22 | 0.21 |
| 15 | InceptionV3 | 0.78 | 0.84 | 0.79 | 0.22 | 0.21 |
| 16 | DenseNet201 | 0.95 | 0.95 | 0.93 | 0.7 | 0.07 |
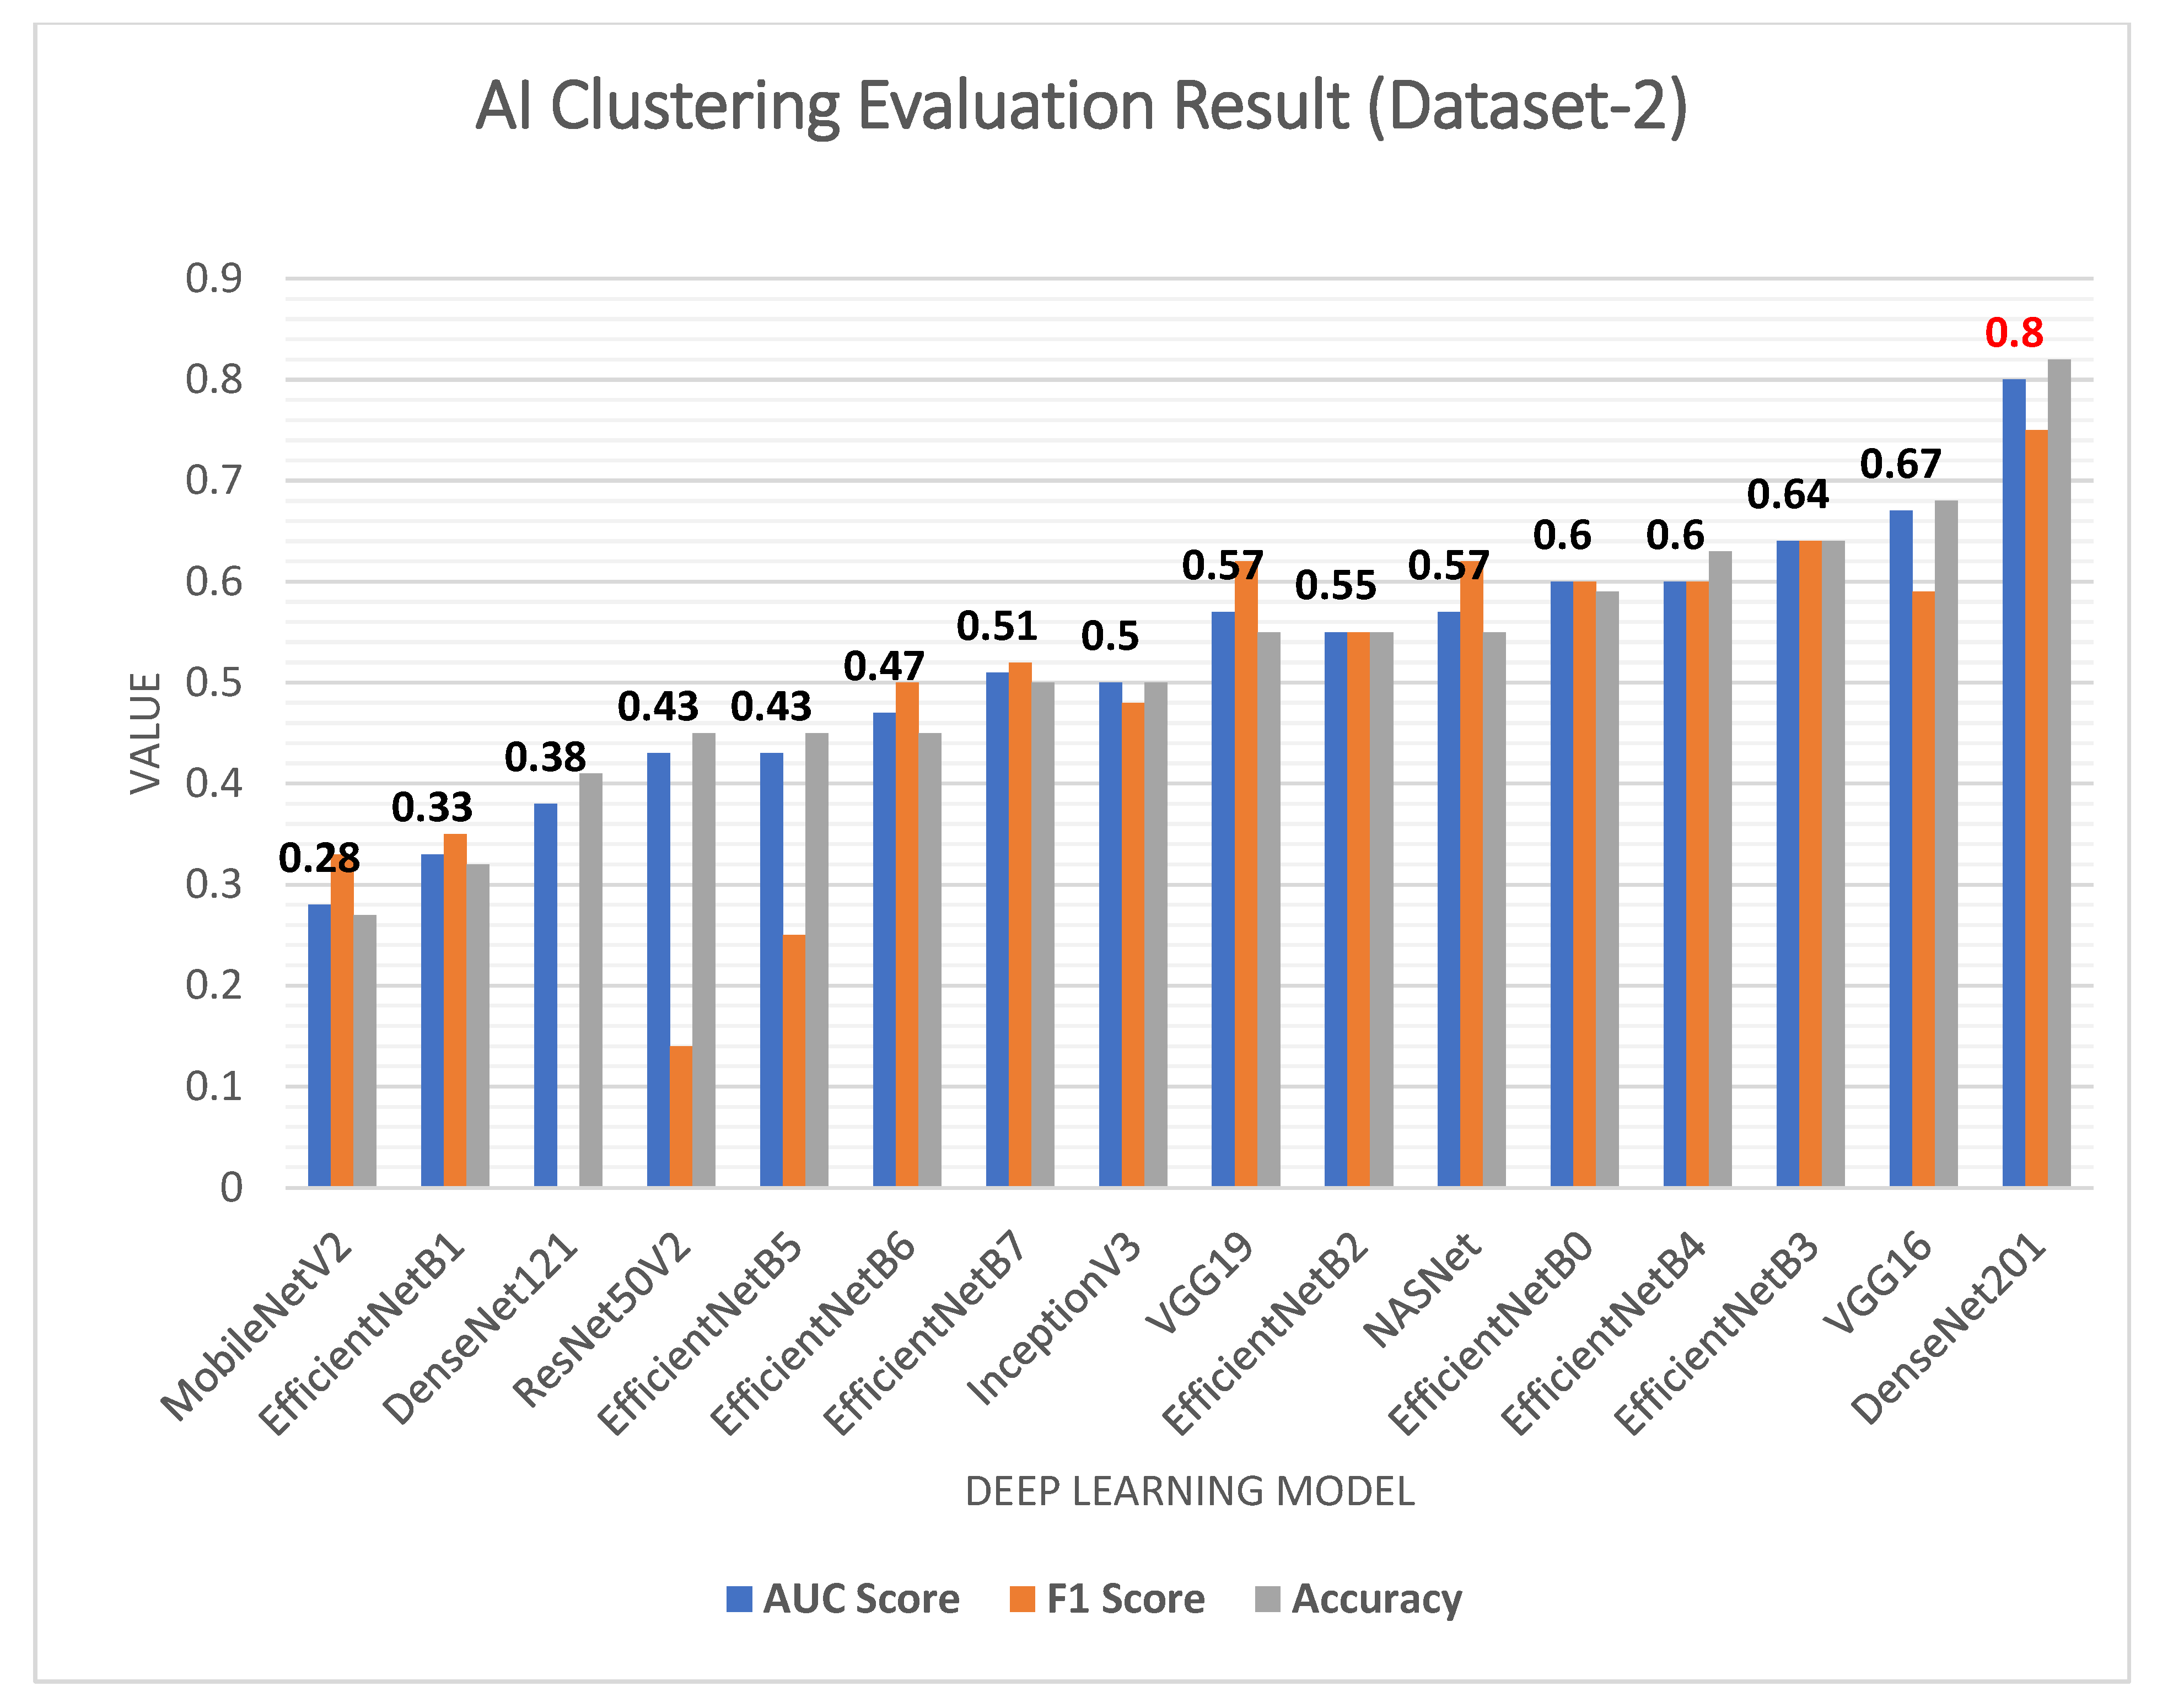
| # | Method | AUC Score | F1-Score | Accuracy Score | Random Score | Mean Square Error |
|---|---|---|---|---|---|---|
| 1 | MobileNetV2 | 0.28 | 0.33 | 0.27 | 0.15 | 0.73 |
| 2 | EfficientNetB1 | 0.33 | 0.35 | 0.32 | 0.09 | 0.7 |
| 3 | DenseNet121 | 0.38 | 0 | 0.41 | 0.13 | 0.59 |
| 4 | ResNet50V2 | 0.43 | 0.14 | 0.45 | 0.03 | 0.55 |
| 5 | EfficientNetB5 | 0.43 | 0.25 | 0.45 | 0.02 | 0.55 |
| 6 | EfficientNetB6 | 0.47 | 0.5 | 0.45 | 0.003 | 0.55 |
| 7 | EfficientNetB7 | 0.51 | 0.52 | 0.5 | 0 | 0.5 |
| 8 | InceptionV3 | 0.5 | 0.48 | 0.5 | 0 | 0.5 |
| 9 | VGG19 | 0.57 | 0.62 | 0.55 | 0.02 | 0.45 |
| 10 | EfficientNetB2 | 0.55 | 0.55 | 0.55 | 0.01 | 0.45 |
| 11 | NASNet | 0.57 | 0.62 | 0.55 | 0.02 | 0.45 |
| 12 | EfficientNetB0 | 0.6 | 0.6 | 0.59 | 0.03 | 0.4 |
| 13 | EfficientNetB4 | 0.6 | 0.6 | 0.63 | 0.17 | 0.27 |
| 14 | EfficientNetB3 | 0.64 | 0.64 | 0.64 | 0.06 | 0.36 |
| 15 | VGG16 | 0.67 | 0.59 | 0.68 | 0.09 | 0.32 |
| 16 | DenseNet201 | 0.8 | 0.75 | 0.82 | 0.4 | 0.18 |
Disclaimer/Publisher’s Note: The statements, opinions and data contained in all publications are solely those of the individual author(s) and contributor(s) and not of MDPI and/or the editor(s). MDPI and/or the editor(s) disclaim responsibility for any injury to people or property resulting from any ideas, methods, instructions or products referred to in the content. |
© 2023 by the authors. Licensee MDPI, Basel, Switzerland. This article is an open access article distributed under the terms and conditions of the Creative Commons Attribution (CC BY) license (https://creativecommons.org/licenses/by/4.0/).
Share and Cite
Ibrahim, N.M.; Gabr, D.G.; Rahman, A.; Musleh, D.; AlKhulaifi, D.; AlKharraa, M. Transfer Learning Approach to Seed Taxonomy: A Wild Plant Case Study. Big Data Cogn. Comput. 2023, 7, 128. https://doi.org/10.3390/bdcc7030128
Ibrahim NM, Gabr DG, Rahman A, Musleh D, AlKhulaifi D, AlKharraa M. Transfer Learning Approach to Seed Taxonomy: A Wild Plant Case Study. Big Data and Cognitive Computing. 2023; 7(3):128. https://doi.org/10.3390/bdcc7030128
Chicago/Turabian StyleIbrahim, Nehad M., Dalia G. Gabr, Atta Rahman, Dhiaa Musleh, Dania AlKhulaifi, and Mariam AlKharraa. 2023. "Transfer Learning Approach to Seed Taxonomy: A Wild Plant Case Study" Big Data and Cognitive Computing 7, no. 3: 128. https://doi.org/10.3390/bdcc7030128