Article

Predictors of Smartphone Addiction and Social Isolation among Jordanian Children and Adolescents Using SEM and ML

1
Computer Information Systems Department, Faculty of Information Technology and Systems, University of Jordan, Aqaba 77110, Jordan
2
Information Technology Department, Faculty of Information Technology and Systems, University of Jordan, Aqaba 77110, Jordan
3
Faculty of Information Technology, Al-Ahliyya Amman University, Amman 19328, Jordan
4
Faculty of Information Technology, University of Fujairah, Fujairah P.O. Box 1207, United Arab Emirates
5
Department of Management Information Systems, School of Business, The University of Jordan, Amman 11942, Jordan
6
Department of Business Management, School of Business, University of Jordan, Aqaba 77110, Jordan
*
Author to whom correspondence should be addressed.
Big Data Cogn. Comput. 2022, 6(3), 92; https://doi.org/10.3390/bdcc6030092
Submission received: 26 July 2022 / Revised: 28 August 2022 / Accepted: 30 August 2022 / Published: 2 September 2022
(This article belongs to the Special Issue Graph-Based Data Mining and Social Network Analysis)

Abstract

:
Smartphone addiction has become a major problem for everyone. According to recent studies, a considerable number of children and adolescents are more attracted to smartphones and exhibit addictive behavioral indicators, which are emerging as serious social problems. The main goal of this study is to identify the determinants that influence children’s smartphone addiction and social isolation among children and adolescents in Jordan. The theoretical foundation of this study model is based on constructs adopted from the Technology Acceptance Model (TAM) (i.e., perceived ease of use and perceived usefulness), with social influence and trust adopted from the TAM extended model along with perceived enjoyment. In terms of methodology, the study uses data from 511 parents who responded via convenient sampling, and the data was collected via a survey questionnaire and used to evaluate the research model. To test the study hypotheses, the empirical validity of the research model was set up, and the data were analyzed with SPSS version 21.0 and AMOS 26 software. Structural equation modeling (SEM), confirmatory factor analysis (CFA), and machine learning (ML) methods were used to test the study hypotheses and validate the properties of the instrument items. The ML methods used are support vector machine (SMO), the bagging reduced error pruning tree (REPTree), artificial neural network (ANN), and random forest. Several major findings were indicated by the results: perceived usefulness, trust, and social influence were significant antecedent behavioral intentions to use the smartphone. Also, findings prove that behavioral intention is statistically supported to have a significant influence on smartphone addiction. Furthermore, the findings confirm that smartphone addiction positively influences social isolation among Jordanian children and adolescents. Yet, perceived ease of use and perceived enjoyment did not have a significant effect on behavioral intention to use the smartphone among Jordanian children and adolescents. The research contributes to the body of knowledge and literature by empirically examining and theorizing the implications of smartphone addiction on social isolation. Further details of the study contribution, as well as research future directions and limitations, are presented in the discussion section.

1. Introduction

In developed and developing countries, mobile phone use has changed over the past several decades, and smartphone addiction has emerged as a serious problem in societies. Recent indicators and trends show an increased use of smartphones by children and adolescents. This increase is due to the popularity of smartphones and to the applications and features designed to attract and appeal to children [1]. Some governments have taken a cautious approach to children’s smartphone use, advising them to use these devices as little as possible [2,3,4]. According to [2,4], children and teens who have grown up with recent technologies and digital innovations depend on the internet and smartphone applications and services more than previous generations. Studies report that children and teens are the primary users of smartphones, and their daily screen time is rapidly increasing at an early age [5,6,7,8]. Smartphones have many advantages in people’s daily lives. According to [9,10], smartphones facilitate and increase employees’ productivity by providing access to email, reminders, and calendars in addition to the ability to do web searching. Also, researchers [11,12,13,14] found that smartphones improve students’ learning. Moreover, smartphones are utilized for entertainment and socializing [11,15]. O’Connor et al. [16] stated that there are several advantages related to smartphone use, such as improving academic skills, reading recognition, and enriching vocabulary and expressive language. On the other hand, there are several disadvantages associated with smartphones. O’Connor et al. [16] reported that using smartphones is associated with a substantial risk of different psychosocial, developmental, and physiological problems, such as decreased fitness, physical inactivity, and high blood pressure, in addition to the risk of metabolic syndrome. Other researchers found that smartphone use has also been associated with negative psychosocial effects such as sleeplessness and aggressive attitudes [17], as well as increased risk-taking [18]. Also, researchers [2,3,19,20] found that children’s negative developmental effects are related to the overuse of the smartphone at an early age, such as poor short-term memory, reading comprehension, and recognizing, in addition to vocabulary and language development problems. Furthermore, excessive use of such technologies may result in behavioral depression, anxiety, and addiction [4,21,22,23]. Research [3] describes smartphone addiction as “a social problem stemming from a lack of offline social networks and resulting in a decline in social engagement”; [22] defined smartphone addiction as “an emerging concept in which consumers maximize their smartphone usage in various activities and exhibit changes in behavior.” Also, [2] stated that “mobile phone addiction refers to excessive or uncontrolled, problematic use of mobile phones”, while [24] used practical measurements to measure game addiction among Korean adolescents, i.e., Tolerance, Excessive Usage, Withdrawal, Control Impairment, Compulsive Usage, Neglecting Activity.
According to [2], people who are smartphone dependent frequently experience feelings of social isolation, loneliness, and confusion when they aren’t using their devices.
According to [25], smartphone addiction is strongly linked to increased social isolation. Additionally, according to [25], cortisol levels were noticeably higher in socially isolated smartphone addicts. High cortisol levels are linked to adverse health effects like slower brain function, immune system dysfunction, and sleep disturbances. Studies [25,26] reported that smartphone addiction has a negative impact on individuals’ socialization, and socialization is the primary activity that influences and develops individuals’ attitudes, motivations, abilities, skills, and norms.
To date, attention has been focused on internet addiction, but a detailed investigation of smartphone addiction and the correlation between smartphone addiction and social isolation is lacking [2,22,25,26,27,28,29]. Accordingly, the significance of this study is to investigate and identify the determinants of children’s smartphone addiction and to detect the association between smartphone use, addiction, and social isolation among children and adolescents in Jordan. The study aims to provide an answer to the following research questions:
Research Question 1: What are the determinants that influence children’s smartphone addiction?
Research Question 2: Is there a significant correlation between social isolation and smartphone addiction?
The major contribution of this study is the investigation and examination of the proposed developed model that contains five independent determinants, two intermediate determinants, ten moderating determinants, and one dependent determinant. Consequently, the study aimed to take an overall view of the factors that influence smartphone addiction (SPA) and social isolation (SocIso) among Jordanian children and adolescents. To the best of the researchers’ knowledge, no research has been identified that incorporates all these factors into a single study of smartphone addiction and social isolation. Furthermore, in this study the researchers used five different ML methods (Artificial Neural Network (ANN), Linear Regression, Sequential Minimal Optimization algorithm (SMO) for Support Vector Machine (SVM), Bagging using REPTree model, and Random Forest) which also distinguishes this work.
The empirical results offer several key findings. Smartphone addiction among Jordanian children and teens affects perceived usefulness (PU), trust (TR), and social influence (SI). It also affects social isolation among Jordanian children and teens. On the other hand, perceived ease of use (PEoU) and perceived enjoyment don’t have a major effect on behavioral intention to use a smartphone among Jordanian children and teens.
This study is organized as follows: Section 2 introduces the theoretical framework of the model and the hypotheses. After that, research methods are presented, where research demography and data analysis are described and presented, including descriptive analysis, SEM analysis validation, and ML prediction. The results of the data analysis are discussed in the following section, in addition to the theoretical and practical implications, and finally the study limitations are discussed, and future research directions are suggested.

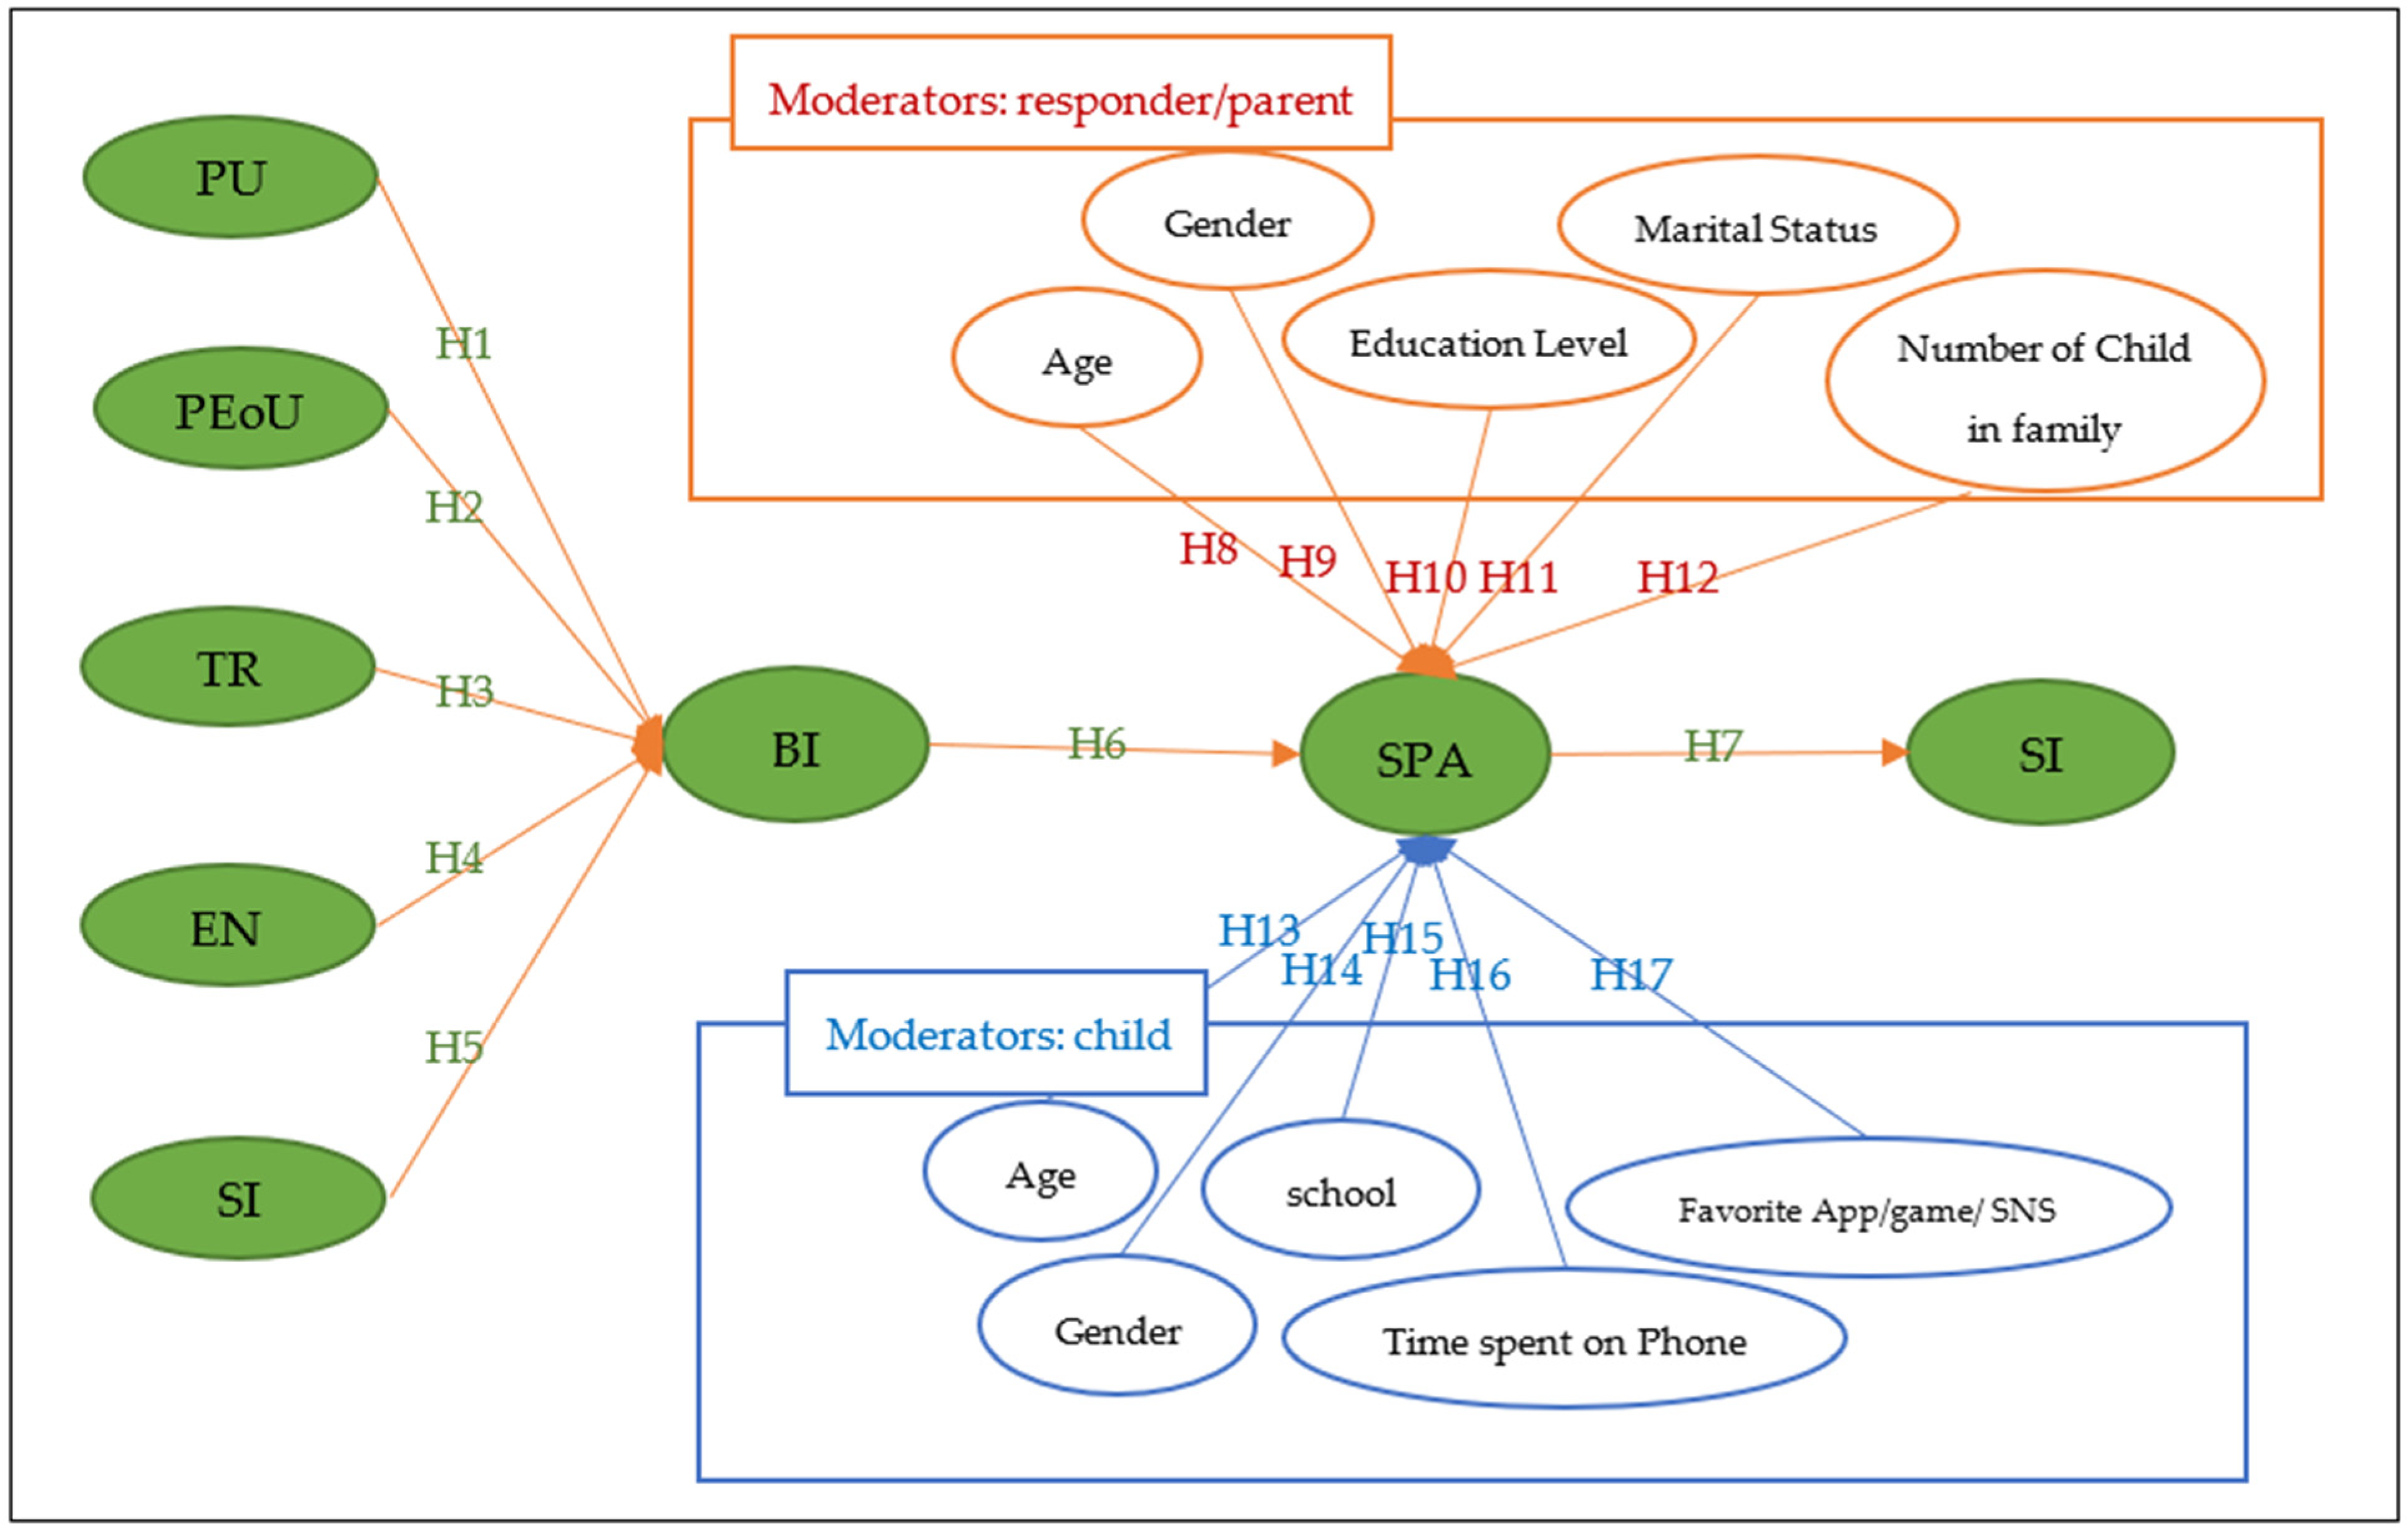
2. Research Hypotheses

The proposed model shown in Figure 1 is based on the original TAM model, with the addition of social influence and trust adopted from the TAM extended model [30,31]. Also, we used the perceived enjoyment factor along with ten moderating factors. The proposed model constructs include perceived usefulness (PU), perceived ease of use (PEoU), perceived enjoyment (EN), social influence (SI), and trust (TR) in smartphones, which were adopted by [22,32,33]. The five independent factors influence the behavioral intention factor [32], which in turn influences smartphone addiction [22,33], which influences social isolation (SocIso) [29], as the model suggests. The proposed model as well as the hypotheses will be discussed in detail in the next sections.
The Technology Acceptance Model (TAM) proposed by Davis et al. [34] is the most influential research model that is used to explain, determine, and understand the recent technology innovation adoption behavior of an individual. Usefulness, ease of use, and behavioral intention are used to assess and evaluate the actual adoption of recent technology, where ease of use and usefulness are the most important TAM determinants that predict individuals’ behavior toward acceptance of new technology [34]. Davis et al. [34] stated that perceived ease of use and perceived usefulness have a direct influence on a technology’s prospective usage intention, where the degree to which individuals are interested in utilizing the system is characterized as an attitude that produces behavioral intentions and leads to real system adoption and utilization.
Davis et al. [34] defined perceived usefulness as the “subjective perception of users where they believe that using certain technologies can improve the performance of their work.” Previous research [35,36,37] has found that people will be encouraged and motivated to adopt and use smartphone technologies if they believe they will be more useful and productive. Davis et al. [34] argue that perceived usefulness and perceived ease of use are crucial factors that influence the intention to adopt and use technology. The studies [22,32,38] investigated the relationship between perceived usefulness, perceived ease of use, and the behavioral intention to adopt and use mobile technologies. Alalwan et al. [32] and Shaw and Kesharwani [22] found that perceived ease of use has no influence on behavioral intention to use smartphones, while [38] reported that perceived ease of use has a positive influence on behavioral intention to use smartphone services. On the other hand, [22,32,38] found that perceived usefulness positively influences individuals’ intention to adopt smartphone technologies. Accordingly, the following hypotheses are proposed:
Hypothesis 1.
Perceived Usefulness (PU) has a positive influence related to children’s behavioral intention (BI) to use smartphones.
Hypothesis 2.
Perceived ease of use (PEoU) has a positive influence related to children’s behavioral intention (BI) to use smartphones.
The study [31] suggested trust as a critical factor that should be integrated into the TAM model. Also, [30] suggested an extended model based on TAM along with social influence and trust to evaluate the adoption of mobile internet commerce by individuals. Morgan and Hunt [39] and De Wulf et al. [40] defined trust as “consumer confidence in a retailer’s reliability and integrity.” Tiwari et al. [41] stated that trust is a positive perception of consistency and reliability. According to statistics, 50% of smartphone owners claimed that they do not adopt smartphone financial services due to trust and privacy issues [42,43]. Previous research [22,32] discovered that trust has a considerable influence on intention behavior to adopt and use a smartphone and mobile technologies, leading to the following hypothesis:
Hypothesis 3.
Trust (TR) has a positive influence on children’s behavioral intention (BI) to use smartphones.
Previous studies stated that enjoyment motivation is considered an important factor in terms of individuals’ intention to adapt and use technologies, systems, and applications [36,44,45,46]. Alalwan et al. [47], Chong [48], and Dai and Palvi [49] stated that using mobile technology could provide individuals with a degree of enjoyment and fun. [32,36,50] studied the effect of perceived enjoyment as a significant predictor of an individual’s behavioral intention to use smartphones. They found that perceived enjoyment influences an individual’s behavioral intention to adopt and use smartphone services, applications, and games. Thus, the following hypothesis is
Hypothesis 4.
Perceived Enjoyment (EN) has a positive influence related to children’s behavioral intention (BI) to use smartphones.
Venkatesh et al. [51] defined social influence as “the extent to which an individual perceives that important others believe he or she should apply the new system.” According to [52,53], social influence is the individual’s decision to accept and utilize modern technology that might be influenced and inspired by friends, close relatives, significant persons they respect, and others in the community. Baabdullah [54] stated that social influence plays a vital role in driving individuals’ behavioral intentions toward adopting and using smartphones and mobile applications. Consequently, Baabdullah [54] and Shaw and Kesharwani [22] found that social influence has a positive impact on the behavioral intention of using smartphone applications and games. In this study, social influence is used to evaluate other people’s impact on a family’s children’s adoption and use of the smartphone. Accordingly, the following hypothesis is proposed:
Hypothesis 5.
Social influence (SI) has a positive influence on children’s behavioral intention (BI) to use smartphones.
Individuals’ behavioral intentions, according to studies [54,55,56,57], are the desire and readiness to conduct and perform actions that will result in productive outcomes as planned and predicted. According to [51], behavioral intention is “the dependent factor which assesses the behaviors of the individuals towards the used technological service”, where individuals are influenced by behavioral intention to make a reasonable effort and to participate in activities that will provide them with the intended services and advantages [32,37,58]. Researchers [22,37] investigated the association between behavioral intention to use smartphones and smartphone addiction. Also, other researchers [2] studied the prevalence of mobile phone addiction among children and teenagers; [2] claimed that smartphone addiction among children and teenagers needs immediate and urgent attention. Shaw and Kesharwani [2,22] found that children’s smartphone addiction is influenced positively by behavioral intention. Thus, the following hypothesis is suggested:
Hypothesis 6.
Behavioral intention (BI) has a positive influence relating to children’s smartphone addiction (SPA).
Technology addiction is “a special type of behavioral addiction that encapsulates a psychological dependency on the use of an IT”, according to Turel et al. [59]. Smartphone addiction is “an emerging concept in which consumers maximize their smartphone usage in various activities and exhibit changes in behavior,” according to Shaw and Kesharwani [22]. Meshi and Ellithorpe [29] investigated the connections between social media use and social isolation, depression, and anxiety. According to [2], smartphone addiction in kids and teenagers has become a widespread issue that affects everyone. Furthermore, [2] argued that while internet addiction has received most of the study attention, a thorough and in-depth examination of smartphone addiction has lagged. Additionally, [19] discovered that children and teenagers are more attracted to smartphones and show more signs and symptoms of addictive behavior. According to [25], technology has a significant impact on young people’s behavior, and smartphone addiction and social isolation (SocIso) are positively correlated. The social isolation (SocIso) items in this study were measured using five items that were adopted from the Patient-Reported Outcomes Measurement Information System (PROMIS) [60]. As a result, the following assertion is made:
Hypothesis 7.
Smartphone addiction (SPA) has a positive influence on children’s social isolation (SocIso).
Previous studies studied the student’s smartphone use addiction in terms of different variables, including the parents’ age, gender, educational level, school environment, and other variables. The studies [61,62] argue that another factor that might influence the children’s screen time problem might be the parent’s gender [61,62], and researchers [61,63,64] have investigated the relationship between the parents’ age and the children’s smartphone usage problems. Researchers found that parental control over children’s smartphone usage decreased as the age of the parents increased. Thus, the following hypotheses are proposed:
Hypothesis 8.
Parent’s age has a positive influence on children’s smartphone addiction (SPA).
Hypothesis 9.
Parent’s gender has a positive influence on children’s smartphone addiction (SPA).
Research [20,62,63,65] stated that there is a relationship between parents’ education level and their children’s problematic mobile phone use. Researchers [20,62,63,65] found a significant correlation where parents with a higher education level are more concerned and conscious about the potential negative aspects of their children’s smartphone use. Therefore, we propose this hypothesis:
Hypothesis 10.
Parent education level has a positive influence related to children’s smartphone addiction (SPA).
The study [66] explored family factors associated with internet addiction among South Korean teenagers. Both [2,19] studied the relationships between family relations and smartphone addiction. Studies [2,19,65,66,67] found that parental living status and good communication between parents and their children play a significant role in avoiding smartphone and internet addiction. Therefore, it is important to investigate the relationship between family relationships and smartphone addiction. Hence, we introduce the following research hypotheses:
Hypothesis 11.
Parental marital status has a positive influence relating to children’s smartphone addiction (SPA).
Research [67] proposed a study that investigated smartphone addiction in high school and university students. The same source stated that “as the number of children in the family decreased, the smartphone addiction increased.” Accordingly, the following hypothesis is presented:
Hypothesis 12.
The number of children has a positive influence on the number of children’s smartphone addictions (SPA).
Many studies have been conducted to investigate gender variations in smartphone usage and addiction. The studies [2,19,20,27,62,65] argue that there are gender differences in smartphone addiction, while [2,65] claimed that smartphone addiction was significantly associated with female gender and [62] found that older age and female gender were related to high screen time and low physical playtime. Furthermore, [19] stated that “boys who were dissatisfied with their families had significantly higher levels of Internet addiction”. Other research has found no link between smartphone addiction and gender [28,68,69]. Consequently, the following hypothesis is stated:
Hypothesis 13.
Child gender has a positive influence relating to children’s smartphone addiction (SPA).
Many studies [2,16,62,65,70] claim that smartphone use can pose different risks for children and teenagers depending on their age. Study [5] stated that younger individuals are more drawn to smartphones and exhibit addictive behavioral indicators. Studies [2,62,65,70] reported that smartphone addiction and usage increased more significantly with age in girls than in boys. In this study, children from 0 to 17 years old were surveyed, where the age categories chosen were (0–2, 3–5, 15–17) years according to the research proposed by [3]. Thus, the following hypothesis is suggested:
Hypothesis 14.
Child age has a positive influence relating to children’s smartphone addiction (SPA).
In Jordan, children attend nurseries to get childcare from the ages of a few weeks to 3 years. Later, from 4–5 years old, all children are required by Jordanian law to attend preschool to learn and gain the basic skills required to attend compulsory education in schools from 6–18 years old. There are three types of schools in Jordan: governmental, UNRWA, and private schools. On the one hand, the governmental and UNRWA schools provide a national program developed by the Ministry of Education (MOE) that is taught in the Arabic language [71]. On the other hand, private schools provide either national or international programs where the international programs are offered and taught in the English language, such as International GCSE, the International Baccalaureate (IB), and the Scholastic Assessment Test (SAT) [72,73]. Research [5] found that students enrolled in English-based educational programs spend more time on smartphones than students enrolled in French-based educational programs, with time spent by students in the English programs exceeding two hours per day compared to children enrolled in French programs. Also, [65] found that the school environment increases the school students’ problematic smartphone use. Therefore, the following hypothesis is proposed:
Hypothesis 15.
A child’s school has a positive influence on the child’s smartphone addiction (SPA).
Studies report that children’s daily screen time is rapidly increasing and begins at an early age (5–8). Teresia et al. [16] stated that time spent using smartphones is the “frequency and duration that youth are engaged in screen media use.” Christakis and Zimmerman [6] stated that the percentage of newborns that watch TV on a regular basis increased dramatically from 40% to 90% by the age of two years. Study [62] reported that American children and teens spend an average of more than seven hours per day on screen media. As a result, the following hypothesis is proposed to address the relationship between the amount of time children and teenagers spend using smartphones and smartphone addiction:
Hypothesis 16.
Time spent using smartphones has a positive influence on children’s smartphone addiction (SPA).
Smartphones provide the ability to access the internet in addition to a wide range of apps such as messaging, gaming, and social networking. Numerous investigations have been conducted into the elements that affect smartphone addiction, including the installed apps and games [19,50,74,75]. Research [50] found that the high quality of games’ interfaces significantly influences smartphone addiction. Study [74] stated that perceived enjoyment of a smartphone game is positively associated with smartphone addiction. Study [75] found that overuse and the lack of control over the time spent on SNS apps are the main causes of the social networking apps’ addiction. Accordingly, we suggest the following hypothesis:
Hypothesis 17.
Favorite smartphone app/game/SNS has a positive influence relating to children’s smartphone addiction (SPA).

3. Research Methods

For this study to achieve its purpose of investigating and examining the overall effect of smartphones on children’s and adolescents’ social isolation (SocIso), it examines the impact of the independent factors perceived usefulness (PU), perceived ease of use (PEoU), trust (TR), perceived enjoyment (EN), and social influence (SI) on the intermediate variable, behavioral intention; the effect of the intermediate variable, behavioral intention, on smartphone addiction (SPA); and the effect of smartphone addiction (SPA) on social isolation (SocIso). Furthermore, the researchers studied the moderating roles of parents’ age, education level, gender, and marital status, in addition to the number of children in the family. Also, this study investigated the moderating role of children’s gender, age, school, and the time that the child spent using a smartphone, as well as their favorite smartphone app, game, or social network (SNS).
As previous investigations into this topic have been limited or incomplete, the researchers, after an extensive research study and development stage, suggested the research model introduced in Figure 1, in addition to the proposed hypotheses. Moreover, a questionnaire was used and evaluated, and data from 511 participants was collected from a convenience sample. The following three parts are presented to clarify and explain in detail the survey design and methodologies of this research.

3.1. Research Context

Smartphone addiction and the problem of social isolation among children and adolescents have emerged as serious problems in society. As a result, the key questions are: what are the determinants that influence children’s smartphone addiction, and is there a significant correlation between social isolation and smartphone addiction? This study was carried out as follows.

3.2. Measurement Items

A questionnaire survey was developed to evaluate the proposed research model. Previous studies were used to develop the survey items and the study model contains eight direct and intermediate factors as well as ten moderating factors.
Perceived usefulness (PU) and perceived ease of use (PEoU) were adopted from [22,32]. Perceived usefulness (PU) was measured by six items, while perceived ease of use (PEoU) was measured by four items. Trust (TR) was measured by five items according to [22,32]. Perceived enjoyment (EN) was measured by three items adapted from [32,50]. Social influence (SI) was measured by four items adopted from [22,54]. Behavioral intention (BI) was measured by three items adapted from [2,22]. Smartphones addiction (SPA) was measured by nine items adopted from [19,25]. Social isolation (SocIso) was measured by five items adapted from (PROMIS) [60]. Constructs and items are reflected in detail in Table A1 in Appendix A.

3.3. Participants and Procedures

A web-based Google form was developed to collect data. The objective was to validate and examine the research model and hypotheses using a 5-point Likert scale: (1) strongly disagree; (2) disagree; (3) neither agree nor disagree; (4) agree; and (5) agree strongly. The constructs and items used to measure the constructions, as well as the mediating variables, are summarized in Table A1 in Appendix A.
The survey was developed in both Arabic and English and a panel of eight academics examined it; accordingly, the questionnaire was revised in response to their feedback. Also, the questionnaire was piloted on 20 Jordanian parents to ensure that the questions were understandable; consequently, the survey has been revised. The target population of this study involved all children and adolescents who use smartphones in Jordan, where the study data was collected from their parents who responded through the convenient sampling technique from 21 May 2022 to 12 June 2022. The survey was distributed through e-groups including Facebook and WhatsApp. Table 1 shows the responses from the respondents’ parents.
Although the respondents were 523 in number, 12 had to be eliminated since those respondents did not complete the questionnaire. Hence, the demography of this study consisted of 511 parents the sample size is used according to Morgan table (recommending 384 responses), when sample size is unknown as in this case. Further, the researchers checked for duplication using a Microsoft Access query for duplication (Find duplicate query) on all fields. As can be seen in Table 1, the demographic profile of the respondents was male (72%) with an age of 28–48 years (84%). The profile also includes the education of most as B.Sc. (52%), and they were married (97%). The questions were answered on behalf of the children, with the ages 3–6 years old (32%) and 6–9 years old (20%). Hence, 52% of the children are ages 3–9 years old. The people who answered the survey (84%) think that the kids’ internet experience is either excellent or good. Also, (62%) of the families had 2–3 children. They described the use of the internet in hours as (23%) of them used the internet for more than 5 h, while others used the internet for 2 h or 3 h (21%), for a total of (42%). The children study in government/public schools (69%) and follow YouTube Kids (59%) and use games (25%).

4. Data Analysis and Results

The analysis of data for this study included: first, a descriptive analysis to measure respondents’ attitudes; second, a structural equation model (SEM) (which included a confirmatory factor analysis (CFA) and then structural equation modeling (SEM) using Amos 26, performed to test the study hypotheses); third, the moderating effects; and, finally, validation of this research using machine learning (ML). SEM and CFA verified the hypotheses and analyzed the results whilst ML validated and predicted mean square error and correlation coefficient (R2). This research employed triangulation by using multiple data collection and analysis.

4.1. Descriptive Analysis

The mean and standard deviation were estimated to describe the responses and thus the attitude of the respondents toward each question asked in the survey. While the mean represents the data’s central tendency, the standard deviation measures its dispersion and provides an index of the data’s spread or variability [76,77]. A small standard deviation for a set of values indicates that these values are clustered closely around or close to the mean; a large standard deviation indicates the opposite. The level of each item was determined by the following:
L e v e l = h i g h e s t   p o i n t   i n   L i k e r t   s c a l e l o w e s t   p o i n t   i n   L i k e r t   s c a l e t h e   n u m b e r   o f   t h e   l e v e l s   u s e d   = 5 1 5 = 0.80
Hence, producing the following lookup Table 2 of values:
Table 3 shows the constructs with mean, standard deviation (SD), level, and order. All constructs were ranked “High” to “Very High” according to Table 2 based on the work of [76,77]. The exception is the construct TR, which ranks “Low” with a mean below (3). The construct EN ranked as the first among all. Both mediating constructs were ranked “High” as was the dependent construct, SocIso.
Table 4 presents the mean, standard deviation, level, and order of the constructs with the items in addition to Cronbach Alpha for each construct. Cronbach’s Alpha is a measure for reliability and consistency in multiple-question Likert scale surveys. The range is expected to be greater than 0.7, while anything less than 0.70 is considered low. Cronbach’s Alpha above 0.9 is considered excellent internal consistency, greater than 0.8 is considered good internal consistency, while between 0.7 and 0.8 is considered acceptable. On the other hand, below 0.7 is considered questionable internal consistency. As can be seen from Table 4, all constructs are reliable with Cronbach Alpha above 0.70 except BI. In the later stage of the study, the authors had to withdraw BI2 since it was the source of the discrepancy, and the Cronbach Alpha improved to become (0.75266775). Later, we determined that the question in Arabic was vague.

4.2. SEM Analysis

In this section, a measurement model assessment was conducted, as were model fit assessment and model reliability and validity and structural model assessment.

4.2.1. Measurement Model Assessment

CFA was used to evaluate the properties of the instrument items. In fact, the measurement model signifies how hypothetical constructs are measured in terms of the observed variables and personifies the validity and reliability of the observed variables’ responses to the latent variables as in [78,79,80]. Table 5 presents the factor loadings, composite reliability (CR), and average variance extracted (AVE) for the variables. All the indicators of the factor loadings exceeded 0.50, except for certain items, specifically BI2. The aforementioned items were eliminated, thus constituting evidence of convergent validity as in [78,81]. While the measurement reached convergent validity at the item level because all the factor loadings were above 0.50, all the composite reliability (CR) values exceeded 0.60, demonstrating an important level of internal consistency for the latent variables. Additionally, since each value of AVE exceeded 0.50, as in [78,79] the convergent validity was proved.

4.2.2. Model Fit Assessment

The proposed model’s fitness was evaluated using the following fit indices. As can be seen in Table 6, the model passed all the recommended tests. The chi-square due to the sample size is p = 0.000, CMIN = 1184, DF = 629. Furthermore, CMIN/DF is the discrepancy divided by the degree of freedom, which in this study is less than 5.0 and less than 3.0, as recommended by [82]. If the CMIN/DF value is ≤3 it indicates an acceptable fit [80]. The baseline comparisons are CFI, IFI, and NFI. CFI is the Comparative Fit Index and has a value truncated between 0 and 1, where values close to 1 show a very good fit while 1 represents the perfect fit [83]. The value of interest here is CFI for the default model. A CFI value of ≥0.95 is considered an excellent fit for the model [84]. An Incremental Fit Index (IFI) where values are close to 1 indicates a very good fit, while 1 indicates a perfect fit. In this study, IFI = 0.963. For the Normed Fit Index (NFI), also referred to as Delta 1, a value of 1 shows a perfect fit, while models valued < 0.9 can usually be improved substantially [85]. In this study, NFI = 0.925. The Parsimony-Adjusted Measures are PCFI and PNFI. PNFI is the Parsimony Normed Fixed Index, expressing the result of parsimony adjustment [86] to the Normed Fixed Index (NFI). In this study, PNFI was 0.842, which is greater than 0.5 according to [87]. PCFI is the Parsimony Comparative Fix Index, expressing the result of parsimony adjustment applied to the Comparative Fit Index (CFI). In this study, PCFI was 0.876, which is greater than 0.5 according to [87]. RMSEA stands for Root Mean Square Error of Approximation, and values greater than 0.1 are considered poor, values between 0.08 and 0.1 are borderline, values between 0.05 and 0.08 are acceptable, and values less than 0.05 are considered excellent [88], as is the case here with 0.042. According to [79], when SRMR is less than or equal to 0.09, it indicates an acceptable fit, and in this study, SRMR = 0.0629.

4.2.3. Model Reliability, Validity Measures, and Concerns

To validate the proposed model, first construct reliability was conducted and then convergent validity. Four indicators were calculated using AMOS 26, CR, AVE, MSV, and MaxR(H). AMOS 26 suggested the removal of BI2 since AVE = 0.399 and it should be greater than 0.5. Hence, after the removal of item BI2, the analysis was conducted again. Because CR and MaxR (H) are both greater than 0.7, construct reliability has been established. Convergent validity is established when AVE used for convergent validity is greater than 0.5. MaxR(H) (Maximal Reliability) is >0.7. The values of CR, AVE, and MaxR(H) in Table 11 show that the model is reliable and valid. Results are shown in Table 7, and the AMOS 26 indicated that there is no validity concern in the results.
Table 8 shows the correlation among construct thresholds based on [83] using [76]. The diagonal elements in the table are the square root of AVE, and all correlations between constructs are less than the square root of AVE, indicating that they are all statistically significant. One may note here that there is strong correlation between SocIso and SPA, and moderate correlation between BI and both PU and TR.
The heterotrait-monotrait ratio of correlations (HTMT) criterion measures the average correlations of the indicators across constructs. The acceptable levels of discriminant validity are (<0.90), as suggested by [79] and developed by [92]. Table 9 below reflects the results.

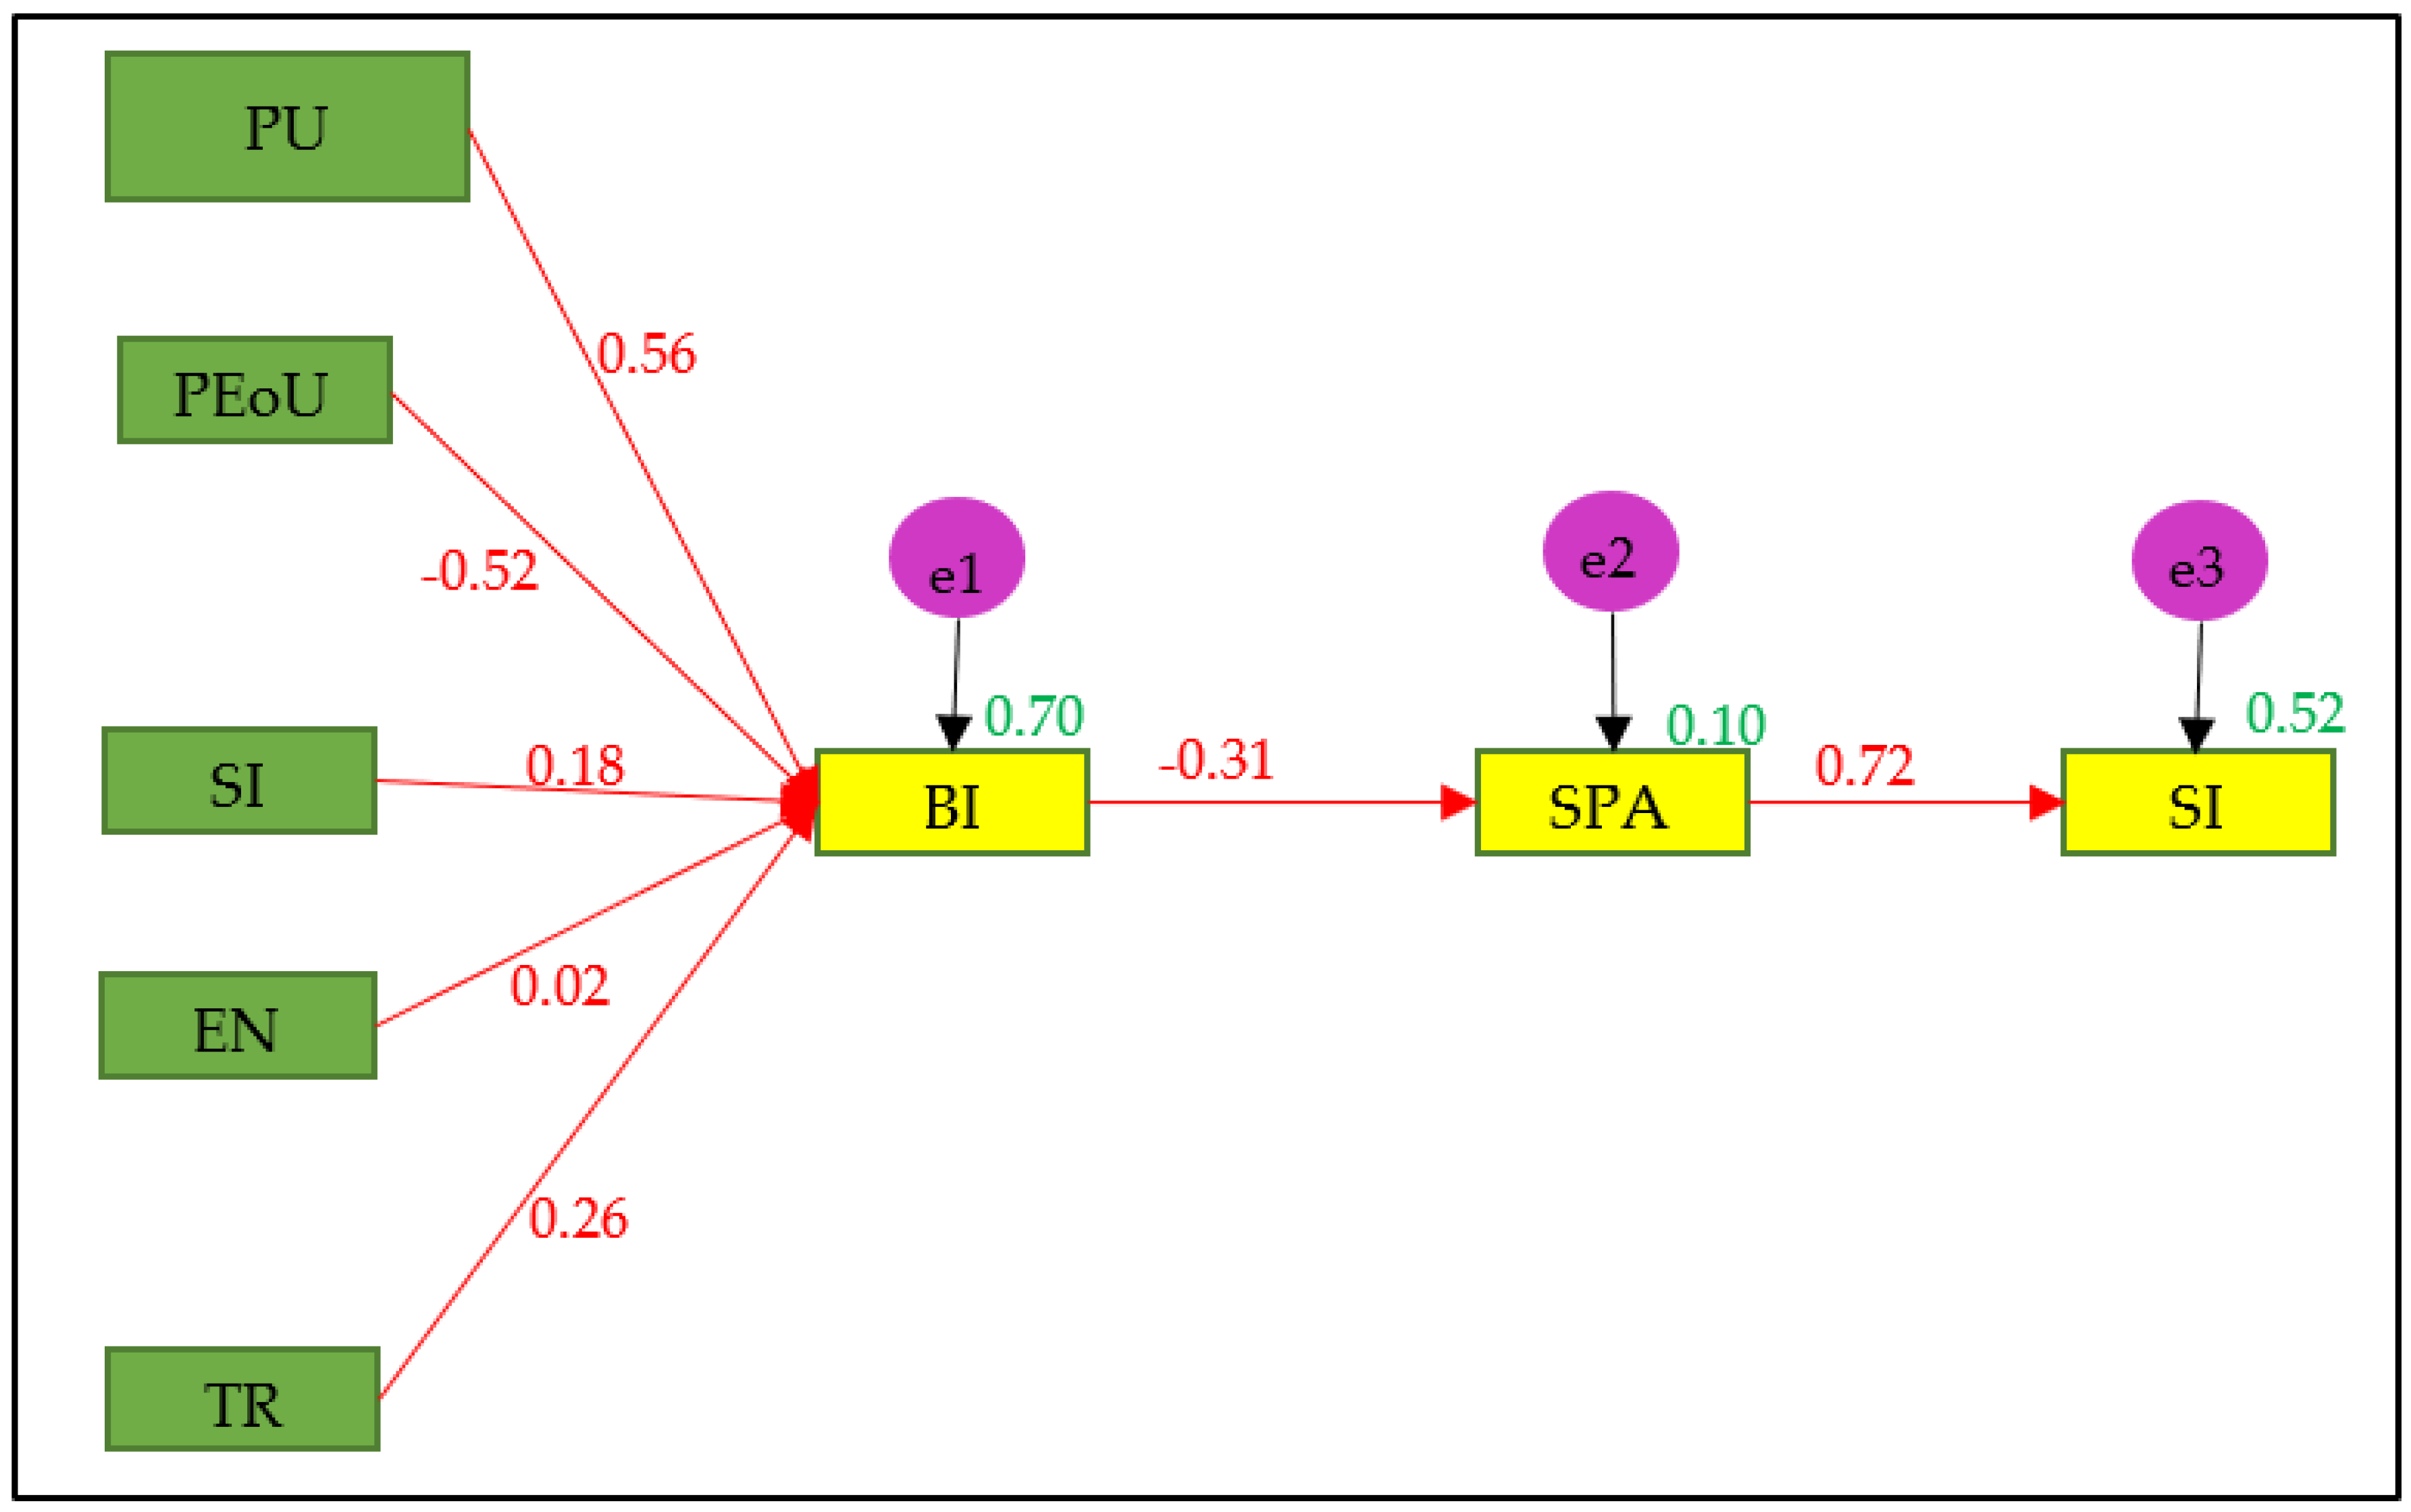
4.2.4. Structural Model Assessment

As stated previously, the model is fit. Next, we will discuss estimating the path coefficient (hypothesis testing) and estimating squared multiple correlation R2. Figure 2 shows the path coefficient using AMOS 26. The figure shows the R2 highlighted above the intermediate constructs and dependent constructs, BI, SPA, and SocIso (0.70, 0.10, and 0.52, respectively). Further, Table 10 reflects the coefficients where two hypotheses were not supported, namely H2 and H4, since p-Value> 0.05. On the other hand, the findings reflect in the same table that H1, H3, H5, H6, and H7 are all supported by the findings of the study.

4.3. Moderation Effects

The study investigated the significance of two bi-variable groups, the gender of both the child and the respondent, and their effects on SPA, BI, and SocIso, and found that both variables had no significance, as per the group statistic Table 11 and Table 12.
The outcomes of the ANOVA test, presented in Table 13, indicate the following: there is a significant difference in the respondents’ BI, supportive of the respondent’s age, supportive of internet experience, and child age. There is a significant difference in the respondents’ SocIso supportive of both the number of children in the family and the hours spent on a smartphone. There is a significant difference in both the respondents’ BI and SPA, which is supportive of the number of hours spent on smartphones.
Table 14 provides the statistical significance of the differences between each pair of groups for respondents’ age. As shown in Table 13, the five groupings were statistically different from one another.
Table 15 provides the statistical significance of the differences between each pair of groups for children’s age. As observed in Table 14, the six groupings were statistically different from one another.
Table 16 provides the statistical significance of the differences between each pair of groups for internet experience. As observed in Table 15, the three groupings were statistically different from one another.
Table 17 provides the statistical significance of the differences between each pair of groups for the number of children in a family. As observed in Table 16, the five groupings were statistically different from one another.
Table 18 provides the statistical significance of the differences between each pair of groups for the number of hours spent on the smartphone. As observed in Table 17, the five groupings were statistically different from one another.
Table 19 provides the statistical significance of the differences between each pair of groups in hours on the phone. As observed in Table 19, the five groupings were statistically different from one another.
Table 20 provides the statistical significance of the differences between each pair of groups’ hours on the phone. As observed in Table 20, the five groupings were statistically different from one another.

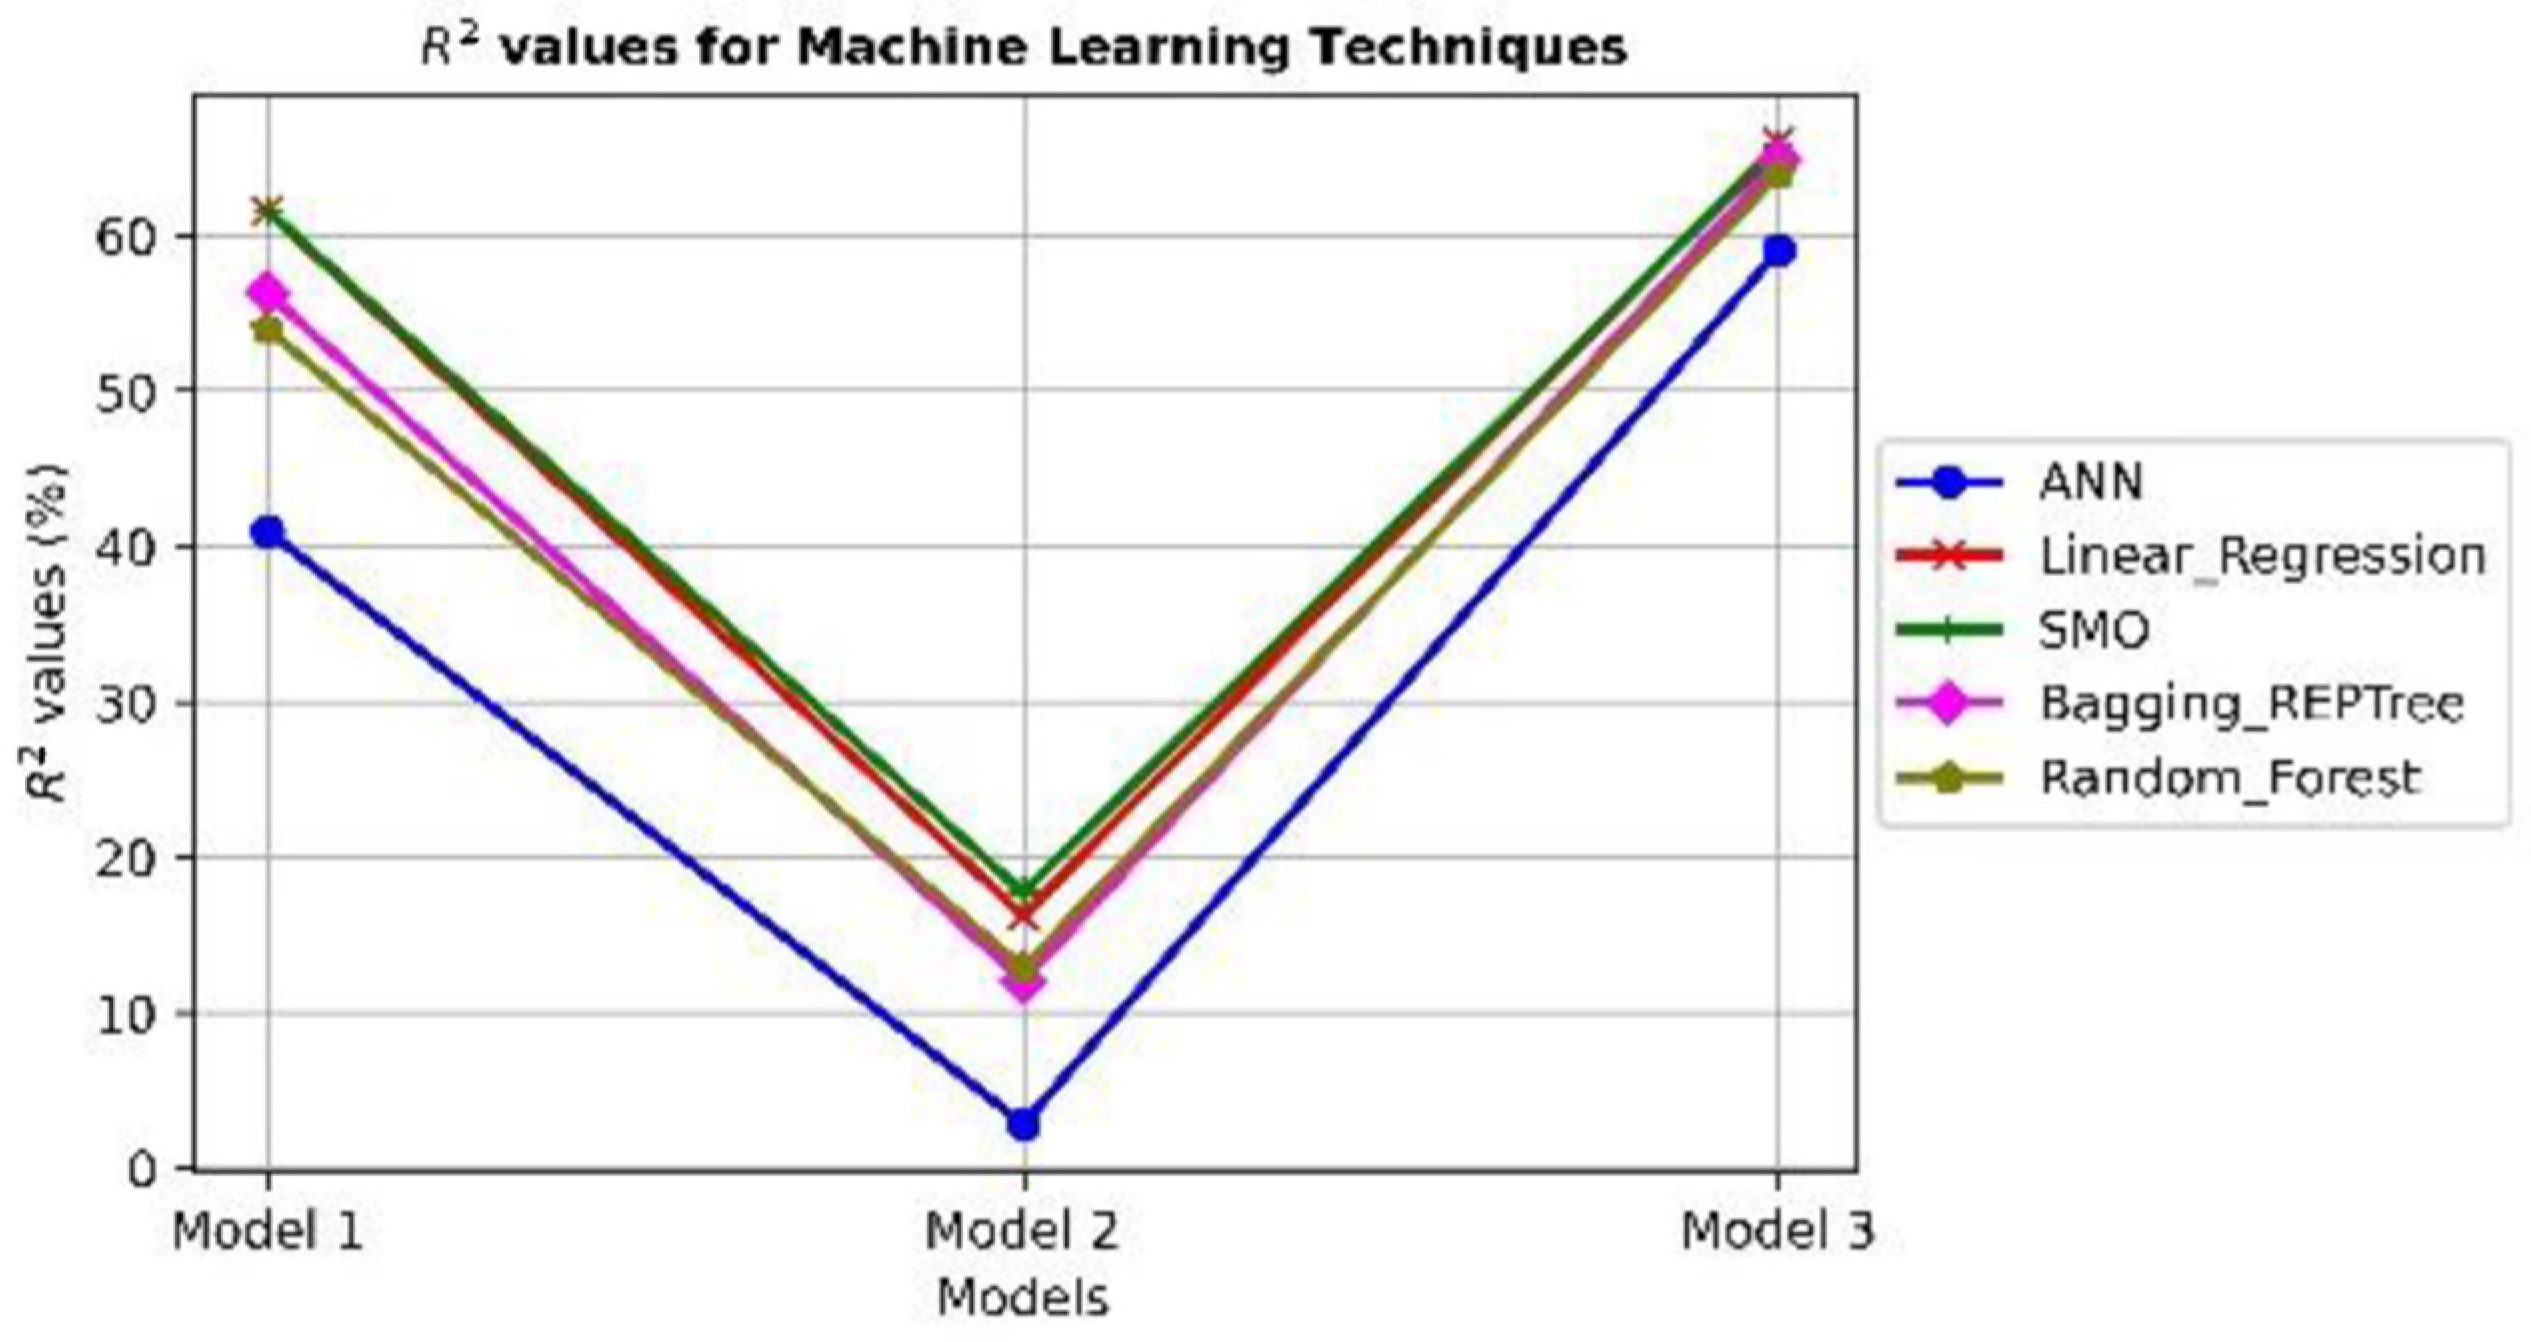
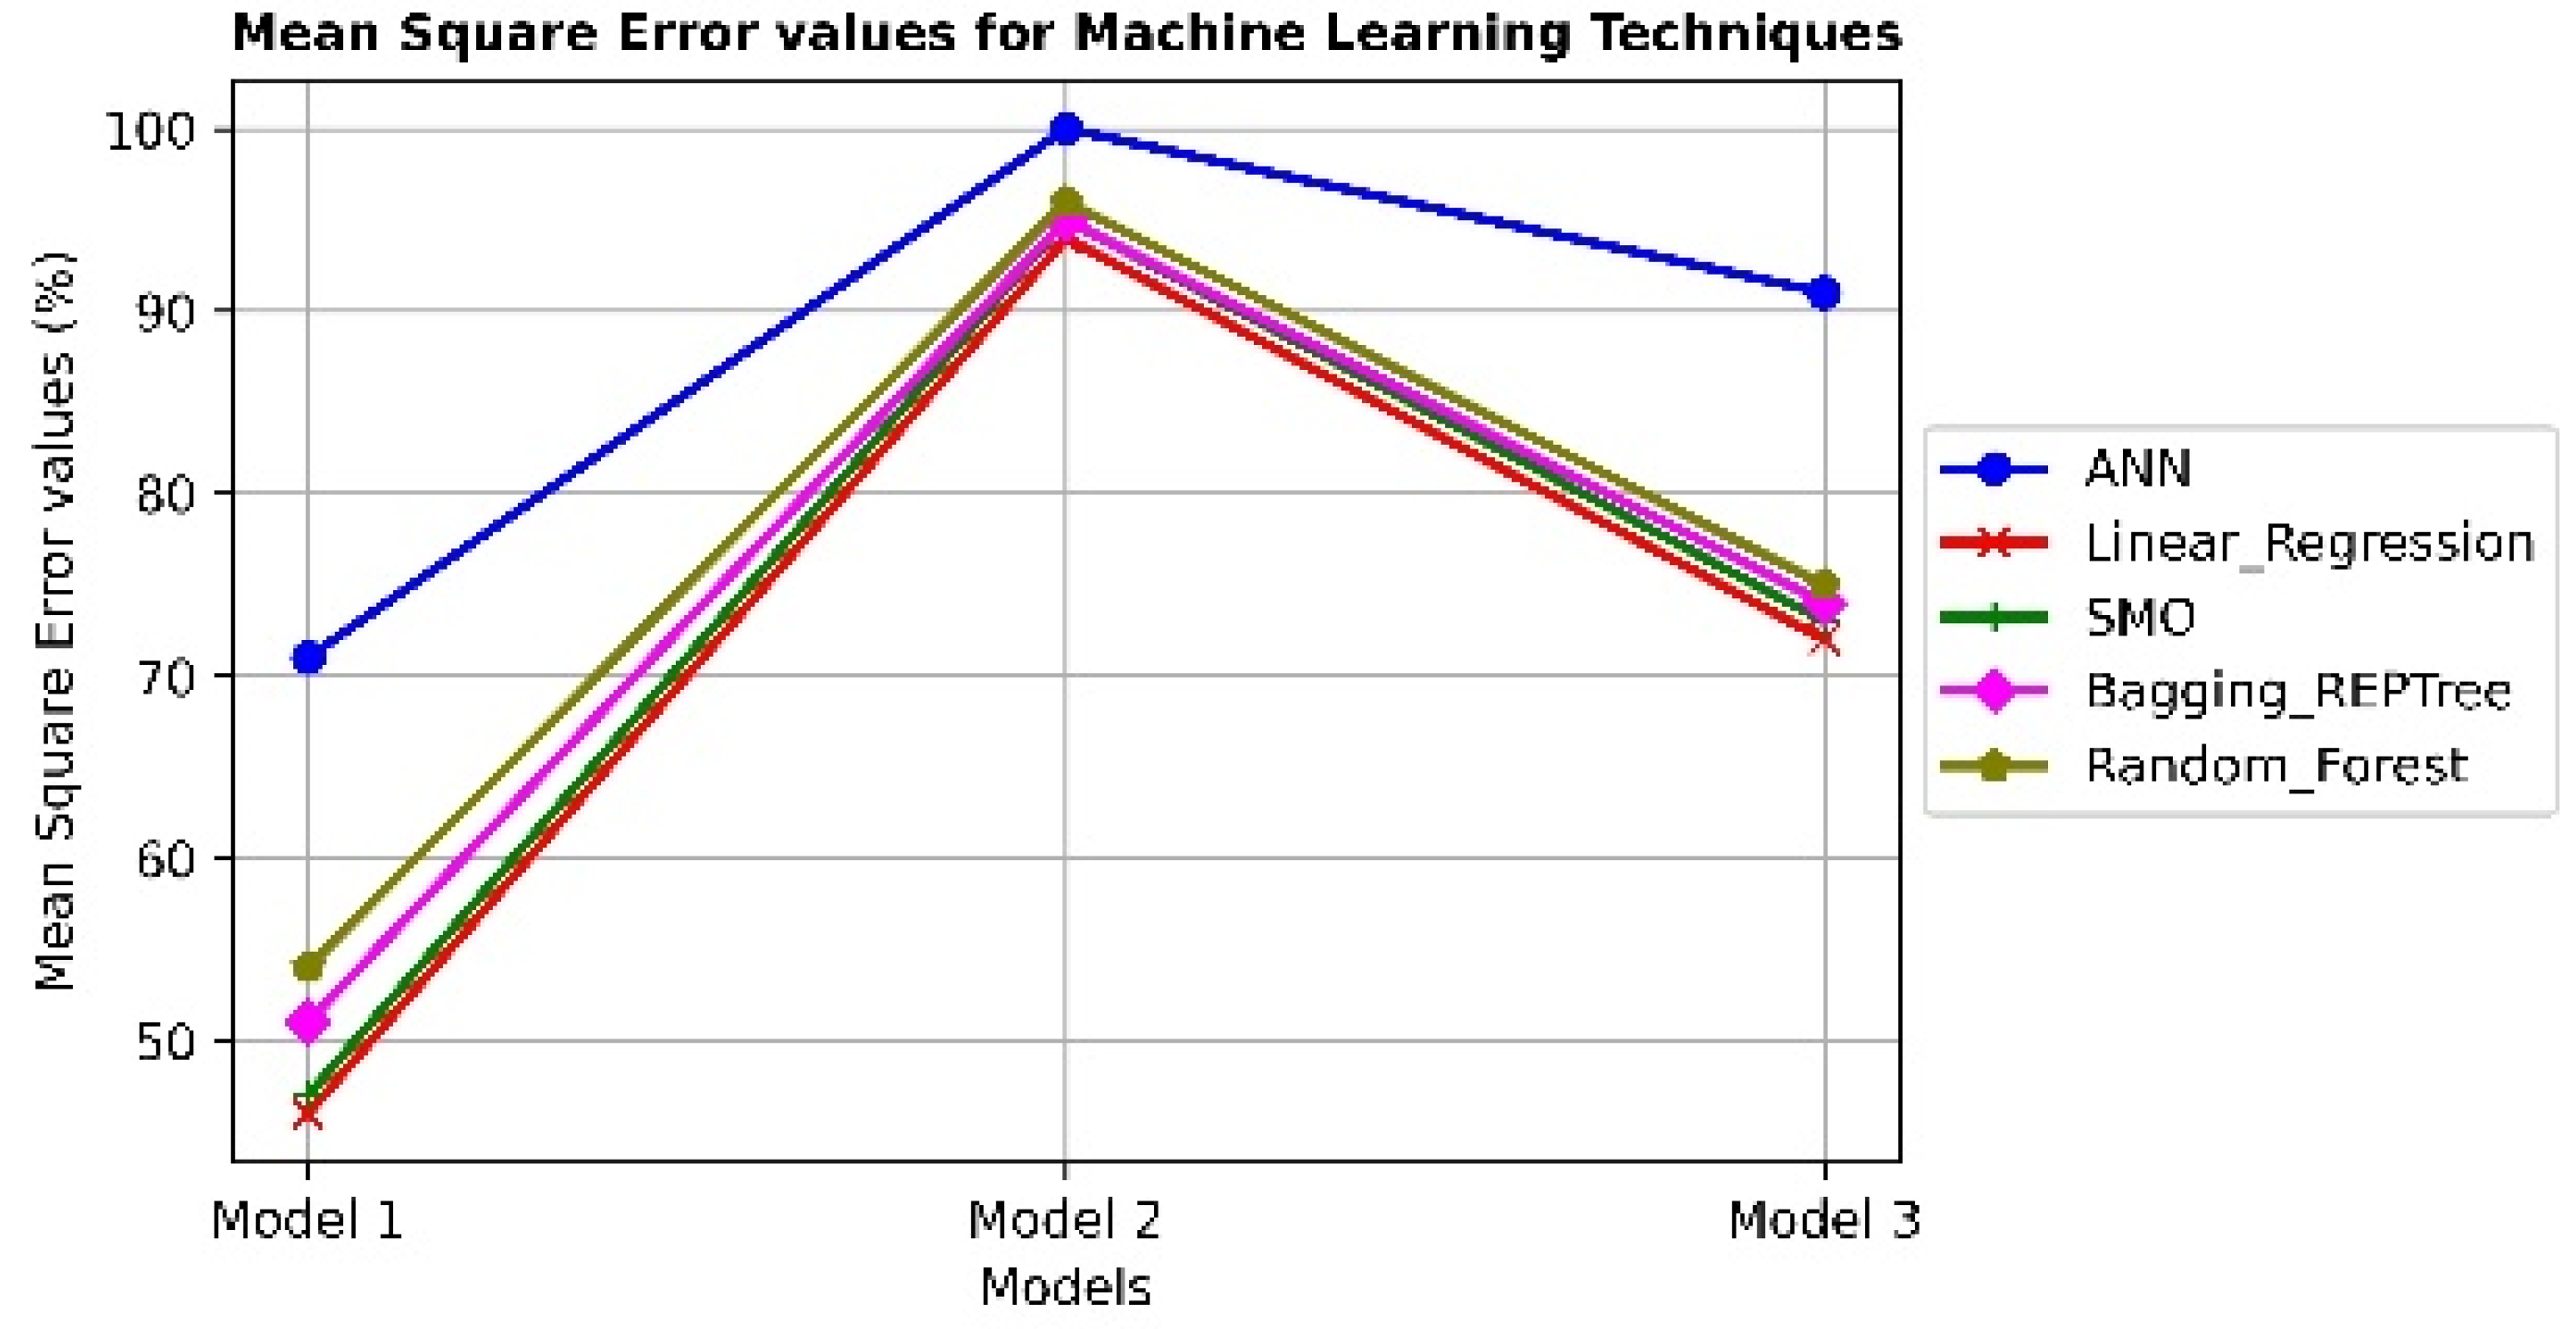
4.4. Machine Learning Techniques Validation and Prediction

Machine learning techniques have been used as modern technologies in different applications [93,94]. Further, other studies like [95,96,97,98,99,100,101] used such methods for triangulation method to validate and verify the results along with SEM. The research [102] used 19 machine learning techniques. Five Machine Learning (ML) classification techniques are evaluated in this study, which transform inherited data from a dataset’s input into the required output pattern [94,103]. The five ML models used to develop and evaluate models for the smartphone isolation dataset application are: Artificial Neural Network (ANN) [104], Linear Regression [105], Sequential Minimal Optimization algorithm (SMO) for Support Vector Machine (SVM) [106], Bagging using REPTree model [107], and Random Forest [108]. The ANN employs the back-propagation method to calculate the errors between the predicted and actual output values. The weights and bias parameters of the ANN design are then modified using the error to bring the predicted and actual values to be closer. The output of the linear regression model depends on the target labels and is a polynomial function with weighted coefficients for the independent variables. Through a sequence of actions, the training phase updates the linear function’s coefficients from the training dataset. The SMO method updates the weighted vectors of the SVM model using the Sequential Minimal Optimization algorithm. The SMO algorithm finds the minimal values in a sequence of iterative operations to reach the optimal values. The bagging technique constructs numerous REPTree models using a random sample of the training set’s instances and features, with the average value of the trees predicting the final value. The Random Forest (RF) is a set of connected decision tree (DT) models built by random attribute subsets for each sub-tree model and a random sampling of training data instances. The average value of the DT trees serves as the model’s final output.
The evaluation methodology follows 10-fold cross-validation technique to validate the effectiveness of the model to predict the target values. During the evaluation phase, the 10-fold cross-validation method is used. This method sequentially selects 10% of the dataset as testing and 90% as training (the remaining nine folds). We create a classifier model and assess how well it performs in each procedure. Then, a representation of the overall average performance is shown. By employing such a method, we ensure that the complete dataset is used during the training and testing stages, lowering the possibility of over-fitting. When the model successfully categorizes all the training data but is unable to fit the test sets, a problem arises.

ML Results and Discussion

Children who use smartphones for extended periods face two serious problems: smartphone addiction and social isolation. This study investigates a few aspects that influence the two problems and validates certain integration techniques. To understand the relationship between the factors (or inputs) and the problems, ML techniques as intelligent methods extract inherited meaningful information from datasets. However, to assess the performance of ML models, we need three datasets. The datasets are from model 1, which has BI as a dependent outcome and five parameters (PU, PEU, Trust, PE, and SI) as independent inputs. Model 2 dataset studies the influence of BI as input to SOA as a dependent variable. Model 3 of the dataset represents the impact of SOA on SI.
Figure 3 displays the experimental findings utilizing R2 and Mean Square Error (MSE) as evaluation metrics. The models are shown on the x-axis, and the R2 and MSE values are shown on the y-axis. The R2 shows the expected impact of the independent variables on the dependent variable (target). The MSE calculates, as in Figure 4, the average discrepancy between the predicted and actual output values of a model.
On three database models, the SMO and linear regression sequential models produce reasonable results, with R2 values of 65%, 20%, and 68%, respectively. The other ML techniques that are non-linear methods, such as ANN, Bagging REPTree, and Random Forest, obtain convergent results. The results show a weak relationship between the BI factor and smartphone addiction of 20% R2 and 95% MSE in model 2, which indicates that the intention of using smartphone by children provides less information to detect the addiction. In model 1, the five factors reflect how usability of smartphones affects the tendency of using its applications by the children and their parents with 65% R2 value and approximately 49% MSE value. Moreover, with the existence of smartphone addiction, social isolation inevitably occurred, which is indicated by the R2 value of 68% in model 3. The ML techniques as validation techniques are able to predict the actual target from the independent inputs and ensure the provided results.

5. Discussion

As stated in the introduction, the purpose of this study is to provide a better understanding and insight into the primary factors that impact children’s smartphone addictions (SPA), as well as the relationship between smartphone addiction (SPA) and social isolation (SocIso). The main empirical findings of this study show that most of the proposed model’s hypotheses have significant values. Consequently, the current study’s findings are consistent with previous literature and this study yielded several notable conclusions and findings.
As predicted, perceived usefulness was found to have a significant influence on Jordanian children’s and adolescents’ behavioral intentions to adopt and use smartphones. This may be related to the advantages and conveniences that children and adolescents gain from using smartphones, as stated by references [22,32,35,36,37] that individuals would be encouraged to use smartphones as long as they consider such technologies more useful and productive. On the other hand, perceived ease of use is an important factor that influences the intention to adopt and use smartphone technology [38]. The results of this study, from the perspective of parents, show that perceived ease of use has no influence on Jordanian children and adolescents’ behavioral intention to adopt and use a smartphone, which is in line with what has been found by studies [22,32,37].
Furthermore, the findings show that trust has a positive influence on the children’s and adolescents’ behavioral intentions to use smartphones, which is consistent with the previous results of the studies [22,32]. This means that parents have a positive perception of the consistency and reliability of smartphone applications, and they allow their children to use the smartphone freely. On the other hand, the findings of this study related to the trust variable are not compatible with the results of Tiwari et al. [41] as they stated that trust and privacy issues are the main reasons that more than 50% of smartphone owners claimed they do not adopt and use smartphone financial services.
While enjoyment motivation is considered an important factor in terms of individuals’ intention to adapt and use technologies [36,44,45,46], the study results show that perceived enjoyment has no influence related to children’s and adolescents’ behavioral intention to use a smartphone. Such results are inconsistent with the findings of the studies [32,36,50] which stated that perceived enjoyment influences individuals’ behavioral intention to adopt and use smartphone services, applications, and games. This means that even when children or adolescents feel that using the smartphone is not enjoyable, they will keep using it, according to how parents responded to the questionnaire.
As stated previously in this study, social influence is used to evaluate other people’s impacts on adopting and using the smartphone. The results show that social influence has a positive influence on the children’s behavioral intention to use smartphones, which confirms the findings of Baabdullah [54] and Shaw and Kesharwani [22] that showed the positive impact of social influence on the behavioral intention towards using smartphone applications and games.
Also, this study investigated the association between behavioral intention to use smartphones and smartphone addiction among Jordanian children and teenagers. The findings show that there is a link between behavioral intention and smartphone addiction, with behavioral intention having a positive influence on the smartphone addiction of children and adolescents. Such findings are in line with the results provided by Shaw and Kesharwani [2,22] which reported that smartphone addiction among children and teenagers needs immediate and urgent attention. Parents responded to the survey by saying that they would not recommend others to let their children use smartphones, as reported in the (BI4) item.
And finally, the main empirical result of this study investigates and detects the association between smartphone addiction and social isolation using items adapted from the Patient-Reported Outcomes Measurement Information System (PROMIS) [60], where most of the previous studies have been focused on internet addiction, but a comprehensive and detailed review of smartphone addiction is inadequate till now, even though smartphone addiction among children and teenagers has become a public and major problem for everyone [2,19,22,29]. The study findings prove that there is a positive association between smartphone addiction and social isolation among children and adolescents in Jordan, which is consistent with the results and findings of [25].
Also, the demography of this study shows that the respondents were male (72%). On the other hand, in the study proposed by Anderson et al. [62], researchers stated that most of the respondents were mothers. Also, we think that we must mention that we received a lot of messages from male parents (fathers) asking how they can solve the problem of smartphone addiction and social isolation, in addition to other messages asking about the results of the study and if the problem is a major problem in society. The study found that the gender of both child and respondent had no significance either in behavioral intention or in smartphone addiction and social isolation of children and adolescents in Jordan. The findings also show that there is a significant difference in the respondents’ behavioral intentions supportive of the respondent’s age, supportive of internet experience, and child age. Such results are in line with [61,63,64]. Also, there is a significant difference in the respondents’ social isolation supportive of both the number of children in the family and hours spent on smartphones, which is consistent with the findings of [62,67]. Moreover, there is a significant difference in both the respondents’ behavioral intention and smartphone addiction, which is supportive of the number of hours spent on smartphones, which is consistent with the results of [62].

5.1. Theoretical Implications

The purpose of this study was to investigate various independent, mediating, and moderating determinants that influence smartphone addiction and social isolation, and to detect the association between smartphone use, addiction, and social isolation among Jordanian children and teens. Many studies have been carried out to have a further and better understanding and knowledge of this critical issue, as mentioned in the introduction and the research hypothesis development sections, even though no research has been identified that incorporates all these factors into a single study of smartphone addiction and social isolation. Also, to date, attention has been focused on internet addiction, but a detailed investigation of smartphone addiction and the correlation between addiction and social isolation is lacking [2,22,25,29].
This study will add to the literature and the body of knowledge regarding the correlation between smartphone use, smartphone addiction, and social isolation. The study detected and discovered the effects of five independent components, with ten potential moderators on behavioral intention as intermediate factors, as well as smartphone addiction and social isolation. Moreover, the research included many moderating factors that are unique to such research, which are the children’s internet experience, time spent using smartphones, the number of children in the family, and parent education level.

5.2. Practical Implications

Children and teens are the primary users of smartphones, and their daily screen time is rapidly increasing at an early age, even with many recommendations to control and set a time for children and adolescents to use smartphones, since children and adolescents should use these devices as little as possible. Furthermore, studies have revealed that children and teenagers are more drawn to smartphones, as well as exhibiting more addictive behavioral signs and symptoms with them. Such technology highly affects youth behavior, and there is a positive association between smartphone addiction and social isolation.
Accordingly, smartphone addiction and social isolation among children and teenagers require immediate and urgent attention. The government should develop awareness programs to educate parents and children about the dangers of using smartphones and the related issues associated with smartphone addiction and social isolation. Moreover, the study findings show there is a significant difference in the parents’ behavioral intention supportive of the parents’ age, where parental control over children’s smartphone usage decreases as the age of the parent increases. Hence, the government should enable older parents by training and education about smartphone control programs and how to set a time limit and determine the applications and games that the children can install and use on their smartphones.
Furthermore, governments are responsible for developing social activities, camps, and other physical activities for children and adolescents.
On the other hand, parents must encourage their children and teenagers to join in such activities and socialize with their peers. Moreover, parents must not recommend others let their children use smartphones because of the addictive behavioral signs and symptoms associated with smartphone use, whereas real-life social interaction reduces social isolation.
The study’s findings could be utilized as resources for early diagnosis and detection of children and teens at risk of smartphone addiction and social isolation. In addition, they could be utilized to develop prevention programs to reduce smartphone overuse among children and teenagers. Also, the study findings provide valuable information. This can help and support a campaign against smartphone addiction, social isolation, and overuse.

5.3. Academic Implications

Based on the study’s findings, it contributes significantly to the literature investigating and detecting smartphone addiction and social isolation. The study model was developed using the TAM model, with the addition of trust, social influence, and perceived enjoyment. Furthermore, the findings show that the study model is robust and significantly interpretable, which contributes to the studies of smartphone adoption, addiction, and social isolation. Also, according to the proposed model and the findings of this study, researchers effectively presented and demonstrated a fundamental association between the impact of the determinants and technology addiction and social isolation. This significantly extends TAM’s theoretical purview to be used in future studies to improve the investigation of smartphone adoption, usage, technology addiction, and social isolation.

5.4. Limitations and Future Research

In this study, the researchers faced two main limitations. First, because the study was conducted on one of society’s most pressing issues, smartphone addiction and social isolation among children and teenagers, it was difficult to gain access to participants, even though several channels were used to increase the number of participants, such as WhatsApp groups, Facebook, etc. The researchers only gathered 511 responses. Another limitation was the underrepresentation in some of the demography categories: in marital status (divorced and widow) were 2% and 1% of the respondents. Respondent age groups (18–28) were 3%. Preferred SNS did not find much interest in LinkedIn and Twitter, since both intuitively relate more to adults rather than children.
Future research should investigate whether artificial intelligence (AI) ML methods can be used to investigate, predict, detect, and prevent children’s intentions to engage in smartphone addiction or social isolation behavior.
In this study the researchers tried five different methods: Artificial Neural Network (ANN), Linear Regression, Sequential Minimal Optimization algorithm (SMO) for Support Vector Machine (SVM), Bagging using REPTree model, and Random Forest, which distinguish this work. There are other ML methods that can be experimented with, such as k-NN, ID3, and Naïve Bayes.
Also, it would be worthwhile to study the impact of smartphone usage and addiction on children’s health and physical ability. Another suggestion for future work is to study the relationship between parents’ smartphone addiction and their children’s addiction. Furthermore, future studies must consider the smartphone overuse prevention models and study the effects of other smart devices and the relationships between such devices and technology addiction and social isolation. Also, they could study the association between smartphone addiction and children’s academic achievements. Finally, the proposed model can be expanded to include other constructs.

6. Conclusions

This research investigates the determinants that influence children’s smartphone addiction and the association between social isolation and smartphone addiction for people living in Jordan. The proposed model is developed using the original TAM model in addition to social influence, trust, and perceived enjoyment constructs. The collected study data were examined using structural equation modeling (SEM), machine learning (ML), and computational fluid dynamics (CFA). According to the respondents’ responses, the results showed that perceived usefulness, trust, and social influence were significant antecedents to behavioral intention to use the smartphone. Furthermore, the findings confirm that smartphone addiction positively influences social isolation among Jordanian children and adolescents, where the strength of these correlations is influenced by moderating variables, including respondent’s age, child internet experience, and child age, as well as the number of children in the family and hours spent on smartphones. On the other hand, perceived ease of use and perceived enjoyment did not have a significant effect on behavioral intention to use the smartphone among Jordanian children and adolescents.
Therefore, we conclude with the following intriguing conclusion: First, the results showed that parents think of smartphones as devices that can be useful and can be trusted for use by their children, and which have been adopted and used according to others’ recommendations, while the study shows that most of the children mainly follow YouTube for Kids (59%) and use games (25%), and that many (23%) of them use the internet more than 5 h per day. As mentioned in the literature, children who use smartphones for a long time exhibit addictive behavioral signs and other symptoms such as social isolation, which require immediate and urgent attention and suitable action and early treatment. Secondly, according to the study findings, parental control over children’s smartphone usage decreased as the age of the parent increased. Hence, older parents should be enabled by training and education about smartphone control programs and how to set a time limit and determine the applications and games that children can install and use on their smartphones. Third, parents must encourage their children to join different activities and socialize with their peers. Finally, this study contributes to the literature by empirically examining and theorizing the implications of smartphone addiction on social isolation.

Author Contributions

Conceptualization, E.M.A.-T. and I.A.; data curation, K.K., R.S.A. and A.A.; formal analysis, E.M.A.-T. and R.S.A.; investigation, I.A., S.K. and R.M.; methodology, I.A. and R.M.; project administration, I.A.; supervision, I.A. and R.M.; validation, E.M.A.-T.; visualization, E.M.A.-T.; writing—original draft, I.A. and R.S.A.; writing—review and editing, E.M.A.-T., K.K., S.K. and A.A. All authors have read and agreed to the published version of the manuscript.

Funding

This research received no external funding.

Institutional Review Board Statement

Not applicable.

Informed Consent Statement

Not applicable.

Data Availability Statement

Not applicable.

Conflicts of Interest

The authors declare no conflict of interest.

Appendix A

Table A1. Constructs and items.
ConstructsID: Items/Measure
Demographic Information
  • Respondent Gender
1. Male.
2. Female.
  • Respondent Age (years)
1: 18 to less than 28.
2: 28 to less than 38 years old.
3: 38 to less than 48 years old.
4: 48 to less than 58 years old.
5: 58 and over.
  • Respondent Educational Level
1. High school and less.
2: Diploma.
3: Bachelor.
4: Master.
5: Ph.D.
  • Respondent Marital Status
1. Married.
2. Divorced.
3. Widow.
  • Child Gender
1. Male.
2. Female.
  • Child Age (years)
1: 0 to less than 3 years old.
2: 3 to less than 6 years old.
3: 6 to less than 9 years old.
4: 9 to less than 12 years old.
5: 12 to less than 15 years old.
6: 15 to less than 17 years old.
  • Child’s Internet Experience
1. Low.
2: Good.
3: Excellent.
  • Number of Children in the Family
1. One.
2: Two.
3: Three.
4: Four.
5: Five and more.
  • Time Your Child Spends on the Smartphone (hours)
1. One.
2: Two.
3: Three.
4: Four.
5: Five and more.
  • Child’s School
1: Public.
2: Private.
3: UNRWA.
4: Not in school.
5: Nursery.
6: Preschool.
  • Which of the following is your child’s favorite social network or application that they use most of the time?
1: Facebook.
2: Twitter.
3: TikTok.
4: Snapchat.
5: LinkedIn.
6: YouTube.
7: Instagram.
8: Games.
9: YouTube Kids.
10: Other.
Perceived Usefulness (PU)PU1: Smartphones are useful in my child’s daily life.
PU2: Using a smartphone helps my child accomplish things (like studying) more quickly.
PU3: Using a smartphone increases my child’s educational levels.
PU4: Using a smartphone increases my child’s cultural levels.
PU5: Using a smartphone increases my child’s knowledge levels.
PU6: Using a smartphone increases my child’s chances of learning and achieving important things, including education, skills, and knowledge.
Perceived Ease of Use (PEU)PEoU1: Learning how to use a smartphone is easy for my child.
PEoU2: My child’s interaction with a smartphone is clear and understandable.
PEoU3: Smartphones are easy to use for my child.
PEoU4: It is easy for my child to become skillful at using smartphones.
Trust (TR)TR1: I believe that smartphones are trustworthy, so I let my child use them.
TR2: I do not doubt the honesty of smartphones.
TR3: I feel assured that legal and technological structures adequately protect my child from problems associated with using smartphones.
TR4: Even if not monitored, I would trust my child’s smartphone.
TR5: I trust the smartphone that my child is using.
Perceived Enjoyment (EN)EN1: My child feels that using a smartphone is fun.
EN2: My child feels that using a smartphone is enjoyable.
EN3: My child feels that using a smartphone is very entertaining.
Social Influence (SI)SI1: People I know think that my child should use a smartphone.
SI2: People who are important to me would recommend that my child use the smartphone.
SI3: People who are important think that my child should use a smartphone.
SI4: Everyone around me is thinking that my child should use a smartphone because their children are using smartphones.
Behavioral Intention (BI)BI1: I intend to let my child use the mobile phone in the future.
BI2: My child is using the smartphone, and he/she always tries to use it whenever he/she can at any time.
BI3: I plan to keep my child’s smartphone in use in the future.
BI4: I will recommend that others let their children use smartphones.
Smartphone Addiction (SPA)SPA1: My child sometimes ignores important things because of his/her interest in smartphones.
SPA2: My child often fails to get enough rest because of using a smartphone.
SPA3: My child’s social life has sometimes suffered because of using a smartphone.
SPA4: Arguments have sometimes arisen from people around me because of the time my child spends on smartphones.
SPA5: Using a smartphone has sometimes interfered with my child’s studying, playing, or social activities.
SPA6: My child is sometimes late for engagements (like studying) because of using smartphones.
SPA7: When my child is not using a smartphone, I feel that he/she often feels agitated and confused.
SPA8: I have made unsuccessful attempts to reduce the time my child uses a smartphone.
SPA9: I think that my child is addicted to smartphones.
Social Isolation (SocIso)SocIso1: I feel that even when children are around my child, they ignore him because he is busy using his smartphone.
SocIso2: I feel that other children avoid talking to my child because he is busy using a smartphone.
SocIso3: I feel that my child is isolated even if he is with other children because he is busy using his smartphone.
SocIso4: I feel that my child is isolated by others because he is busy using a smartphone
SocIso5: I feel that my child is isolated from others because he is busy using a smartphone.

References

  1. Schüz, J. Mobile Phone Use and Exposures in Children. Bioelectromagnetics 2005, 26, S45–S50. [Google Scholar] [CrossRef] [PubMed]
  2. Sahu, M.; Gandhi, S.; Sharma, M.K. Mobile Phone Addiction among Children and Adolescents. J. Addict. Nurs. 2019, 30, 261–268. [Google Scholar] [CrossRef] [PubMed]
  3. Ihm, J. Social Implications of Children’s Smartphone Addiction: The Role of Support Networks and Social Engagement. J. Behav. Addict. 2018, 7, 473–481. [Google Scholar] [CrossRef] [PubMed]
  4. Wu, J.; Siu, A.C.K. Problematic Mobile Phone Use by Hong Kong Adolescents. Front. Psychol. 2020, 11, 551804. [Google Scholar] [CrossRef]
  5. Samaha, M.; Hawi, N.S. Associations between Screen Media Parenting Practices and Children’s Screen Time in Lebanon. Telemat. Inform. 2017, 34, 351–358. [Google Scholar] [CrossRef]
  6. Christakis, D.A.; Zimmerman, F.J. Violent Television Viewing during Preschool Is Associated with Antisocial Behavior during School Age. Pediatrics 2007, 120, 993–999. [Google Scholar] [CrossRef]
  7. Øverby, N.C.; Klepp, K.-I.; Bere, E. Changes in Screen Time Activity in Norwegian Children from 2001 to 2008: Two Cross Sectional Studies. BMC Public Health 2013, 13. [Google Scholar] [CrossRef]
  8. Plowman, L.; McPake, J.; Stephen, C. The Technologisation of Childhood? Young Children and Technology in the Home. Child. Soc. 2010, 24, 63–74. [Google Scholar] [CrossRef]
  9. Bertschek, I.; Niebel, T. Mobile and More Productive? Firm-Level Evidence on the Productivity Effects of Mobile Internet Use. Telecommun. Policy 2016, 40, 888–898. [Google Scholar] [CrossRef]
  10. Lee, K.Y.; Lee, M.; Kim, K. Are Smartphones Helpful? An Empirical Investigation of the Role of Smartphones in Users’ Role Performance. Int. J. Mob. Commun. 2017, 15, 119. [Google Scholar] [CrossRef]
  11. Abu-Taieh, E.; AlHadid, I.; Masa’deh, R.; Alkhawaldeh, R.S.; Khwaldeh, S.; Alrowwad, A. Factors Influencing YouTube as a Learning Tool and Its Influence on Academic Achievement in a Bilingual Environment Using Extended Information Adoption Model (IAM) with ML Prediction—Jordan Case Study. Appl. Sci. 2022, 12, 5856. [Google Scholar] [CrossRef]
  12. Masa’deh, R.; AlHadid, I.; Abu-Taieh, E.; Khwaldeh, S.; Alrowwad, A.; Alkhawaldeh, R.S. Factors Influencing Students’ Intention to Use E-Textbooks and Their Impact on Academic Achievement in Bilingual Environment: An Empirical Study Jordan. Information 2022, 13, 233. [Google Scholar] [CrossRef]
  13. George, T.P.; DeCristofaro, C. Use of Smartphones with Undergraduate Nursing Students. J. Nurs. Educ. 2016, 55, 411–415. [Google Scholar] [CrossRef]
  14. Remón, J.; Sebastián, V.; Romero, E.; Arauzo, J. Effect of Using Smartphones as Clickers and Tablets as Digital Whiteboards on Students’ Engagement and Learning. Act. Learn. Higher Educ. 2017, 18, 173–187. [Google Scholar] [CrossRef]
  15. Kim, Y.; Wang, Y.; Oh, J. Digital Media Use and Social Engagement: How Social Media and Smartphone Use Influence Social Activities of College Students. Cyberpsychol. Behav. Soc. Netw. 2016, 19, 264–269. [Google Scholar] [CrossRef]
  16. O’Connor, T.M.; Hingle, M.; Chuang, R.-J.; Gorely, T.; Hinkley, T.; Jago, R.; Lanigan, J.; Pearson, N.; Thompson, D.A. Conceptual Understanding of Screen Media Parenting: Report of a Working Group. Child. Obes. 2013, 9, S-110–S-118. [Google Scholar] [CrossRef]
  17. Tremblay, M.S.; Colley, R.C.; Saunders, T.J.; Healy, G.N.; Owen, N. Physiological and Health Implications of a Sedentary Lifestyle. Appl. Physiol. Nutr. Metab. 2010, 35, 725–740. [Google Scholar] [CrossRef]
  18. Strasburger, V.C.; Jordan, A.B.; Donnerstein, E. Health Effects of Media on Children and Adolescents. Pediatrics 2010, 125, 756–767. [Google Scholar] [CrossRef]
  19. Hawi, N.S.; Samaha, M. Relationships among Smartphone Addiction, Anxiety, and Family Relations. Behav. Inf. Technol. 2017, 36, 1046–1052. [Google Scholar] [CrossRef]
  20. Al-Barashdi, H.; Bouazza, A.; Jabur, N. Smartphone Addiction among University Undergraduates: A Literature Review. J. Sci. Res. Rep. 2015, 4, 210–225. [Google Scholar] [CrossRef]
  21. Tang, Y.-Y.; Posner, M.I.; Rothbart, M.K.; Volkow, N.D. Circuitry of Self-Control and Its Role in Reducing Addiction. Trends Cogn. Sci. 2015, 19, 439–444. [Google Scholar] [CrossRef] [PubMed]
  22. Shaw, B.; Kesharwani, A. Moderating Effect of Smartphone Addiction on Mobile Wallet Payment Adoption. J. Internet Commer. 2019, 18, 291–309. [Google Scholar] [CrossRef]
  23. Elhai, J.D.; Levine, J.C.; Hall, B.J. The Relationship between Anxiety Symptom Severity and Problematic Smartphone Use: A Review of the Literature and Conceptual Frameworks. J. Anxiety Disord. 2019, 62, 45–52. [Google Scholar] [CrossRef] [PubMed]
  24. Kim, D.; Lee, J. Addictive Internet Gaming Usage among Korean Adolescents before and after the Outbreak of the COVID-19 Pandemic: A Comparison of the Latent Profiles in 2018 and 2020. Int. J. Environ. Res. Public Health 2021, 18, 7275. [Google Scholar] [CrossRef] [PubMed]
  25. Al-Kandari, Y.Y.; Al-Sejari, M.M. Social Isolation, Social Support and Their Relationship with Smartphone Addiction. Inf. Commun. Soc. 2020, 24, 1925–1943. [Google Scholar] [CrossRef]
  26. Rotondi, V.; Stanca, L.; Tomasuolo, M. Connecting Alone: Smartphone Use, Quality of Social Interactions and Well-Being. J. Econ. Psychol. 2017, 63, 17–26. [Google Scholar] [CrossRef]
  27. Choliz, M. Mobile-phone addiction in adolescence: The test of mobile phone dependence (TMD). Prog. Health Sci. 2012, 2, 33–44. [Google Scholar]
  28. Bhardwaj, M.; Ashok, S. Mobile Phone Addiction and Loneliness among Teenagers. Int. J. Indian Psychol. 2015, 2. [Google Scholar] [CrossRef]
  29. Meshi, D.; Ellithorpe, M. Problematic Social Media Use and Social Support Received in Real-Life versus on social media: Associations with Depression, Anxiety and Social Isolation. Addic. Behav. 2021, 119, 106949. [Google Scholar] [CrossRef]
  30. Siau, K.; Shen, Z. Building Customer Trust in Mobile Commerce. Commun. ACM 2003, 46, 91–94. [Google Scholar] [CrossRef]
  31. Gefen, D.; Karahanna, E.; Straub, D.W. Trust and TAM in Online Shopping: An Integrated Model. MIS Q. 2003, 27, 51–90. [Google Scholar] [CrossRef]
  32. Alalwan, A.A.; Baabdullah, A.M.; Rana, N.P.; Tamilmani, K.; Dwivedi, Y.K. Examining Adoption of Mobile Internet in Saudi Arabia: Extending TAM with Perceived Enjoyment, Innovativeness and Trust. Technol. Soc. 2018, 55, 100–110. [Google Scholar] [CrossRef]
  33. Maqableh, M.; Abuhashesh, M.; Dahabiyeh, L.; Nawayseh, M.K.A.; Masa’deh, R. The Effect of Facebook Users’ Satisfaction and Trust on Stickiness: The Role of Perceived Values. Int. J. Data Netw. Sci. 2021, 5, 245–256. [Google Scholar] [CrossRef]
  34. Davis, F.D.; Bagozzi, R.P.; Warshaw, P.R. User Acceptance of Computer Technology: A Comparison of Two Theoretical Models. Manag. Sci. 1989, 35, 982–1003. [Google Scholar] [CrossRef]
  35. Cheng, Y.-H.; Huang, T.-Y. High Speed Rail Passengers’ Mobile Ticketing Adoption. Transp. Res. Part C: Emerg. Technol. 2013, 30, 143–160. [Google Scholar] [CrossRef]
  36. Park, E.; Baek, S.; Ohm, J.; Chang, H.J. Determinants of Player Acceptance of Mobile Social Network Games: An Application of Extended Technology Acceptance Model. Telemat. Inf. 2014, 31, 3–15. [Google Scholar] [CrossRef]
  37. Zarmpou, T.; Saprikis, V.; Markos, A.; Vlachopoulou, M. Modeling Users’ Acceptance of Mobile Services. Electron. Commer. Res. 2012, 12, 225–248. [Google Scholar] [CrossRef]
  38. Hanafizadeh, P.; Behboudi, M.; Abedini Koshksaray, A.; Jalilvand Shirkhani Tabar, M. Mobile-Banking Adoption by Iranian Bank Clients. Telemat. Inf. 2014, 31, 62–78. [Google Scholar] [CrossRef]
  39. Morgan, R.M.; Hunt, S.D. The Commitment-Trust Theory of Relationship Marketing. J. Mark. 1994, 58, 20–38. [Google Scholar] [CrossRef]
  40. De Wulf, K.; Odekerken-Schröder, G.; Iacobucci, D. Investments in Consumer Relationships: A Cross-Country and Cross-Industry Exploration. J. Mark. 2001, 65, 33–50. [Google Scholar] [CrossRef]
  41. Tiwari, P.; Tiwari, S.K.; Gupta, A. Examining the Impact of Customers’ Awareness, Risk and Trust in M-Banking Adoption. FIIB Bus. Rev. 2021, 10, 413–423. [Google Scholar] [CrossRef]
  42. Zhang, T.; Lu, C.; Kizildag, M. Banking “On-The-Go”: Examining Consumers’ Adoption of Mobile Banking Services. Int. J. Int. J. Qual. Serv. Sci. 2018, 10, 279–295. [Google Scholar] [CrossRef]
  43. Abdus Salam, M.; Saha, T.; Habibur Rahman, M.; Mutsuddi, P. Challenges to Mobile Banking Adaptation in COVID-19 Pandemic. J. Bus. Manag. Sci. 2021, 9, 101–113. [Google Scholar] [CrossRef]
  44. Bruner, G.C.; Kumar, A. Explaining Consumer Acceptance of Handheld Internet Devices. J. Bus. Res. 2005, 58, 553–558. [Google Scholar] [CrossRef]
  45. Zhang, J.; Mao, E. Understanding the Acceptance of Mobile SMS Advertising among Young Chinese Consumers. Psychol. Mark. 2008, 25, 787–805. [Google Scholar] [CrossRef]
  46. FANG, X.; CHAN, S.; BRZEZINSKI, J.; XU, S. Moderating Effects of Task Type on Wireless Technology Acceptance. J. Manag. Inf. Syst. 2005, 22, 123–157. [Google Scholar] [CrossRef]
  47. Alalwan, A.A.; Dwivedi, Y.K.; Rana, N.P. Factors Influencing Adoption of Mobile Banking by Jordanian Bank Customers: Extending UTAUT2 with Trust. Int. J. Inf. Manag. 2017, 37, 99–110. [Google Scholar] [CrossRef]
  48. Chong, A.Y.-L. Predicting M-Commerce Adoption Determinants: A Neural Network Approach. Expert Syst. Appl. 2013, 40, 523–530. [Google Scholar] [CrossRef]
  49. Dai, H.; Palvi, P.C. Mobile Commerce Adoption in China and the United States. ACM SIGMIS Database 2009, 40, 43. [Google Scholar] [CrossRef]
  50. Yang, Q.; Gong, X. The Engagement–Addiction Dilemma: An Empirical Evaluation of Mobile User Interface and Mobile Game Affordance. Internet Res. 2021; ahead-of-print. [Google Scholar] [CrossRef]
  51. Venkatesh, V.; Morris, M.G.; Davis, G.B.; Davis, F.D. User Acceptance of Information Technology: Toward a Unified View. MIS Q. 2003, 27, 425–478. [Google Scholar] [CrossRef] [Green Version]
  52. Camilleri, M.A. The Online Users’ Perceptions toward Electronic Government Services. J. Inf. Commun. Ethics Soc. 2019; ahead-of-print. [Google Scholar] [CrossRef]
  53. Venkatesh, V.; Thong, J.Y.L.; Xu, X. Consumer Acceptance and Use of Information Technology: Extending the Unified Theory of Acceptance and Use of Technology. MIS Q. 2012, 36, 157. [Google Scholar] [CrossRef]
  54. Baabdullah, A.M. Consumer Adoption of Mobile Social Network Games (M-SNGs) in Saudi Arabia: The Role of Social Influence, Hedonic Motivation and Trust. Technol. Soc. 2018, 53, 91–102. [Google Scholar] [CrossRef]
  55. Alalwan, A.A.; Dwivedi, Y.K.; Rana, N.P.; Lal, B.; Williams, M.D. Consumer Adoption of Internet Banking in Jordan: Examining the Role of Hedonic Motivation, Habit, Self-Efficacy and Trust. J. Financ. Serv. Mark. 2015, 20, 145–157. [Google Scholar] [CrossRef]
  56. Dwivedi, Y.K.; Rana, N.P.; Janssen, M.; Lal, B.; Williams, M.D.; Clement, M. An Empirical Validation of a Unified Model of Electronic Government Adoption (UMEGA). Gov. Inf. Q. 2017, 34, 211–230. [Google Scholar] [CrossRef]
  57. Kapoor, K.; Dwivedi, Y.; Piercy, N.C.; Lal, B.; Weerakkody, V. RFID Integrated Systems in Libraries: Extending TAM Model for Empirically Examining the Use. J. Enterp. Inf. Manag. 2014, 27, 731–758. [Google Scholar] [CrossRef]
  58. Dwivedi, Y.K.; Rana, N.P.; Jeyaraj, A.; Clement, M.; Williams, M.D. Re-Examining the Unified Theory of Acceptance and Use of Technology (UTAUT): Towards a Revised Theoretical Model. Inf. Syst. Front. 2017, 21, 719–734. [Google Scholar] [CrossRef]
  59. Ofir Turel, Alexander Serenko and Paul Giles, Integrating Technology Addiction and Use: An Empirical Investigation of Online Auction Users. MIS Q. 2011, 35, 1043. [CrossRef]
  60. Cella, D.; Yount, S.; Rothrock, N.; Gershon, R.; Cook, K.; Reeve, B.; Ader, D.; Fries, J.F.; Bruce, B.; Rose, M. The Patient-Reported Outcomes Measurement Information System (PROMIS). Med. Care 2007, 45 (Suppl. S1), S3–S11. [Google Scholar] [CrossRef]
  61. Horzum, M.B. Examining Computer Game Addiction Level of Primary School Students in Terms of Different Variables. Educ. Sci. 2011, 36, 56–68. Available online: https://hdl.handle.net/20.500.12619/44122 (accessed on 1 July 2022).
  62. Anderson, S.E.; Economos, C.D.; Must, A. Active Play and Screen Time in US Children Aged 4 to 11 Years in Relation to Sociodemographic and Weight Status Characteristics: A Nationally Representative Cross-Sectional Analysis. BMC Public Health 2008, 8, 366. [Google Scholar] [CrossRef] [PubMed] [Green Version]
  63. Duch, H.; Fisher, E.M.; Ensari, I.; Harrington, A. Screen Time Use in Children under 3 Years Old: A Systematic Review of Correlates. Int. J. Behav. Nutr. Phys. Act. 2013, 10, 102. [Google Scholar] [CrossRef]
  64. Selvi, H.; Horzum, M.B.; Üngören, Y. Investigation of High School Students’ Internet Parental Styles in Relation with Several Variables. Int. J. Psychol. Educ. Stud. 2019, 6, 51–58. [Google Scholar] [CrossRef]
  65. Roser, K.; Schoeni, A.; Foerster, M.; Röösli, M. Problematic Mobile Phone Use of Swiss Adolescents: Is It Linked with Mental Health or Behaviour? Int. J. Public Health 2015, 61, 307–315. [Google Scholar] [CrossRef] [PubMed]
  66. Park, S.K.; Kim, J.Y.; Cho, C.B. Prevalence of Internet addiction and correlations with family factors among South Korean adolescents. Adolescence 2008, 43, 895–909. [Google Scholar]
  67. Aktürk, Ü.; Budak, F.; Gültekin, A.; Özdemir, A. Comparison of Smartphone Addiction and Loneliness in High School and University Students. Perspect. Psychiatr. Care 2018, 54, 564–570. [Google Scholar] [CrossRef]
  68. Chung, N. Korean Adolescent Girls’ Addictive Use of Mobile Phones to Maintain Interpersonal Solidarity. Soc. Behav. Pers. Int. J. 2011, 39, 1349–1358. [Google Scholar] [CrossRef]
  69. Ezoe, S.; Toda, M.; Yoshimura, K.; Naritomi, A.; Den, R.; Morimoto, K. Relationships of Personality and Lifestyle with Mobile Phone Dependence among Female Nursing Students. Soc. Behav. Pers. Int. J. 2009, 37, 231–238. [Google Scholar] [CrossRef]
  70. Gallimberti, L.; Buja, A.; Chindamo, S.; Terraneo, A.; Marini, E.; Rabensteiner, A.; Vinelli, A.; Perez, L.J.G.; Baldo, V. Problematic Cell Phone Use for Text Messaging and Substance Abuse in Early Adolescence (11- to 13-Year-Olds). Eur. J. Pediatrics 2015, 175, 355–364. [Google Scholar] [CrossRef]
  71. “QRF,” Curriculum and student Assessment in Jordan. 2017. Available online: https://www.qrf.org/sites/default/files/2019-05/curriculum_and_student_assessment_brief_en_condensed.pdf (accessed on 17 June 2022).
  72. Hill, I. The International Baccalaureate. J. Res. Int. Educ. 2002, 1, 183–211. [Google Scholar] [CrossRef]
  73. Njie, B.; Asimiran, S. A Review of the Philosophy of International Education in an International School Setting. IOSR J. Res. Method iEduc. (IOSR-JRME) 2018, 8, 25–32. [Google Scholar] [CrossRef]
  74. Yongqiang, S.; Yang, Z.; Shi-Qi, J.; Ding-Yi, Z. Understanding the Antecedents of Mobile Game Addiction: The Roles of Perceived Visibility, Perceived Enjoyment and Flow. In Proceedings of the Pacific Asia Conference on Information Systems (PACIS), Singapore, 5–9 July 2015. [Google Scholar]
  75. Sanz-Blas, S.; Buzova, D.; Miquel-Romero, M.J. From Instagram Overuse to Instastress and Emotional Fatigue: The Mediation of Addiction. Spanish J. Mark. —ESIC 2019, 23, 143–161. [Google Scholar] [CrossRef] [Green Version]
  76. Pallant, J. SPSS Survival Manual; Routledge: New York, USA, 2020. [Google Scholar] [CrossRef]
  77. Sekaran, U.; Bougie, R. Research Methods for Business: A Skill-Building Approach, 7th ed.; John Wiley & Sons: Chichester, UK, 2016. [Google Scholar]
  78. Bagozzi, R.P.; Yi, Y. On the Evaluation of Structural Equation Models. J. Acad. Mark Sci. 1988, 16, 74–94. [Google Scholar] [CrossRef]
  79. Hair, J.F.; Black, W.C.; Babin, B.J.; Anderson, R.E. Multivariate Data Analysis, 8th ed.; Cengage: Andover, UK, 2019. [Google Scholar]
  80. Kline, R.B. Principles, and Practice of Structural Equation Modeling, 4th ed.; The Guilford Press: New York, NY, USA; London, UK, 2016. [Google Scholar]
  81. Creswell, J.W. Research Design: Qualitative, Quantitative, and Mixed Methods Approach, 3rd ed.; Sage: Los Angeles, CA, USA, 2013. [Google Scholar]
  82. Marsh, H.W.; Hocevar, D. The Factorial Invariance of Student Evaluations of College Teaching. Am. Educ. Res. J. 1984, 21, 341–366. [Google Scholar] [CrossRef]
  83. Hu, L.; Bentler, P.M. Cutoff Criteria for Fit Indexes in Covariance Structure Analysis: Conventional Criteria versus New Alternatives. Struct. Equ. Modeling Multidiscip. J. 1999, 6, 1–55. [Google Scholar] [CrossRef]
  84. West, R.F.; Meserve, R.J.; Stanovich, K.E. Cognitive Sophistication Does Not Attenuate the Bias Blind Spot. J. Pers. Soc. Psychol. 2012, 103, 506–519. [Google Scholar] [CrossRef]
  85. Bentler, P.M.; Bonett, D.G. Significance Tests and Goodness of Fit in the Analysis of Covariance Structures. Psychol. Bull. 1980, 88, 588–606. [Google Scholar] [CrossRef]
  86. Schriesheim, C.A.; James, L.R.; Muliak, S.A.; Brett, J.M. Causal Analysis: Assumptions, Models, and Data. Acad. Manag. Rev. 1984, 9, 159. [Google Scholar] [CrossRef]
  87. Meyers, L.S.; Gamst, G.; Guarino, A.J. Applied Multivariate Research; Sage Publications: Los Angeles, CA, USA, 2005. [Google Scholar]
  88. MacCallum, R.C.; Browne, M.W.; Sugawara, H.M. Power Analysis and Determination of Sample Size for Covariance Structure Modeling. Psychol. Methods 1996, 1, 130–149. [Google Scholar] [CrossRef]
  89. Bentler, P.M. Comparative Fit Indexes in Structural Models. Psychol. Bull. 1990, 107, 238–246. [Google Scholar] [CrossRef] [PubMed]
  90. Heckler, C.E. A Step-By-Step Approach to Using the SASTM System for Factor Analysis and Structural Equation Modeling. Technometrics 1996, 38, 296–297. [Google Scholar] [CrossRef]
  91. Byrne, B.M. Structural Equation Modeling With AMOS: Basic Concepts, Applications, and Programming, 3rd ed.; Routledge: New York, USA, 2016. [Google Scholar] [CrossRef]
  92. Henseler, J.; Ringle, C.M.; Sarstedt, M. A New Criterion for Assessing Discriminant Validity in Variance-Based Structural Equation Modeling. J. Acad. Mark. Sci. 2015, 43, 115–135. [Google Scholar] [CrossRef]
  93. Alkhawaldeh, R.S. DGR: Gender Recognition of Human Speech Using One-Dimensional Conventional Neural Network. Sci. Program. 2019, 2019, 1–12. [Google Scholar] [CrossRef]
  94. Alkhawaldeh, R.S.; Khawaldeh, S.; Pervaiz, U.; Alawida, M.; Alkhawaldeh, H. NIML: Non-Intrusive Machine Learning-Based Speech Quality Prediction on VoIP Networks. IET Commun. 2019, 13, 2609–2616. [Google Scholar] [CrossRef]
  95. Zobair, K.M.; Sanzogni, L.; Houghton, L.; Islam, Z. Forecasting Care Seekers Satisfaction with Telemedicine Using Machine Learning and Structural Equation Modeling. PLoS ONE 2021, 16, e0257300. [Google Scholar] [CrossRef]
  96. Wong, W.E.J.; Chan, S.P.; Yong, J.K.; Tham, Y.Y.S.; Lim, J.R.G.; Sim, M.A.; Soh, C.R.; Ti, L.K.; Chew, T.H.S. Assessment of Acute Kidney Injury Risk Using a Machine-Learning Guided Generalized Structural Equation Model: A Cohort Study. BMC Nephrol. 2021, 22, 1–8. [Google Scholar] [CrossRef]
  97. Li, J.; Sawaragi, T.; Horiguchi, Y. Introduce Structural Equation Modelling to Machine Learning Problems for Building an Explainable and Persuasive Model. SICE J. Control Meas. Syst. Integr. 2021, 14, 67–79. [Google Scholar] [CrossRef]
  98. Basha, A.M.; Rajaiah, M.; Penchalaiah, P.; Kamal, C.R.; Rao, B.N. Machine Learning-Structural Equation Modeling Algorithm:The Moderating role of Loyalty on Customer Retention towards Online Shopping. Int. J. 2020, 8, 1578–1585. [Google Scholar]
  99. Elnagar, A.; Alnazzawi, N.; Afyouni, I.; Shahin, I.; Bou Nassif, A.; Salloum, S.A. Prediction of the Intention to Use a Smartwatch: A Comparative Approach Using Machine Learning and Partial Least Squares Structural Equation Modeling. Inf. Med. Unlocked 2022, 29, 100913. [Google Scholar] [CrossRef]
  100. Sujith, A.V.L.N.; Qureshi, N.I.; Dornadula, V.H.R.; Rath, A.; Prakash, K.B.; Singh, S.K. A Comparative Analysis of Business Machine Learning in Making Effective Financial Decisions Using Structural Equation Model (SEM). J. Food Qual. 2022, 2022, 1–7. [Google Scholar] [CrossRef]
  101. Li, J.; Horiguchi, Y.; Sawaragi, T. Data Dimensionality Reduction by Introducing Structural Equation Modeling to Machine Learning Problems. In Proceedings of the 2020 59th Annual Conference of the Society of Instrument and Control Engineers of Japan (SICE) 2020, Chiang Mai, Thailand, 23–26 September 2020. [Google Scholar] [CrossRef]
  102. Thakur, N.; Han, C.Y. A Study of Fall Detection in Assisted Living: Identifying and Improving the Optimal Machine Learning Method. J. Sens. Actuator Netw. 2021, 10, 39. [Google Scholar] [CrossRef]
  103. Witten, I.H.; Frank, E.; Hall, M.A.; Pal, C.J. Data Mining, Fourth Edition: Practical Machine Learning Tools and Techniques, 4th ed.; Morgan Kaufmann Publishers Inc.: San Francisco, CA, USA, 2016. [Google Scholar]
  104. Da Silva, I.N.; Hernane Spatti, D.; Andrade Flauzino, R.; Liboni, L.H.B.; dos Reis Alves, S.F. Artificial Neural Network Architectures and Training Processes. Artif. Neural Netw. 2016, 21–28. [Google Scholar] [CrossRef]
  105. Yao, W.; LI, L. A New Regression Model: Modal Linear Regression. Scand. J. Stat. 2014, 41, 656–671. [Google Scholar] [CrossRef]
  106. Platt, J. Sequential Minimal Optimization: A Fast Algorithm for Training Support Vector Machines; Microsoft: Redmond, WA, USA, 1998. [Google Scholar]
  107. Breiman, L. Bagging predictors. Mach. Learn. 1996, 24, 123–140. [Google Scholar] [CrossRef] [Green Version]
  108. Tasin, T.; Habib, M.A. Computer-Aided Cataract Detection Using Random Forest Classifier. In Proceedings of the International Conference on Big Data, IoT, and Machine Learning, Sydney, NSW, Australia, 22–23 October 2022; Springer: Berlin/Heidelberg, Germany, 2022; pp. 27–38. [Google Scholar]
Figure 1. Proposed Model.
Bdcc 06 00092 g001
Figure 2. Model with coefficient estimates, R squared.
Bdcc 06 00092 g002
Figure 3. The results of (R2) using ML techniques on Social Isolation dataset.
Bdcc 06 00092 g003
Figure 4. The results of (MSE) using ML techniques on Social Isolation dataset.
Bdcc 06 00092 g004
Table 1. Respondents’ demography.
Respondent Education (Parent)FemaleMaleGrand Total
High school/less than high school7(1%)4(1%)11(2%)
Diploma23(5%)95(19%)118(23%)
B.Sc.82(16%)185(36%)267(52%)
Master21(4%)44(9%)65(13%)
Ph.D.11(2%)39(8%)50(10%)
Grand Total144(28%)367(72%)511(100%)
Respondent Age (Parent)
18–28 years8(2%)8(2%)16(3%)
28–38 years55(11%)161(32%)216(42%)
38–48 years57(11%)157(31%)214(42%)
48–58 years20(4%)35(7%)55(11%)
Greater than 58 years4(1%)6(1%)10(2%)
Grand Total144(28%)367(72%)511(100%)
Respondent Marital Status (Parent)
Divorced7(1%)5(1%)12(2%)
Married135(26%)360(70%)495(97%)
Widow2(0%)2(0%)4(1%)
Grand Total144(28%)367(72%)511(100%)
Child Age
0–3 years41(8%)17(3%)58(11%)
3–6 years110(22%)53(10%)163(32%)
6–9 years66(13%)35(7%)101(20%)
9–12 years57(11%)32(6%)89(17%)
12–15 years42(8%)26(5%)68(13%)
15–17 years21(4%)11(2%)32(6%)
Grand Total337(66%)174(34%)511(100%)
Internet Experience (Child)
Excellent116(23%)69(14%)185(36%)
Good169(33%)76(15%)245(48%)
Low52(10%)29(6%)81(16%)
Grand Total337(66%)174(34%)511(100%)
Kids # in Family
1 child59(12%)26(5%)85(17%)
2 children125(24%)59(12%)184(36%)
3 children80(16%)52(10%)132(26%)
4 children47(9%)23(5%)70(14%)
5 or more26(5%)14(3%)40(8%)
Grand Total337(66%)174(34%)511(100%)
Internet h Use (Child)
1 h61(12%)35(7%)96(19%)
2 h69(14%)39(8%)108(21%)
3 h71(14%)37(7%)108(21%)
4 h55(11%)25(5%)80(16%)
5 h or more81(16%)38(7%)119(23%)
Grand Total337(66%)174(34%)511(100%)
School Type (Child)
Government221(43%)129(25%)350(69%)
Not in school64(13%)20(4%)84(16%)
Nursery14(3%)10(2%)24(5%)
Preschool34(7%)10(2%)44(9%)
UNRWA4(1%)5(1%)9(2%)
Grand Total337(66%)174(34%)511(100%)
Social Network (Child)
Facebook8(2%)3(1%)11(2%)
Games83(16%)47(9%)130(25%)
Instagram10(2%)6(1%)16(3%)
LinkedIn1(0%)1(0%)2(0%)
Others4(1%)5(1%)9(2%)
Snapchat4(1%)5(1%)9(2%)
TikTok22(4%)7(1%)29(6%)
Twitter1(0%)1(0%)2(0%)
YouTube Kids204(40%)99(19%)303(59%)
Grand Total337(66%)174(34%)511(100%)
Table 2. Level lookup table of values and ranges.
RangeLevel
1–1.80very low
1.81–2.60low
2.61–3.40moderate
3.41–4.20high
4.21–5very high
Table 3. Overall mean and standard deviation of the study’s variables.
Type of VariableVariablesMeanSDLevelOrder
Independent VariablesPU3.2045010.838535High4
PEoU4.2470650.570725Very High2
TR2.2438360.867335Low8
EN4.3222440.682242Very High1
SI2.7919110.888545High6
Mediating VariablesBI3.0939330.750152High5
SPA3.2931070.980493High3
Dependent VariableSocIso2.7369861.127352High7
Table 4. Mean and standard deviation of the study’s variables.
MeanSDS.E.LevelOrderCronbachInternal
Consistency
Perceived Usefulness (PU)0.046135 0.89877Good
PU12.8512721.04290.048561high6
PU22.9706461.0977340.045564high5
PU33.1976521.0299790.044216high4
PU43.3894320.9995130.043701high2
PU53.5088060.9878780.044804high1
PU63.3091981.0128070.037095high3
Perceived Ease of Use (PEoU)0.02792 0.860033Good
PEoU14.3091980.6311320.03349very high2
PEoU24.1056750.757050.028884high4
PEoU34.256360.6529220.029749very high3
PEoU44.3170250.6724870.025247very high1
Trust (TR) 0.041895 0.907275Excellent
TR12.256360.9470460.042012low3
TR22.2935420.9496840.04658low1
TR32.2191781.0529620.046993low4
TR42.1682971.0623010.046826low5
TR52.28181.0585050.038369low2
Perceived Enjoyment (EN)0.032961 0.943947Excellent
EN14.2896280.7450950.031328very high3
EN24.3346380.7081830.031162very high2
EN34.3411760.729550.030181very high1
Social Influence (SI)0.043723 0.850824Good
SI12.8688850.9883790.043142high2
SI22.6144810.9752350.047382high3
SI32.8923681.0710820.039307high1
Behavioral Intention (BI)0.046356 0.670738Questionable *
BI13.0763211.0478960.04723high2
BI23.7358121.0676480.04573high1
BI32.9980431.0337430.047804high3
BI42.5655581.0806260.033185low4
Smartphones Addiction (SPA)0.048888 0.926171Excellent
SPA13.9217221.105130.056677high1
SPA23.3091981.2811960.055068high3
SPA33.0371821.2448270.054364high9
SPA43.1311151.2289130.054317high8
SPA53.2172211.2278540.054334high5
SPA63.3444231.2282470.055917high2
SPA73.1722111.2640160.056826high7
SPA83.2915851.2845640.055535high4
SPA93.2133071.255380.043374high6
Social Isolation (SocIso)0.053553 0.971353Excellent
SocIso12.8493151.2105720.051218high1
SocIso22.7260271.157790.053225high3
SocIso32.7318981.2031580.052038high2
SocIso42.6771041.1763370.053186high5
SocIso52.7005871.2022770.049871high4
* After removing BI2, BI became (0.75266775).
Table 5. Properties of the final measurement model.
Factor loadingsS.E.C.R.PSquared Multiple CorrelationsCRAVE
Perceived Usefulness (PU) 0.8950.590
PU10.7350.06216.51***0.54
PU20.6510.06614.474***0.423
PU30.8420.06119.046***0.708
PU40.7980.04324.686***0.637
PU50.76 0.577
PU60.8070.05221.11***0.652
Perceived Ease of Use (PEoU) 0.8660.620
PEU20.6750.05616.154***0.456
PEU30.8420.04621.205***0.709
PEU40.84 0.609
Trust (TR) 0.9020.650
TR10.730.0418.809***0.532
TR20.7510.0419.643***0.565
TR30.8460.04223.581***0.716
TR40.8360.04223.145***0.699
TR50.858 0.736
Perceived Enjoyment (EN) 0.9480.859
EN10.8250.02930.568***0.68
EN20.970.01757.624***0.942
EN30.978 0.956
Social Influence (SI) 0.8550.664
SI10.8230.06217.093***0.678
SI20.8920.06517.483 0.795
SI30.719 0.517
Behavioral Intention (BI) 0.7510.507
BI10.5550.05811.63***0.308
BI30.7560.05815.556***0.572
BI40.798 0.638
Smartphones Addiction (SPA) 0.9230.576
SPA10.5820.0711.571***0.339
SPA20.740.08613.901***0.548
SPA30.8310.08715.023***0.691
SPA40.7550.08314.147***0.569
SPA50.8860.08715.801***0.785
SPA60.8930.08815.809***0.798
SPA70.7730.08614.392***0.597
SPA80.615 0.378
SPA90.6920.06118.047***0.479
Social Isolation (SocIso) 0.9690.863
SocIso10.877 0.769
SocIso20.8670.02538.381***0.752
SocIso30.9530.03135.21***0.909
SocIso40.9680.02936.745***0.938
SocIso50.9720.0337.159***0.945
*** means zero.
Table 6. Goodness-of-fit statistics for measurement model.
Fit IndicesAuthorsRecommended ValueProposed Model Value
Chi square[87]p-value > 0.5p = 0.000, CMIN = 1184, DF = 629
Chi-square Value/Degree of Freedom (CMIN/DF)[80,82]<5.0 better if <3.0
<5.0 if n > 200
<3.0 good
<5.0 sometimes permissible
1.910
[89]
[79]
Comparative Fit Index (CFI)[89]>0.900.964
[90]
Incremental Fit Index (IFI)[87]>0.900.964
Normed Fit Index (NFI)[85]>0.900.927
Parsimony Comparative Fix Index (PCFI)[87]>0.500.863
Parsimony-Adjusted Measures Index (PNFI)[87]>0.50.830
Root Mean Square Error of Approximation (RMSEA)[91]<0.08
<0.05
<0.08: good fit
0.08–0.1: moderate fit
>0.1: poor fit
0.042 and is between 0.039 and 0.046
[83]
[87]
Standardized Root Mean Square Residual (SRMR)[79]<0.090.0629
Table 7. Convergent validity indicators.
ConstructsCRAVEMSVMaxR(H)
Perceived Usefulness (PU)0.8950.5900.4610.903
Perceived Ease of Use (PEoU)0.8660.6200.2280.878
Trust (TR)0.9020.6500.3550.910
Perceived Enjoyment (EN)0.9480.8590.2280.976
Social Influence (SI)0.8550.6640.1850.873
Behavioral Intention (BI)0.7510.5070.4610.781
Smartphone Addiction (SPA)0.9230.5760.5000.941
Social Isolation (SocIso)0.9690.8630.5000.980
No validity concerns here, according to [83] using [76].
Table 8. Correlations of constructs.
PUPEoUTRENSIBISPASocIso
PU0.768
PEoU0.187 ***0.787
TR0.517 ***0.0750.806
EN0.126 **0.478 ***0.0540.927
SI0.240 ***0.136 **0.430 ***0.109 *0.815
BI0.679 ***0.136 *0.596 ***0.110 *0.410 ***0.712
SPA−0.286 ***0.062−0.099 *0.045−0.014−0.259 ***0.759
SocIso−0.239 ***0.014−0.075−0.0110.096 *−0.174 ***0.707 ***0.929
Significance of Correlations: * p < 0.050, ** p < 0.010, *** p < 0.001; thresholds from [83] using [76].
Table 9. HTMT criterion measures.
PUPEoUTRENSIBISPASocIso
PU
PEoU0.210
TR0.5330.110
EN0.1310.5000.031
SI0.2190.1590.4150.125
BI0.6700.1450.6060.1240.372
SPA0.2520.0710.0710.0950.0080.225
SocIso0.2350.0050.0610.0090.1070.1560.698
HTMT Warnings: There are no warnings for this HTMT analysis [76,92]. Thresholds are 0.850 for strict and 0.900 for liberal discriminant validity.
Table 10. Summary of the results for the research theoretical model.
Research Proposed PathsEstimateS.E.C.R.PLabel
H1: PU→BI0.5190.0659.2130.000Supported
H2: PEOU→BI−0.0160.074−0.3410.733Not Supported
H3: TR→BI0.1720.0543.5920.000Supported
H4: EN→BI0.0160.0570.3430.732Not Supported
H5: SI→BI0.250.0524.5780.000Supported
H6:BI→SPA−0.2680.048−5.1420.000Supported
H7: SPA→SocIso0.7070.07512.7540.000Supported
Table 11. Group statistics of children’s and responders’ gender.
Group Statistics
Child Gender GenderNMeanStd. DeviationStd. Error Mean
SPAMale1740.00840.779350.05908
Female337−0.00440.766150.04173
BIMale174−0.00480.780590.05918
Female3370.00250.789240.04299
SocIsoMale174−0.00591.035430.0785
Female3370.0031.060220.05775
Responders’ GenderSPAMale3670.00740.773610.04038
Female144−0.01880.762830.06357
BIMale3670.03050.802040.04187
Female144−0.07760.738850.06157
SocIsoMale367−0.00851.036080.05408
Female1440.02171.090940.09091
Table 12. Independent sample test, Levene’s Test, and t-test for responder and child gender.
Independent Samples Test
Levene’s Test for Equality of Variancest-Test for Equality of Means
FSig.tdfSig. (2-Tailed)Mean DifferenceStd. Error Difference95% Confidence Interval of the Difference
LowerUpper
Child GenderSPAEqual variances assumed0.0660.7980.1785090.8590.012790.07194−0.128550.15413
Equal variances not assumed 0.177344.5510.860.012790.07234−0.129490.15506
BIEqual variances assumed0.3030.583−0.0995090.922−0.007230.0734−0.151440.13698
Equal variances not assumed −0.099353.1660.921−0.007230.07314−0.151090.13662
SocIsoEqual variances assumed0.1490.7−0.095090.928−0.008880.09819−0.201790.18404
Equal variances not assumed −0.091357.120.927−0.008880.09745−0.200530.18278
Responders’ GenderSPAEqual variances assumed0.0030.9530.3455090.730.026170.07577−0.12270.17503
Equal variances not assumed 0.347264.8490.7290.026170.07531−0.122120.17445
BIEqual variances assumed1.5680.2111.4015090.1620.108110.07717−0.043510.25972
Equal variances not assumed 1.452282.2280.1480.108110.07446−0.038450.25467
SocIsoEqual variances assumed0.9240.337−0.2925090.771−0.030180.10342−0.233370.17301
Equal variances not assumed −0.285249.8960.776−0.030180.10578−0.238520.17816
Table 13. ANOVA analysis of respondents’ BI, SocIso, and SPA attributed to respondents’ age, child age, internet experience, number of children in the family, and time spent using a smartphone.
Sum of SquaresdfMean SquareFSig.
BI attributed to respondents ageBetween Groups7.34341.8363.0220.018
Within Groups307.3665060.607
Total314.709510
BI attributed to child ageBetween Groups13.66452.7334.5840
Within Groups301.0455050.596
Total314.709510
BI attributed to Internet experienceBetween Groups10.43425.2178.710
Within Groups304.2755080.599
Total314.709510
SocIso attributed to number of children in familyBetween Groups15.54943.8873.5920.007
Within Groups547.6245061.082
Total563.173510
BI attributed to hours spent on smartphoneBetween Groups6.08441.5212.4940.042
Within Groups308.6245060.61
Total314.709510
SPA attributed to hours spent on smartphoneBetween Groups34.22948.55716.1510
Within Groups268.0945060.53
Total302.324510
SocIso attributed to hours spent on smartphoneBetween Groups18.54744.6374.3080.002
Within Groups544.6265061.076
Total563.173510
Table 14. Multiple comparisons analysis of the BI attributed to respondents’ age using Tukey HSD.
Dependent Variable(I) Responder Age (Years)(J) Responder Age (Years)Mean Difference (I–J)Std. ErrorSig.95% Confidence Interval
Lower BoundUpper Bound
BI attributed to respondents age18–2828–380.086930.201930.993−0.46590.6398
38–480.084990.202000.993−0.46800.6380
48–58−0.296060.221380.668−0.90210.3100
greater than 58−0.100670.314180.998−0.96080.7594
28–3818–28−0.086930.201930.993−0.63980.4659
38–48−0.001940.075171.000−0.20770.2039
48–58−0.38299 *0.117710.011−0.7053−0.0607
greater than 58−0.187590.252100.946−0.87780.5026
38–4818–28−0.084990.202000.993−0.63800.4680
28–380.001940.075171.000−0.20390.2077
48–58−0.38105 *0.117830.011−0.7036−0.0585
greater than 58−0.185650.252160.948−0.87600.5047
48–5818–280.296060.221380.668−0.31000.9021
28–380.38299 *0.117710.0110.06070.7053
38–480.38105 *0.117830.0110.05850.7036
greater than 580.195400.267930.950−0.53810.9289
greater than 5818–280.100670.314180.998−0.75940.9608
28–380.187590.252100.946−0.50260.8778
38–480.185650.252160.948−0.50470.8760
48–58−0.195400.267930.950−0.92890.5381
* The mean difference is significant at the 0.05 level.
Table 15. Multiple comparisons analysis of the BI attributed to the child’s age using Tukey HSD.
Dependent Variable(I) Child Age (Years)(J) Child Age (Years)Mean Difference (I–J)Std. ErrorSig.95% Confidence Interval
Lower BoundUpper Bound
BI0–33–60.006280.118051.000−0.33140.3440
6–9−0.100790.127200.969−0.46470.2631
9–12−0.205230.130290.615−0.57800.1675
12–15−0.234930.138000.531−0.62970.1598
15–17−0.64023 *0.170020.003−1.1266−0.1539
3–60–3−0.006280.118051.000−0.34400.3314
6–9−0.107070.097770.883−0.38680.1726
9–12−0.211510.101760.300−0.50260.0796
12–15−0.241210.111460.257−0.56010.0776
15–17−0.64651 *0.149290.000−1.0736−0.2195
6–90–30.100790.127200.969−0.26310.4647
3–60.107070.097770.883−0.17260.3868
9–12−0.104440.112250.939−0.42560.2167
12–15−0.134140.121120.878−0.48060.2123
15–17−0.53944 *0.156620.008−0.9875−0.0914
9–120–30.205230.130290.615−0.16750.5780
3–60.211510.101760.300−0.07960.5026
6–90.104440.112250.939−0.21670.4256
12–15−0.029700.124361.000−0.38540.3260
15–17−0.435000.159140.071−0.89030.0203
12–150–30.234930.138000.531−0.15980.6297
3–60.241210.111460.257−0.07760.5601
6–90.134140.121120.878−0.21230.4806
9–120.029700.124361.000−0.32600.3854
15–17−0.405300.165520.142−0.87880.0682
15–170–30.64023 *0.170020.0030.15391.1266
3–60.64651 *0.149290.0000.21951.0736
6–90.53944 *0.156620.0080.09140.9875
9–120.435000.159140.071−0.02030.8903
12–150.405300.165520.142−0.06820.8788
* The mean difference is significant at the 0.05 level.
Table 16. Multiple comparisons analysis of the BI attributed to internet experience using Tukey HSD.
Dependent Variable(I) Internet Exp(J) Internet ExpMean Difference (I–J)Std. ErrorSig.95% Confidence Interval
Lower BoundUpper Bound
BILowGood−0.148420.099190.294−0.38160.0847
Excellent−0.38911 *0.103110.001−0.6315−0.1467
GoodLow0.148420.099190.294−0.08470.3816
Excellent−0.24069 *0.075380.004−0.4179−0.0635
ExcellentLow0.38911 *0.103110.0010.14670.6315
Good0.24069 *0.075380.0040.06350.4179
* The mean difference is significant at the 0.05 level.
Table 17. Multiple comparisons analysis of the SocIso attributed to the number of children in the family using Tukey HSD.
Dependent Variable(I) Number of Children(J) Number of ChildrenMean Difference (I–J)Std. ErrorSig.95% Confidence Interval
Lower BoundUpper Bound
SocIso120.324380.136430.123−0.04910.6979
30.289500.144680.267−0.10660.6856
4−0.143670.167910.913−0.60330.3160
5 or more0.144920.199470.950−0.40120.6910
21−0.324380.136430.123−0.69790.0491
3−0.034880.118660.998−0.35970.2900
4−0.46804 *0.146090.013−0.8680−0.0681
5 or more−0.179460.181490.860−0.67630.3174
31−0.289500.144680.267−0.68560.1066
20.034880.118660.998−0.29000.3597
4−0.43317 *0.153820.040−0.8543−0.0121
5 or more−0.144580.187760.939−0.65860.3694
410.143670.167910.913−0.31600.6033
20.46804 *0.146090.0130.06810.8680
30.43317 *0.153820.0400.01210.8543
5 or more0.288580.206200.628−0.27590.8531
5 or more1−0.144920.199470.950−0.69100.4012
20.179460.181490.860−0.31740.6763
30.144580.187760.939−0.36940.6586
4−0.288580.206200.628−0.85310.2759
* The mean difference is significant at the 0.05 level.
Table 18. Multiple comparisons analysis of the BI attributed to the number of hours on a smartphone using Tukey HSD.
Dependent Variable(I) Hours on Phone(J) Hours on PhoneMean Difference (I–J)Std. ErrorSig.95% Confidence Interval
Lower BoundUpper Bound
BI1 h2 h−0.110080.109550.853−0.41000.1898
3 h−0.30380 *0.109550.045−0.6037−0.0039
4 h−0.277470.118230.132−0.60110.0462
5 h or more−0.143970.107140.664−0.43730.1493
2 h1 h0.110080.109550.853−0.18980.4100
3 h−0.193710.106280.362−0.48470.0972
4 h−0.167390.115200.594−0.48280.1480
5 h or more−0.033880.103790.998−0.31800.2503
3 h1 h0.30380 *0.109550.0450.00390.6037
2 h0.193710.106280.362−0.09720.4847
4 h0.026330.115200.999−0.28910.3417
5 h or more0.159830.103790.537−0.12430.4440
4 h1 h0.277470.118230.132−0.04620.6011
2 h0.167390.115200.594−0.14800.4828
3 h−0.026330.115200.999−0.34170.2891
5 h or more0.133510.112910.762−0.17560.4426
5 h or more1 h0.143970.107140.664−0.14930.4373
2 h0.033880.103790.998−0.25030.3180
3 h−0.159830.103790.537−0.44400.1243
4 h−0.133510.112910.762−0.44260.1756
* The mean difference is significant at the 0.05 level.
Table 19. Multiple comparisons analysis of the SPA attributed to the number of hours on the smartphone using Tukey HSD.
Dependent Variable(I) Hours on Phone(J) Hours on PhoneMean Difference (I–J)Std. ErrorSig.95% Confidence Interval
Lower BoundUpper Bound
SPA1 h2 h−0.057140.102100.981−0.33670.2224
3 h−0.193990.102100.319−0.47350.0855
4 h−0.46644 *0.110190.000−0.7681−0.1648
5 h or more−0.66632 *0.099860.000−0.9397−0.3929
2 h1 h0.057140.102100.981−0.22240.3367
3 h−0.136850.099050.640−0.40800.1343
4 h−0.40930 *0.107370.001−0.7032−0.1154
5 h or more−0.60918 *0.096740.000−0.8740−0.3443
3 h1 h0.193990.102100.319−0.08550.4735
2 h0.136850.099050.640−0.13430.4080
4 h−0.272450.107370.084−0.56640.0215
5 h or more−0.47233 *0.096740.000−0.7372−0.2075
4 h1 h0.46644 *0.110190.0000.16480.7681
2 h0.40930 *0.107370.0010.11540.7032
3 h0.272450.107370.084−0.02150.5664
5 h or more−0.199880.105240.319−0.48800.0882
5 h or more1 h0.66632 *0.099860.0000.39290.9397
2 h0.60918 *0.096740.0000.34430.8740
3 h0.47233 *0.096740.0000.20750.7372
4 h0.199880.105240.319−0.08820.4880
* The mean difference is significant at the 0.05 level.
Table 20. Multiple comparisons analysis of the SocIso attributed to the number of hours on smartphones using Tukey HSD.
Dependent Variable(I) Hours on Phone(J) Hours on PhoneMean Difference (I–J)Std. ErrorSig.95% Confidence Interval
Lower BoundUpper Bound
SocIso1 h2 h0.214100.145530.582−0.18430.6125
3 h0.057560.145530.995−0.34080.4560
4 h−0.093260.157050.976−0.52320.3367
5 h or more−0.332480.142330.135−0.72210.0572
2 h1 h−0.214100.145530.582−0.61250.1843
3 h−0.156540.141180.802−0.54300.2300
4 h−0.307360.153040.263−0.72630.1116
5 h or more−0.54659 *0.137880.001−0.9241−0.1691
3 h1 h−0.057560.145530.995−0.45600.3408
2 h0.156540.141180.802−0.23000.5430
4 h−0.150830.153040.862−0.56980.2681
5 h or more−0.39005 *0.137880.039−0.7675−0.0126
4 h1 h0.093260.157050.976−0.33670.5232
2 h0.307360.153040.263−0.11160.7263
3 h0.150830.153040.862−0.26810.5698
5 h or more−0.239220.150000.501−0.64990.1714
5 h or more1 h0.332480.142330.135−0.05720.7221
2 h0.54659 *0.137880.0010.16910.9241
3 h0.39005 *0.137880.0390.01260.7675
4 h0.239220.150000.501−0.17140.6499
* The mean difference is significant at the 0.05 level.
Publisher’s Note: MDPI stays neutral with regard to jurisdictional claims in published maps and institutional affiliations.

