Article

We Know You Are Living in Bali: Location Prediction of Twitter Users Using BERT Language Model

by
Lihardo Faisal Simanjuntak
1,2,
Rahmad Mahendra
1,* and
Evi Yulianti
1
1
Faculty of Computer Science, Universitas Indonesia, Depok 16424, Indonesia
2
BPS-Statistics of Timor Tengah Selatan Regency, Soe 85511, Indonesia
*
Author to whom correspondence should be addressed.
Big Data Cogn. Comput. 2022, 6(3), 77; https://doi.org/10.3390/bdcc6030077
Submission received: 5 April 2022 / Revised: 23 May 2022 / Accepted: 27 May 2022 / Published: 7 July 2022
(This article belongs to the Topic Machine and Deep Learning)

Abstract

:
Twitter user location data provide essential information that can be used for various purposes. However, user location is not easy to identify because many profiles omit this information, or users enter data that do not correspond to their actual locations. Several related works attempted to predict location on English-language tweets. In this study, we attempted to predict the location of Indonesian tweets. We utilized machine learning approaches, i.e., long-short term memory (LSTM) and bidirectional encoder representations from transformers (BERT) to infer Twitter users’ home locations using display name in profile, user description, and user tweets. By concatenating display name, description, and aggregated tweet, the model achieved the best accuracy of 0.77. The performance of the IndoBERT model outperformed several baseline models.

1. Introduction

Twitter (http://twitter.com, accessed on 23 May 2022) is one of the most popular social media sites in the world, with approximately 330 million monthly active users [1] and over 500 million daily tweets [2]. Twitter provides an application programming interface (API) https://developer.twitter.com/en/docs/twitter-api (accessed on 17 May 2022) enables the collection of data from the site using its web service. With the help of Twitter API, tweet data can be analyzed for various tasks and applications, including sentiment and stance analysis [3,4,5,6,7,8], hate speech and misinformation detection [9,10,11,12,13,14], traffic monitoring [15,16,17], disaster management [18,19,20], and disease outbreak control [21,22].
In many applications, extracting information from tweet contents needs to be complemented with location analysis. For example, with user geolocation data, the government can detect the location where fake news [23] or disease outbreak [24] spreads. Location-based sentiment analysis can predict election results at regional-level granularity [25,26] or learn the demographics of candidate supporters to support political campaigns in Presidential elections [27].
Despite the necessity of such location data, the majority of Twitter users do not provide geolocation information in their profiles or tweets. Even when a user includes location information in their profile, it may not be accurate as they can fill it in arbitrarily. In a random sampling of over one million Twitter users, Cheng et al. [28] found that only 26% included location data in their profile, and only 0.42% of tweets in the sample were geotagged. Therefore, other information in users’ profiles and tweets is necessary to infer their location.
Geolocation prediction has mainly been performed for English-language tweets. As far as we know, the study of geolocation prediction using Indonesian tweets is still relatively rare. Cheng et al. [28] made geolocation predictions in 2010 by sampling about one million Twitter users in the US. Roller et al. [29] used US Twitter data from 450,000 users for geolocation prediction for North America in 2012. Han et al. [30] provided Twitter-world (a dataset of around 12 million English tweets from users around the world. There are 10,000 each for development and testing, and users are geotagged with the center of the closest city to their tweets) geolocation prediction data for 1.3 million users, specifically for English-language tweets, in various cities worldwide. At the 2016 Workshop on Noisy User-Generated Text (WNUT), Han et al. [31] provided data for tweets specifically in English for one million users in 3362 cities in different countries, including Indonesia.
Indonesia is expected to have around 17.55 million Twitter users by 2022 [32]. This places Indonesia in the sixth place among countries with the highest number of Twitter users. Although Indonesian-language Twitter resources are plentiful, only limited work has explored location analysis of Indonesian Twitter users. Han et al. [33] applied geolocation prediction for multilingual environments, including Indonesian tweets, in the WORLD+ML dataset. They used the information gain ratio method and machine learning to measure the entropy of local words in a city. Izbicki et al. [34] also applied a multilingual setting that included tweets in Indonesian. They proposed a deep learning model, unicodeCNN, to predict geolocation. In contrast to these previous studies, in our work, we performed location prediction using tweets written by users in Indonesia; therefore, our study is generally specific to Indonesian-language tweets. We then implemented a pretrained bidirectional encoder representations from transformers (BERT) language model to predict geolocation, adopting an approach used by Qian et al. [35] for Chinese tweets and Scherrer et al. [36] for Helsinki–Ljubljana tweets.
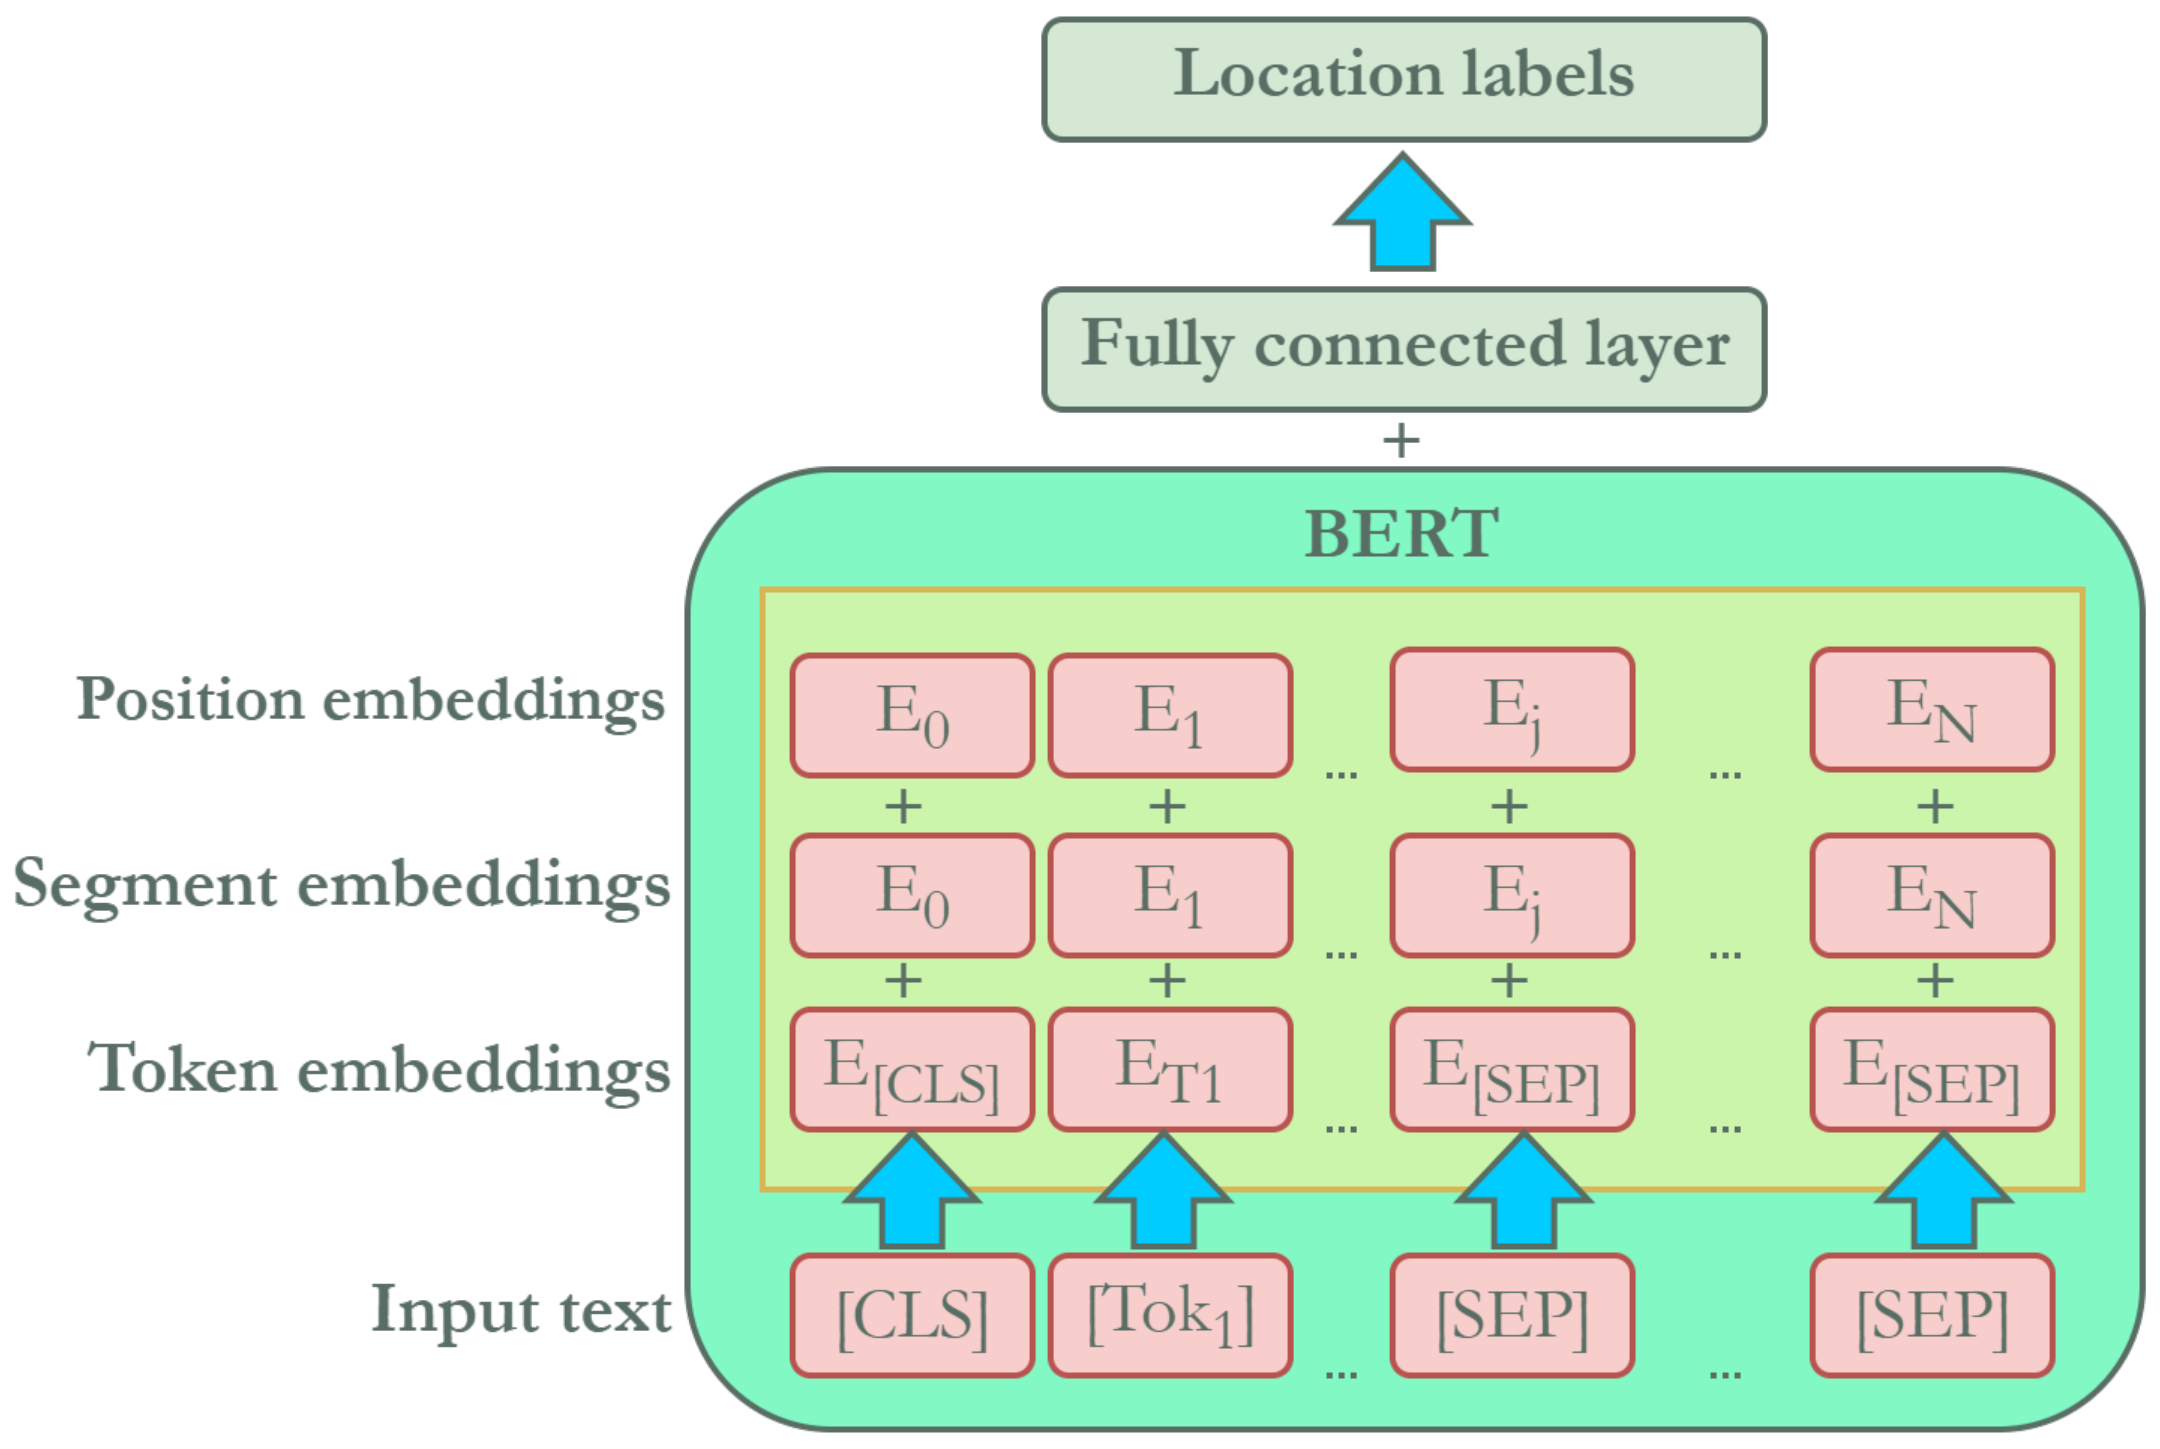
This study examined text in user profiles and tweets to predict users’ locations using a transformer-based language model, i.e., BERT. Hence, we formulate this task as text classification, as in [33,37]. BERT is the current state-of-the-art for many natural language processing (NLP) tasks. The fine-tuning of pretrained BERT, with its capability to model bidirectional contexts and attention mechanisms, achieves better performance for many downstream NLP tasks, including text classifications, as shown by Devlin et al. [38]. Willie et al. [39] and Koto et al. [40] trained two different versions of BERT on Indonesian corpus, called IndoBERT, specifically for Indonesian language. IndoBERT by Willie et al. was trained on around 4 billion Indonesian corpora (Indo 4B) collected from 12 publicly available corpora covering formal and colloquial languages. IndoBERT by Koto et al. was trained on 219M Indonesian words from Wikipedia, news articles, and the Web Corpus. Both studies showed state-of-the-art performance of IndoBERT with various Indonesian-language NLP tasks such as morpho-syntax and sequence labeling, semantic tasks, text classification, and discourse analysis. Continuing their work, Koto et al. also trained BERT specifically for Indonesian-language Twitter data with a total of 409 million tokens, called IndoBERTweet [41].
Our study makes the following contributions: (1) we predict the location of Twitter users specific to Indonesian regions using pretrained BERT language models; and (2) our empirical results show that the BERT model is more accurate in location prediction than some machine learning models and another deep learning model. We release the code and model at https://github.com/ir-nlp-csui/indotwitterlocation (accessed on 17 May 2022).

2. Related Work

In recent years, many researchers have studied the problem of location prediction, especially with Twitter data. Cheng et al. [28] applied the content-based user location estimation algorithm to estimate a user’s city location based on their tweets as a baseline. They succeeded in obtaining an accuracy of 0.51 in predicting home location at the city level by adding a local-word-filtering method and performing neighborhood smoothing on word probabilities. Hecht et al. [42] used naïve Bayes to identify a user’s home country and home state. For each tweet in the corpus, they used the Calgari algorithm to calculate the weighted terms associated with the location. Their experiment gained an accuracy of 0.89 for the country level and 0.31 for the US state level.
Rahimi et al. [43] used a bag of word unigrams and term frequency, inverse document frequency (TF-IDF) weighting for both words and mentions, followed by l2-normalization of each tweet. They then used logistic regression to classify the data and obtained an accuracy of 0.64 on the Twitter-world data. Indira et al. [37] extracted more than 1000 tweets containing geolocation to predict the user’s location in three different cities. This information was combined with the user’s name, screen name, and the mentioned locations in the tweet to make predictions using naïve Bayes, support vector machine, and decision tree techniques. They found that the decision tree algorithm could obtain an accuracy of 99.96.
In addition to using machine learning, several researchers have used deep learning techniques to predict location. Rahimi et al. [44] used a multilayer perceptron with one hidden layer to classify user location. They did not consider @-mentions, words with a document frequency of less than 10, or stop words. The use of k-means discretization of the real-valued coordinates of the training location as the output provided an accuracy of 0.36 for the Twitter-world data. Miura et al. [45] trained a neural network to predict city-level geolocations on WNUT Twitter data. They employed pretrained word embeddings that used text, location, and description fields with a skip-gram algorithm and obtained an accuracy of 0.47 with a median error distance of 16.13 km in user-level prediction. Continuing their previous work, they proposed a more sophisticated model by sorting user messages chronologically and applying an RNN sequential model to encode the tweets, profile description, and time zone [46]. The combination of the three features was then passed to the softmax layer to predict the home location at the city level.
Similar to Rahimi et al. [43], we also use word unigram and TF-IDF to predict each tweet location using machine learning. However, unlike their study, which used text and network context, this study used only text information, i.e., tweets, display name, and user description, to predict user location. Indira et al. [37] predicted location at the tweet level; they stored only tweets that mentioned location. In contrast, in this study, we predicted the location at the user level and stored tweets even if they did not mention the location to obtain real-world conditions. In contrast to the work of Hecht et al. [42] that used the Calgari algorithm to weight terms related to location, our study used named-entity recognition (NER) to assign weights to each tweet. Each entity (such as a person, organization, or location), which could be associated with a particular location, extracted from each tweet was duplicated and used as a feature in the inference process. To our knowledge, we are first to apply BERT fine-tuning to infer the location of Twitter users in Indonesia.

3. Problem Formulation

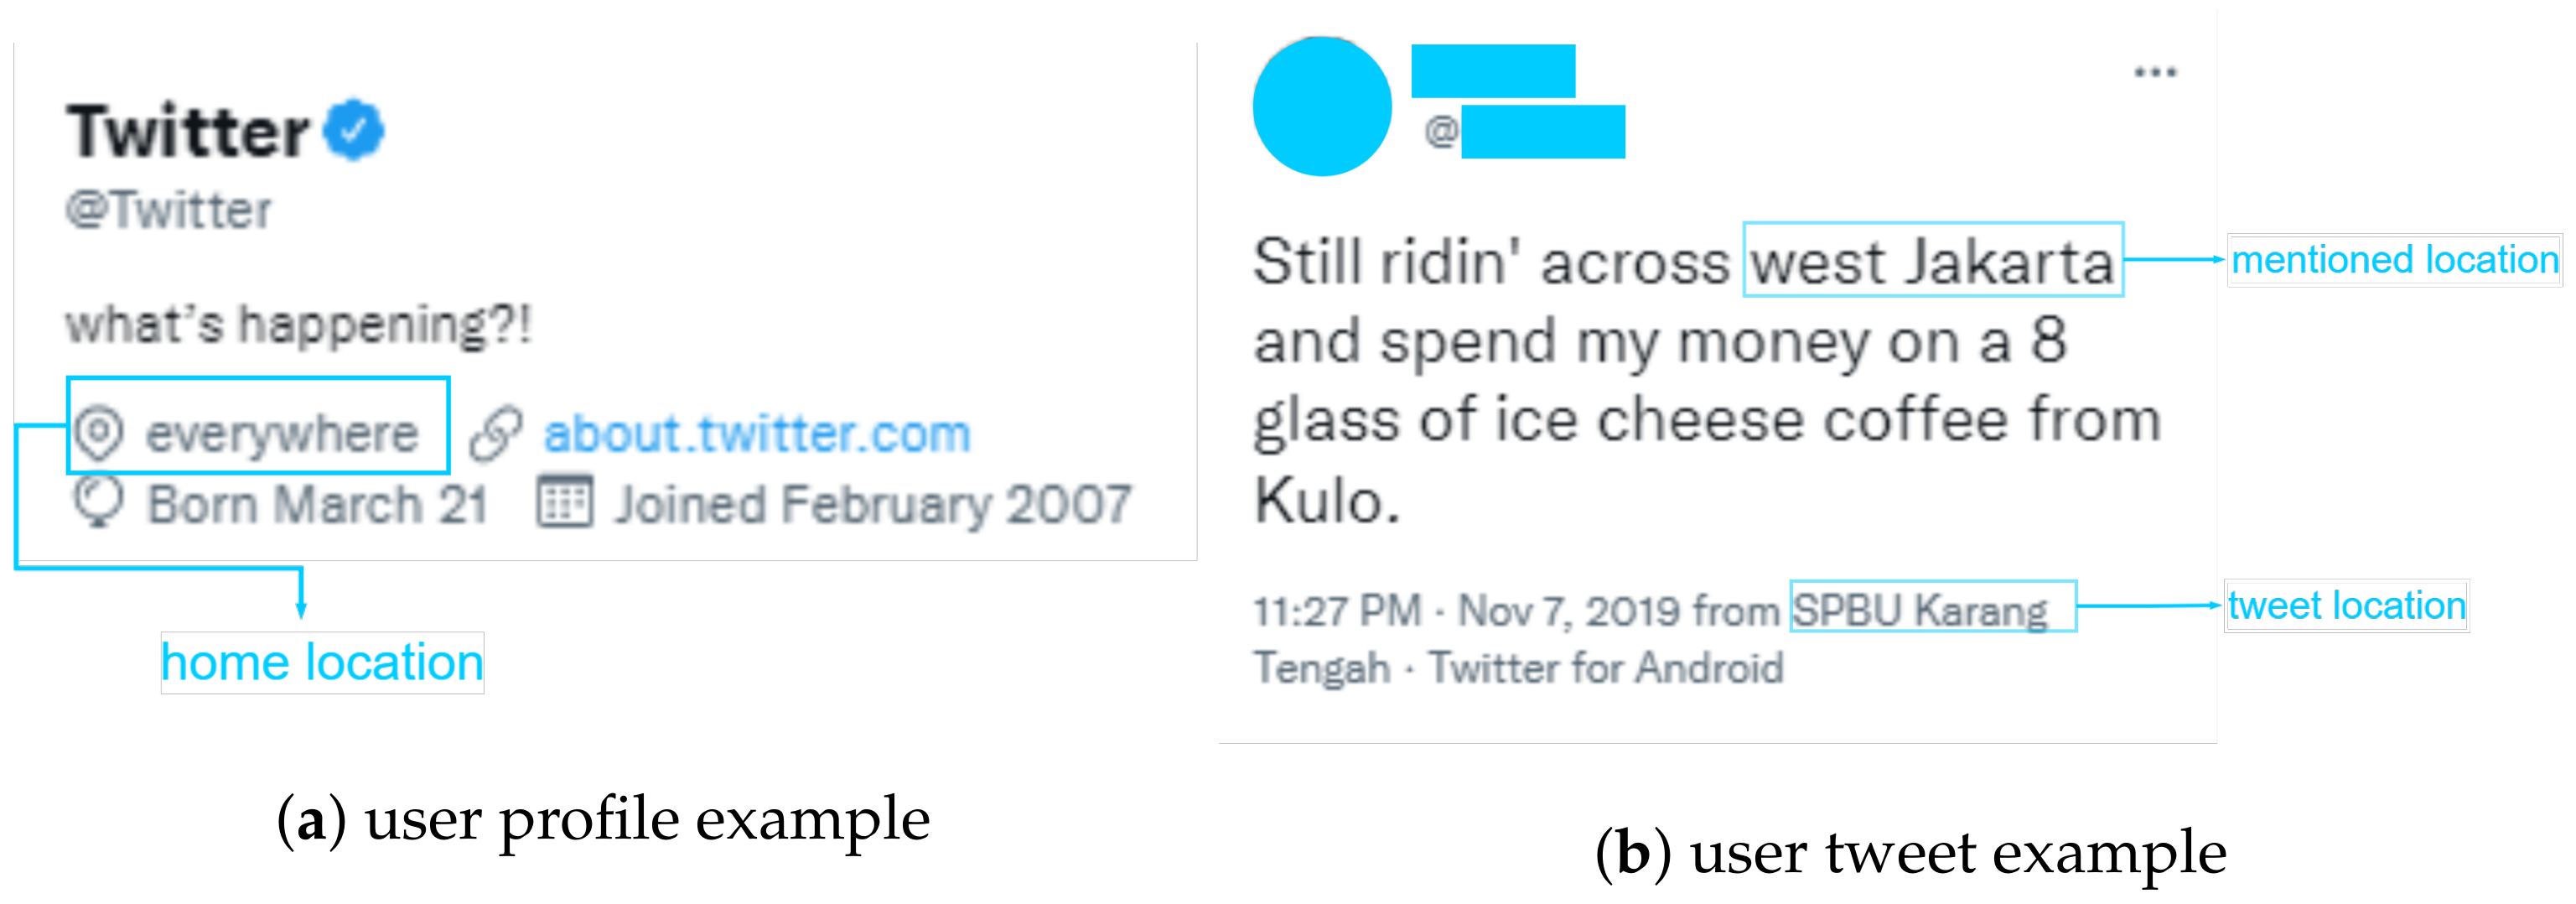
According to Zheng et al. [47], the location of Twitter users can be categorized into home location, tweet location, and mentioned location, as illustrated in 
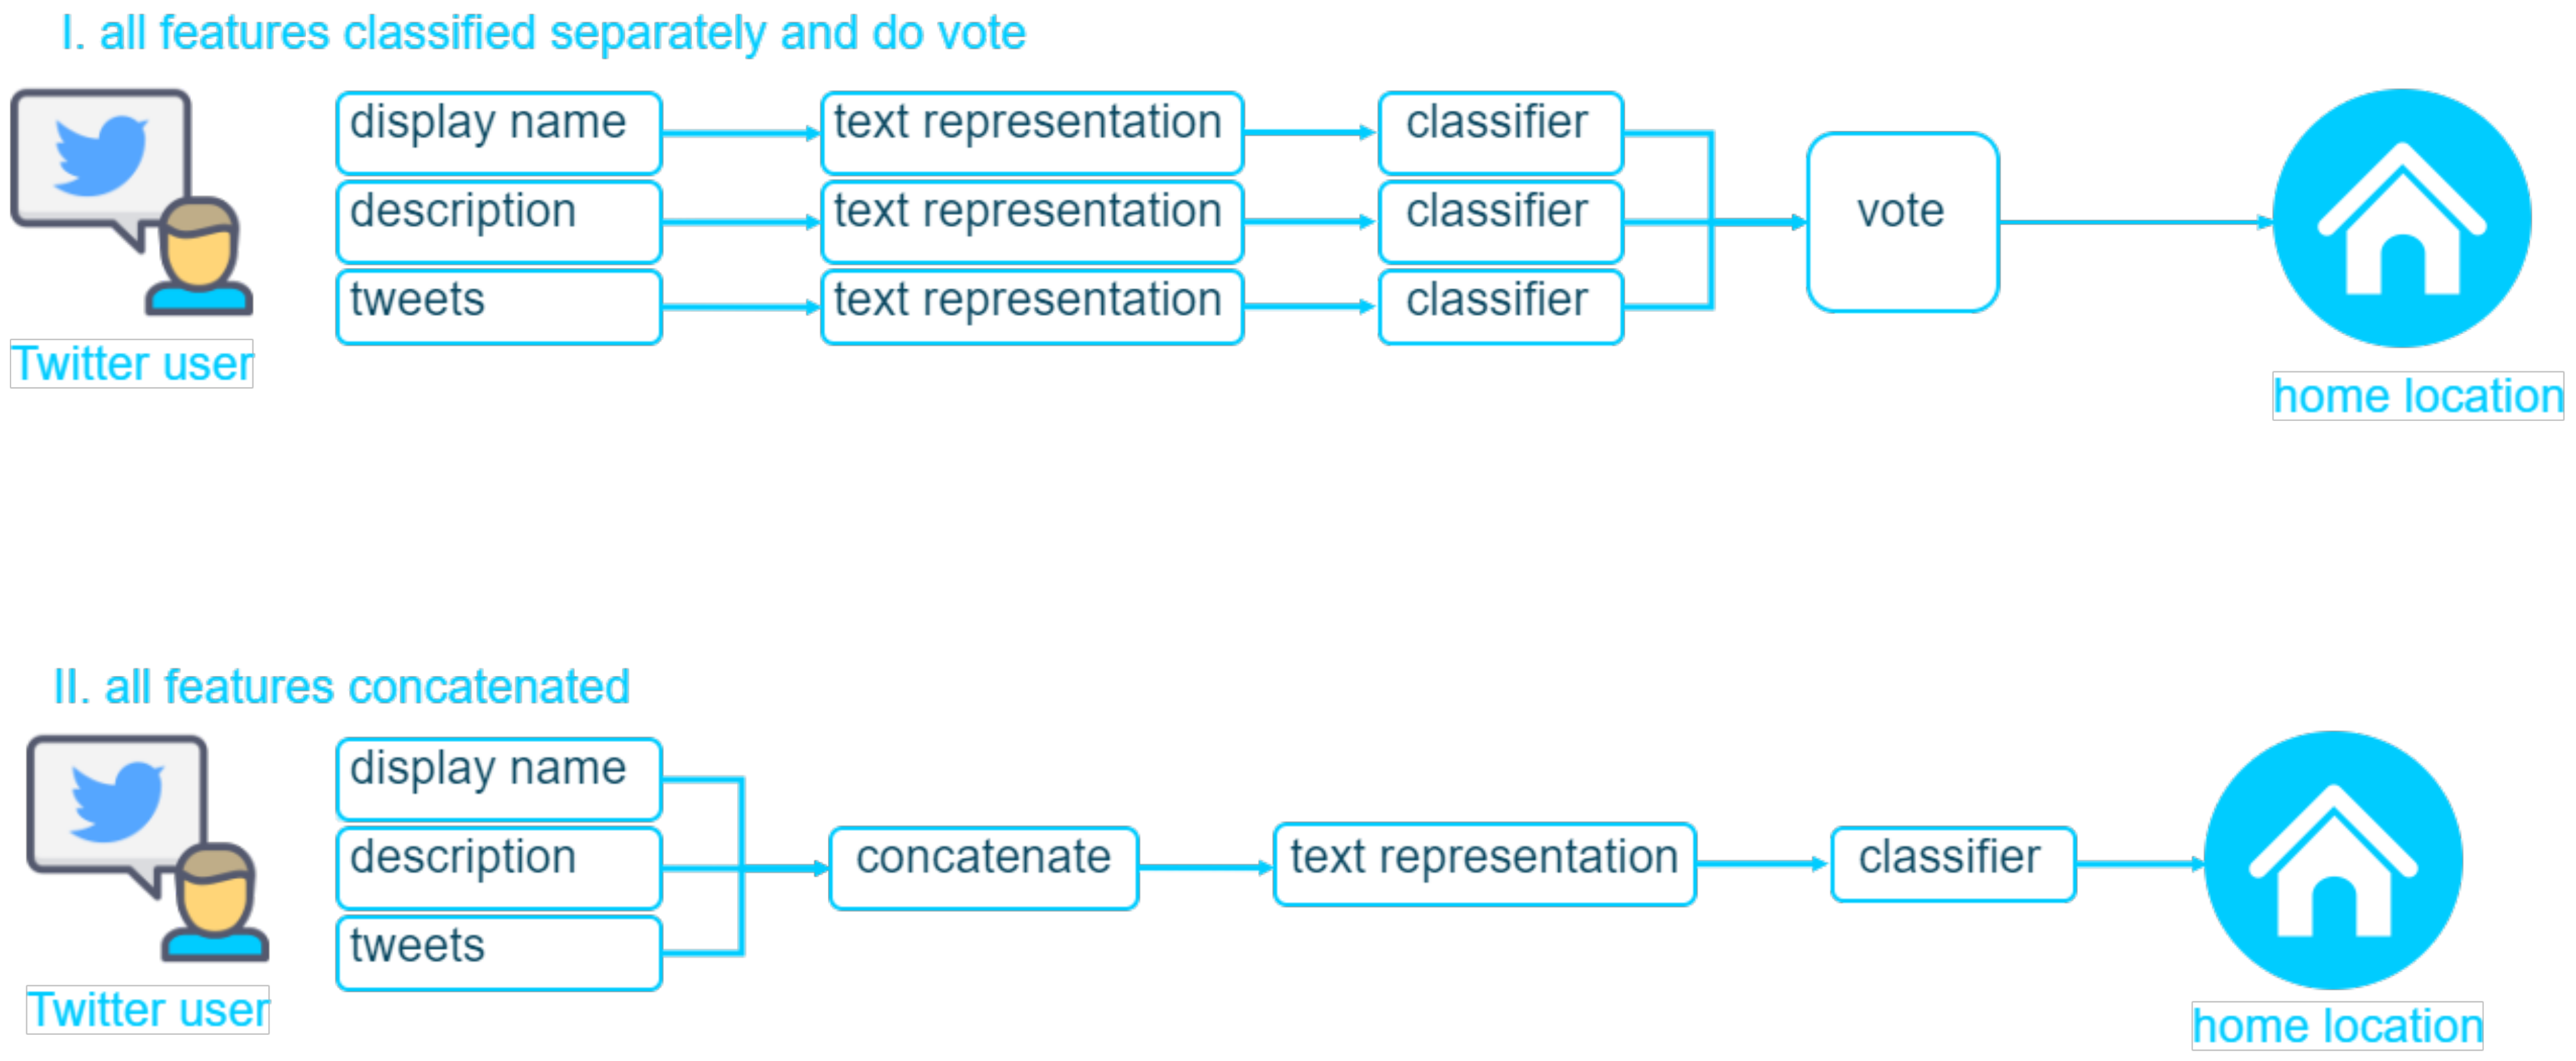
Figure 1. The aim of this study was to predict the home location of Twitter users with the aid of text attributes in their profiles and tweets (Figure 2). The text attributes we used were limited to the display name, user description, and their tweets. The display name is the name given by the user to their profile and is limited to 1–50 characters. It can be any name; it does not have to be the user’s real name. The user description is the string that the user defines to describe their account. It has a maximum length of 160 characters and can simply be omitted. Tweets are messages posted by users on their timeline and can be in the form of text, photos, gifs, and videos. The maximum length of a tweet is 280 characters.
We grouped the home locations of all users into nine regions based on the geographical characteristics of Indonesia. Indonesia has five large islands: Java, Kalimantan, Sumatra, Sulawesi, and Papua. Almost all Indonesian provinces are located on these islands, except for a few geographically separated provinces. The island of Sumatra has two separate provinces. However, there are no differences between these provinces and the main islands in geography and time zone. To the east of Java island are the Nusa Tenggara islands, which comprise the provinces of Bali, West Nusa Tenggara, and East Nusa Tenggara. Geographically and in terms of time zone, these islands have unique characteristics compared to the island of Java. Therefore, we grouped these islands into one distinct region. To the west of the island of Papua are the provinces of Maluku and North Maluku, which are also islands separate from the five big islands. However, we grouped the Maluku islands with the Maluku and Papua region because these islands do not differ from Papua in terms of geography and time zone. Consequently, at this stage, there were six categories of region.
Java is the most populous island in Indonesia. Although in area it is only about seven percent of the entire territory of Indonesia, Java is inhabited by 151.59 million people, or 56.10 percent of Indonesia’s population [48]. It has six provinces, i.e., West Java, Banten, DKI Jakarta, Central Java, Yogyakarta, and East Java. DKI Jakarta, which includes the capital city of Indonesia and several cities in the province of West Java and Banten, forms a megalopolitan area and Indonesia’s business and economic center. Consequently, we considered it to be a distinct region. We then combined all regions in West Java and Banten not included in this megalopolitan area into one separate region. Technically, Yogyakarta Province is a city with about 10 percent of the total population of Central Java [48], and geographically, it is only bordered by Central Java Province; therefore, we combined Central Java and Yogyakarta into a separate region. Thus, the four regional categories of this island were Jabodetabek (Jakarta, Bogor, Depok, Tangerang, and Bekasi), West Java and Banten, Central Java and Yogyakarta, and East Java.
We finally obtained a total of nine regional categories for our predictions: West Java and Banten (except Bogor and Tangerang); Jabodetabek (Jakarta, Bogor, Depok, Tangerang, and Bekasi); East Java; Central Java and Yogyakarta; Kalimantan; Maluku and Papua; Bali and Nusa Tenggara; Sulawesi; and Sumatra (Figure 3).
This task was formulated as a text classification problem as it only used text features to make predictions. Because each user was assigned to a single location class based on information in their profile and tweets, this task was also formulated as a multiclass classification problem. A user typically has more than one tweet, and each tweet could be predicted in a different class. Thus, two approach scenarios were used, i.e., majority vote and tweet aggregation as one, which will be explained in Section 5.

4. Methodology

4.1. Data Collection and Annotation

We collected Twitter accounts and assigned labels to their home locations based on users’ geographical area of residence. We primarily labeled users’ locations in our friends’ network on Twitter to avoid false labels. For the case of Twitter accounts not in our network of friends, we manually verified that they were in a particular region based on user profiles and tweets. In addition, we also collected the Twitter accounts of public figures and official organizations (such as local government and local businesses accounts) whose addresses were easily identifiable. We also use the subset of data from Indonesian Twitter gender prediction experiment [49], in which ground truth location exists. We categorized all the users into two types: person and nonperson [50,51,52]. The person and nonperson accounts were balanced in each location class.
The total number of annotated users was 1250. The most annotated users were in Central Java and Yogyakarta (178 users), followed by East Java (171 users) and West Java and Banten (162 users). The data distribution for annotated users based on nine regions is shown in Figure 4. After the annotation process, we used the Twitter API to collect each user’s tweets up to December 2021. The total number of tweets collected was 1,515,610.

4.2. Data Preprocessing

Data obtained from the Twitter API were filtered in Indonesian and then preprocessed by (1) removing mentions and URLs; (2) removing repeated characters in words; (3) removing extra spaces; (4) unicode normalization; (5) removing numbers in the text; (6) removing punctuation; (7) lower-casing; and (8) removing stop words. After preprocessing the data, we filtered them by only keeping users with 20 or more tweets. We wanted as many users as possible for the location inference stage, and we selected 20 tweets based on the experimental results. The filtering process generated 1,515,128 tweet lines, with an average of 1212 tweets per user. Figure 5 shows the distribution of tweet numbers over users.
Since fine-tuning BERT was resource-intensive, we considered to limit tweet of each user at maximum 100 tweets. The tweets selected were the 100 most recent tweets posted by each user. That is, tweets were selected regardless of the GPS location. This is because, based on a previous study by Cheng et al. [28], there were a few tweets that included GPS location (0.4% in the 1 million sample results). Hence, the total number of tweets generated for all users was 117,963 lines, with an average of 92 tweets per user.

4.3. Feature Extraction

Three attributes that were used to predict user’s home location in this work are as follows.
  • Display name
    The display name can be used as a feature to predict users location. This is because in Indonesia, there are some cases where people’s names can identify their location. Here, people from the same islands/provinces can have similar names that are specific to that region. For example, people in Bali have a common naming system based on caste, gender, and birth order within the family [53]. For example, the name of a first child of the Sudra caste in Bali usually includes the word “Wayan” in his name. Another example is that some ethnic groups in several Indonesian regions including Sumatra, Sulawesi, Maluku, and Papua also use specific clan/family naming systems [54]. In this sense, people from the same ethnic group and from the same place can have the same surname. For example, Simanjuntak is a surname that comes from North Sumatra province, so someone with the surname Simanjuntak is more likely to live in Sumatra than other regions. Likewise, clans such as Wangkar, Tangkudung, and Sondakh tend to live in Sulawesi.
    In addition, the display names of nonperson accounts, such as local governments and businesses, in some cases also include location names. The @Sulselprov account, for example, includes the location name in its display name, i.e., Pemerintah Provinsi Sulawesi Selatan (South Sulawesi Provincial Government), where Sulawesi Selatan is a location entity. All of these cases indicate that display names may be useful for predicting the user’s home location.
  • User description
    The user description can also be used as a feature for predicting users location. Nonperson, i.e., organization account, profiles usually contain a detailed description of their organization and their address. Consequently, user descriptions, particularly those for organizational accounts, are suitable to predict the user’s location.
  • Tweet
    A user tweet covering a wide range of topics may be able to describe the user’s general profile, including the user’s location. This is because users tend to post tweets about their activities, interests, and nearby events that may explicitly contain location information or implicitly provide information about where they live. Therefore, tweets are important features to a user’s location.
TF-IDF representation was used to represent display names and descriptions, while LSTM and BERT embedding were used to represent tweets. This is because LSTM and BERT are contextual representations and are therefore unsuitable for the user’s display name, which is typically short (two words on average) and lacks context. The user’s description is also not suitable for contextual representation, since 8.5% of the users leave it empty and, according to our observations of the test data, 25% of the descriptive attributes consist of only three words.
As the tweets may contain the entity names, and most names can give the context where the tweets locate, we utilized named-entity features. For our location prediction task, we extracted three named entities, i.e., person names, organizations, and locations, from each display name, user description, and user tweet. To obtain named-entity features, we harnessed a named-entity recognition (NER) task [55,56]. For the NER model, we used IndoBERTtweet [41] which was fine-tuned on Munarko NER data [57]. The entity extraction results were then concatenated with the three attributes, which we then vectorized with TF-IDF, LSTM, and BERT.

4.4. Model Building

This task was formulated as multiclass classification. We used IndoBERT to predict home location of Indonesian-language Twitter data. Three machine learning algorithms and one deep learning algorithm were used as the baseline.

4.4.1. Naïve Bayes

Naïve Bayes is an algorithm that applies a classification based on Bayes’ theorem that predicts the future based on past experiences. Naïve Bayes performs classification based on probability. The input data are classified into a particular data class according to the probability of belonging to that class.
P ( c l a s s / d a t a ) = P ( c l a s s ) × P ( d a t a / c l a s s ) P ( d a t a )
Because of its simplicity, Naïve Bayes is widely used in social networks data classification with high accuracy [58,59,60]. It is also used as a baseline for geolocation prediction in social media data [30,31,37].

4.4.2. Support Vector Machine

Support vector machine is a supervised learning technique used to separate classes using a hyperplane. It works by finding the best hyperplane, i.e., decision boundary, to separate the distance between classes in vector space. It can be used for both linear and nonlinear problems. It works best in cases where the vectors can be linearly separable. Therefore, it is very well suited for text classification, which can mostly be linearly separable [61]. Support vector machine has been used in previous geolocation prediction studies due to its effective performance [62,63,64].

4.4.3. Logistic Regression

Logistic regression is a statistical method that aims to determine the relationship between variables when the dependent variable is categorical. It examines the probability that a sample belongs to a specific class. It uses maximum likelihood estimation (MLE) to find the most optimal decision boundary to separate classes. Logistic regression has a fairly close relationship with the neural network with the advantages of being more efficient to train and easier to implement and interpret [65]. Related work that used logistic regression to predict location from tweets includes the studies by Han et al. [31], Wing et al. [66], and Ebrahimi et al. [67].

4.4.4. Long Short-Term Memory

Long short-term memory (LSTM) is a recurrent neural network intended to overcome the vanishing gradient in the long-term dependency problem. It has input gates, forget gates, and output gates to filter the information passing to the next cell in the data sequence. The LSTM equation is as follows.
i t = σ ( W i [ ˙ x t , h t 1 ] + b i )
f t = σ ( W f [ x t , h t 1 ] + b f )
c t = t a n ( W c [ x t , h t 1 ] + b c )
c t = f t c t 1 + i t c t
o t = σ ( W o [ x t , h t 1 ] + b o )
h t = o t t a n ( c t )
where i t is input gate, f t is forget gate, c t is cell state, o t is output gate, and h t is activation function. x t is a sequence vector and h t is state sequence at time t. W is weight and b is bias representation of each equation. In the case of location prediction, LSTM is expected to examine the context of a text and then classify it into a specific location class based on the context. A text is a sequence of words, each embedded as a vector. Each vector is passed to c t from c t 1 . f t determines what information from the previous state can be ignored. i t decides which information is updated. c t creates a c t vector, which is then added into the state. c t is then updated using the information from f t and c t . A single sequence representation is produced as a result of the concatenated vector representation. A dense neural network is then used to perform the location prediction. Figure 6 depicts the processes that occur within an LSTM cell.

4.4.5. IndoBERT

IndoBERT is a BERT transformer model specifically pretrained for the Indonesian corpus. BERT is trained to learn words in all their positions. Therefore, BERT is expected to learn the context of a sequence better than LSTM since the latter is only trained to learn the context of a word left-to-right to predict the next word or right-to-left to predict the previous word in a sequence.
BERT consists of encoders, which are each blocks based on a transformer [69]. In text classification, BERT accepts input in the form of a text string with a maximum length of 512 tokens to be represented as vectors. For each input, a special symbol (CLS) is added at the beginning of the sequence. A special token (SEP) divides each sequence into segments by learning segment embeddings, i.e., determining whether the token comes from sentence A or sentence B. Additionally, to learn its position in the sequence, each token is assigned a positional embedding. As a result, the input representation of a token is the sum of the token, segment, and position embeddings that correspond to it. In order to generate the final representation, the results of this embedding are sent to the self-attention layer and feed-forward neural network for each block. After generating the final text representation, a fully connected layer is stacked on top of the BERT to predict the probability of text labels. Figure 7 shows an illustration of location prediction using BERT.
Willie et al.’s IndoBERT [39] gave promising results for 12 downstream NLP tasks for both formal and colloquial languages. Koto et al., after publishing IndoBERT [40], also trained BERT specifically for Indonesian Twitter data and developed the IndoBERTweet model [40].
During fine-tuning, the previously trained BERT model parameters were updated as they were trained on our dataset. The pretrained IndoBERT and IndoBERTweet have better word representation because they were trained on a large Indonesian Twitter corpus. Since the models were trained on a large corpus, we had to refine them for downstream tasks.

5. Experiment

We divided the dataset into 80% training data and 20% testing data. The training data were then further divided into 90% training data and 10% validation data. Note that we split the dataset at the user level stratified by the user’s home location. The total datasets for training, validation, and testing were 979, 109, and 272 users, respectively. We used the Scikit-Learn (https://scikit-learn.org/stable/, accessed on 12 May 2022) library for naïve Bayes, support vector machine, and logistic regression. In the case of LSTM, we used the Pytorch (https://pytorch.org/docs/stable/generated/torch.nn.LSTM.html, accessed on 12 May 2022) Library. When fine-tuning BERT, we used the transformer library from Hugging Face (https://huggingface.co/docs/transformers/index, accessed on 12 May 2022). The hyperparameters of the models used are shown in the Appendix A.
We conducted some sets of location prediction experiments on our dataset:
(i)
Display name experiment: Each display name was treated as a TF-IDF bag of word unigrams, and predictions were made with naïve Bayes, support vector machine, and logistic regression.
(ii)
User description experiment: As per the previous experiment, the user description was also treated as a TF-IDF bag of word unigrams and the same three machine learning algorithms were applied.
(iii)
Tweets experiment: In addition to the three machine learning algorithms, we also implemented LSTM and BERT, as mentioned in Section 4.3. In this step, we discuss two scenarios:
(a)
Majority vote: The location of the tweet was predicted separately and we determined the user’s location by majority vote.
(b)
Tweet aggregation as one: We aggregated all user tweets into one text for each user and then made user-level predictions.
(iv)
All features experiment: Using all features, i.e., display name, user description, and user tweets, we applied two approaches to predict the user’s location.
  • Predict and vote
    We combined the best prediction results from display name experiment (i), description experiment (ii), and tweets experiment (iii). We stored the best prediction results with each experiment and had the majority vote as the final result. If the prediction results for the three experiments were different, we set the tweet prediction result as the default. For example, a user was predicted to be in Bali and Nusa Tenggara in display name experiment (i) and description experiment (ii), but in Maluku and Papua in tweet experiment (iii). Since the first two results indicate that the user is located in Bali and Nusa Tenggara, the majority voting result indicates that the user is in Bali and Nusa Tenggara.
  • Concatenate and predict
    In this experiment, we performed the concatenation of the display name, user description, and tweets to make predictions. Two approaches similar to the tweet-only experiments (iii) were used, namely, majority vote and tweet aggregation as one. The majority voting method combines each user’s display name, description, and tweet as a single text. The user’s home location was predicted for each text. Since there are 100 tweets for each user, there are 100 predictions for each user. We then determined the user’s location by applying the majority vote. On the other hand, the aggregation approach combines a user’s display name, description, and all aggregated tweets into a single text to enable user-level prediction. This results in one prediction for each user.
    Since we used IndoBERT and IndoBERTweet models that rely on the context in the text, before concatenating all the features (display name, description, and tweets), we made sure they had context information. The display name is a short text string containing only the user’s name, so we added context before combining the display name with the description and tweets. The context is “nama saya adalah d i s p l a y n a m e ” (my name is d i s p l a y n a m e ). The display name was then concatenated with the description and the tweet, which already has context. Each user’s display name, description, and individual tweet were treated as sentences separated by a period.
(v)
Experiment with NER: We extracted the named entities from each attribute in display name experiment (i), user description experiment (ii), and tweets experiment (iii). Each entity was duplicated and returned to the original text. We then performed classifications as in display name experiment (i), description (ii), tweet experiment (iii), and all features experiment (iv).
(vi)
Cross-testing experiment: Using the best results from the previous experiment, we attempted to determine the difference in location prediction between individuals and organizational users. We divided the data into three categories: (1) person, consisting of human user data only; (2) nonperson, consisting of organizational data only; and (3) all, consisting of both human and organizational data. We conducted training separately on person and nonperson data. We tested the training results for person data on nonperson and all data. We then performed the cross-test; i.e., we tested the results of nonperson on person and all.

6. Results

6.1. Results Using Only Display Name

In this experiment, logistic regression obtained the best results, with an accuracy of 0.41 and an F1 score of 0.43. The use of the display name alone showed high accuracy, averaging 0.39 across all three machine learning algorithms. This may be because the share of organizational accounts in the dataset was quite large, at 50%, and such accounts tend to mention location entities in their display names. An example is regional government organizations, such as Pemerintah Provinsi Sulawesi Selatan (South Sulawesi Provincial Government). Table 1 presents the results for accuracy of prediction using display name and user description.

6.2. Results Using Only User Description

As in the previous result with display name, logistic regression showed the best results with an accuracy of 0.39. The accuracy of logistic regression, naïve Bayes, and support vector machine was generally less than in Section 6.1. This might have been caused by the requirement to fill in the user description attribute itself. A user can leave the user description blank, while they have to provide a display name for their account. Data on test results that went through the cleaning process showed that 8.5 percent of user descriptions were empty. This was eleven times more than in the case of display name, which had just 0.8 percent empty data. Therefore, more blank data led to lower prediction accuracy.

6.3. Results Using Only User Tweets

In this section, we discuss two scenarios. The first scenario predicted the location of each tweet separately and then determined the user’s location by majority vote. In the second scenario, we aggregated all user tweets into one text for each user and then made user-level predictions.

6.3.1. Majority Vote

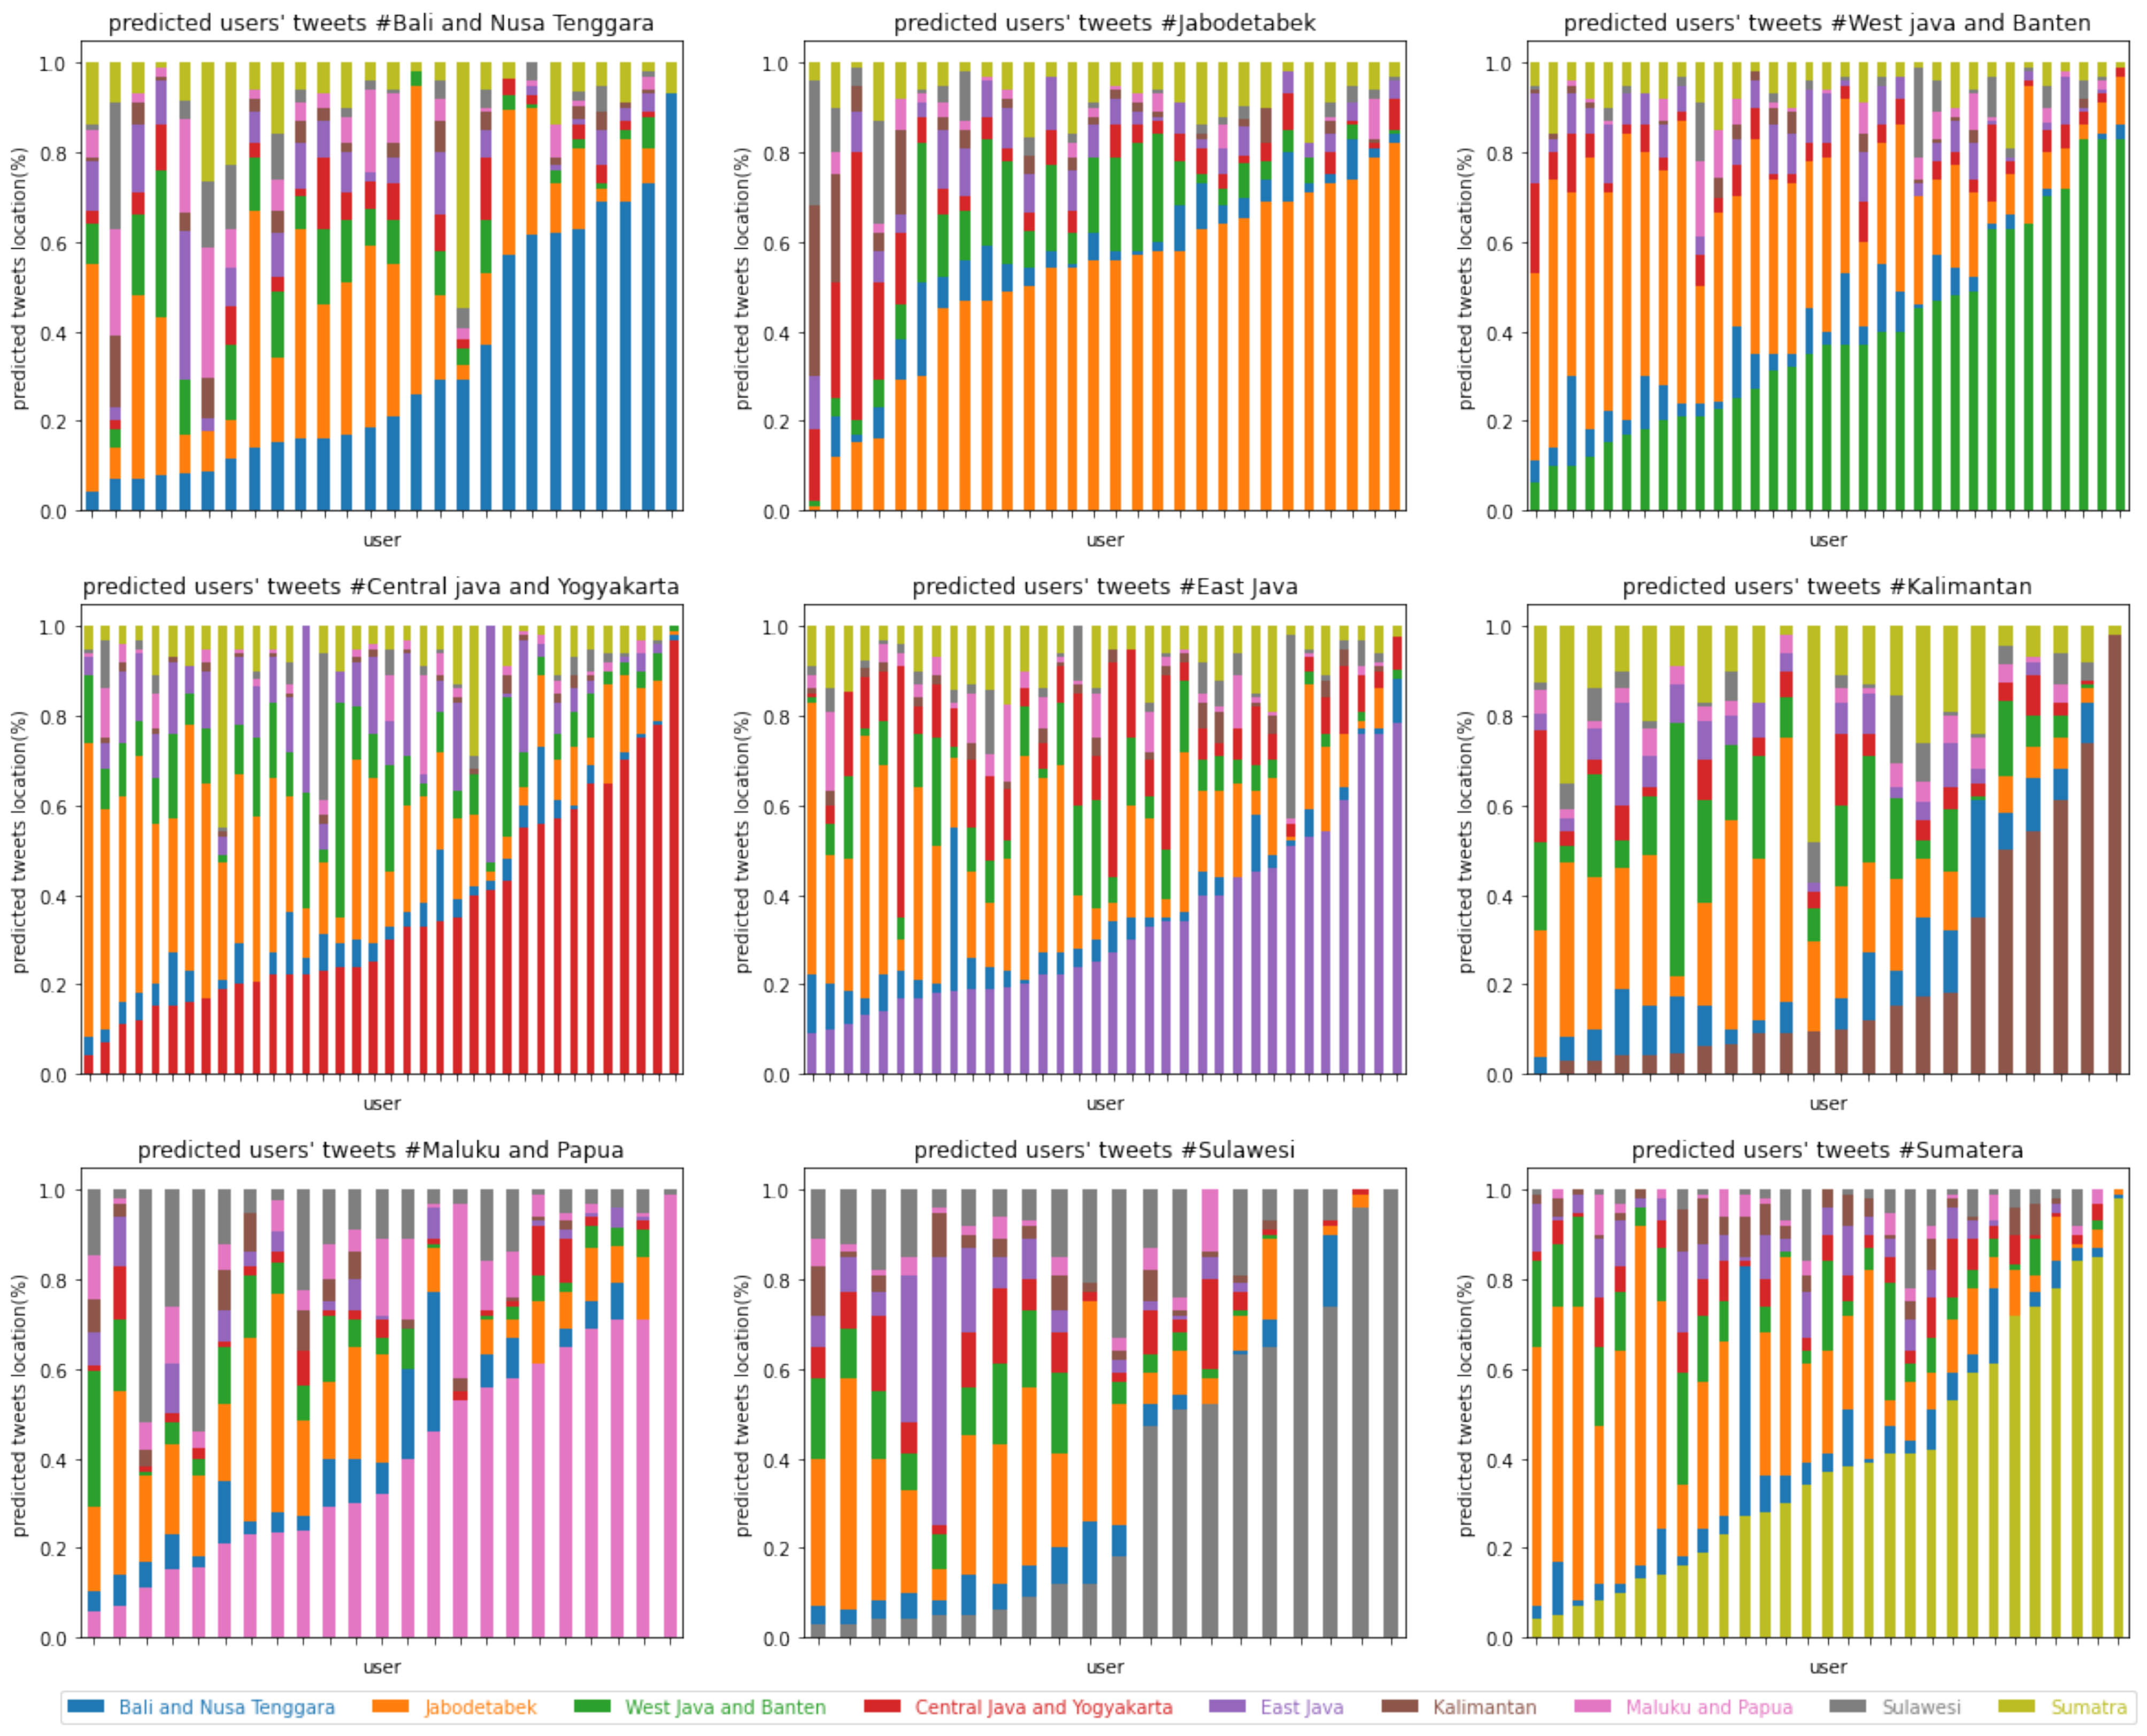
Using the majority vote scenario, i.e., choosing the most frequent location prediction result for a user’s tweets, the best result was obtained by logistic regression, followed by IndoBERTweet and IndoBERT. IndoBERTweet obtained an accuracy of 0.56 and an F1 score of 0.58, an increase of 7 percent from IndoBERT with an F1 score of 0.51. Prediction results using IndoBERTweet are shown in Figure 8. In general, the classification results for each user’s tweets were highly variable. Consequently, the use of majority vote may not work in some cases, even though some tweets are successfully classified in the correct class. For example, in every class, all users always had tweets that were correctly classified. However, when a majority vote was conducted, the number of users classified in this class was reduced. This may be caused by the tweet topic, which tends to be quite varied. It may even be unrelated to the area where the user lives.

6.3.2. Tweet Aggregation into One Text

By merging all tweets of a user into one text, the best outcome was obtained by IndoBERT, followed by logistic regression and support vector machine. There was a significant 17 percent increase in accuracy of IndoBERT under this scenario compared the the best result in the majority voting scenario (
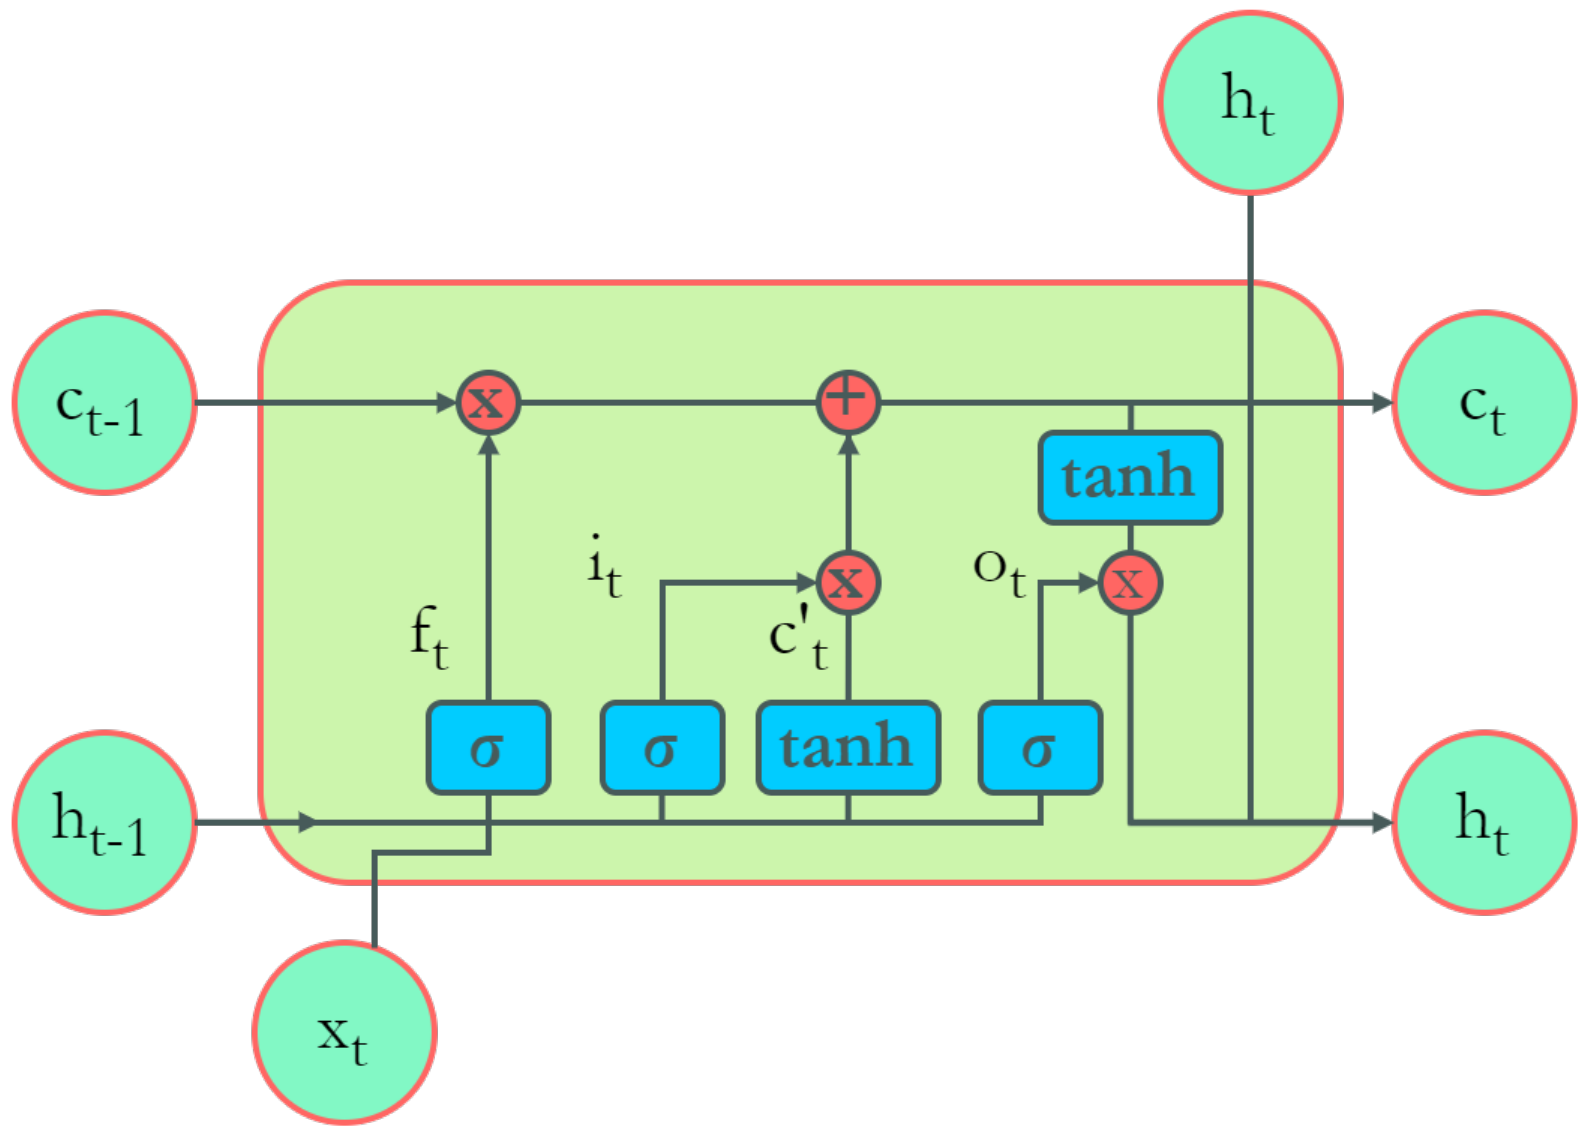
Table 2). In contrast to IndoBERT, the performance of LSTM and IndoBERTweet decreased significantly under the tweet aggregation scenario (Table 3), which suggests that this scenario is not suitable for the two models for this task.

6.4. Results Using Display Name, User Description, and User Tweets

Overall, in the predict and vote experiment, combining the best results from display names, user descriptions, and user tweets did not result in increased accuracy compared to using user tweets alone. Under the majority voting scenario for user tweets, the best accuracy dropped slightly from 0.58 to 0.50 when combined with the display name and user description prediction results; in addition, the best accuracy of the aggregate tweet scenario dropped from 0.75 to 0.58. Table 4 shows the results.
In contrast, in the concatenate and predict experiment, there was an increase in accuracy in both the majority and aggregation voting scenarios. When using majority voting with combined text, there was a 4% increase in accuracy compared to using only tweets. Meanwhile, the accuracy of combining display names, descriptions, and tweet aggregation techniques increased by 2% compared to tweet aggregation alone.
After we combined the display name, description, and tweet, the resulting accuracy showed a slight increase. This was because tweets contain more contextual information about the user than display names and descriptions. The display name attribute is limited to 50 characters and the description is limited to 160 characters, as specified in the problem formulation. A tweet, on the other hand, can be up to 280 characters long. In this study, a maximum of 100 tweets were used to predict the user’s location. As a result, tweets could undoubtedly provide the most detailed information, compared to display names and descriptions, to identify the user’s location.

6.5. Results with NER

The named entities in each attribute in Section 6.1, Section 6.2 and Section 6.3 were extracted using IndoBERTweet. We then performed separate classifications, as in Section 6.1, Section 6.2, Section 6.3 and Section 6.4. However, the highest accuracy we achieved was 0.71 using IndoBERT under tweet aggregation scenario. This method was no better without named entities extraction, which can reach an accuracy of 0.75 with IndoBERT under the same scenario.

6.6. Cross-Testing Results

Cross-testing was performed with IndoBERT because it produced the best results in the previous stage. Table 5 shows the results of the cross-testing experiment. Nonperson had an accuracy of 0.84 when tested on nonperson. However, accuracy decreased to 0.54 and 0.60 when tested on person and all, respectively. While person had a low accuracy when tested on person, when we tested it on nonperson and all, accuracy increased to 0.60 and 0.68, respectively.
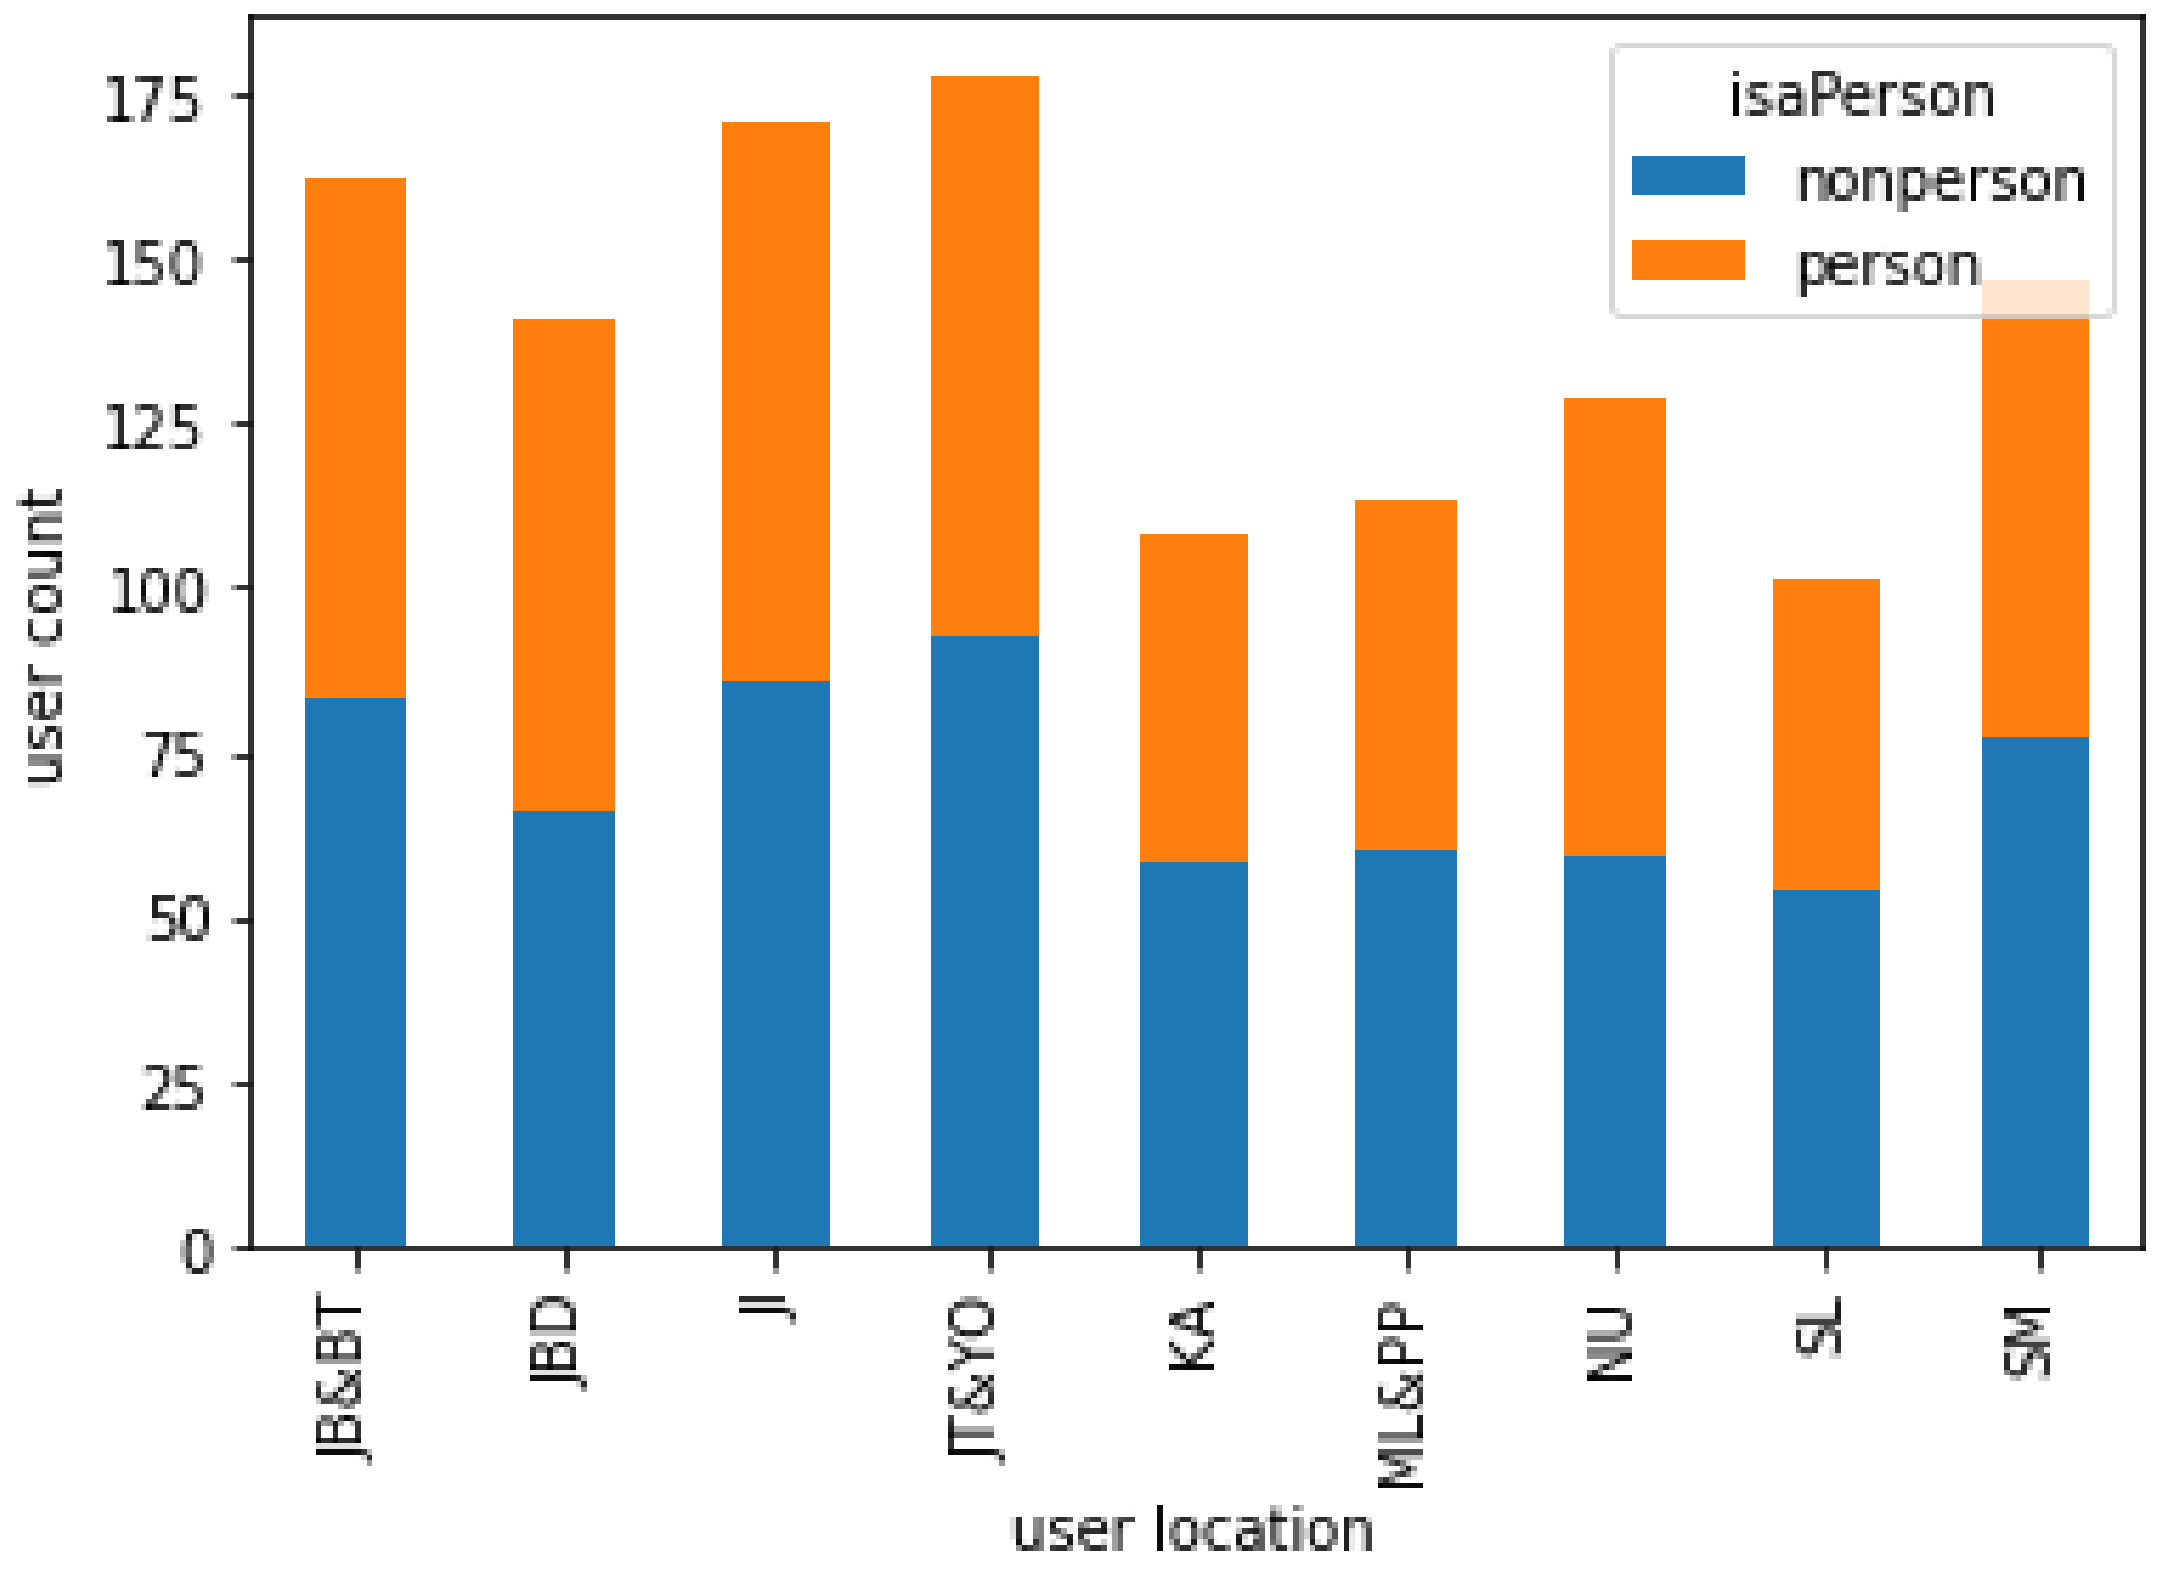
The dataset should not have a high proportion of data on organizational users, as this will lead to overfitting. At the same time, the lack of organizational user categories in training data can reduce accuracy. Therefore, we conclude that the composition of the dataset, i.e., the number of individual and organizational categories in the dataset, can affect the prediction results.

7. Discussion

In general, when using machine learning algorithms, logistic regression can provide the best results compared to naïve Bayes and support vector machine. Compared to TF-IDF representation and classification using logistic regression, the use of BERT for word representation resulted in better accuracy and F1 scores.
Table 6 shows some examples of predicting the location of tweets using IndoBERTweet in the majority vote scenario. We found that tweets containing specific terms and entities tended to be associated with specific locations. Tweets containing location entities, such as “Bali”, “Lombok”, and “Nusa Tenggara”, and specific terms, such as “Galungan” and “Kuningan” (“Galungan” and “Kuningan” are Hindu holidays; Bali is the only province in Indonesia where the majority of population is Hindu [70]), were always predicted in Bali and Nusa Tenggara. However, this association may result in misclassification. The third row was predicted in the Jabodetabek class because it mentioned entities related to Jabodetabek, i.e., “Jakarta”. Similarly, the fourth and fifth rows were also misclassified in Bali and Nusa Tenggara because the tweets mentioned entities and terms related to Bali and Nusa Tenggara. Considering that individuals tend to mention local entities and events in their area more often than in other areas, more tweets are necessary to infer a more accurate user location in the majority vote scenario.
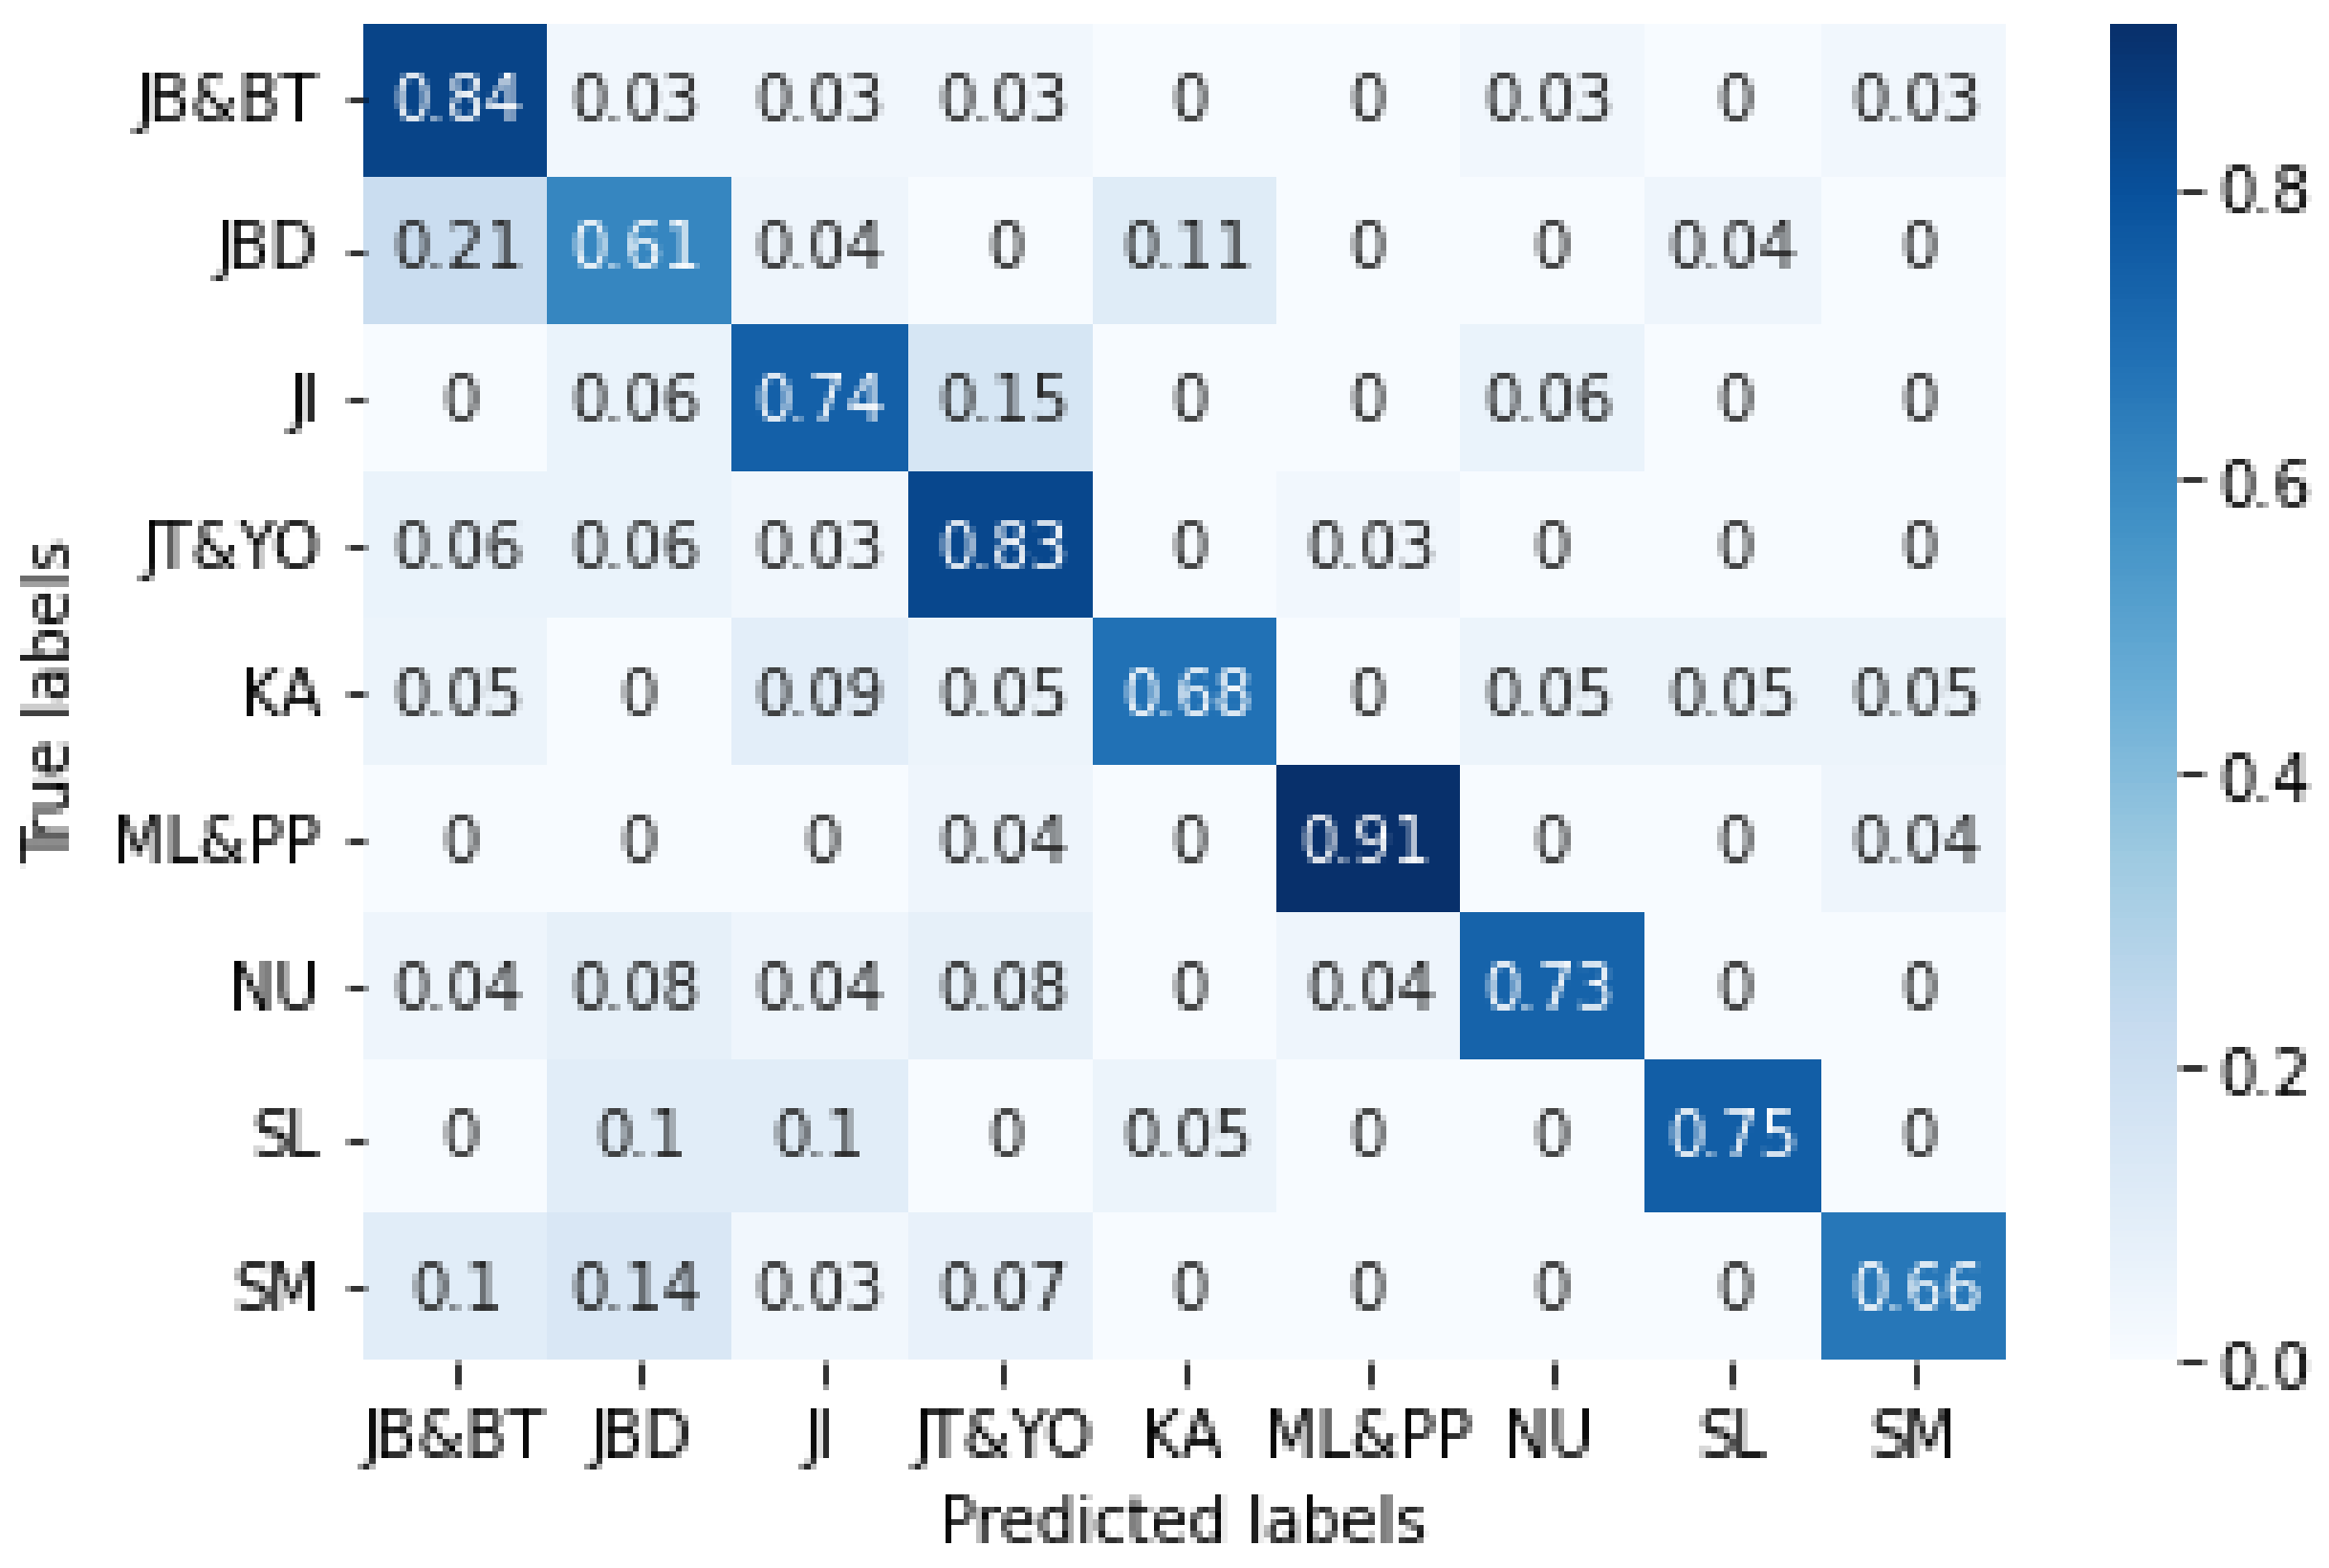
The experimental results for aggregated tweets showed increased accuracy. The normalized confusion matrix obtained with IndoBERT with aggregated tweets can be seen in Figure 9. Pairs of labels and names for these regions are as follows: JB&BT: West Java and Banten, JBD: Jabodetabek, JI: East Java, JT&YO: Central Java and Yogyakarta, KA: Kalimantan, ML&PP: Maluku and Papua, NU: Bali and Nusa Tenggara, SL: Sulawesi, and SM: Sumatra [71].
Figure 9 shows that the Maluku and Papua class had the highest percentage of correct predictions at 0.91, followed by the West Java and Banten class at 0.84 correct predictions. The classes with the lowest percentages of correct predictions were from Jabodetabek (Jakarta, Bogor, Tangerang, Depok, and Bekasi). This is remarkable considering that the cities of Bogor, Depok, and Bekasi are administratively part of West Java Province and Tangerang City is part of Banten Province, so the characteristics of the tweets in the two classes may show similarities. Figure 9 shows that up to 21 percent of the tweets in West Java and Banten class are expected to belong to the Jabodetabek class.
Our results show that IndoBERT, which is a BERT model that has been trained on the Indonesian dataset [39,41], can generally outperform machine learning algorithms in generating location predictions. However, using IndoBERT does not produce accurate results in some cases, as shown in Table 6. The table lists some cases where the IndoBERT model failed to predict the home locations for the given tweets. The actual home locations for the last three tweets in the table are “Bali and Nusa Tenggara”, but the model makes incorrect predictions for all these tweets.
From the table, we can see some limitations of the IndoBERT model when predicting the user home location. The model could not predict correctly when the tweet texts show locations which do not reflect the home location of the user. The fourth tweet contains terms “Bali” and “Lombok” (i.e., Lombok is located in Nusa Tenggara), while the fifth tweet contains terms “Galungan” (i.e., a Balinese holiday), which causes the model to predict the location of these tweets as “Bali and Nusa Tenggara”. However, the actual home locations of the users for these tweets are “Jabodetabek” and “Maluku and Papua”, respectively. Therefore, in this case, using tweet text only with the IndoBERT model is not enough to make accurate prediction. We may need extra information that can guide the model to the actual home locations, such as using time zone information [46] and friend networks [43,46].
The model could not predict correctly for certain locations which are not that popular, so they probably do not appear frequently in the dataset used for training the IndoBERT. Although the sixth tweet contain term “Bakunase” and the seventh tweet contain terms “Pagar Panjang” and “Danau Ina” that clearly show the home location of the user (i.e., Bakunase, Pagar Panjang, and Danau Ina are places in Nusa Tenggara Timur), the model could not make accurate predictions for these tweets.
Finally, the model could not predict correctly for tweets that contain ambiguous words which actually denote the location. The term “Seroja” in the eighth tweet actually indicates the “Badai Seroja” (Cyclone Seroja) which happened in Nusa Tenggara Timur during 3–12 April 2021, but the IndoBERT seemingly could not capture this meaning, probably because “Seroja” has a more general meaning as a certain kind of flower.
In general, this research has some limitations that could be improved in future work. The dataset we used does not cover all provinces in Indonesia, i.e., 34 provinces. As a result, we cannot estimate a user’s location down to province and city level. It would be better if this research can be applied to a larger scope and a more detailed user location level (e.g., province level). For this purpose, we may need to create a bigger dataset which contains more complete annotations for all provinces in Indonesia. However, adding datasets will be proportional to the many costs involved, especially in the data annotation process. Hence, we need another method that is automated to reduce the cost in the annotation process, and therefore it is aimed for future work.
This research only focuses on Indonesian-language tweets. Therefore, it cannot be concluded that the methods used in this research are also effective for tweets in other languages or in code-mixed languages [72,73]. Further studies are needed to test the effectiveness of the methods in other languages. Finally, the features used in this study are limited to text features: user name, user description, and user tweets. In our experiments, the combination of the three gave the best results. In future work, it is also necessary to consider cross-feature to see the interaction between features. In addition, several other features could be incorporated, such as time zone information [46] and friend networks [43,46]. In addition, deep learning methods using attention mechanism may also be explored to combine features directly in a single model [74].

8. Conclusions

In this study, we collected Indonesian-language Twitter data to identify the home location of Twitter users. Home location was divided into nine regions according to the geographical characteristics of Indonesia. We used three user attributes, i.e., display name, user description, and user tweets, and performed location prediction experiments using some machine learning algorithms and deep learning models. Two scenarios were applied to predict user’s home location using tweet attributes: majority vote and tweet aggregation into one text. We also concatenated display name, description, and tweets and performed the same scenario, namely, majority voting and text aggregation in one. The results of our analysis show that fine-tuning IndoBERT on concatenated display names, descriptions, and aggregate tweet can produce the highest accuracy of 0.77 with an F1 score of 0.78, compared to IndoBERTweet with an accuracy of 0.62 and an F1 score of 0.63, on the majority vote scenario. IndoBERT can show good results compared to machine learning algorithms and LSTM. The best result of machine learning was 0.58 for logistic regression and the best result of LSTM was 0.46, each under the majority vote scenario on tweet. In future research, we recommend using larger datasets to make location predictions for a wider area and at a more detailed level.

Author Contributions

Conceptualization, L.F.S., R.M. and E.Y.; methodology, L.F.S., R.M. and E.Y.; code, L.F.S.; formal analysis, L.F.S., R.M. and E.Y.; resources, L.F.S.; data curation, L.F.S. and R.M.; writing—original draft preparation, L.F.S., writing—review and editing, R.M. and E.Y.; visualization, L.F.S. and R.M.; supervision, R.M. and E.Y.; project administration, R.M. and E.Y.; funding acquisition, R.M. All authors have read and agreed to the published version of the manuscript.

Funding

The APC was funded by Universitas Indonesia, under Hibah PPI Q1 2021 (Grant No. NKB-546/UN2.RST/HKP.05.00/2021).

Institutional Review Board Statement

Not applicable.

Informed Consent Statement

Not applicable.

Data Availability Statement

The data presented in this study are available on request from the corresponding author.

Conflicts of Interest

The authors declare no conflict of interest.

Appendix A. Model Hyperparameters

Appendix A.1. Naïve Bayes

Implemented using sklearn library, from the package of MultinomialNB.
  • alpha = 1.0
  • fit_prior = True
  • class_prior = None

Appendix A.2. Support Vector Machine

Implemented using sklearn library, from the package of SVC.
  • C = 1.0
  • gamma = ‘scale’
  • kernel = ‘rbf’

Appendix A.3. Logistic Regression

Implemented using sklearn library, from the package of LogisticRegression.
  • penalty = l2
  • C = 1
  • solver = ‘lbfgs’
  • multi_class = ‘multinomial’

Appendix A.4. Long Short-Term Memory

Implemented using Pytorch library, from the package of LSTM.
  • embedding size = 200
  • batch size = 128
  • drop out rate = 0.25
  • optimizer = AdamW
  • learning rate = 5 × 10 3

Appendix A.5. BERT

Implemented using Hugging Face library, from the package of transformers.
  • max sequence length = 280 (majority vote), 512 (aggregate)
  • batch size = 16
  • epochs = 7
  • attention drop out rate = 0.3
  • hidden layers drop out rate = 0.3
  • optimizer = AdamW
  • learning rate = 2 × 10 5

References

  1. Most Popular Social Networks Worldwide as of January 2022, Ranked by Number of Monthly Active Users. Available online: https://www.statista.com/statistics/272014/global-social-networks-ranked-by-number-of-users/ (accessed on 25 May 2022).
  2. Twitter Usage Statistics. Available online: https://www.internetlivestats.com/twitter-statistics/ (accessed on 20 November 2021).
  3. Nakov, P.; Ritter, A.; Rosenthal, S.; Sebastiani, F.; Stoyanov, V. SemEval-2016 Task 4: Sentiment Analysis in Twitter. In Proceedings of the 10th International Workshop on Semantic Evaluation (SemEval-2016); Association for Computational Linguistics: San Diego, CA, USA, 2016; pp. 1–18. [Google Scholar] [CrossRef]
  4. Mohammad, S.M.; Sobhani, P.; Kiritchenko, S. Stance and Sentiment in Tweets. ACM Trans. Internet Technol. 2017, 17, 1–23. [Google Scholar] [CrossRef] [Green Version]
  5. Anastasia, S.; Budi, I. Twitter sentiment analysis of online transportation service providers. In Proceedings of the 2016 International Conference on Advanced Computer Science and Information Systems (ICACSIS), Malang, Indonesia, 15–16 October 2016; pp. 359–365. [Google Scholar]
  6. Kanugrahan, G.; Wicaksono, A.F. Sentiment Analysis of Face-to-face Learning during Covid-19 Pandemic using Twitter Data. In Proceedings of the 2021 8th International Conference on Advanced Informatics: Concepts, Theory and Applications (ICAICTA), Bandung, Indonesia, 29–30 September 2021; pp. 1–6. [Google Scholar]
  7. Kaunang, C.P.S.; Amastini, F.; Mahendra, R. Analyzing Stance and Topic of E-Cigarette Conversations on Twitter: Case Study in Indonesia. In Proceedings of the 2021 IEEE 11th Annual Computing and Communication Workshop and Conference (CCWC), Las Vegas, NV, USA, 27–30 January 2021; pp. 304–310. [Google Scholar]
  8. Nababan, A.H.; Mahendra, R.; Budi, I. Twitter stance detection towards Job Creation Bill. Procedia Comput. Sci. 2022, 197, 76–81. [Google Scholar] [CrossRef]
  9. Waseem, Z.; Hovy, D. Hateful Symbols or Hateful People? Predictive Features for Hate Speech Detection on Twitter. In Proceedings of the NAACL Student Research Workshop; Association for Computational Linguistics: San Diego, CA, USA, 2016; pp. 88–93. [Google Scholar] [CrossRef]
  10. Watanabe, H.; Bouazizi, M.; Ohtsuki, T. Hate Speech on Twitter: A Pragmatic Approach to Collect Hateful and Offensive Expressions and Perform Hate Speech Detection. IEEE Access 2018, 6, 13825–13835. [Google Scholar] [CrossRef]
  11. Buntain, C.; Golbeck, J. Automatically Identifying Fake News in Popular Twitter Threads. In Proceedings of the 2017 IEEE International Conference on Smart Cloud (SmartCloud), New York, NY, USA, 3–5 November 2017; pp. 208–215. [Google Scholar] [CrossRef] [Green Version]
  12. Ibrohim, M.O.; Budi, I. Multi-label Hate Speech and Abusive Language Detection in Indonesian Twitter. In Proceedings of the Third Workshop on Abusive Language Online; Association for Computational Linguistics: Florence, Italy, 2019; pp. 46–57. [Google Scholar] [CrossRef] [Green Version]
  13. Widaretna, T.; Tirtawangsa, J.; Romadhony, A. Hoax Identification on Tweets in Indonesia Using Doc2Vec. In Proceedings of the 2021 9th International Conference on Information and Communication Technology (ICoICT), Yogyakarta, Indonesia, 4–5 August 2021; pp. 456–461. [Google Scholar] [CrossRef]
  14. Faisal, D.R.; Mahendra, R. Two-Stage Classifier for COVID-19 Misinformation Detection Using BERT: A Study on Indonesian Tweets. arXiv 2022. [Google Scholar] [CrossRef]
  15. D’Andrea, E.; Ducange, P.; Lazzerini, B.; Marcelloni, F. Real-time detection of traffic from twitter stream analysis. IEEE Trans. Intell. Transp. Syst. 2015, 16, 2269–2283. [Google Scholar] [CrossRef]
  16. Hanifah, R.; Supangkat, S.H.; Purwarianti, A. Twitter Information Extraction for Smart City. In Proceedings of the 2014 International Conference on ICT For Smart Society (ICISS), Bandung, Indonesia, 24–25 September 2014; pp. 295–299. [Google Scholar]
  17. Putra, P.K.; Mahendra, R.; Budi, I. Traffic and Road Conditions Monitoring System Using Extracted Information from Twitter. J. Big Data 2022, 9, 65. [Google Scholar] [CrossRef]
  18. Carley, K.M.; Malik, M.; Landwehr, P.M.; Pfeffer, J.; Kowalchuck, M. Crowd sourcing disaster management: The complex nature of Twitter usage in Padang Indonesia. Saf. Sci. 2016, 90, 48–61. [Google Scholar] [CrossRef] [Green Version]
  19. Interdonato, R.; Guillaume, J.L.; Doucet, A. A lightweight and multilingual framework for crisis information extraction from Twitter data. Soc. Netw. Anal. Min. 2019, 9, 65. [Google Scholar] [CrossRef]
  20. Alam, F.; Qazi, U.; Imran, M.; Ofli, F. HumAID: Human-Annotated Disaster Incidents Data from Twitter with Deep Learning Benchmarks. In Proceedings of the Fifteenth International AAAI Conference on Web and Social Media, ICWSM, Virtually, 7–10 June 2021; AAAI Press: Palo Alto, CA, USA, 2021; pp. 933–942. [Google Scholar]
  21. Chen, E.; Lerman, K.; Ferrara, E. Tracking Social Media Discourse About the COVID-19 Pandemic: Development of a Public Coronavirus Twitter Dataset. JMIR Public Health Surveill. 2020, 6, e19273. [Google Scholar] [CrossRef]
  22. Chew, C.; Eysenbach, G. Pandemics in the Age of Twitter: Content Analysis of Tweets during the 2009 H1N1 Outbreak. PLoS ONE 2020, 5, e14118. [Google Scholar] [CrossRef]
  23. Nikam, R.; Bhokare, R.; Chavan, S.; Sonawane, R.; Adhav, D. Location Based Fake News Detection using Machine Learning. iJRASET 2021, 9, 1549–1553. [Google Scholar] [CrossRef]
  24. Wakamiya, S.; Kawai, Y.; Aramaki, E. Twitter-Based Influenza Detection After Flu Peak via Tweets with Indirect Information: Text Mining Study. JMIR Public Health Surveill. 2018, 4, e65. [Google Scholar] [CrossRef]
  25. Almatrafi, O.; Parack, S.; Chavan, B. Application of Location-Based Sentiment Analysis Using Twitter for Identifying Trends Towards Indian General Elections 2014. In Proceedings of the 9th International Conference on Ubiquitous Information Management and Communication, Bali, Indonesia, 8–10 January 2015; Association for Computing Machinery: New York, NY, USA, 2015; pp. 1–5. [Google Scholar] [CrossRef]
  26. Yaqub, U.; Sharma, N.; Pabreja, R.; Chun, S.A.; Atluri, V.; Vaidya, J. Location-Based Sentiment Analyses and Visualization of Twitter Election Data. Digit. Gov. Res. Pract. 2020, 1, 1–19. [Google Scholar] [CrossRef]
  27. Arafat, T.A.; Budi, I.; Mahendra, R.; Salehah, D.A. Demographic Analysis of Candidates Supporter in Twitter During Indonesian Presidential Election 2019. In Proceedings of the 2020 International Conference on ICT for Smart Society (ICISS), Bandung, Indonesia, 19–20 November 2020; pp. 1–6. [Google Scholar]
  28. Cheng, Z.; Caverlee, J.; Lee, K. You Are Where You Tweet: A Content-Based Approach to Geo-Locating Twitter Users. In Proceedings of the 19th ACM International Conference on Information and Knowledge Management, Toronto, ON, Canada, 26–30 October 2010; Association for Computing Machinery: New York, NY, USA, 2010; pp. 1–5. [Google Scholar] [CrossRef]
  29. Roller, S.; Speriosu, M.; Rallapalli, S.; Wing, B.; Baldridge, J. Supervised Text-based Geolocation Using Language Models on an Adaptive Grid. In Proceedings of the the 2012 Joint Conference on Empirical Methods in Natural Language Processing and Computational Natural Language Learning, Jeju Island, Korea, 12–14 July 2012; Association for Computational Linguistics: Stroudsburg, PA, USA, 2012; pp. 1500–1510. [Google Scholar]
  30. Han, B.; Cook, P.; Baldwin, T. Geolocation Prediction in Social Media Data by Finding Location Indicative Words. In Proceedings of the COLING, Mumbai, India, 8–15 December 2012; The COLING 2012 Organizing Committee: Mumbai, India, 2012; pp. 1045–1062. [Google Scholar]
  31. Han, B.; Rahimi, A.; Derczynski, L.; Baldwin, T. Twitter Geolocation Prediction Shared Task of the 2016 Workshop on Noisy User-generated Text. In Proceedings of the 2nd Workshop on Noisy User-Generated Text (WNUT), Osaka, Japan, 11–16 December 2016; The COLING 2016 Organizing Committee: Osaka, Japan, 2016; pp. 213–217. [Google Scholar]
  32. Leading Countries Based on Number of Twitter Users as of January 2022. Available online: https://www.statista.com/statistics/242606/number-of-active-twitter-users-in-selected-countries/ (accessed on 30 May 2022).
  33. Han, B.; Cook, P.; Baldwin, T. Text-Based Twitter User Geolocation Prediction. J. Artif. Intell. Res. 2014, 49, 451–500. [Google Scholar] [CrossRef]
  34. Izbicki, M.; Papalexakis, V.; Tsotras, V. Geolocating Tweets in Any Language at Any Location. In Proceedings of the 28th ACM International Conference on Information and Knowledge Management, Beijing, China, 3–7 November 2019; Association for Computing Machinery: New York, NY, USA, 2019; pp. 89–98. [Google Scholar] [CrossRef]
  35. Qian, C.; Yi, C.; Cheng, C.; Pu, G.; Liu, J. A Coarse-to-Fine Model for Geolocating Chinese Addresses. ISPRS Int. J. Geo-Inf. 2020, 9, 698. [Google Scholar] [CrossRef]
  36. Scherrer, Y.; Ljubešić, N. HeLju@VarDial 2020: Social Media Variety Geolocation with BERT Models. In Proceedings of the 7th Workshop on NLP for Similar Languages, Varieties and Dialects, Barcelona, Spain, 13 December 2020; International Committee on Computational Linguistics (ICCL): Praha, Czech Republic, 2020; pp. 202–211. [Google Scholar]
  37. Indira, K.; Brumancia, E.; Kumar, P.S.; Reddy, S.P.T. Location Prediction on Twitter Using Machine Learning Techniques. In Proceedings of the 2019 3rd International Conference on Trends in Electronics and Informatics (ICOEI), Tirunelveli, India, 23–25 April 2019; pp. 700–703. [Google Scholar] [CrossRef]
  38. Devlin, J.; Chang, M.W.; Lee, K.; Toutanova, K. BERT: Pretraining of Deep Bidirectional Transformers for Language Understanding. In Proceedings of the Conference of the North American Chapter of the Association for Computational Linguistics: Human Language Technologies (NAACL-HLT 2019), Minneapolis, MN, USA, 2–7 June 2019; Association for Computational Linguistics: Stroudsburg, PA, USA, 2019; pp. 4171–4186. [Google Scholar] [CrossRef]
  39. Wilie, B.; Vincentio, K.; Winata, G.I.; Cahyawijaya, S.; Li, X.; Lim, Z.Y.; Soleman, S.; Mahendra, R.; Fung, P.; Bahar, S.; et al. IndoNLU: Benchmark and Resources for Evaluating Indonesian Natural Language Understanding. In Proceedings of the 1st Conference of the Asia-Pacific Chapter of the Association for Computational Linguistics and the 10th International Joint Conference on Natural Language Processing, Suzhou, China, 4–7 December 2020; Association for Computational Linguistics: Stroudsburg, PA, USA, 2020; pp. 843–857. [Google Scholar]
  40. Koto, F.; Rahimi, A.; Lau, J.H.; Baldwin, T. IndoLEM and IndoBERT: A Benchmark Dataset and Pretrained Language Model for Indonesian NLP. In Proceedings of the 28th International Conference on Computational Linguistics, Barcelona, Spain, 8–13 December 2020; International Committee on Computational Linguistics: Praha, Czech Republic, 2020; pp. 757–770. [Google Scholar] [CrossRef]
  41. Koto, F.; Lau, J.H.; Baldwin, T. IndoBERTweet: A Pretrained Language Model for Indonesian Twitter with Effective Domain-Specific Vocabulary Initialization. In Proceedings of the 2021 Conference on Empirical Methods in Natural Language Processing, Punta Cana, Dominican Republic, 7–11 November 2021; Association for Computational Linguistics: Stroudsburg, PA, USA, 2021; pp. 10660–10668. [Google Scholar] [CrossRef]
  42. Hecht, B.; Hong, L.; Suh, B.; Chi, E.H. Tweets from Justin Bieber’s Heart: The Dynamics of the Location Field in User Profiles. In Proceedings of the SIGCHI Conference on Human Factors in Computing Systems, Vancouver, BC, Canada, 7–12 May 2011; Association for Computing Machinery: New York, NY, USA, 2011; pp. 237–246. [Google Scholar] [CrossRef]
  43. Rahimi, A.; Vu, D.; Cohn, T.; Baldwin, T. Exploiting Text and Network Context for Geolocation of Social Media Users. In Proceedings of the 2015 Conference of the North American Chapter of the Association for Computational Linguistics: Human Language Technologies, Denver, CO, USA, 31 May–5 June 2015; Association for Computational Linguistics: Stroudsburg, PA, USA, 2015; pp. 1362–1367. [Google Scholar] [CrossRef] [Green Version]
  44. Rahimi, A.; Cohn, T.; Baldwin, T. A Neural Model for User Geolocation and Lexical Dialectology. In Proceedings of the 55th Annual Meeting of the Association for Computational Linguistics (Volume 2: Short Papers), Vancouver, BC, Canada, 30 July–4 August 2017; Association for Computational Linguistics: Stroudsburg, PA, USA, 2017; pp. 209–216. [Google Scholar] [CrossRef]
  45. Miura, Y.; Taniguchi, M.; Taniguchi, T.; Ohkuma, T. A Simple Scalable Neural Networks based Model for Geolocation Prediction in Twitter. In Proceedings of the 2nd Workshop on Noisy User-generated Text (WNUT), Osaka, Japan, 11–16 December 2016; The COLING 2016 Organizing Committee: Osaka, Japan, 2016; pp. 235–239. [Google Scholar]
  46. Miura, Y.; Taniguchi, M.; Taniguchi, T.; Ohkuma, T. Unifying Text, Metadata, and User Network Representations with a Neural Network for Geolocation Prediction. In Proceedings of the 55th Annual Meeting of the Association for Computational Linguistics, Vancouver, BC, Canada, 30 July–4 August 2017; Association for Computational Linguistics: Stroudsburg, PA, USA, 2017; pp. 1260–1272. [Google Scholar] [CrossRef] [Green Version]
  47. Zheng, X.; Han, J.; Sun, A. A Survey of Location Prediction on Twitter. IEEE Trans. Knowl. Data Eng. 2018, 30, 1652–1671. [Google Scholar] [CrossRef] [Green Version]
  48. Total Population Projection Result by Province and Gender (Thousand People), 2018–2020. Available online: https://www.bps.go.id/indicator/12/1886/1/jumlah-penduduk-hasil-proyeksi-menurut-provinsi-dan-jenis-kelamin.html (accessed on 21 November 2021).
  49. Mahendra, R.; Putra, H.S.; Faisal, D.R.; Rizki, F. Gender Prediction of Indonesian Twitter Users Using Tweet and Profile Features. J. Ilmu Komput. Inf. 2022, 15, 131–141. [Google Scholar] [CrossRef]
  50. Kim, S.M.; Paris, C.; Power, R.; Wan, S. Distinguishing Individuals from Organisations on Twitter. In Proceedings of the 26th International Conference on World Wide Web Companion (WWW ’17 Companion), Perth, Australia, 3–7 April 2017; International World Wide Web Conferences Steering Committee: Canton of Geneva, Switzerland, 2017; pp. 805–806. [Google Scholar] [CrossRef] [Green Version]
  51. Wood-Doughty, Z.; Mahajan, P.; Dredze, M. Johns Hopkins or johnny-hopkins: Classifying Individuals versus Organizations on Twitter. In Proceedings of the Second Workshop on Computational Modeling of People’s Opinions, Personality, and Emotions in Social Media, New Orleans, LA, USA, 6 June 2018; Association for Computational Linguistics: Stroudsburg, PA, USA, 2018; pp. 56–61. [Google Scholar] [CrossRef] [Green Version]
  52. Daouadi, K.E.; Rebaï, R.Z.; Amous, I. Organization vs. Individual: Twitter User Classification. In Proceedings of the International Workshop on Language Processing and Knowledge Management; LPKM: Sfax, Tunisia, 2018; pp. 1–8. [Google Scholar]
  53. Temaja, I.G.B.W.B. Sistem Penamaan Orang Bali. Dalam J. Humanika 2018, 24, 60–72. [Google Scholar] [CrossRef] [Green Version]
  54. Kurniawati, R.D.; Mulyani, S. Daftar Nama Marga/Fam, Gelar Adat dan Gelar Kebangsawanan Di Indonesia, 1st ed.; Perpustakaan Nasional RI: Jakarta, Indonesia, 2012; pp. 1–9. [Google Scholar]
  55. Liu, X.; Wei, F.; Zhang, S.; Zhou, M. Named entity recognition for tweets. ACM Trans. Intell. Syst. Technol. 2013, 4, 1–15. [Google Scholar] [CrossRef]
  56. Rachman, V.; Savitri, S.; Augustianti, F.; Mahendra, R. Named entity recognition on Indonesian Twitter posts using long short-term memory networks. In Proceedings of the 2017 International Conference on Advanced Computer Science and Information Systems (ICACSIS), Bali, Indonesia, 28–29 October 2017; pp. 228–232. [Google Scholar]
  57. Munarko, Y.; Sutrisno, M.S.; Mahardika, W.A.I.; Nuryasin, I.; Azhar, Y. Named entity recognition model for Indonesian tweet using CRF classifier. IOP Conf. Ser. Mater. Sci. Eng. 2018, 403, 012067. [Google Scholar] [CrossRef]
  58. Pratama, B.Y.; Sarno, R. Personality Classification Based on Twitter Text Using Naïve Bayes, KNN and SVM. In Proceedings of the 2015 International Conference on Data and Software Engineering (ICoDSE), Yogyakarta, Indonesia, 25–26 November 2015; pp. 170–174. [Google Scholar] [CrossRef]
  59. Wongkar, M.; Angdresey, A. Sentiment Analysis Using Naïve Bayes Algorithm Of The Data Crawler: Twitter. In Proceedings of the 2019 Fourth International Conference on Informatics and Computing (ICIC), Semarang, Indonesia, 16–17 October 2019; pp. 1–5. [Google Scholar] [CrossRef]
  60. Godara, J.; Aron, R.; Shabaz, M. Sentiment Analysis and Sarcasm Detection from Social Network to Train Health-Care Professionals. World J. Eng. 2021, 19, 124–133. [Google Scholar] [CrossRef]
  61. Joachims, T. Text Categorization with Support Vector Machines: Learning with Many Relevant Features. In Proceedings of the 10th European Conference on Machine Learning, Chemnitz, Germany, 21–23 April 1998; Springer: Berlin/Heidelberg, Germany, 1998; pp. 137–142. [Google Scholar] [CrossRef] [Green Version]
  62. Mahkovec, Z. An Agent for Categorizing and Geolocating News Articles. Informatica 2004, 28, 371–374. [Google Scholar]
  63. Rout, D.; Bontcheva, K.; Preoţiuc-Pietro, D.; Cohn, T. Where’s @wally? A Classification Approach to Geolocating Users Based on Their Social Ties. In Proceedings of the 24th ACM Conference on Hypertext and Social Media, Paris, France, 1–3 May 2013; Association for Computing Machinery: New York, NY, USA, 2013; pp. 11–20. [Google Scholar] [CrossRef]
  64. Milusheva, S.; Marty, R.; Bedoya, G.; Williams, S.; Resor, E.; Legovini, A. Applying Machine Learning and Geolocation Techniques to Social Media Data (Twitter) to Develop a Resource for Urban Planning. PLoS ONE 2021, 16, e0244317. [Google Scholar] [CrossRef]
  65. Dreiseitl, S.; Ohno-Machado, L. Logistic Regression and Artificial Neural Network Classification Models: A Methodology Review. J. Biomed. Inform. 2002, 35, 352–359. [Google Scholar] [CrossRef] [Green Version]
  66. Wing, B.; Baldridge, J. Hierarchical Discriminative Classification for Text-Based Geolocation. In Proceedings of the 2014 Conference on Empirical Methods in Natural Language Processing (EMNLP), Doha, Qatar, 25–29 October 2014; Association for Computational Linguistics: Stroudsburg, PA, USA, 2014; pp. 336–348. [Google Scholar] [CrossRef]
  67. Ebrahimi, M.; ShafieiBavani, E.; Wong, R.; Chen, F. Exploring Celebrities on Inferring User Geolocation in Twitter. In Proceedings of the Pacific-Asia Conference on Knowledge Discovery and Data Mining (PAKDD), Jeju, Korea, 23–26 May 2017; Springer, Cham: Cham, Switzerland, 2017; pp. 395–406. [Google Scholar] [CrossRef]
  68. Understanding LSTM Networks. Reproduced with Permission from Christopher Olah, Understanding Lstm Networks; Published by Colah’s Blog. 2015. Available online: http://colah.github.io/posts/2015-08-Understanding-LSTMs/ (accessed on 25 March 2022).
  69. Vaswani, A.; Shazeer, N.; Parmar, N.; Uszkoreit, J.; Jones, L.; Gomez, A.N.; Kaiser, L.; Polosukhin, I. Attention is All you Need. In Proceedings of the 31st International Conference on Neural Information Processing Systems (NIPS), Long Beach, CA, USA, 4–9 December 2017; Curran Associates Inc.: Red Hook, NY, USA, 2017; pp. 6000–6010. [Google Scholar]
  70. Population by Region and Religion. Available online: https://sp2010.bps.go.id/index.php/site/tabel?tid=321&wid=0 (accessed on 11 February 2022).
  71. ISO 3166—Codes for the Representation of Names of Countries and Their Subdivisions. Available online: https://www.iso.org/obp/ui/#iso:code:3166:ID (accessed on 30 March 2022).
  72. Barik, A.M.; Mahendra, R.; Adriani, M. Normalization of Indonesian-English Code-Mixed Twitter Data. In Proceedings of the 5th Workshop on Noisy User-generated Text (W-NUT 2019), Hong Kong, China, 4 November 2019; Association for Computational Linguistics: Stroudsburg, PA, USA, 2019; pp. 417–424. [Google Scholar] [CrossRef] [Green Version]
  73. Yulianti, E.; Kurnia, A.; Adriani, M.; Duto, Y.S. Normalisation of Indonesian-English Code-Mixed Text and its Effect on Emotion Classification. Int. J. Adv. Comput. Sci. Appl. 2021, 12, 674–685. [Google Scholar] [CrossRef]
  74. Nuranti, E.Q.; Yulianti, E.; Adriani, M.; Husin, H.S. Predicting the Category and the Length of Punishment in 2 Indonesian Courts Based on Previous Court Decision 3 Documents. Computers 2022, 11, 88. [Google Scholar] [CrossRef]
Figure 1. Illustration of home location, tweet location, and mentioned location in user profile and user tweet.
Bdcc 06 00077 g001
Figure 2. Overview of the model architecture.
Bdcc 06 00077 g002
Figure 3. Map of Indonesia divided into nine different regional categories.
Bdcc 06 00077 g003
Figure 4. Users’ location distribution.
Bdcc 06 00077 g004
Figure 5. The distribution of tweet numbers over users. Each bar on the x-axis represents the user. The y-axis represents the number of the users’ tweets.
Bdcc 06 00077 g005
Figure 6. An LSTM cell [68].
Bdcc 06 00077 g006
Figure 7. Illustration of BERT fine-tuning for location prediction.
Bdcc 06 00077 g007
Figure 8. Location inference results at the user’s tweet level using IndoBERTweet. Each bar on the x-axis represents the user in the test data, while the y-axis represents the percentage of the user’s tweet prediction results.
Bdcc 06 00077 g008
Figure 9. Confusion matrix obtained with the IndoBERT. The y-axis shows instances of the true class (i.e., the Twitter user’s home location), while the x-axis shows instances of the predicted class (i.e., the predicted home location). The values of the diagonal elements represent the ratio of correctly predicted classes. Therefore, confusion is expressed by off-diagonal misclassification because they were incorrectly classified as a different class.
Bdcc 06 00077 g009
Table 1. Location prediction accuracy using display name and user description.
FeaturesNaïve BayesSupport Vector MachineLogistic Regression
Display name0.380.390.41
User description0.320.310.39
Table 2. Location prediction results using user tweets by majority vote.
ModelsACCF1
Naïve Bayes0.420.40
Support vector machine0.480.49
LSTM0.460.50
IndoBERT0.480.51
IndoBERTweet0.560.58
Logistic regression0.580.58
Table 3. Location prediction results using user tweets by tweets aggregation into one text.
ModelsACCF1
LSTM0.150.03
IndoBERTweet0.370.30
Naïve Bayes0.420.41
Support vector machine0.510.50
Logistic regression0.590.59
IndoBERT0.750.76
Table 4. Location prediction results by combining display name, user description, and user tweets. Two scenarios were applied in creating the predictions: the predict and vote and the concatenate and predict.
FeaturesScenarioScenario on TweetACCF1
Tweet only-Majority vote0.580.58
Aggregation0.750.76
Display name, description, and tweetsPredict and voteMajority vote0.500.51
Aggregation0.580.58
Concatenate and predictMajority vote0.620.63
Aggregation0.770.78
Table 5. Cross-testing using fine-tuned IndoBERT on person-only data, nonperson-only, and all data.
Cross-Testing CombinationACCF1
Nonperson to nonperson0.840.84
Nonperson to person0.540.57
Nonperson to all0.600.62
Person to person0.560.56
Person to nonperson0.600.60
Person to all0.680.71
Table 6. The example of location prediction results of tweet with IndoBERTweet.
Tweet (Id)Tweet (En Translation)Actual LocationPredicted Location
Rahajeng Galungan Lan Kuningan SemetonHappy Galungan and Kuningan palsBali and Nusa TenggaraBali and Nusa Tenggara
Selamat datang di Nusa Tenggara Timur Mas Menteri @nadiemmakarimWelcome to East Nusa Tenggara Minister @nadiemmakarimBali and Nusa TenggaraBali and Nusa Tenggara
Semoga bisa cepat diselesaikan oleh pihak yang berwajib. Turut berduka cita untuk keluarga yang menjadi korban #PrayforJakartaHopefully this can be resolved quickly by the authorities. Condolences to the families of the victims #PrayforJakartaBali and Nusa TenggaraJabodetabek
Bosan ke Bali? Ke Lombok yuk!Tired of going to Bali? Let’s go to Lombok!JabodetabekBali and Nusa Tenggara
Selamat Merayakan hari Galungan dan Kuningan 1 November 2017Happy Galungan and Kuningan Day 1 November 2017Maluku and PapuaBali and Nusa Tenggara
Warga Bakunase II Gotong Royong Perbaiki JalanBakunase II Residents Work Together to Repair RoadsBali and Nusa TenggaraSulawesi
Sengketa Tanah di Pagar Panjang dan Danau Ina FinalLand Dispute in Pagar Panjang and Lake Ina has been resolvedBali and Nusa TenggaraMaluku and Papua
Deadline Validasi Data Kerusakan Rumah Akibat Seroja 26 AprilDeadline for Data Validation of House Damage Due to Seroja 26 AprilBali and Nusa TenggaraJabodetabek
Publisher’s Note: MDPI stays neutral with regard to jurisdictional claims in published maps and institutional affiliations.

