
Topological Data Analysis Helps to Improve Accuracy of Deep Learning Models for Fake News Detection Trained on Very Small Training Sets


Abstract
:1. Introduction
2. Related Work
3. Topological Data Analysis
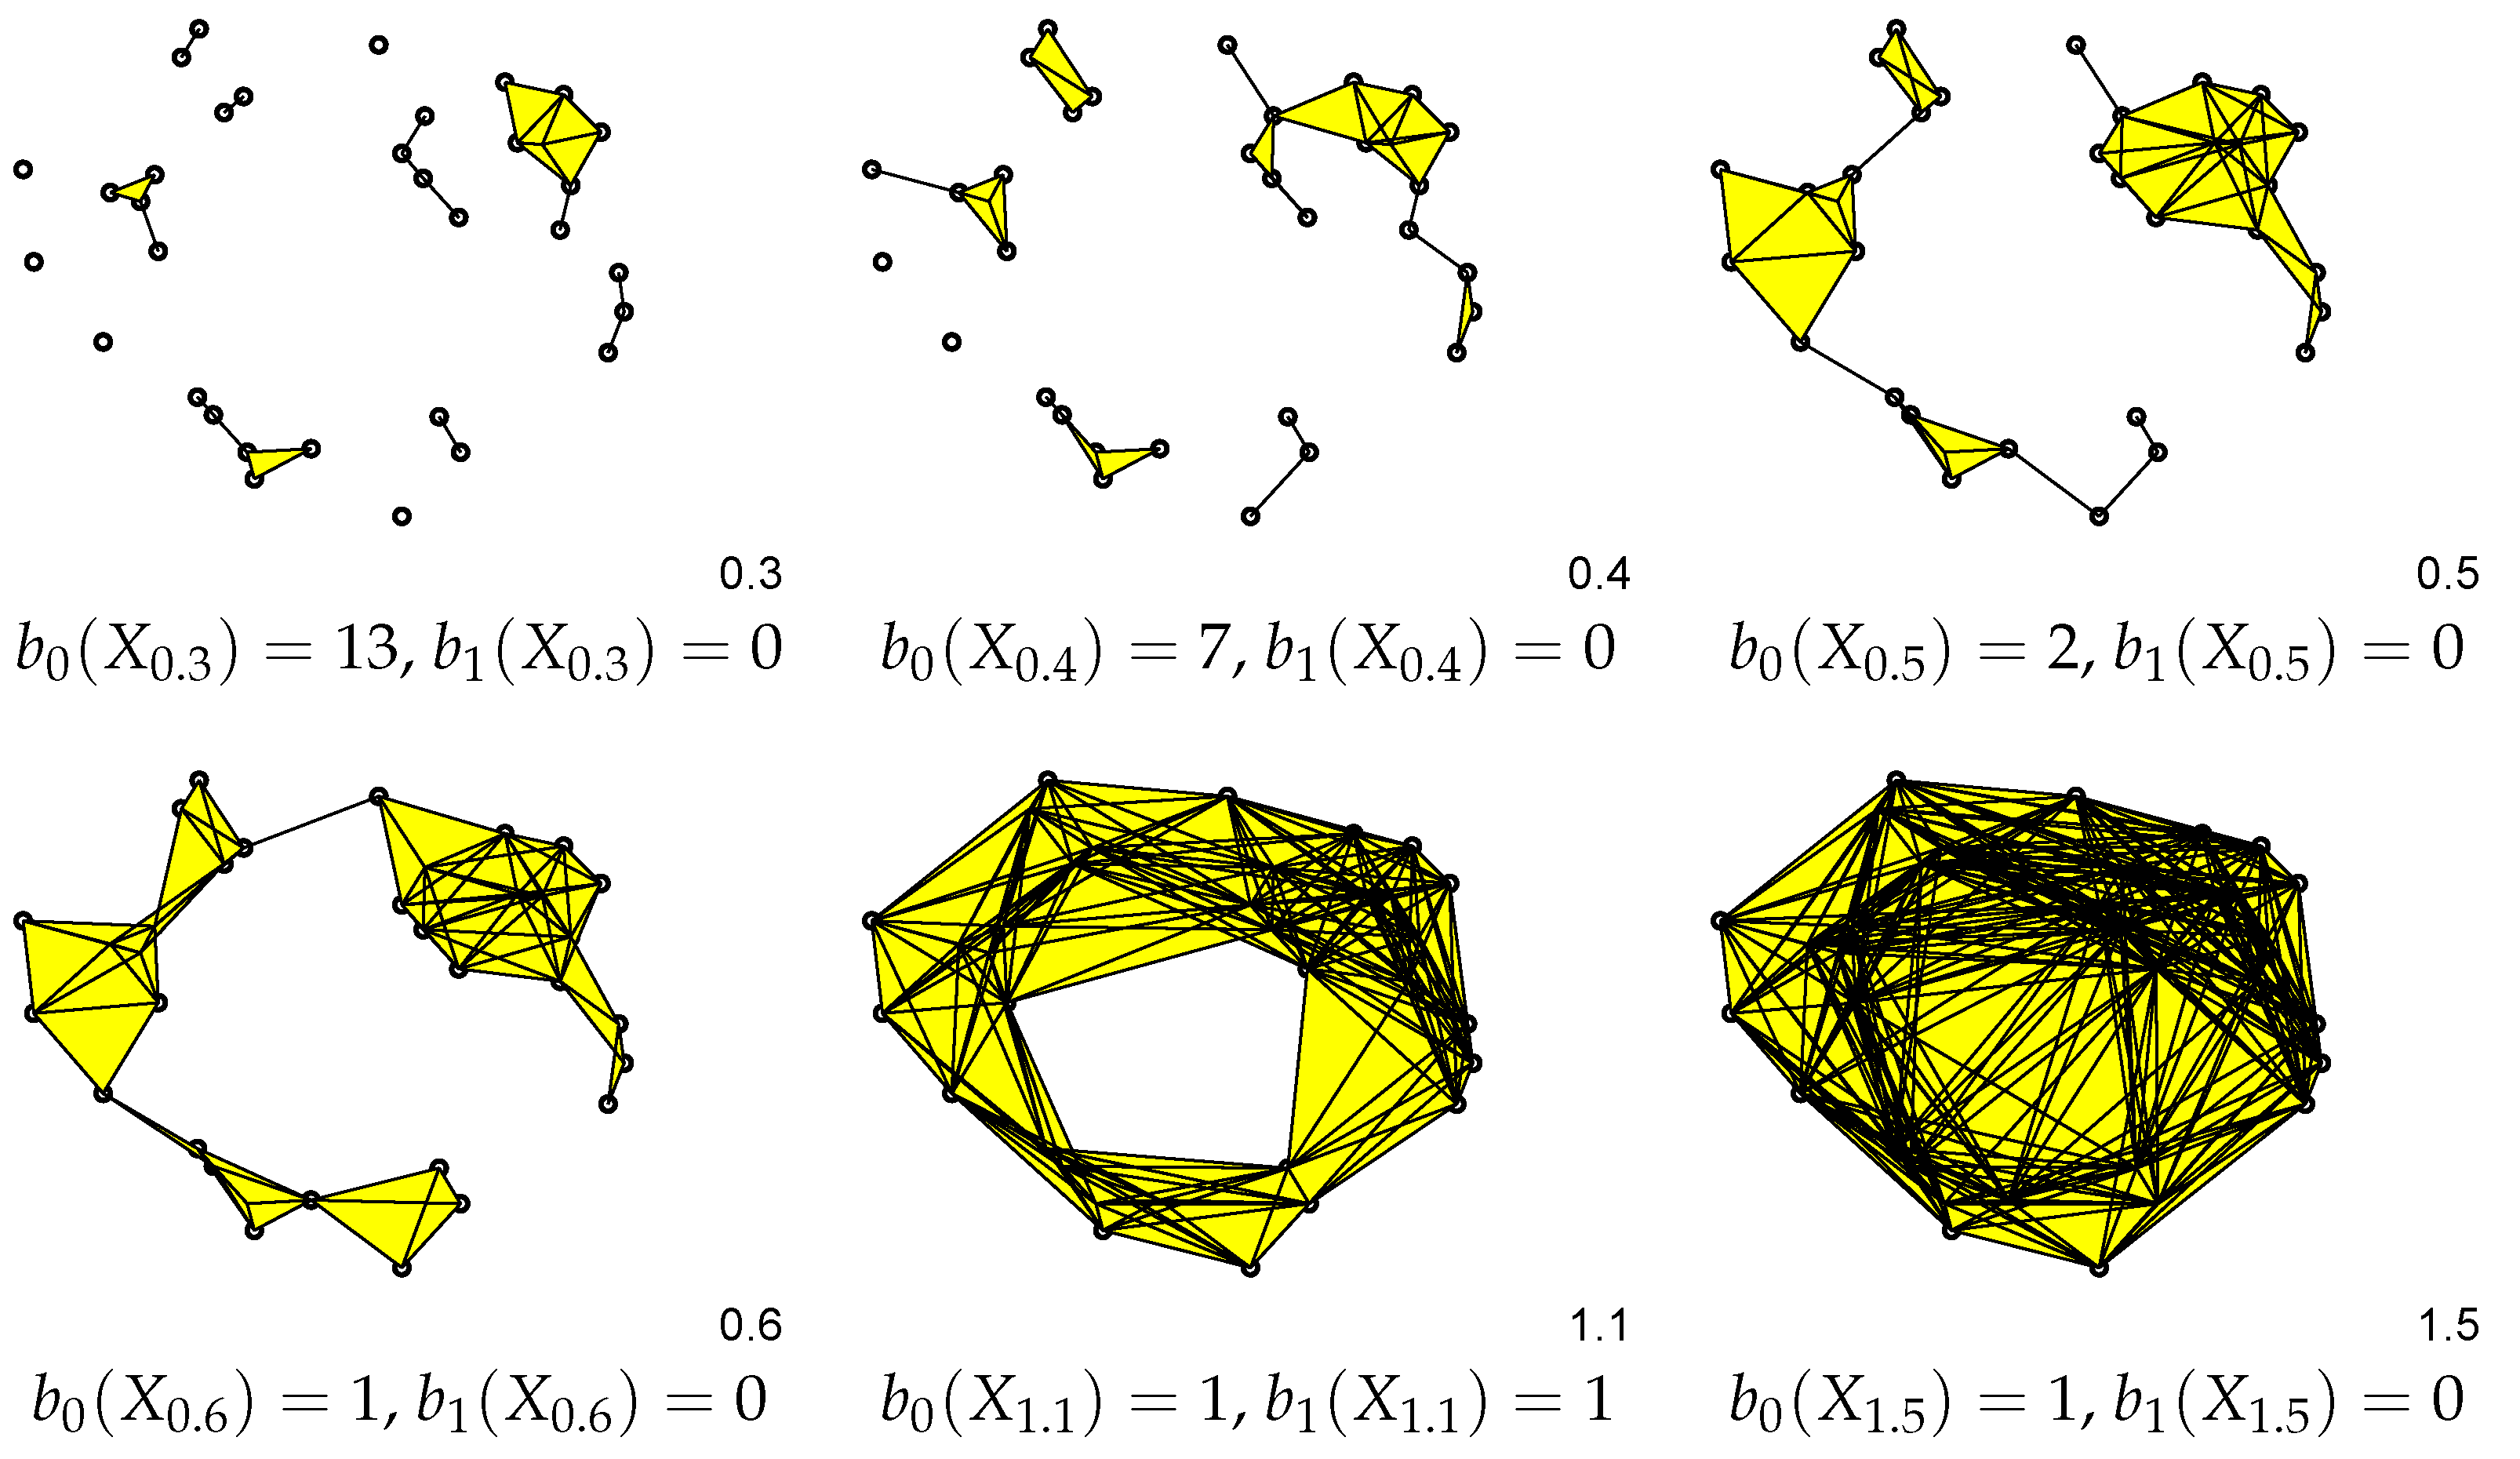
3.1. Betti Numbers
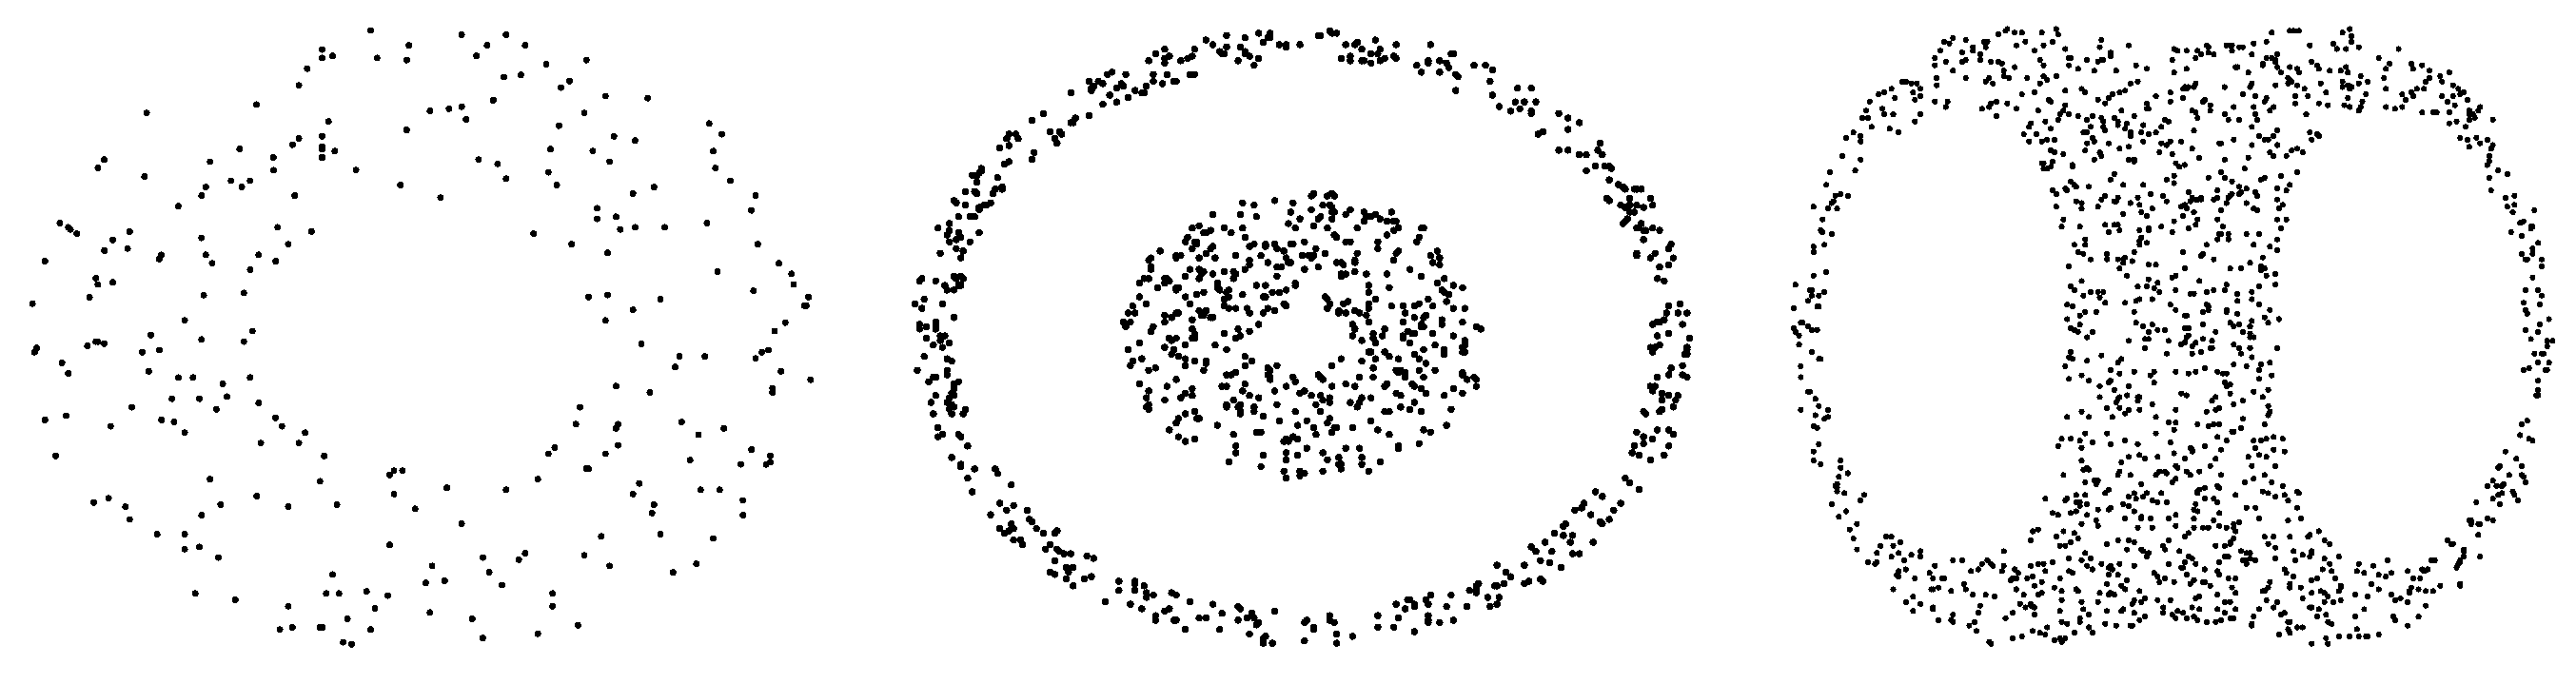
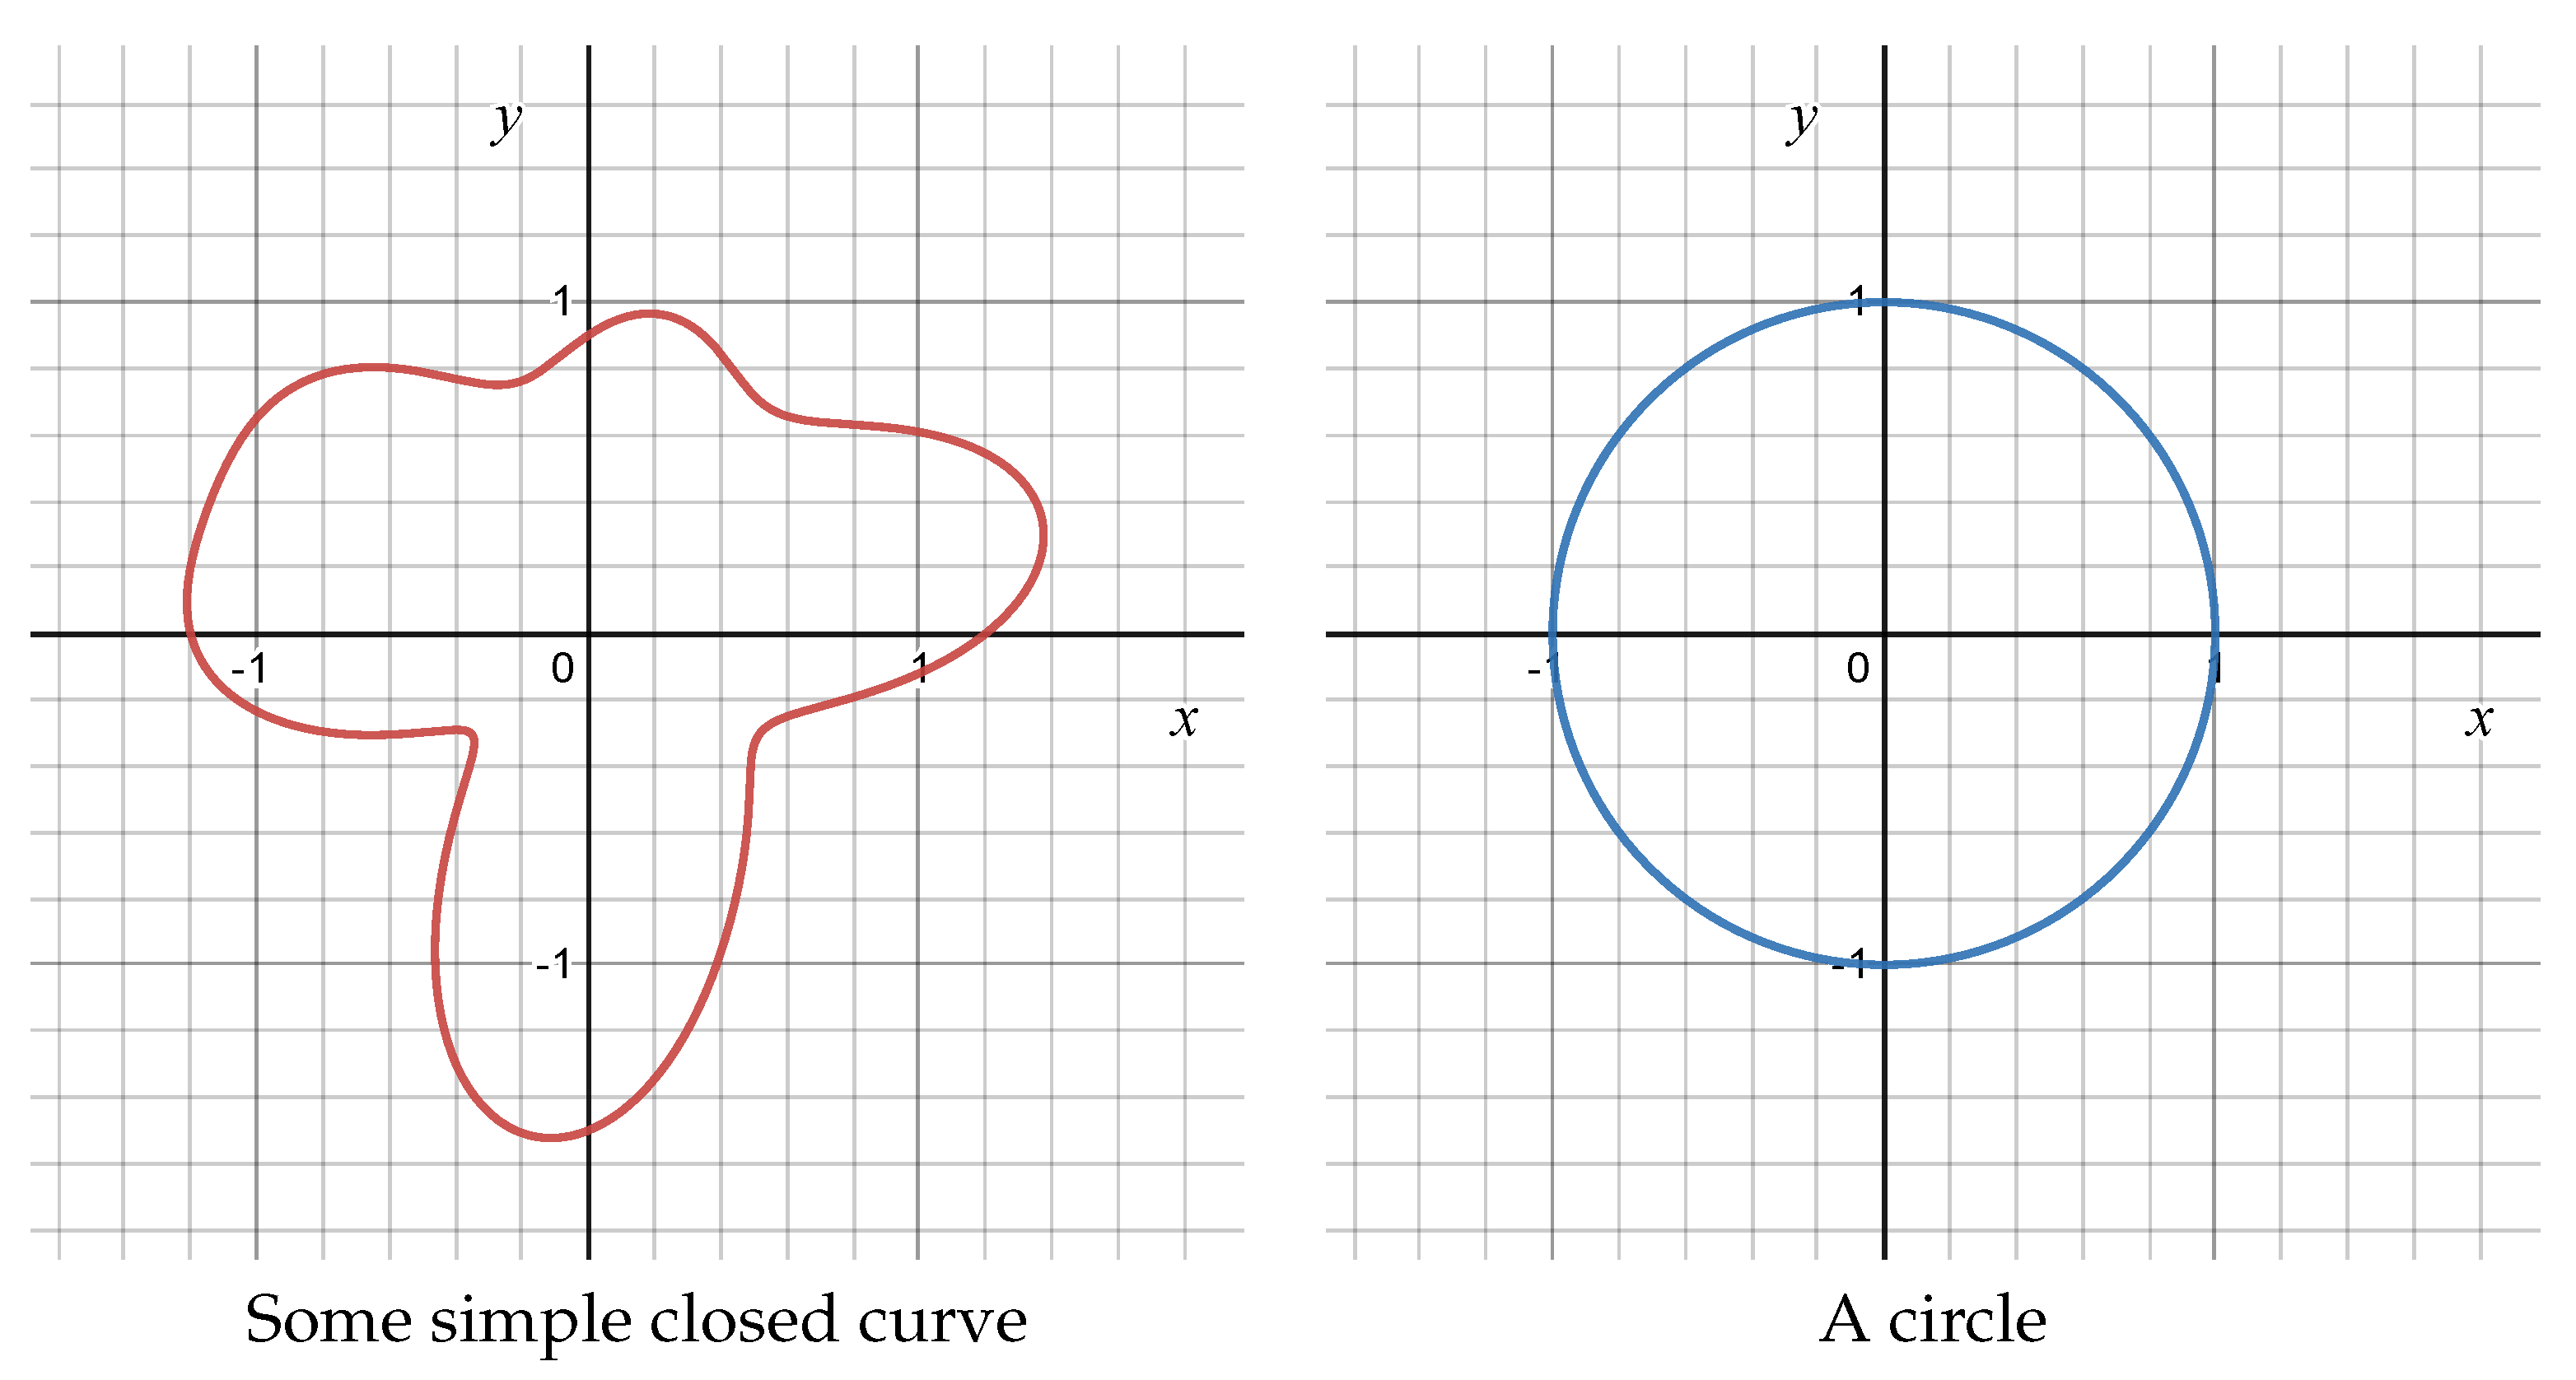
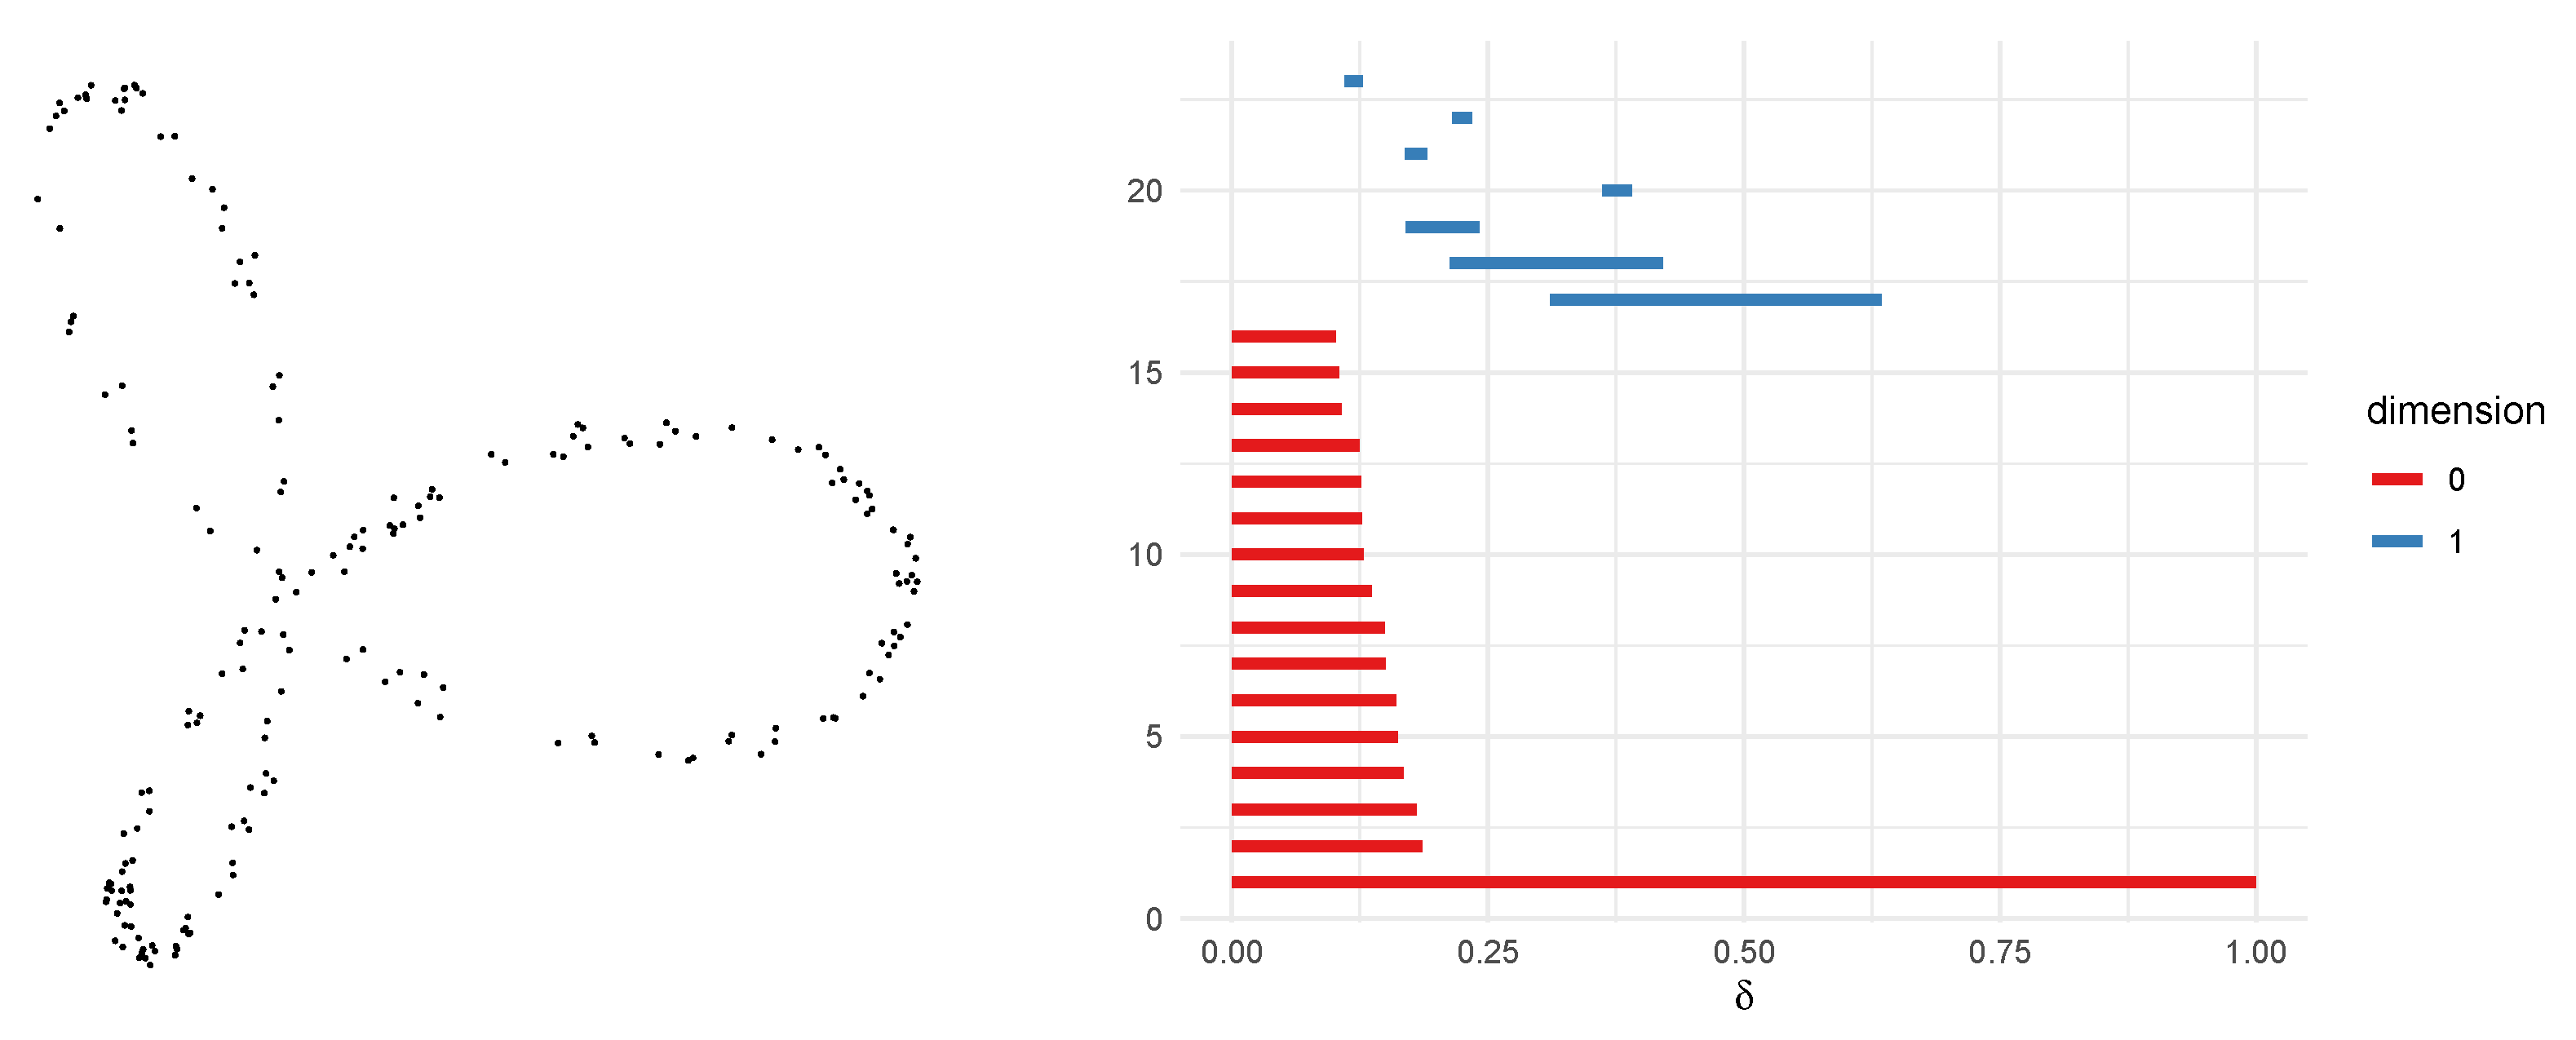
3.2. From a Dataset to a Topological Space
3.3. Persistent Homology
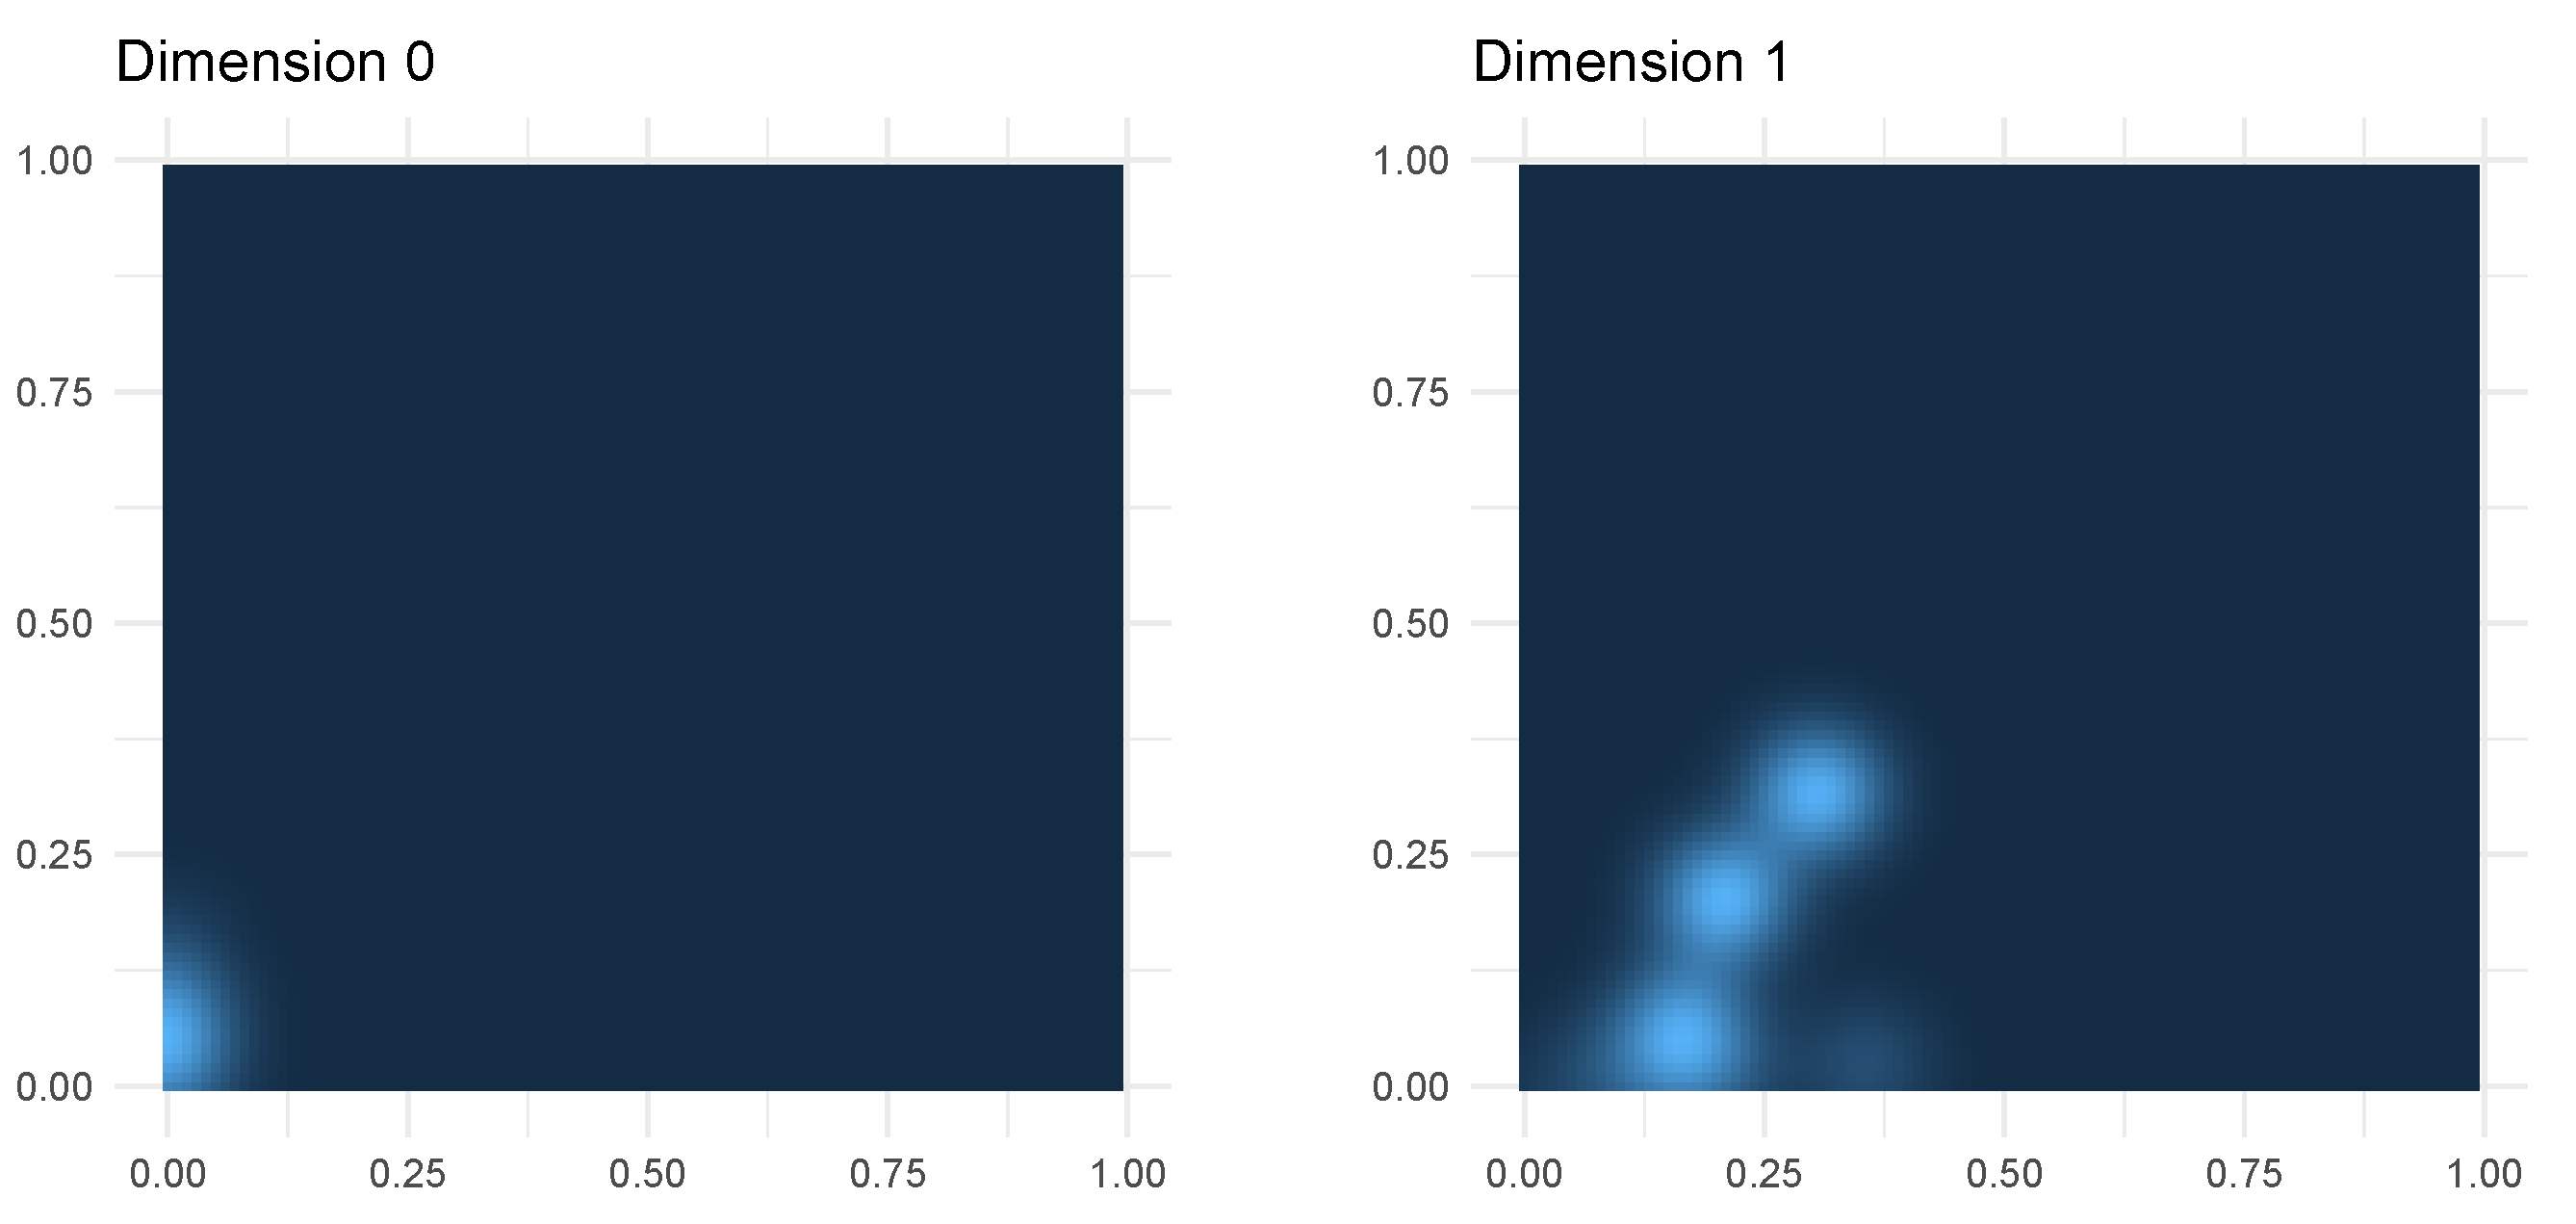
3.4. Persistent Image
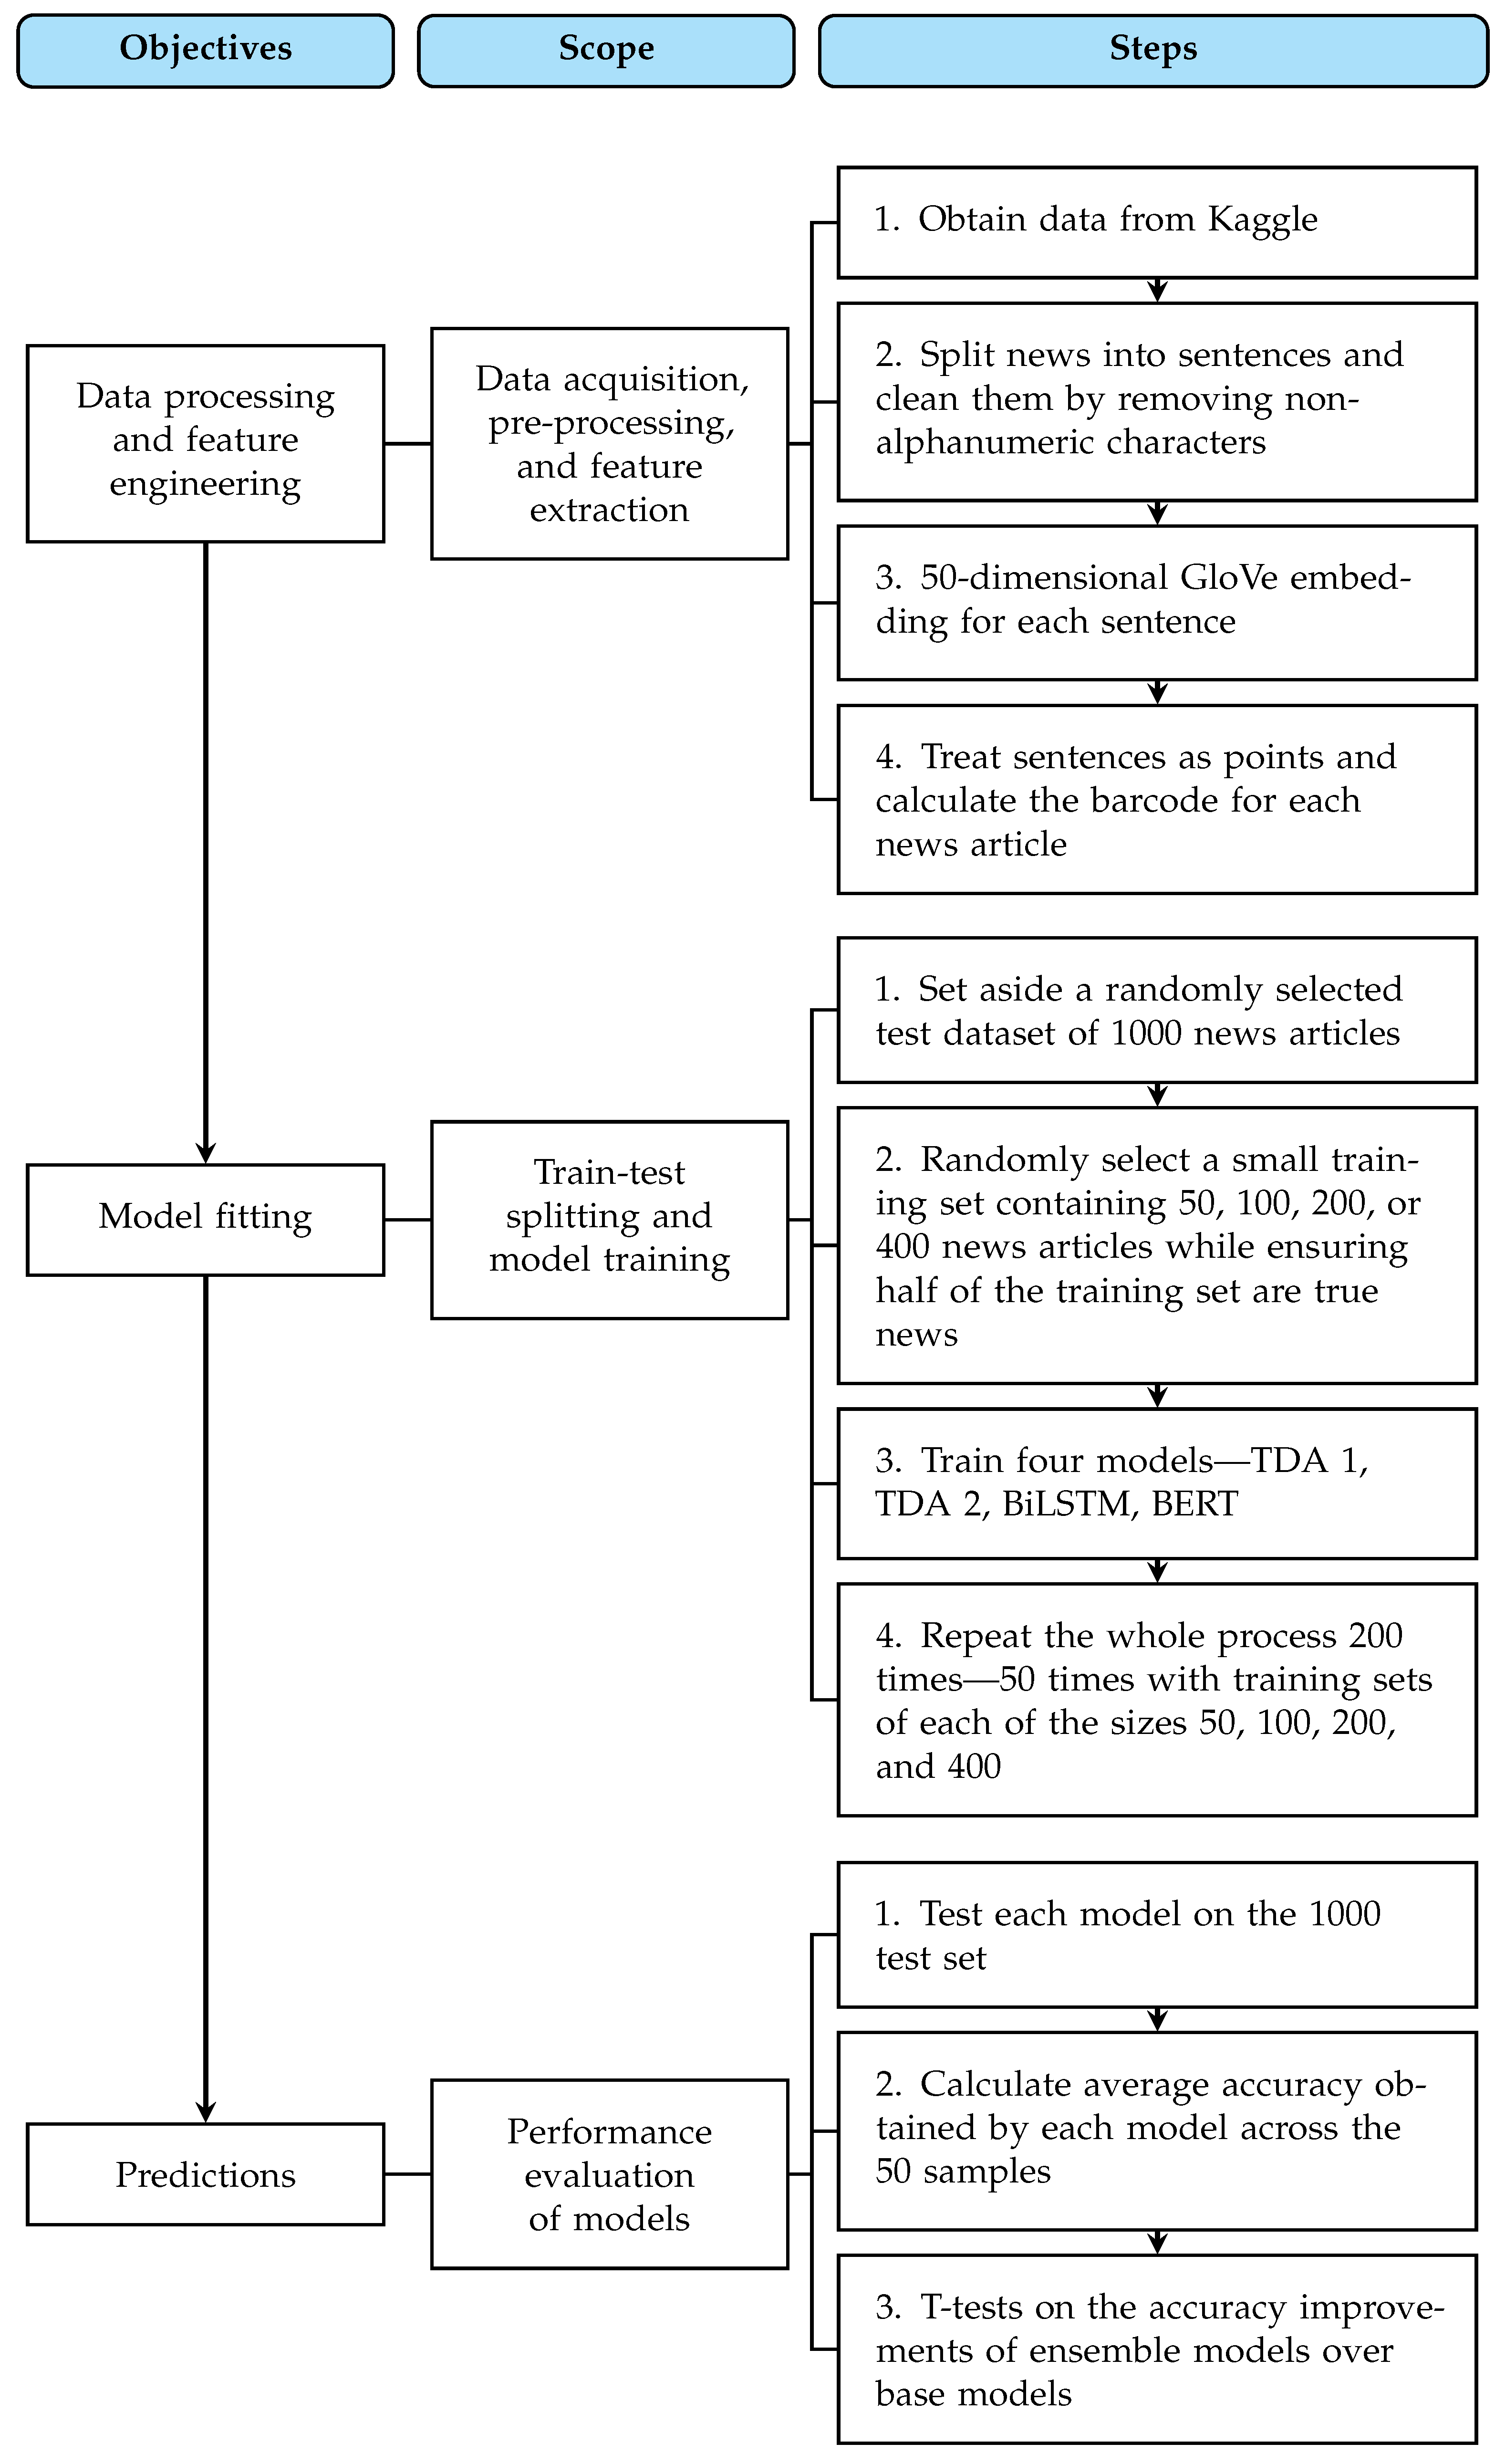
4. Data
A summer spat between President Donald Trump and Senate Majority Leader Mitch McConnell has turned into a warm embrace—and all it took was a sweeping rewrite of the U.S. tax code. For months, McConnell urged the president to lock his cell phone in a drawer and retire his signature tweets that have Washington abuzz on a daily basis. He even chided Trump for having “excessive expectations” of Congress. For his part, Trump scorched McConnell in August for failing to repeal Obamacare, sidestepped reporters’ questions over whether the senator should retire and tweeted, “Mitch, get to work.” But with Congress’ passage of the tax bill this week, giving Trump his first major legislative victory, the president tweeted on Wednesday, “I would like to congratulate @SenateMajLdr on having done a fantastic job.”
Pope Francis used his annual Christmas Day message to rebuke Donald Trump without even mentioning his name. The Pope delivered his message just days after members of the United Nations condemned Trump s move to recognize Jerusalem as the capital of Israel. The Pontiff prayed on Monday for the peaceful coexistence of two states within mutually agreed and internationally recognized borders.
5. Predictive Models
6. Results and Discussions
6.1. Main Experiment with Real and Fake News Written by Human Authors
6.2. An Experiment with AI-Generated Fake News
The world was shocked today as reports came in that the moon had exploded. Witnesses say that they saw a bright light in the sky, followed by a loud explosion. The moon is now nothing more than a debris field. Scientists are still trying to determine what exactly caused the moon to explode. Some believe that it was a natural phenomenon, while others believe that it was caused by a man-made weapon.
7. Conclusions
Author Contributions
Funding
Institutional Review Board Statement
Informed Consent Statement
Data Availability Statement
Conflicts of Interest
Abbreviations
| TDA | Topological data analysis |
| LASSO | Least absolute shrinkage and selection operator |
| BiLSTM | Bidirectional long short-term memory |
| BERT | Bidirectional encoder representations from transformers |
| GloVe | Global vectors for word representation |
References
- Wasserman, L. Topological Data Analysis. Annu. Rev. Stat. Appl. 2018, 5, 501–532. [Google Scholar] [CrossRef] [Green Version]
- Carlsson, G. Topology and Data. Bull. Am. Math. Soc. 2009, 46, 255–308. [Google Scholar] [CrossRef] [Green Version]
- Ghrist, R. Barcodes: The persistent topology of Data. Bull. Am. Math. Soc. 2007, 45, 61–76. [Google Scholar] [CrossRef] [Green Version]
- Asaad, A.; Jassim, S. Topological Data Analysis for Image Tampering Detection. In Digital Forensics and Watermarking; Kraetzer, C., Shi, Y.Q., Dittmann, J., Kim, H.J., Eds.; Springer International Publishing: Cham, Switzerland, 2017; pp. 136–146. [Google Scholar]
- Bernstein, A.; Burnaev, E.; Sharaev, M.; Kondrateva, E.; Kachan, O. Topological data analysis in computer vision. In Proceedings of the Twelfth International Conference on Machine Vision (ICMV 2019), Amsterdam, The Netherlands, 16–18 November 2019; Osten, W., Nikolaev, D.P., Eds.; International Society for Optics and Photonics, SPIE: Bellingham, WA, USA, 2020; Volume 11433, pp. 673–679. [Google Scholar] [CrossRef]
- Seversky, L.M.; Davis, S.; Berger, M. On Time-Series Topological Data Analysis: New Data and Opportunities. In Proceedings of the IEEE Conference on Computer Vision and Pattern Recognition (CVPR) Workshops, Las Vegas, NV, USA, 27–30 June 2016. [Google Scholar]
- Topaz, C.M.; Ziegelmeier, L.; Halverson, T. Topological Data Analysis of Biological Aggregation Models. PLoS ONE 2015, 10, 1–26. [Google Scholar] [CrossRef] [PubMed]
- Xia, K.; Wei, G.W. Persistent homology analysis of protein structure, flexibility, and folding. Int. J. Numer. Methods Biomed. Eng. 2014, 30, 814–844. [Google Scholar] [CrossRef] [PubMed]
- Sizemore, A.E.; Phillips-Cremins, J.E.; Ghrist, R.; Bassett, D.S. The importance of the whole: Topological Data Analysis for the network neuroscientist. Netw. Neurosci. 2019, 3, 656–673. [Google Scholar] [CrossRef]
- Rucco, M.; Falsetti, L.; Herman, D.; Petrossian, T.; Merelli, E.; Nitti, C.; Salvi, A. Using Topological Data Analysis for diagnosis pulmonary embolism. arXiv 2014, arXiv:1409.5020. [Google Scholar]
- Zhu, X. Persistent homology: An introduction and a new text representation for natural language processing. In Proceedings of the Twenty-Third International Joint Conference on Artificial Intelligence, Beijing, China, 3–9 August 2013. [Google Scholar]
- Doshi, P.; Zadrozny, W. Movie Genre Detection Using Topological Data Analysis. In Statistical Language and Speech Processing; Dutoit, T., Martín-Vide, C., Pironkov, G., Eds.; Springer International Publishing: Cham, Switzerland, 2018; pp. 117–128. [Google Scholar]
- Hoang, Q. Predicting Movie Genres Based on Plot Summaries. arXiv 2018, arXiv:1801.04813. [Google Scholar]
- Chung, J.; Gulcehre, C.; Cho, K.; Bengio, Y. Empirical evaluation of gated recurrent neural networks on sequence modeling. arXiv 2014, arXiv:1412.3555. [Google Scholar]
- Gholizadeh, S.; Seyeditabari, A.; Zadrozny, W. A Novel Method of Extracting Topological Features from Word Embeddings. arXiv 2020, arXiv:2003.13074v2. [Google Scholar]
- Chen, T.; Guestrin, C. Xgboost: A scalable tree boosting system. In Proceedings of the 22nd Acm Sigkdd International Conference on Knowledge Discovery and Data Mining, San Francisco, CA, USA, 13–17 August 2016; pp. 785–794. [Google Scholar]
- Lai, S.; Xu, L.; Liu, K.; Zhao, J. Recurrent convolutional neural networks for text classification. In Proceedings of the Twenty-Ninth AAAI Conference on Artificial Intelligence, Austin, TX, USA, 25–30 January 2015. [Google Scholar]
- Joulin, A.; Grave, E.; Bojanowski, P.; Mikolov, T. Bag of tricks for efficient text classification. arXiv 2016, arXiv:1607.01759. [Google Scholar]
- Pennington, J.; Socher, R.; Manning, C.D. Glove: Global vectors for word representation. In Proceedings of the 2014 Conference on Empirical Methods in Natural Language Processing (EMNLP), Doha, Qatar, 25–29 October 2014; pp. 1532–1543. [Google Scholar]
- Speer, R.; Chin, J.; Havasi, C. Conceptnet 5.5: An open multilingual graph of general knowledge. In Proceedings of the Thirty-First AAAI Conference on Artificial Intelligence, San Francisco, CA, USA, 4–9 February 2017. [Google Scholar]
- Gholizadeh, S.; Savle, K.; Seyeditabari, A.; Zadrozny, W. Topological Data Analysis in Text Classification: Extracting Features with Additive Information. arXiv 2020, arXiv:2003.13138. [Google Scholar]
- Hochreiter, S.; Schmidhuber, J. Long short-term memory. Neural Comput. 1997, 9, 1735–1780. [Google Scholar] [CrossRef]
- Gholizadeh, S.; Seyeditabari, A.; Zadrozny, W. Topological signature of 19th century novelists: Persistent homology in text mining. Big Data Cogn. Comput. 2018, 2, 33. [Google Scholar] [CrossRef] [Green Version]
- Elyasi, N.; Moghadam, M.H. An Introduction to a New Text Classification and Visualization for Natural Language Processing Using Topological Data Analysis. arXiv 2019, arXiv:1906.01726. [Google Scholar]
- Singh, G.; Mémoli, F.; Carlsson, G.E. Topological methods for the analysis of high dimensional data sets and 3d object recognition. In Proceedings of the Eurographics Symposium on Point-Based Graphics, Prague, Czech Republic, 2–3 September 2007; Volume 2. [Google Scholar]
- Devlin, J.; Chang, M.W.; Lee, K.; Toutanova, K. BERT: Pre-training of deep bidirectional transformers for language understanding. arXiv 2018, arXiv:1810.04805. [Google Scholar]
- Adams, H.; Emerson, T.; Kirby, M.; Neville, R.; Peterson, C.; Shipman, P.; Chepushtanova, S.; Hanson, E.; Motta, F.; Ziegelmeier, L. Persistence images: A stable vector representation of persistent homology. J. Mach. Learn. Res. 2017, 18, 1–35. [Google Scholar]
- Ahmed, H.; Traore, I.; Saad, S. Detecting opinion spams and fake news using text classification. Secur. Priv. 2017, 1, e9. [Google Scholar] [CrossRef] [Green Version]
- Ahmed, H.; Traoré, I.; Saad, S. Detection of Online Fake News Using N-Gram Analysis and Machine Learning Techniques. In Proceedings of the International Conference on Intelligent, Secure, and Dependable Systems in Distributed and Cloud Environments, Vancouver, BC, Canada, 25–27 October 2017. [Google Scholar]
- Hornik, K. openNLP: Apache OpenNLP Tools Interface, R Package Version 0.2-6. 2017. Available online: https://CRAN.R-project.org/package=openNLP (accessed on 15 April 2022).
- Wadhwa, R.R.; Williamson, D.F.; Dhawan, A.; Scott, J.G. TDAstats: R pipeline for computing persistent homology in topological data analysis. J. Open Source Softw. 2018, 3, 860. [Google Scholar]
- Brown, T.; Mann, B.; Ryder, N.; Subbiah, M.; Kaplan, J.D.; Dhariwal, P.; Neelakantan, A.; Shyam, P.; Sastry, G.; Askell, A.; et al. Language models are few-shot learners. Adv. Neural Inf. Process. Syst. 2020, 33, 1877–1901. [Google Scholar]


| Topological Space X | Description | ||
|---|---|---|---|
 | Five points | 5 | 0 |
 | Square and two points | 3 | 1 |
 | Three closed curves | 1 | 3 |
 | Two circles, square and a disk. The two circles and the square form four closed loops. | 2 | 4 |
| Model | Specification |
|---|---|
| TDA | We used persistent images as features to train the LASSO model with five-fold cross-validation to select the optimal value of the regularization constant. The hyperparameter values to generate persistent images are , , as recommended by [27]. |
| BiLSTM | We used pre-trained 50-dimensional GloVe as the embedding layer, with a maximum sequence length of 100. The BiLSTM layer has 64 units and hyperbolic tangent activation. Then we have a dropout layer with the dropout rate of 0.2 and sigmoid output. We trained the model with a learning rate of 0.002 for 10 epochs with batch size 64. |
| BERT | We used the pre-trained base BERT with 12 encoders, 768-dimensional embeddings, and 12 bidirectional self-attention heads. We then trained the output layer with a sigmoid classifier with a learning rate of as recommended by [26] for 2 epochs with batch size 4. |
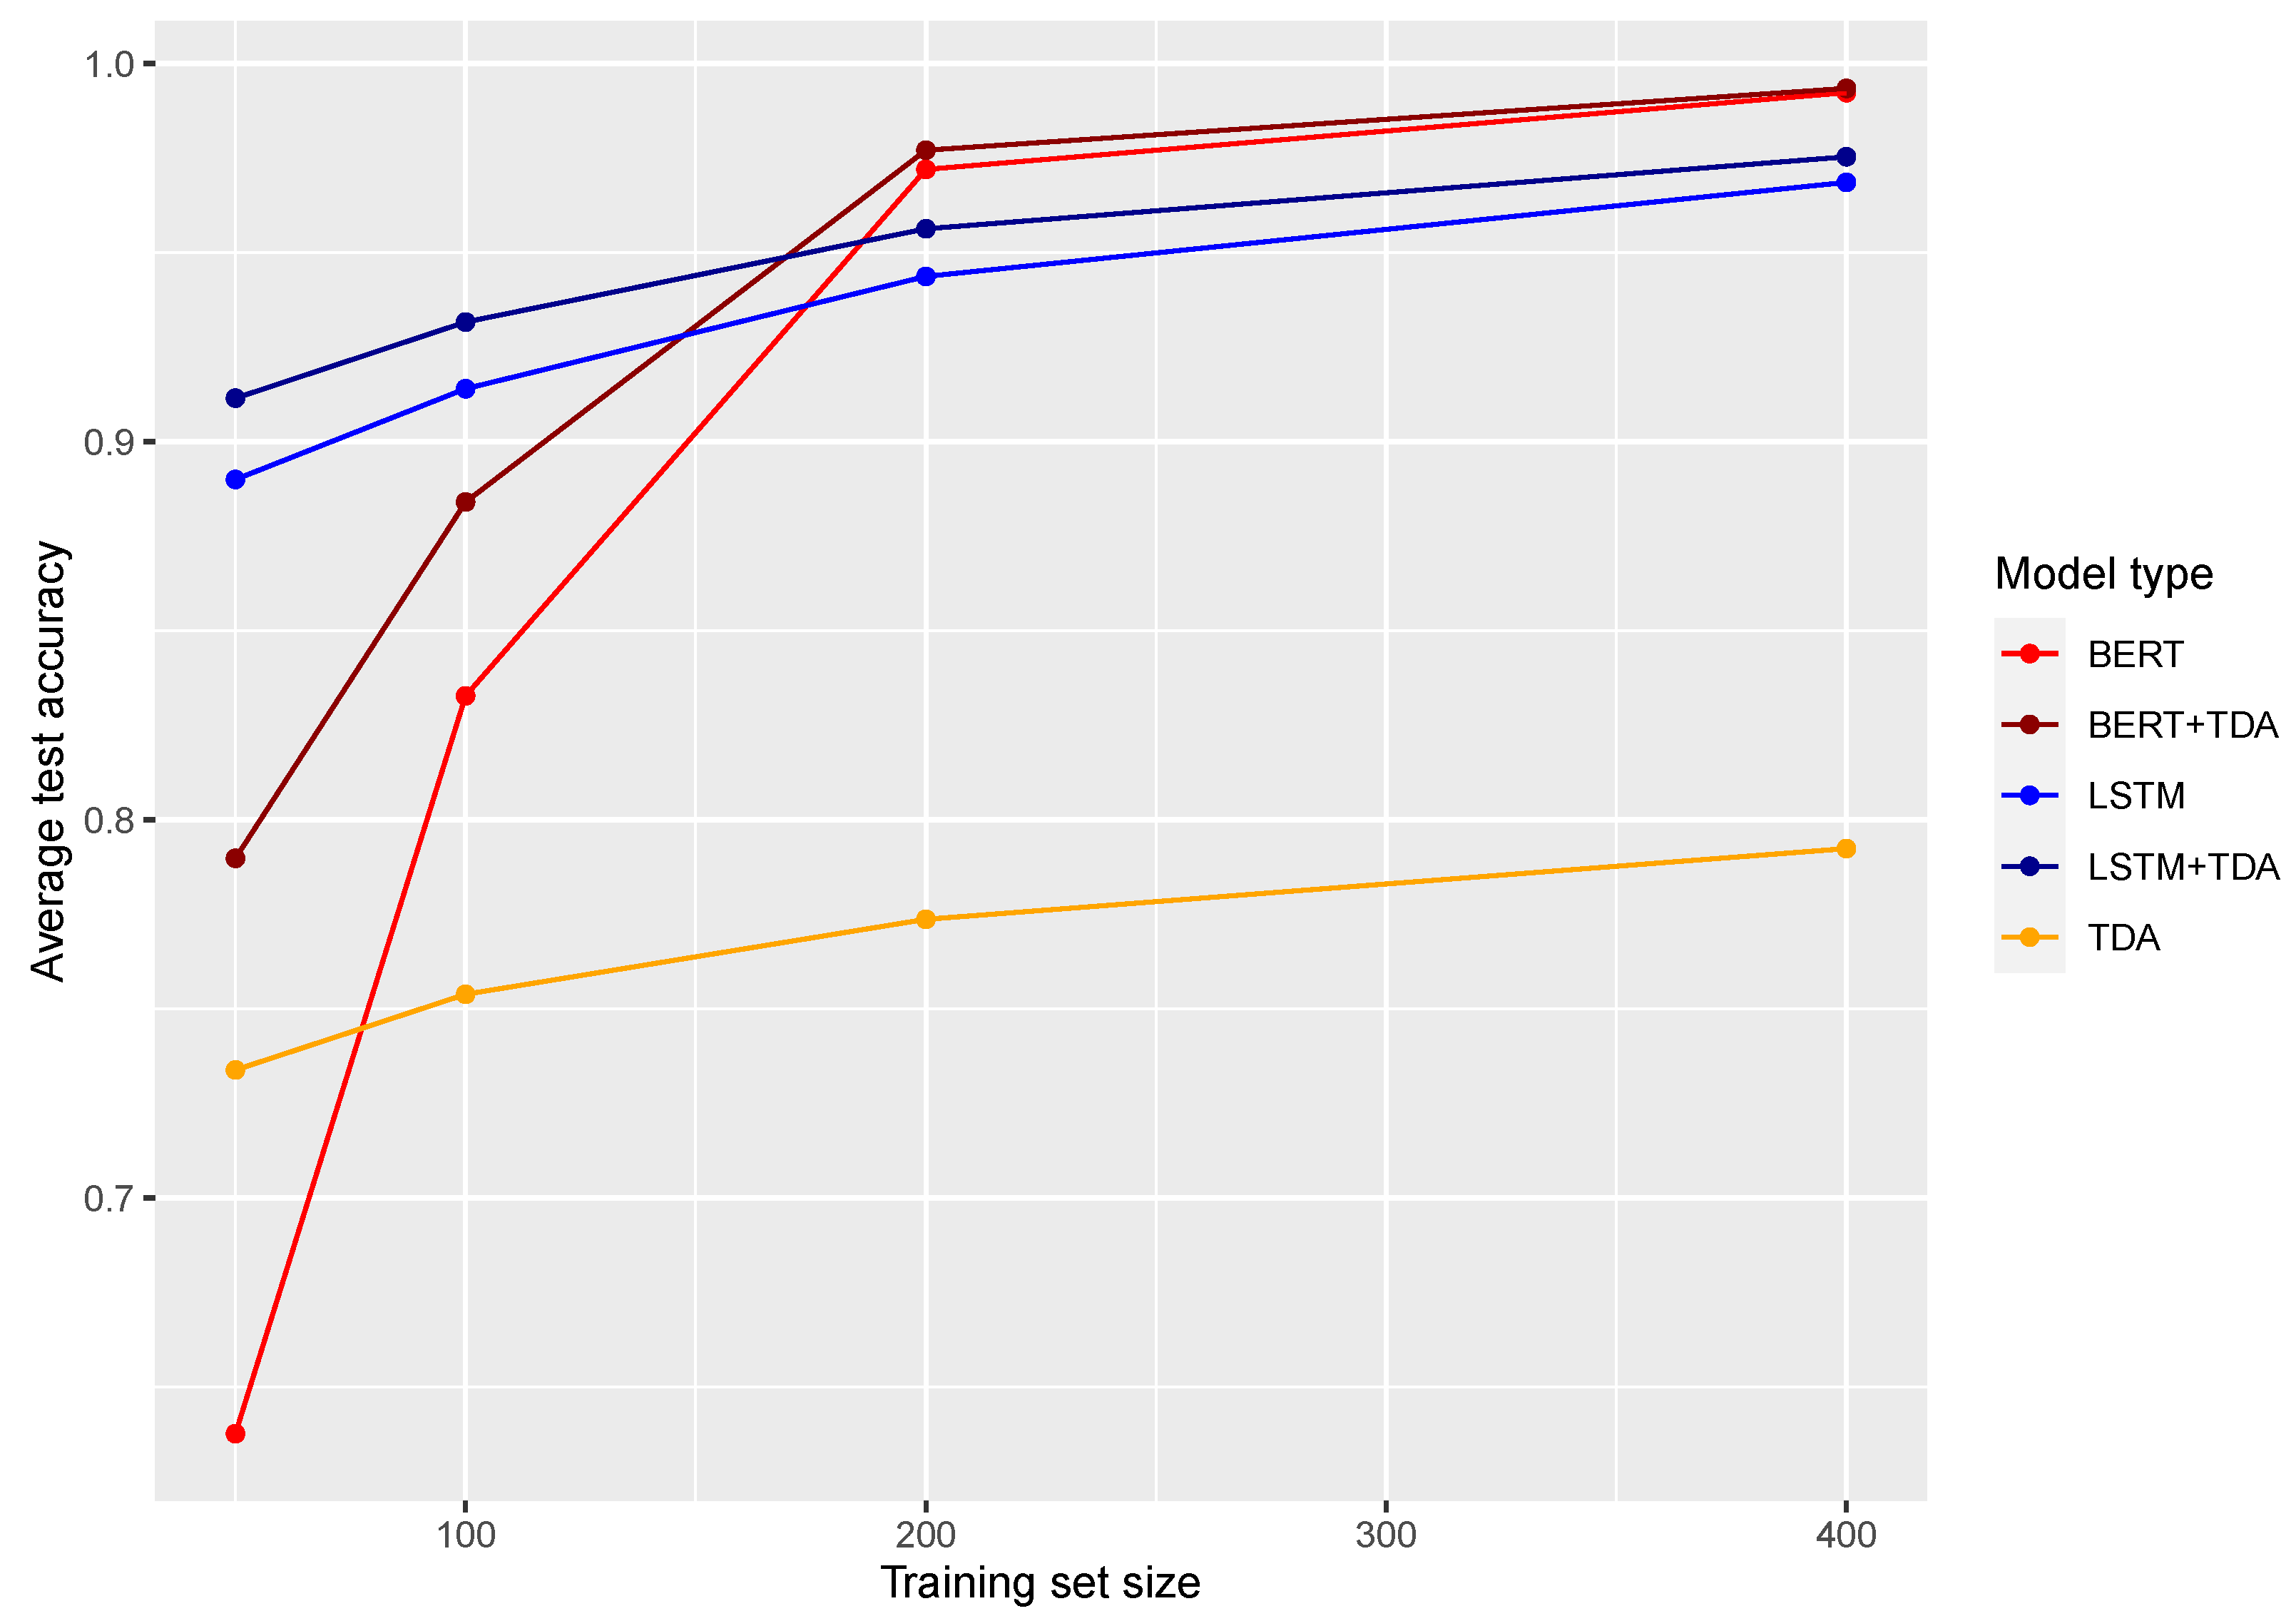
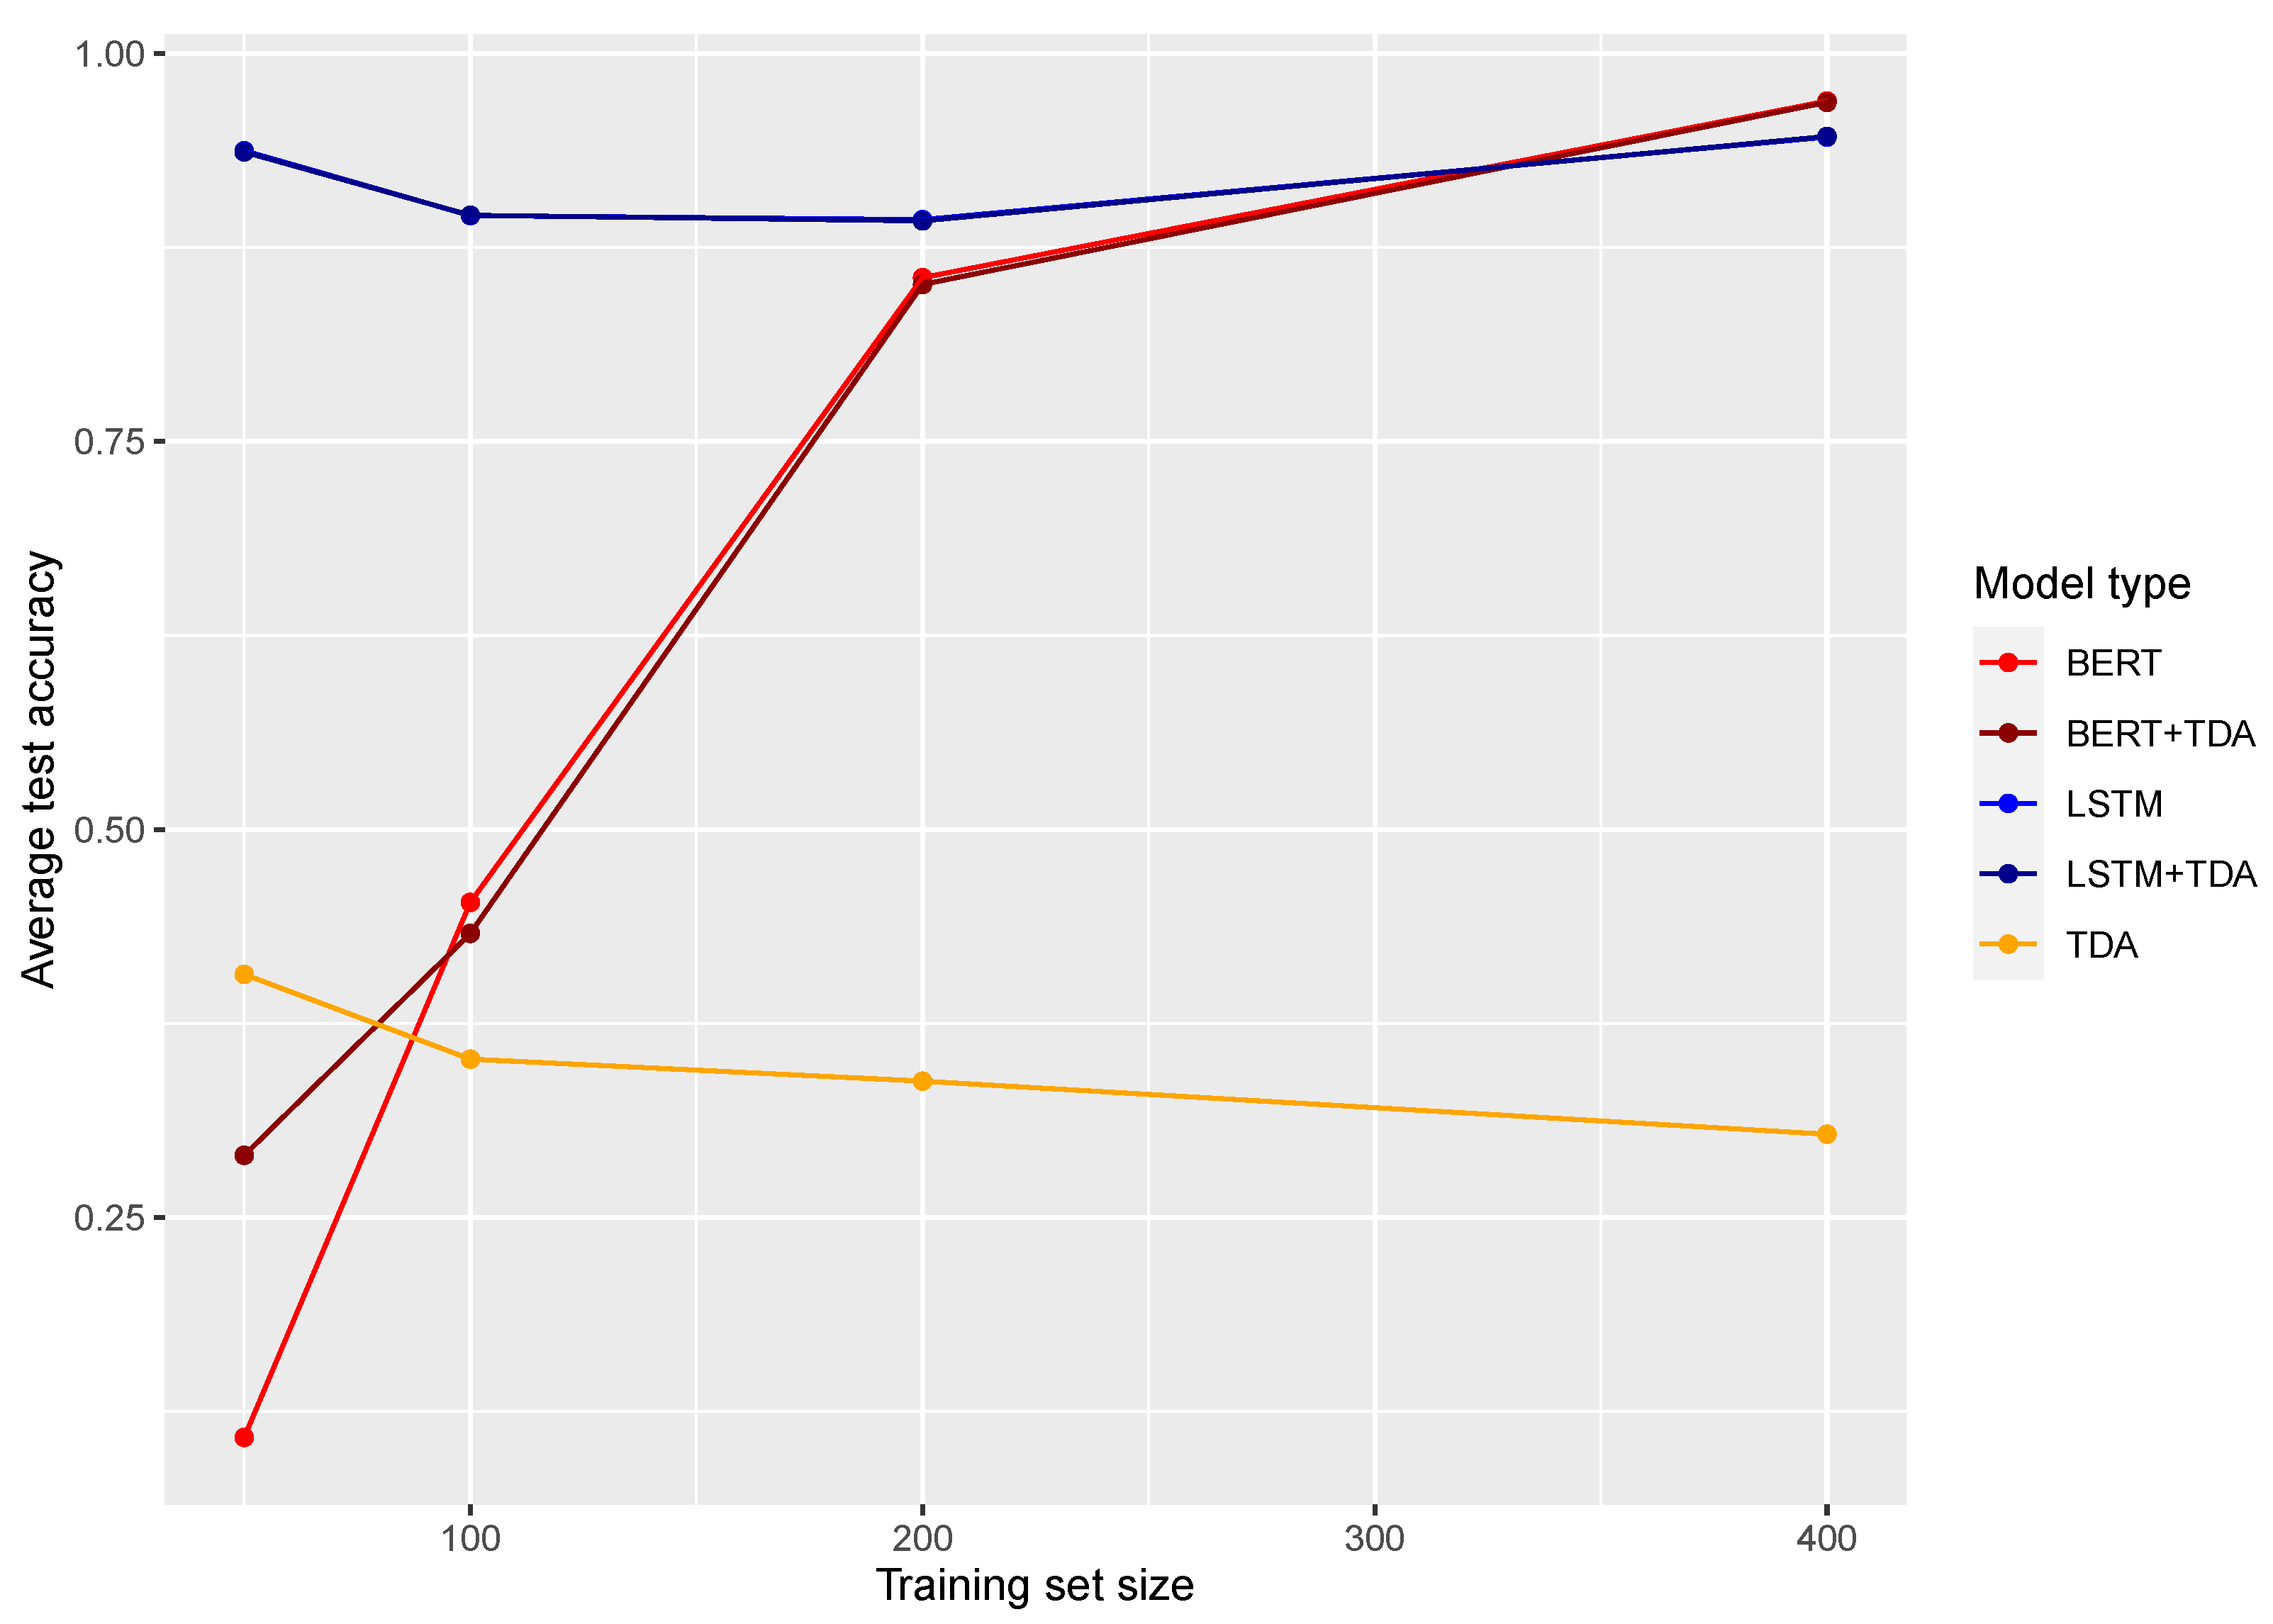
| Model/Training Set Size | 50 | 100 | 200 | 400 |
|---|---|---|---|---|
| TDA 1 | 0.728 (0.037) | 0.754 (0.034) | 0.763 (0.029) | 0.774 (0.023) |
| TDA 2 | 0.734 (0.034) | 0.749 (0.030) | 0.774 (0.029) | 0.792 (0.024) |
| BiLSTM | 0.890 (0.041) | 0.914 (0.024) | 0.944 (0.013) | 0.969 (0.009) |
| BERT | 0.638 (0.104) | 0.833 (0.138) | 0.972 (0.038) | 0.992 (0.016) |
| BiLSTM + TDA 1 | 0.912 (0.034) | 0.932 (0.018) | 0.956 (0.010) | 0.975 (0.006) |
| BERT + TDA 1 | 0.790 (0.053) | 0.877 (0.090) | 0.977 (0.034) | 0.993 (0.014) |
| BiLSTM + TDA 2 | 0.908 (0.033) | 0.927 (0.021) | 0.954 (0.012) | 0.974 (0.008) |
| BERT + TDA 2 | 0.785 (0.047) | 0.884 (0.076) | 0.976 (0.035) | 0.993 (0.014) |
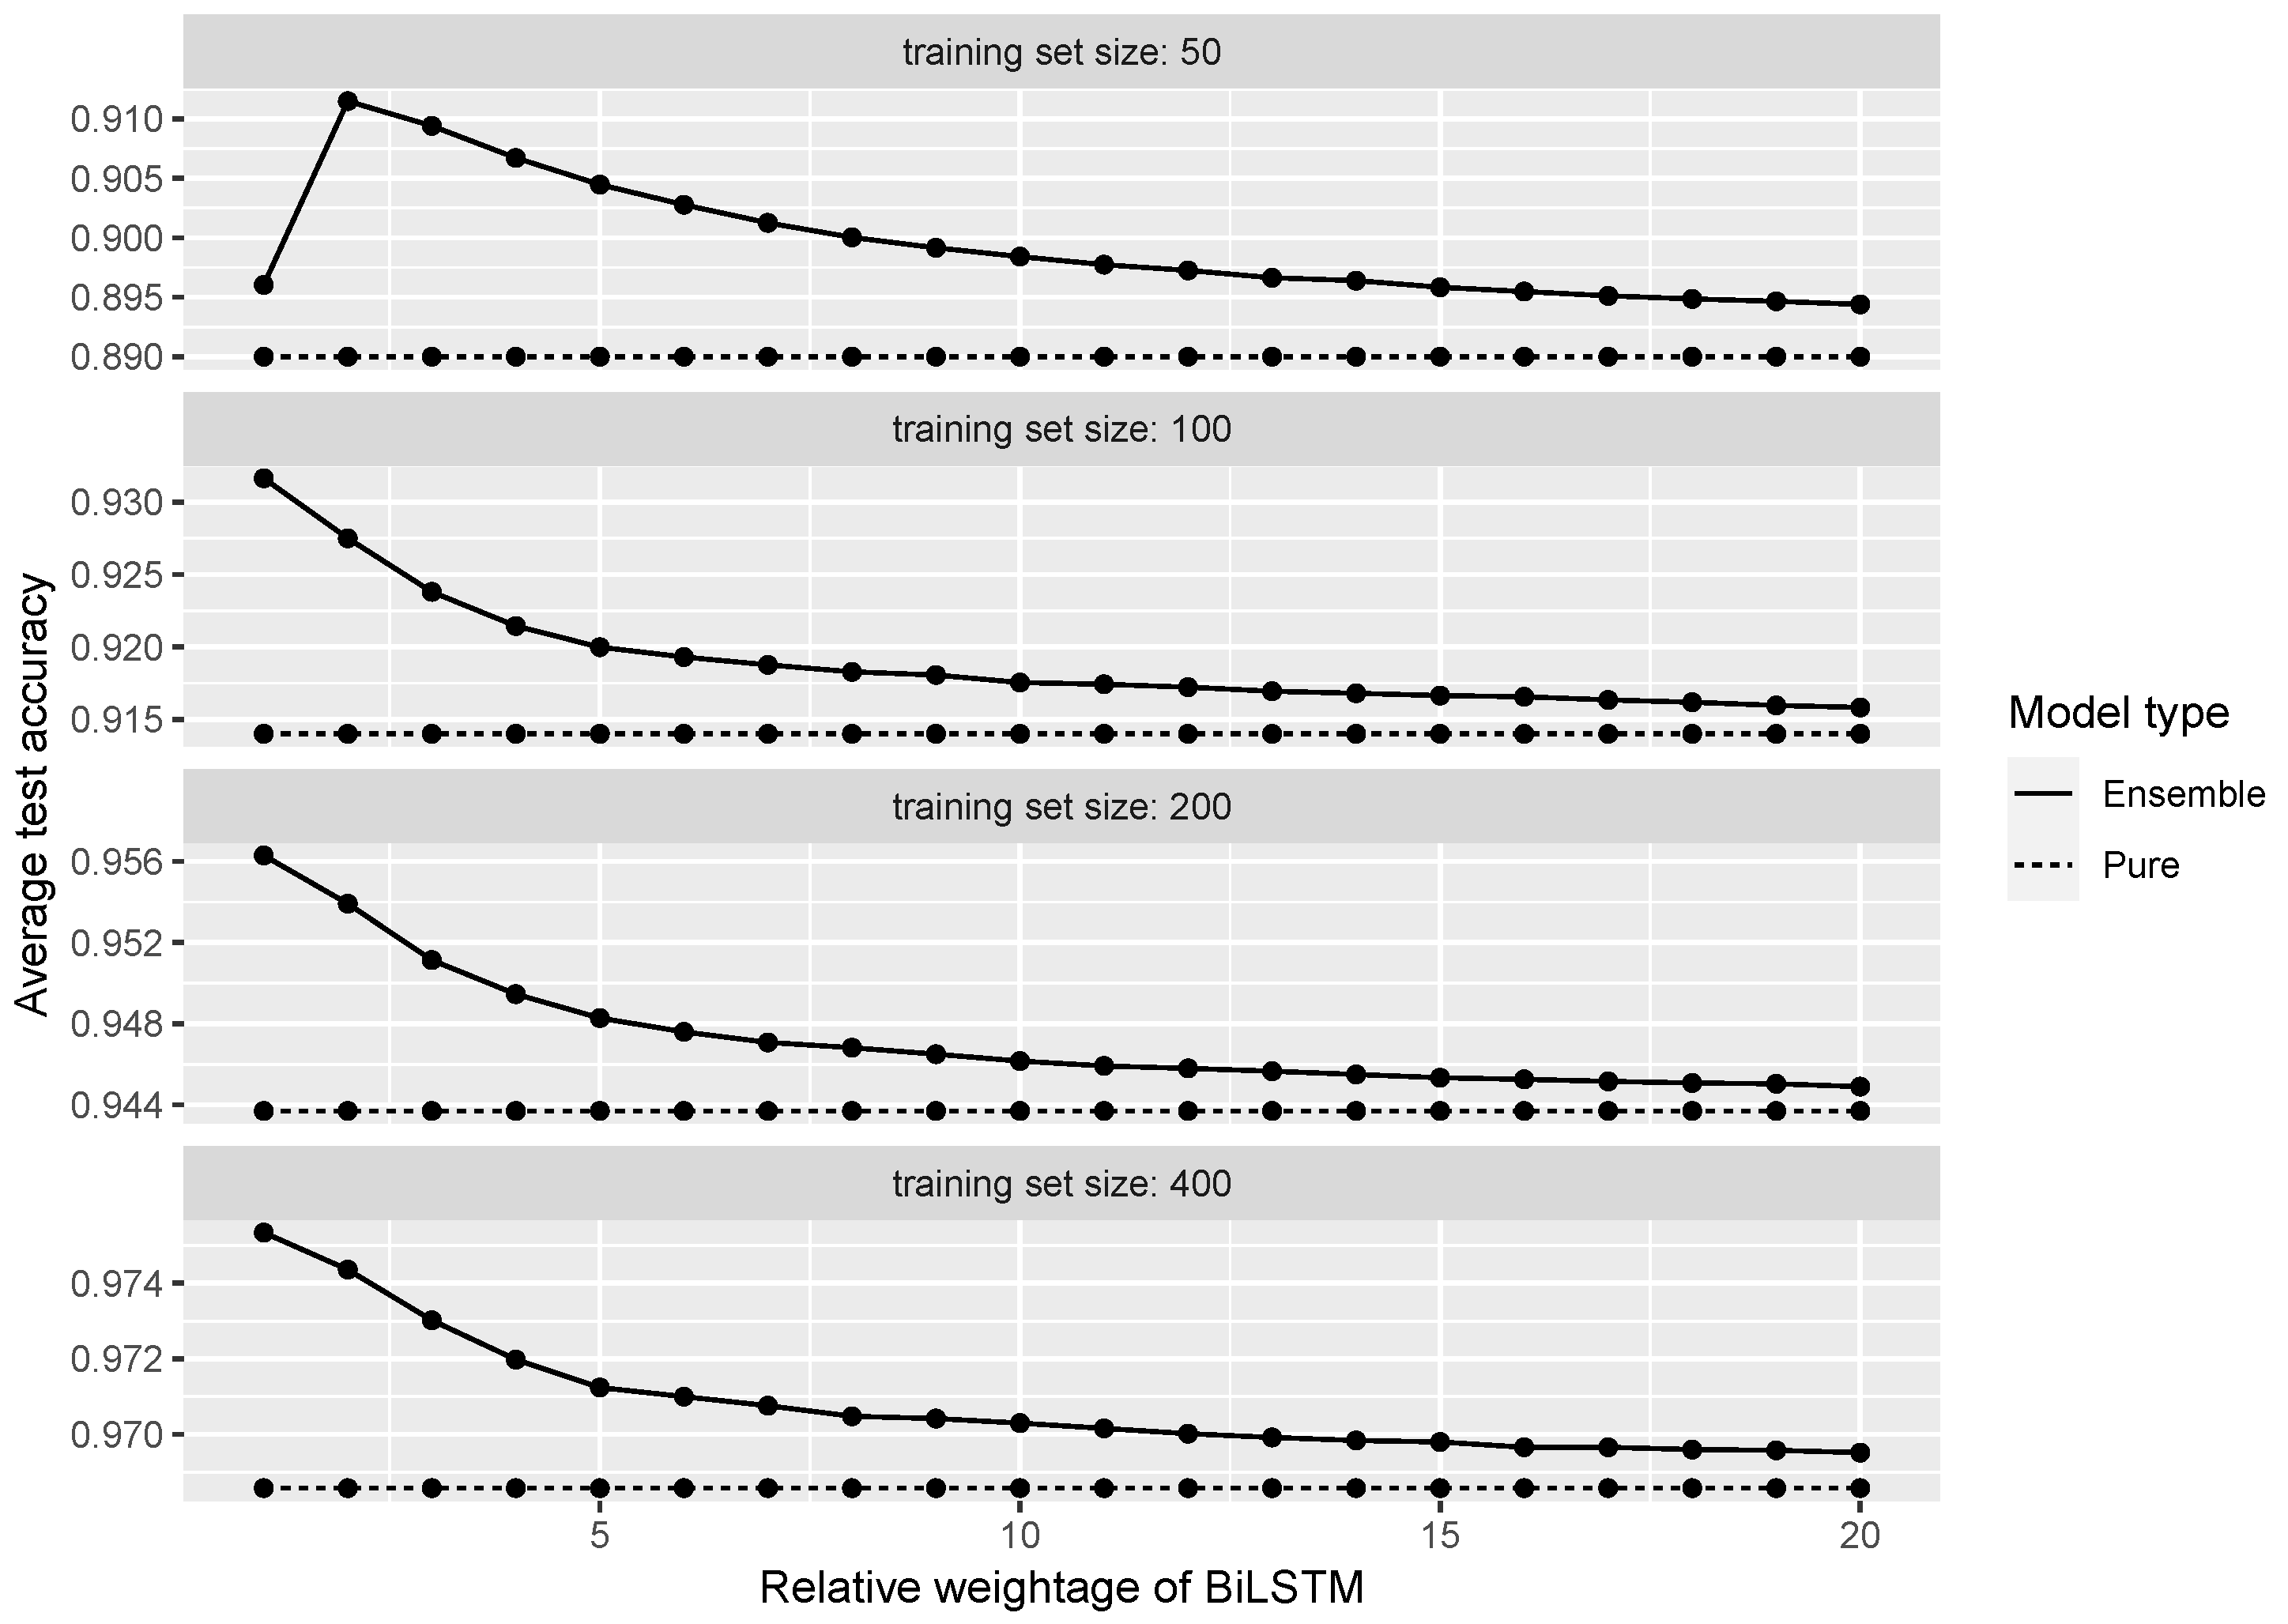
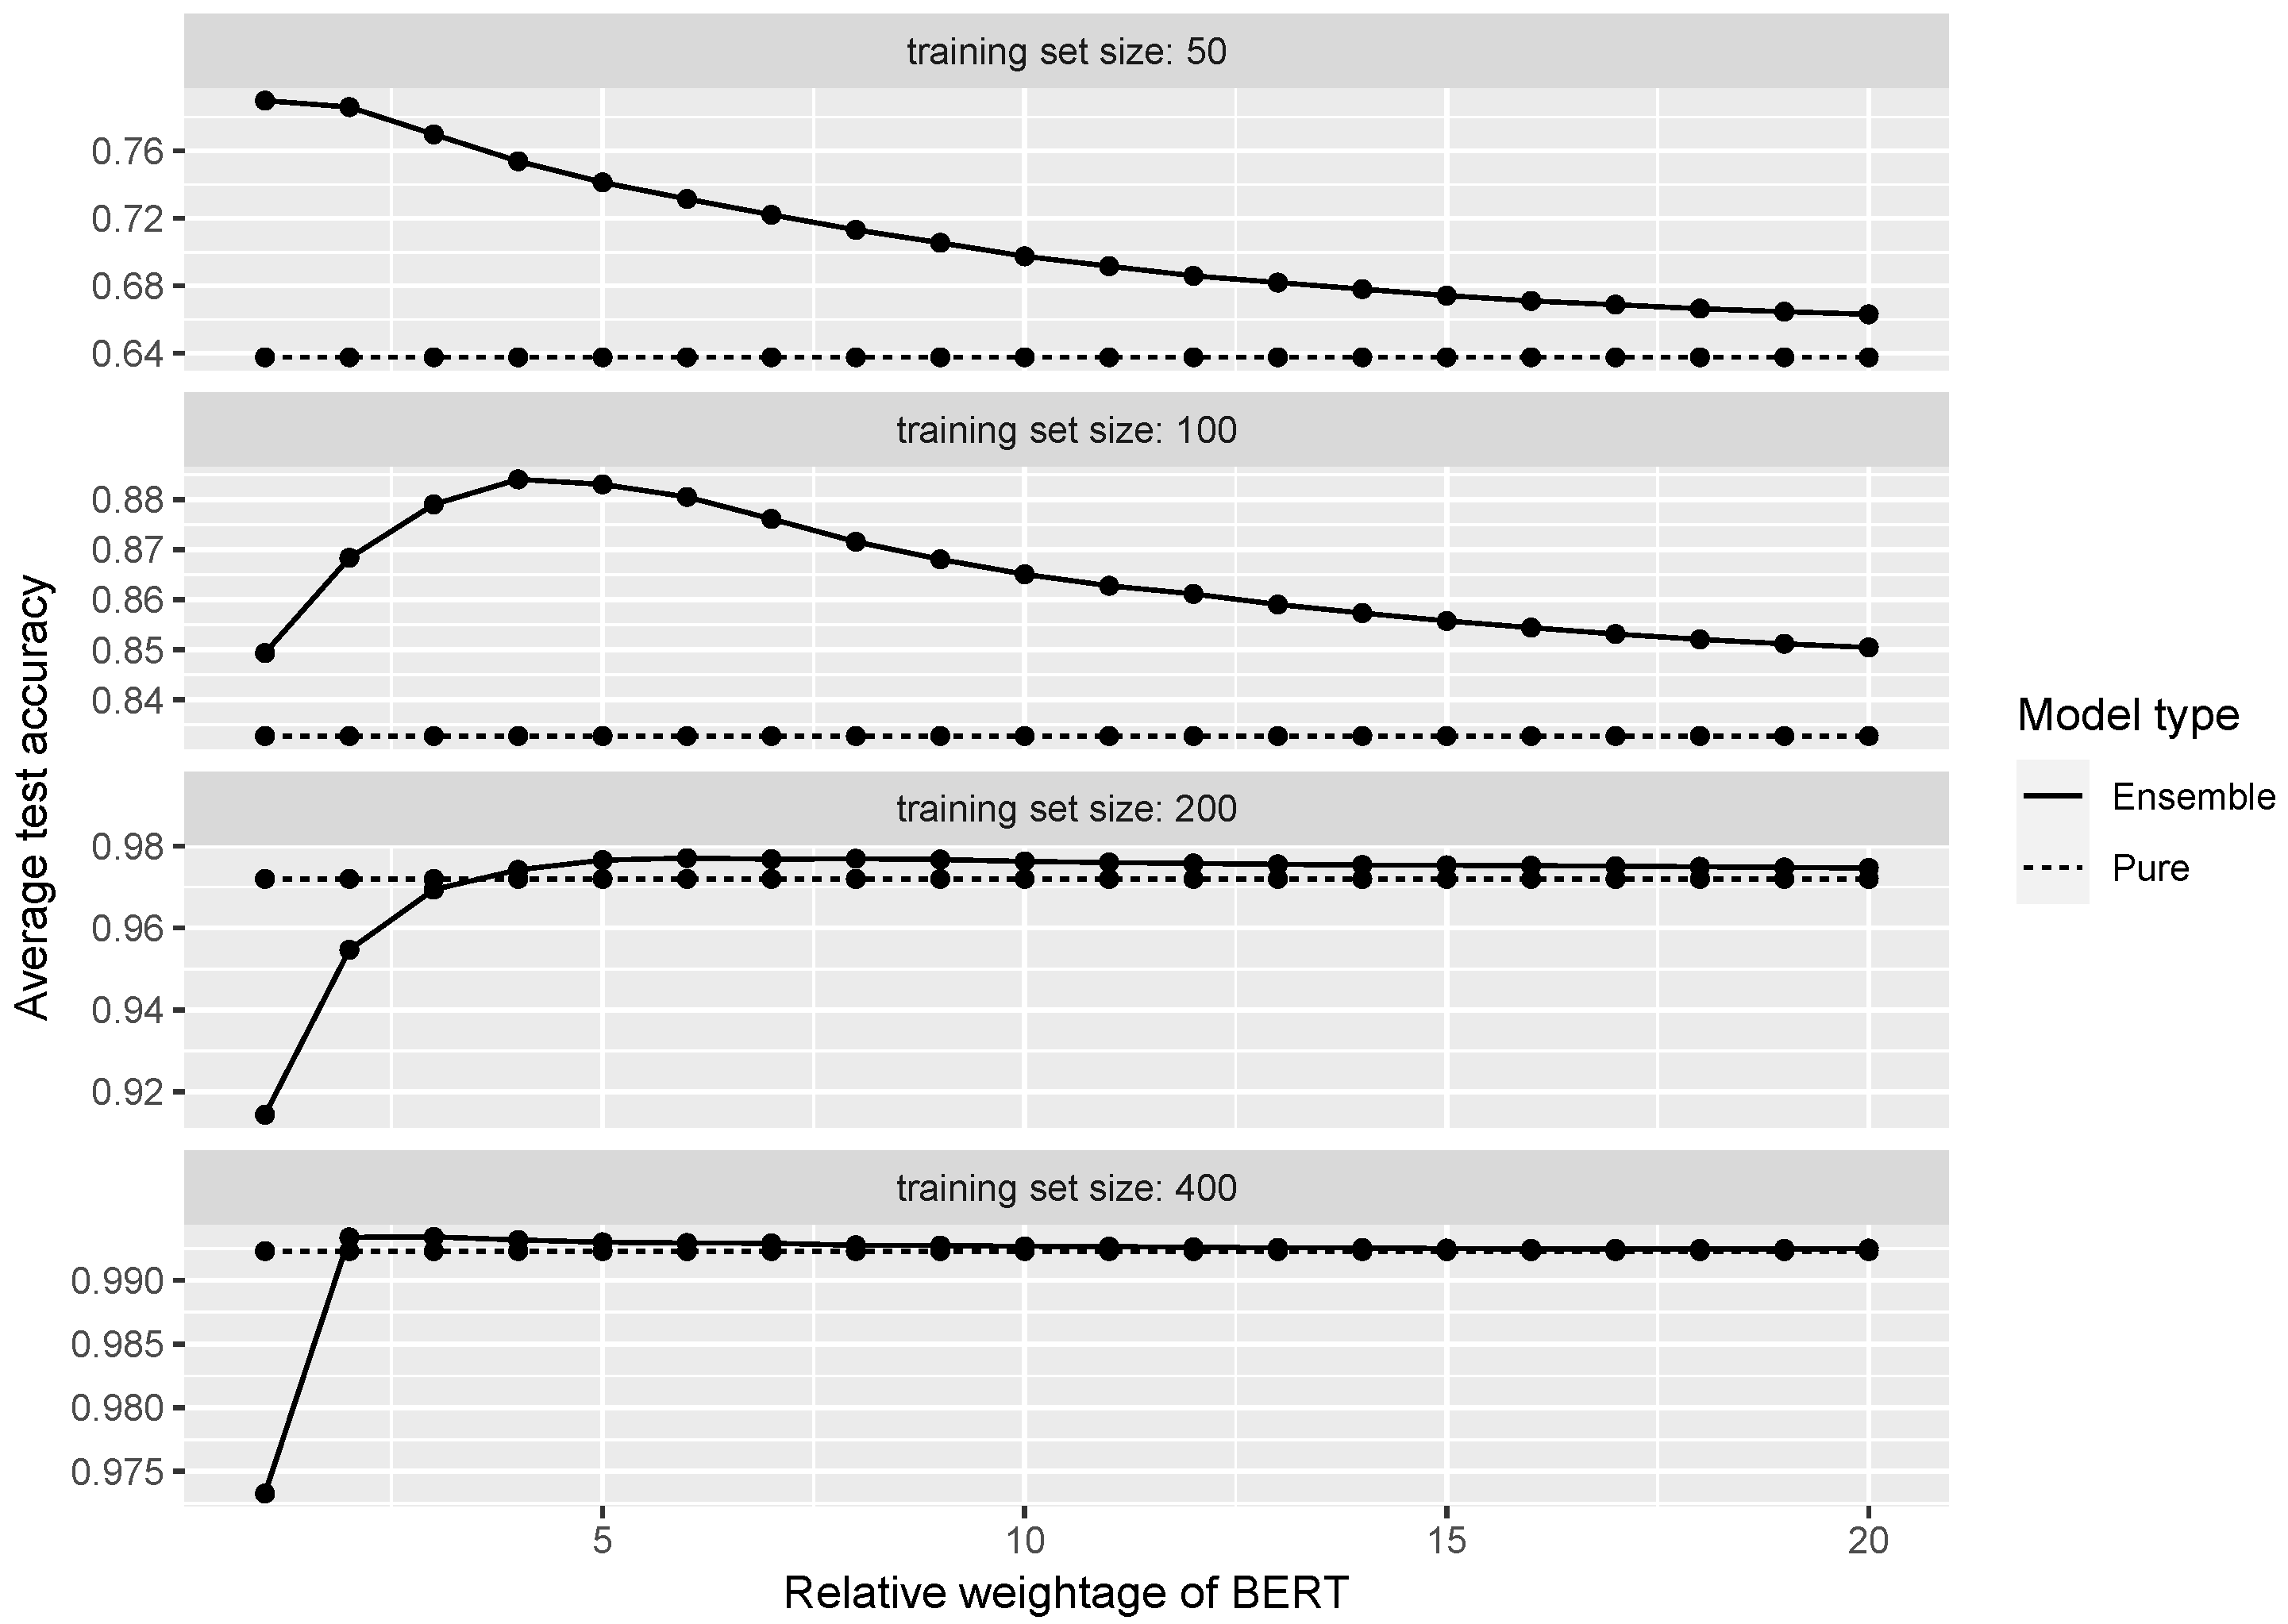
| Ensemble | Training Set Size | Accuracy | Optimal w | Accuracy Improvement | p-Value |
|---|---|---|---|---|---|
| BiLSTM + TDA | 50 | 0.912 | 2 | 0.022 | <0.001 |
| BiLSTM + TDA | 100 | 0.932 | 1 | 0.018 | <0.001 |
| BiLSTM + TDA | 200 | 0.956 | 1 | 0.013 | <0.001 |
| BiLSTM + TDA | 400 | 0.975 | 1 | 0.007 | <0.001 |
| BERT + TDA | 50 | 0.790 | 1 | 0.152 | <0.001 |
| BERT + TDA | 100 | 0.884 | 4 | 0.051 | <0.001 |
| BERT + TDA | 200 | 0.977 | 6 | 0.005 | <0.001 |
| BERT + TDA | 400 | 0.993 | 3 | 0.001 | 0.005 |
Publisher’s Note: MDPI stays neutral with regard to jurisdictional claims in published maps and institutional affiliations. |
© 2022 by the authors. Licensee MDPI, Basel, Switzerland. This article is an open access article distributed under the terms and conditions of the Creative Commons Attribution (CC BY) license (https://creativecommons.org/licenses/by/4.0/).
Share and Cite
Deng, R.; Duzhin, F. Topological Data Analysis Helps to Improve Accuracy of Deep Learning Models for Fake News Detection Trained on Very Small Training Sets. Big Data Cogn. Comput. 2022, 6, 74. https://doi.org/10.3390/bdcc6030074
Deng R, Duzhin F. Topological Data Analysis Helps to Improve Accuracy of Deep Learning Models for Fake News Detection Trained on Very Small Training Sets. Big Data and Cognitive Computing. 2022; 6(3):74. https://doi.org/10.3390/bdcc6030074
Chicago/Turabian StyleDeng, Ran, and Fedor Duzhin. 2022. "Topological Data Analysis Helps to Improve Accuracy of Deep Learning Models for Fake News Detection Trained on Very Small Training Sets" Big Data and Cognitive Computing 6, no. 3: 74. https://doi.org/10.3390/bdcc6030074