1. Introduction
1.1. Background
It is important for any corporation to maintain its existing customers, make a profitable share, and improve the profit margins. Corporations need to satisfy their customers’ needs and go even beyond [
1]. The client’s satisfaction can be considered as one of the significant aspects that play a big part in the success or failure of any business [
2]. Therefore, companies endeavor to meet and exceed customers’ expectations to gain their loyalty. An unhappy customer is a critical and challenging problem that can adversely affect the business; he/she could lead to a ‘churn’ of the customer, which could result in the failure of the business [
3]. It is much more rewarding to keep current customers loyal and happy than getting new ones. As a result, customer satisfaction prediction has become a very important concept in the business world. The concept is considerably attracting the interests of both academic researchers and businesses [
4].
Integrating the Kano model with data mining techniques could improve the selection of relevant characteristics that drive customer satisfaction [
5]. The Kano model can provide a precise classification of the requirements of customers, such as excitement, performance, basic, neutral, indifferent, or reverse factors [
6]. On the other hand, data mining techniques do not only rank the attributes according to their importance, but they continue to use all possible variations of interaction patterns from all variables [
7]. So, combining both approaches will take advantage of both.
A brief explanation of Kano’s five categories is given here. The first category is excitement. It is the quality characteristics that make customers satisfied if present, but do not make customers unsatisfied when absent, while the opposite situation is defined by must-be quality characteristics [
8]. On the other hand, one-dimensional quality characteristics cause customers to be satisfied when present, but dissatisfied when absent, while reverse quality characteristics have the opposite effects. Finally, apathetic quality characteristics do not affect customer satisfaction at all.
The Kano model could help managers better understand the requirements of customers [
9]. The Kano model moves from a “more is always better” approach to a “less is more” approach, so adding one feature could be much better than adding many features, which could result in having an opposite effect on enhancing customers’ satisfaction. On the other hand, clustering the customers to different segments using data mining techniques will allow the Kano model to improve the satisfaction for each segment. In addition, comparing both approaches could support selection decisions and avoid removing attributes that could cause information loss [
10].
1.2. Aim
This research aims at developing a method to integrate the Kano model and data mining approaches to select relevant attributes that drive customer satisfaction with a specific focus on the higher education field. It also intends to apply data mining and feature selection techniques to predict customer satisfaction [
11].
1.3. Method Statement
The main contribution of this research is to solve the problem of selecting features that are not methodically correlated to customer satisfaction. This could reduce the risk of investing in features that could ultimately be irrelevant to enhancing customer satisfaction. This research studies the degree of correlation between customer satisfactions and attributes [
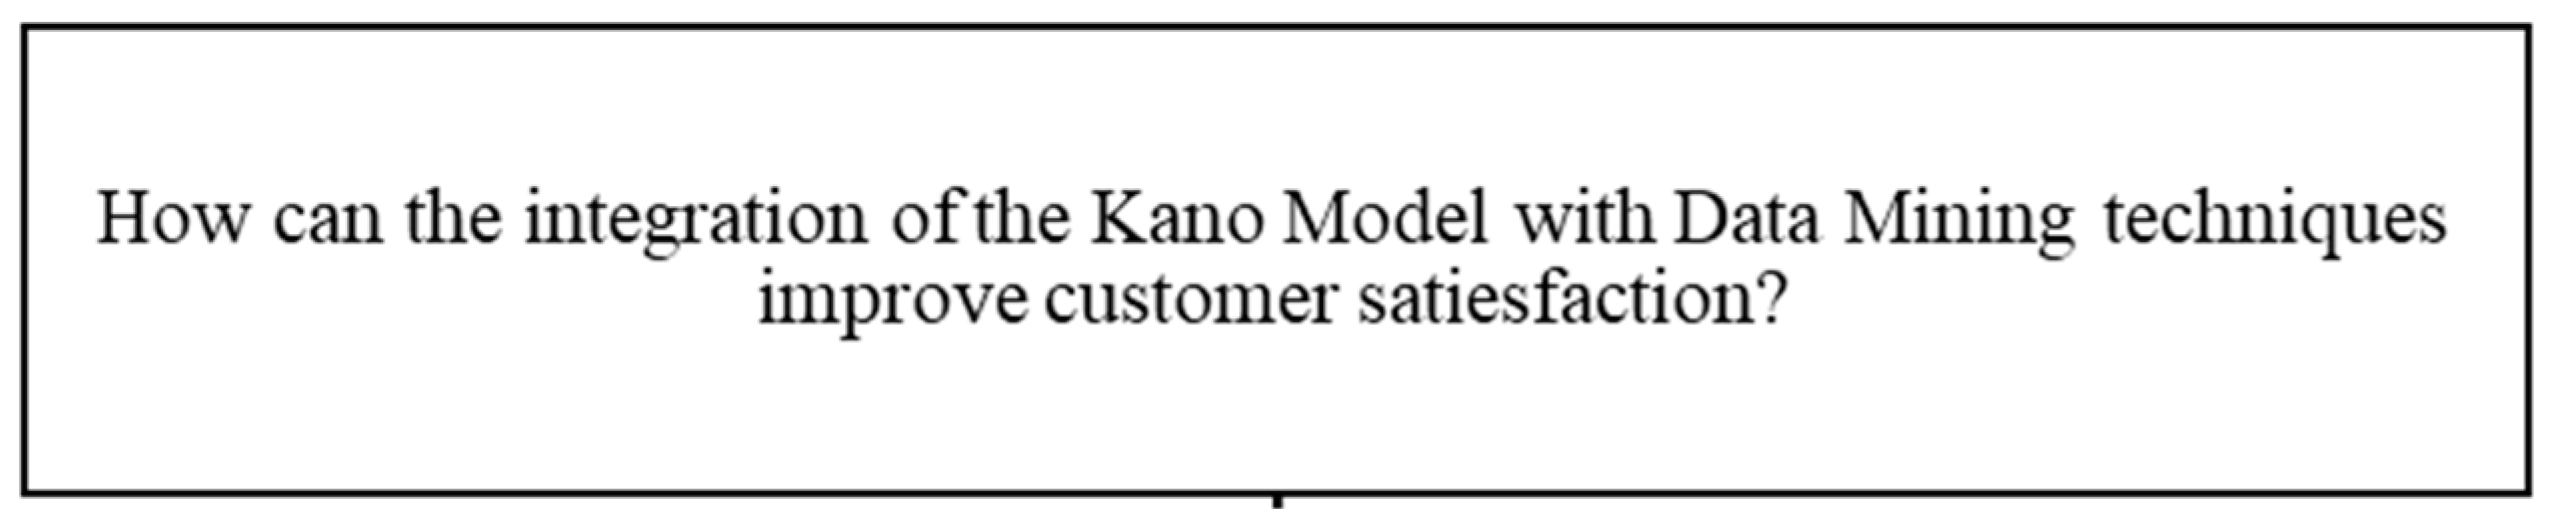
12]; in the context of customer satisfaction, how can customer satisfaction be improved by integrating the Kano model with data mining techniques to select relevant attributes that drive customer satisfaction and reduce the risk of investing in features that could ultimately be irrelevant to enhancing customer satisfaction.
Figure 1 represents the research’s problem and sub-problems [
13].
The Kano model has the advantage of classifying the customer requirement into different categories (excitement, performance, basic, neutral, or reverse factors) [
14]. It could enhance the understanding of customer requirements. Therefore, integrating the Kano model with data mining techniques could enhance the process of selecting the aspects that are more significant for the contentment of the clients. Moreover, the process could reduce the resources required to produce a particular product or service, helping in efficient manufacturing.
2. Literature Review
This research focuses on the notable contributions in the literature of customer satisfaction prediction to enhance customer satisfaction by selecting the most essential attributes [
15]. Though data mining methods have made numerous advances in information processing and representation as compared to traditional techniques, this research will show why they still have not resolved the problem of feature categorization according to the Kano categorization.
According to the previous research, among all data collection techniques and surveys used, only those who used the Kano questionnaire were able to categorize the features according to Kano’s five categories [
16]. The main problem with existing data mining techniques is that the feature selected does not represent the real feature correlated to customer satisfaction. As mentioned earlier, the main contribution of this research is to solve the problem of selecting features that are not methodically correlated to customer satisfaction [
17]. The new proposed model could reduce the risk of investing in features that could ultimately be irrelevant to enhancing customer satisfaction because it will exclude these features.
An earlier study deployed the Kano Model in Higher Education for Quality Improvement by comparing the current situation with the ideal situation of the indicators for the quality using a traditional survey [
18]. The Kano Model was applied to categorize the requirements into five categories to know which attributes could increase customer satisfaction. Feature selection techniques have been applied to choose the most important attributes to minimize dimensionality. Moreover, studies exploring the Kano model have applied the model without any integration with feature selection techniques [
19]. The only combination that ensued was to group clients to different clusters and then the Kano model was applied to draw out the users’ requirements of each cluster. Nevertheless, to the author’s knowledge, no studies to date have generated a model that combines the Kano model with feature selection techniques to select and rank the most prominent attributes related to customer satisfaction as presented in this proposal.
Scientists and scholars have admitted the fact that statistics has been the most prosperous information science [
20]. In comparison, the emergence of data analysis, such as data mining, is fundamentally ascribed to the progress of technologies in computing and data storage [
21]. In the following sub-section, an overview of customer satisfaction prediction using data mining techniques will be provided. Afterwards, features selection techniques will be discussed. The next sub-section will present the Kano Model. The last sub-section will illustrate how the integration between the Kano model and data mining could improve customer satisfaction.
2.1. Data Mining Approaches
For analyzing the survey data, we used a couple of ML models like Logistic Regression, Decision Tree Regression, Random Forest Regression, Adaboost Regression, XGBoost Regression, and Random Tree Regression. For tuning the model and improving the performance of the model, we have used some of the common feature selection methods like correlation-based feature selection, chi square-based feature selection, mutual information lasso feature selection, and ANOVA
t-test based feature selection [
22]. In this section, the justification along with a quick overview of the model has been presented. Moreover, the major advantages and limitations of each model have been discussed in this section.
2.1.1. Logistic Regression
In empirical research, logistic regression is a statistical technique that is often used to analyze categorical dependent variables [
23]. An individual’s class (or category) may be predicted using the statistical method of logistic regression, which is based on one or more factors (x). Since it is simple to implement a broad range of applications, it may serve as a performance basis for several systems [
24]. As a result, each engineer should be acquainted with the ideas it contains [
25]. Furthermore, while developing neural networks, the principles of logistic regression may be used in the development of deep learning by using neural network architecture [
26]. If one has a binary result, which is a variable with just two potential values (0 and 1, yes and no, ill or well), one can use this symbol to represent it.
2.1.2. Decision Tree Regression
Decision trees are used to develop regression or classification models based on tree topologies. It progressively subdivides a dataset into smaller and smaller subgroups while simultaneously constructing a decision-making tree to represent the data [
21]. As a result, a tree comprising leaf nodes and decision nodes is formed. A decision node is composed of two or more branches, each of which represents a value for the feature being checked [
27]. The leaf node shows that a decision has been made about the numerical objective. The root node of a decision tree is the node at the top of the tree that corresponds to the best prediction. Numerous tests, including multicollinearity tests, VIF calculations, and IV calculations on variables, may be performed to narrow the field down to a small number of top variables. Therefore, performance is enhanced since all the undesirable factors have been eliminated [
28].
2.1.3. Random Forest Regression
Random Forest Regression is a supervised learning technique that makes use of a regression learning methodology to get its results [
29]. Using ensemble learning, one may build a forecast that is more accurate than a single model by combining predictions from multiple algorithms simultaneously [
30].
The Random Forest is constructed wherein the trees run parallel to one another, but do not meet one another at all. Random Forests are used to train decision trees since they build multiple decision trees at once, and give the mean class for all the trees [
31].
2.1.4. Adaboost Regression
Adaboost develops and assembles itself mostly via the efforts of succeeding members who have been trained to correctly predict the appearance of certain data events [
32]. Each new predictor is provided with a training package that includes progressively difficult examples that may be weighted or resampled as they go through the training process [
33]. It is a straightforward meta-estimator that begins by fitting an instance regressor to the original data set, and then fits further regressor copies to the same data set, but with the weights of the instances modified to account for the current prediction error [
34]. Therefore, successive regressors lay emphasis on more complicated circumstances.
2.1.5. XGBoost Regression Random Tree
XGBoost is a highly successful regression technique for the development of controlled models that may be found in many applications [
35]. It is possible that knowledge of its goal function (XGBoost), in addition to the basic learners, will aid in determining the veracity of this claim. In the purpose function, there is a loss function as well as a regularization term that must be considered. The distance between the actual values and the model’s predictions is shown by this parameter, which is also known as the gap between the observed and expected values. The reg: linear and reg: logistics functions are the most often encountered sources of XGBoost regression problems [
36].
2.2. Feature Selection Methods
In machine learning, attribute selection has been perceived to be a preferable technique for selecting a subset of relevant features from high-dimensional data. According to [
37], the Feature Selection Model is essential for analyzing the variability and how common the product is amongst other products in an organization portfolio. It proposes to incorporate customer preference information into the model using sentiment analysis of user-generated product reviews [
38].
Different features selection methods have been used to discover the most important attributes amongst all the attributes of various brand measures. Principle Component Analysis (PCA), Correlation-based Feature Subset Selection, and Relief method have been discussed as attribute selection methods [
39]. Furthermore, feature selection algorithms such as Exploratory Factor Analysis (EFA) [
40], feature-based transfer learning strategy, TFS supervised forward feature selection (SFFS) [
41], and Filter–Wrapper [
42] were used.
In addition to this, balanced iterative reducing and clustering using hierarchies (BIRCH) has been used for customer segmentation [
43]. K-means algorithm clustering was based on the loyalty level [
44]. Different feature selection techniques in text categorization have been discussed which include Information Gain (IG), Chi-square (CHI), Correlation Coefficient (CC), and Odds Ratio (OR). To compare different feature selection techniques, different performance metrics like the number of features selected, a list of features, Classifier accuracy, and elapsed time can be used. Feature selection could improve the performance of the prediction algorithms and reduce the memory storage requirements and computation time, which could reduce the computational costs for data analytics [
45].
As mentioned earlier, the Kano model can categorize attributes into five different categories, which has made the Kano model very popular over the last three decades. Different approaches were utilized to assess different kinds of similarities between the mentioned models. According to [
46], various methods have been used to classify quality attributes into Kano categories, which include the Penalty–Reward Contrast Analysis (PRCA), Importance Grid Analysis (IGA), Direct Classification Method, and qualitative data methods. The Kano questionnaire and the direct classification method seem to be the most capable way of characterization technique. However, it is very complicated, and not easy to be implemented.
2.3. The Kano Model
The Kano model represents one of the practical tools that managers can use to assess which characteristics of their company’s products are considered most relevant for customer satisfaction [
47]. Since the introduction of this model, it has gained the interest of both academia and practitioners. In theory, every characteristic of a product, qualitative or quantitative, can be classified into five categories [
48].
These characteristics, also called basic requirements, can be considered as pre-requisite features that are taken for granted and affect satisfaction only when absent. The features from the category of one-dimensional quality, also called performance requirements, affect satisfaction both when present and absent. When present, they improve customer satisfaction, while their absence undermines customer satisfaction. On the contrary, reverse quality attributes improve customer satisfaction when absent and reduce it when present. Finally, indifferent quality characteristics do not have a relevant contribution to customer satisfaction.
Table 1 shows Kano categories [
49].
Various customer satisfaction models can be adopted in research, which can include analytical Kano (A-Kano) model using quantitative measures, fuzzy Kano approach, the Kano method, which is based on the classical conjoint analysis model [
50], and CSTrust that combines the quality of service (QoS) and customer satisfaction prediction [
51]. Ref. [
52] identified the Kano model that uses quantitative and qualitative approaches, which could explain the association between customer satisfaction and customer requirement fulfillment [
52]. Fuzzy Kano questionnaire was used to determine the most important factors in food quality.
Different scholars have used the Kano model to explain their viewpoints. Literature review reveals the product and service quality features and their impact on customer satisfaction as mentioned by researchers. Ref. [
45] explained that complete awareness of customers’ requirements, for example desires and anticipations, represents the critical and mandatory qualification for all those organizations that want to achieve customer satisfaction. Almost two decades ago, Noriaki Kano conceptualized and presented an extremely beneficial model called the Kano model to categorize the characteristics of a product or service, bearing in mind how any product or service can fulfill the demands of the users. The Kano model is deeply entrenched in social psychology. Therefore, the researchers were able to differentiate the aspects into three different kinds in relation to the expectations from the service. The contentment of the clients is found to be deeply impacted by the fulfillment of the mentioned aspects. The classification process might be advantageous for the innovative design guide as an outcome to a novelty element.
2.4. The Kano Model and Data Mining Integration
The existence and continued use of the Kano model over the past three decades may be indicative of the model’s effectiveness in analyzing customer satisfaction. However, new approaches, such as data mining, have become popular. Thus, the following section will examine certain literature to elaborate on whether the use of data mining to complement the Kano model is a novel idea [
53].
This paper reviews data mining integration with the Kano model in addition to well-known statistical methodologies of customer satisfaction. The data mining model can predict customer satisfaction by employing a minimum number of customer attributes required with extremely accurate results. A correlation between the degree of these attributes and customer satisfaction can be analyzed [
54]. Thanks to this methodological approach, company market shares and customer loyalty can be enhanced, and risk can be reduced by avoiding investment in those attributes that are not directly linked to customer satisfaction maximization. The integration of the Kano model with the data mining approach is expected to enhance the limitations of previous standalone methodologies. Furthermore, organizational performance transformation can be guaranteed and reinforced via effective customer satisfaction measurement [
55].
The Kano model has employed various regression analyses to evaluate the model’s non-linear and asymmetric relationships [
56]. Other researchers have criticized the effectiveness of those models that were conceptualized to assess the repetitions in order to evaluate the model’s reliability in assessing the aspects of quality. The Kano model would be employed to extract users’ inherent needs from the derived clusters [
57]. The resulting model customized a website’s content per user cluster and provided an improved newsfeed ideal for each user [
58].
3. Methodology
Predicting the behavior of customers’ unstructured data is well-suited for AI-based algorithms, which search for hidden features and commonalities to link clusters of data that have specific properties [
59]. Furthermore, these models are capable of forecasting price, weather conditions, and customer preferences. It is possible to create customer behavior predictions by segmenting consumers into artificial intelligence groups since customers with similar traits are more likely to buy the same item [
60].
Marketers may enhance their service to potential and existing customers by detecting patterns in big data or data already collected by an organization. With the expansion of this industry, it is expected to grow much more in the years to come [
61]. Using data mining technologies prone to have problems with customer satisfaction. The main idea here is to select the appropriate feature selection combination and ML model that predicts the maximum possible accuracy by using the minimum number of variables or features [
62]. In this case, the developed questionnaire contains nearly 36 features related to student satisfaction in the university. So, if the college or university management wanted to increase the student satisfaction rate, it would need to concentrate on all 36 features. However, the problem is that it practically takes a lot of time as well as resources.
According to [
63], performance attributes are also known as satisfiers. These attributes increase the customer’s enjoyment of the product or service. They do not come under the basic requirements of the product. Ref. [
64] revealed that excitement attributes, also known as surprising elements, offer the uniqueness from the products of rivals and the competitive edge to the product. According to [
65], customers do not know whether they want this feature or not for the functioning of the product. However, these attributes increase customer satisfaction directly. Ref. [
66] found that the basic features provide more satisfaction to the customers. However, along with the basic functioning features, the usage of delighters and one-dimensional attributes increase customer satisfaction because it makes the customers feel that they have the best product or service in hand. It also gives the feeling that they have something different from the common ones [
19]. The category of attractive quality refers to characteristics of a product that can improve customer satisfaction if they are present but do not make customers dissatisfied when absent. These characteristics, also called excitement requirements, can be observed as minor bonuses that make customers more satisfied but are not expected by the customers [
49]. On the other hand, the category of must-be quality refers to those characteristics which would not make customers satisfied when present but would make them dissatisfied when absent.
3.1. Data Collection
In this research, a survey was conducted involving students from the United Arab Emirates University. For this research, the sample was selected randomly from different colleges of United Arab Emirates University (UAE). It is found that nearly 14,387 students are studying in the UAE University. For ensuring the 95% confidence level and 5% margin of error, we need a minimum of 375 or more respondents. It is calculated using the below-given formula.
where
N represents population size,
e denotes Margin of error (percentage in decimal form), and
z indicates
z-score. So, we sent a survey questionnaire to nearly 1500 students. For reaching the respondents, we used online survey conducting tools. At the end of the data collection process, we collected responses of 646 students.
3.2. Scope of the Study
The proposed research helps find out the most important features that have a maximum impact on the student satisfaction rate. So, we can concentrate on these few parameters to improve the student’s satisfaction rate [
67]. For selecting the most important features that show a very higher impact on the student’s satisfaction, this paper uses the combination of the Kano model as well as ML feature selection approaches [
68]. The paper offers a method for determining students’ happiness or satisfaction with the university based on the major features like lab facilities. The author especially intended to sort out the major features that affect the student’s satisfaction with the university so that the universities can be able to focus on those areas to improve the student’s satisfaction.
We utilized data mining to evaluate students’ behavior based on several variables, such as their usage of laboratory facilities.
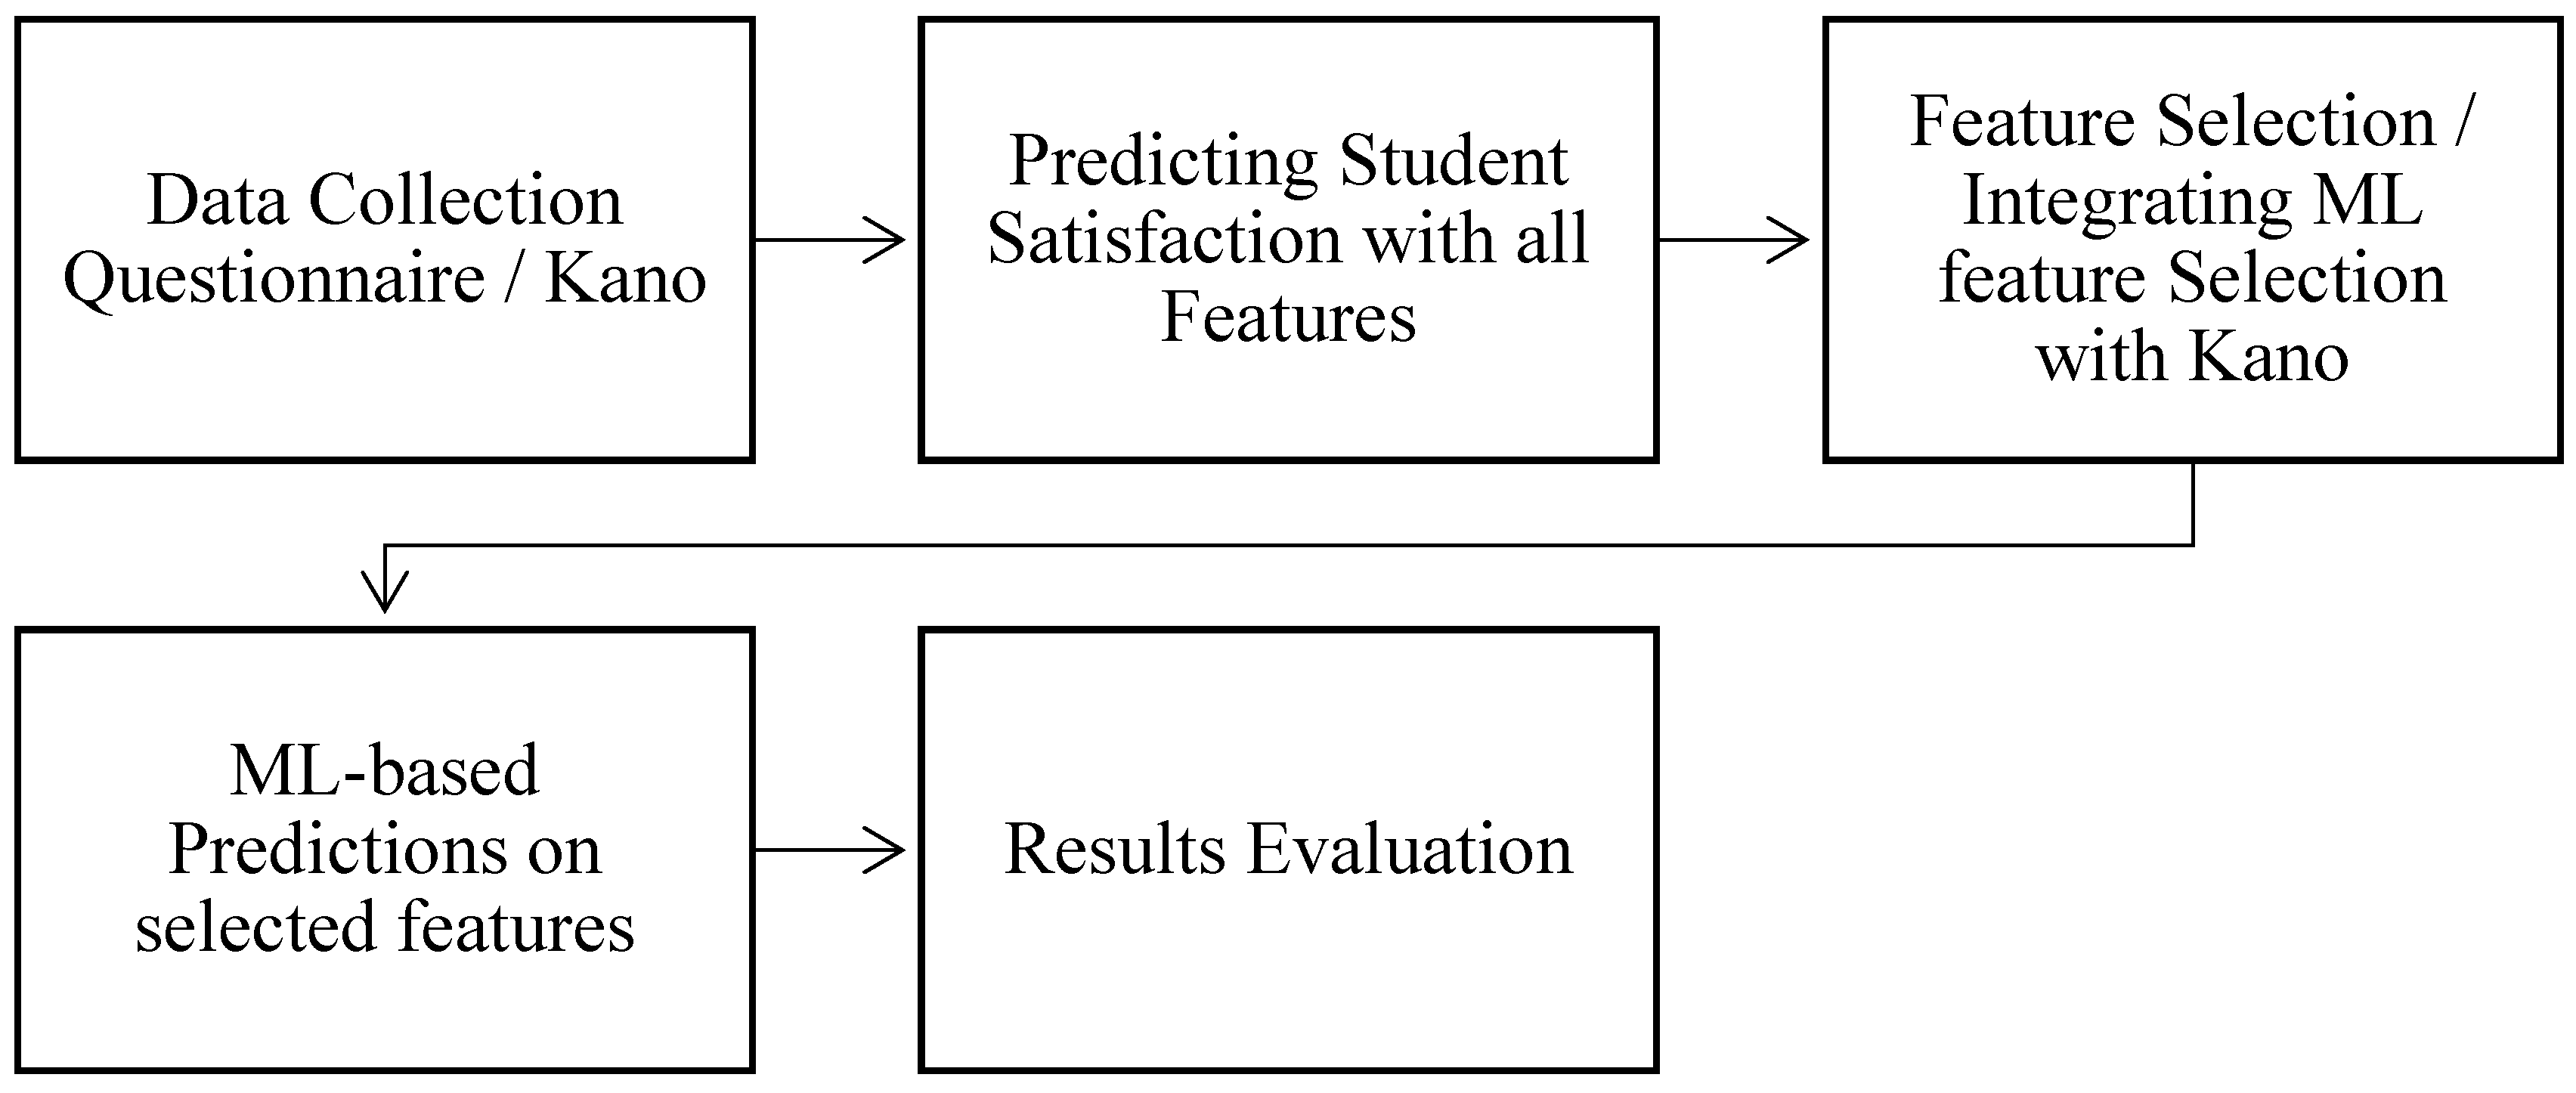
Figure 2 clearly shows the proposed methodology. Different research papers discussed how one-dimensional and delight features are related to satisfaction. According to [
63], performance attributes, also known as satisfiers, increase the customer’s enjoyment of the product or service. These attributes do not come under the basic requirements of the product. Ref. [
69] revealed that excitement attributes, also known as surprising elements, offer the uniqueness from the products of rivals and the competitive edge to the product. According to [
65], customers do not know whether they want this feature or not for the functioning of the product. However, these attributes increase customer satisfaction directly. Ref. [
66] found that the basic features do not provide more satisfaction to the customers. However, along with the basic functioning features, the usage of delighters and one-dimensional attributes increases customer satisfaction because it makes the customers feel that they have the best product or service in hand [
19]. It gives the feeling that they have something different from the common ones [
19]. The category of attractive quality refers to characteristics of a product that can improve customer satisfaction if they are present but do not make customers dissatisfied when absent [
40]. On the other hand, the category of must-be quality refers to those characteristics which would not make customers satisfied when present but would make them unsatisfied when absent.
3.3. Research Analysis Criteria
Evaluation of the results will be done by various methods used to assess the performance, like Mean Absolute Error (MAE), Root Mean Square Error (RMSE), and R-Square value [
70]. These evaluation techniques are the most popular metrics for continuous variables similar to the present problem. The connection between the real values and the estimated values of Y can be determined with the help of the coefficient. If the coefficient is attributed to a greater value, the procedures are said to be effective. The closeness of the prediction to the eventual outcomes can be assessed with the help of a unique error identification mechanism. Root Mean Square Error (RMSE) represents the sample standard deviation of the differences between predicted values (y’) and observed values (y). The lower values of mean absolute error are often attributed to effectiveness in performance. In addition, the Pearson correlation will be used to find the overall correlation between the independent variables and dependent variables. The next measure used for evaluating the model is the R-square value. It is also one of the important measures for evaluating the regression model [
71]. It exactly shows the percentage of dependent variables measured by the model. According to the authors, the R-square is one of the important measures for evaluating the regression models. R-square value is found to be in the range of 0 to 1. The higher the R-square value, the higher the models’ performance.
4. Results and Discussions
4.1. Results for All Features
Results involving different prediction methods have been presented in
Table 2 for both datasets: the satisfaction datasets. The best results were obtained with XGBoost Regression Model with depth = 15. The high correlation coefficient value is 0.986. The Root Mean Squared Error of the model is 0.168 [
72]. The Mean Absolute Error of the model is 0.025. The observation has given rise to the assumption that the contentment of the students can be effectively assessed with the help of this model. Moreover, the coefficient is often found to have a value that is higher than 0.6, which also seems to exhibit the fact that the model is effective in the process of prediction [
73].
While using Kano features located under one dimensional and delight categories to predict from the student satisfaction dataset, the best results were obtained with XGBoost Regression Model with depth = 15. The high correlation coefficient value is 0.905. The Root Mean Square Error (RMSE) of the model is 0.4442. The Mean Absolute Error of the model is 0.1391. The ability of the Kano model to predict is acceptable with low Root Mean Square Error (RMSE) and Mean Absolute Error (MAE).
From
Table 2, the XGBoost Regression Algorithm provides very accurate results because this model has a higher fit [
74]. The R2 value for this model was found to be 0.974, and the correlation value was found to be 0.987. It means that 97.4 percentage of the dependent variable is explained by the independent variables. The next step is to categorize features according to the Kano model. Based on the Kano questionnaire,
Table 3 shows the Kano feature categorization into five different categories.
4.2. Feature Selection Results
The Kano (Dimensional and delight features) are 7, 13, 25, 27, 35, 12, 23, 31, and 36, so the common features between Kano (dimensional and delight features) and other feature selection methods are shown in
Table 4 below.
The common features were observed and assessed in a more comprehensive way to enhance the effectiveness of the study.
Table 4 (summary of the feature selection approach) shows the detailed features selected by each machine learning approach as well as the Kano model. Moreover, the common features between different ML models as well as the Kano model are presented in the table [
46]. We can see that the first two common features in the satisfaction dataset are the Information Technology Services. Teaching quality features are considered as dimension features according to the Kano model categorization. When present, they improve student satisfaction, whereas their absence undermines satisfaction. The results of feature selection are shown in
Table 4.
4.3. Prediction Results for Satisfaction Dataset with Selected Features
This section of the paper discusses the key results of various ML prediction models on the target variable. Here, the different ML model’s results for different feature selection methods are given as tablets. In this section, a detailed comparison of different ML models for different feature selection models has been provided [
75]. From the conducted feature selection process, five attributes have been selected. Here, these five attributes are common attributes between the ML-based feature selection as well as the Kano model feature selection. We also tried different imputations on the feature selection model integration with the Kano model like taking union attributes etc. However, the “Union Approach” increases the number of attributes. At the same time, taking common attributes for the analysis provides results nearly close to those with all variables [
35].
4.3.1. Multi Linear Regression
Table 5 contains the key results of the Multiple Linear regression model. From the table given below, the lasso feature selection method performed very well with the multiple linear regression model [
76].
It has given a higher R-square value as well as a higher Pearson correlation value. In addition, this combination gives a lower RMSE value and MAE value. Here, the R-square value is 0.32, and the Pearson correlation value is 0.57395. It means that 33 % of the variables found to be dependent on certain aspects can be examined using the opposite kind of variables [
48]. Another main parameter is the RMSE value for different feature selection approaches. We found different RMSE values. Among them, for the lasso regularization-based feature selection method, the RMSE value is lower and is equal to 0.85767. Here, the linear regression results are very poor as compared to other methods.
4.3.2. XGB Regressor
Table 6 contains the key results of the XGBRegressor model with depth = 15. From the table given below, it is clear that the ANOVA based feature selection method performed very well with the XGBRegressor model.
It has given a higher R-square value as well as a higher Pearson correlation value. In addition, this combination gives a lower RMSE value and MAE value [
35]). Besides this, the R-square value is 0.69068, and the Pearson correlation value is 0.83106. It means that 69% of the variables found to be dependent on certain aspects can be examined using the opposite kind of variables. Here, the results show that the XGBRegressor model predicts the target variable very well than the multiple linear regression model [
77]. Another main parameter is the RMSE value for different feature selection approaches. We found different RMSE values. Among them, the RMSE value for the ANOVA feature selection method is lower, namely, 0.58250.
4.3.3. AdaBoost Regressor
Table 7 presents the key results of the AdaBoost Regressor model. From the table given below, the ANOVA based feature selection method performed very well with the AdaBoost Regressor model [
78].
It produced a higher R-square value as well as a higher Pearson correlation value. Moreover, this combination gives a lower RMSE value and MAE value [
79]. The R-square value is 0.68051, and the Pearson correlation value is 0.82530. It means that 68% of the variables found to be dependent on certain aspects can be examined using the opposite kind of variables. The outcomes were able to express the fact that the AdaBoost Regressor model with depth = 15 predicts the target variable very well than the multiple linear regressor model. However, the performance of the AdaBoost Regressor model with the ANOVA feature selection is lower than the XGBRegressor model with ANOVA feature selection [
78]. The RMSE value for the ANOVA feature selection method is lower, in particular, 0.592.
4.3.4. Random Forest Regressor Model
Table 8 contains the key results of the Random Forest Regressor model. From the table given below, it is clear that the ANOVA based feature selection method has performed very well with the Random Forest Regressor model [
68].
It provided a higher R-square value as well as a higher Pearson correlation value. Moreover, this combination produced a lower RMSE value and MAE value. The R-square value was 0.68664, and Pearson correlation value was 0.82883 [
80]. This means that 68.7% of the variables were found to be dependent on certain aspects which can be examined using the opposite kind of variables. The outcomes were able to express the fact that the Random Forest Regressor model with a depth of 15 can predict the target variable better than the multiple linear regressor model [
81]. However, the performance of this model was slightly lower than the performance of the AdaBoost Regressor model with the ANOVA feature selection and the XGBRegressor model with the ANOVA feature selection. The RMSE value for the ANOVA feature selection method was lower; 0.58630.
4.3.5. Decision Tree Regressor Model
Table 9 contains the key results of the Decision Tree Regressor model. From the table given above, it is clear that the ANOVA feature selection method performed very well with the Decision Tree Regressor model with depth = 15. It has produced a higher R-square value as well as a higher Pearson correlation value. Furthermore, this combination provides a lower RMSE value and MAE value. The R-square value is 0.69068, and the Pearson correlation value is 0.83107. The decision Tree Regressor model predicts the target variable very well than the multiple linear regressor model [
82]. Besides this, the performance of the Decision Tree Regressor model with the ANOVA feature selection is similar to the XGBRegressor model with the ANOVA feature selection. The RMSE value for the ANOVA feature selection method is lower, specifically, 0.58251.
5. Discussion
The connection between the contentment of the clients and different aspects of the institutions has been found to be effectively determined with the help of regression techniques [
83]. As shown in the result part, the main metrics for model evaluation used in this research are R-square value, RMSE, MAE, and Pearson correlation coefficient. The comparison clearly shows that the best model with all attributes (XgBoost Regression model with n = 15) has R-Square value, RMSE, MAE, and Pearson Correlation Coefficient of 0.974, 0.169, 0.025, and 0.987, respectively. One of the goals of the integration experiments was to find out the subset of attributes that can provide almost the same prediction accuracy as with all attributes besides knowing which attributes match between Kano and other feature selection methods. The results show that XGBRegressor with depth 15 and Decision Tree Regression with depth 15 have the best performance. Only four features have been used to predict the common features between ANOVA and Kano features located under one dimensional and delight categories. The R-Square value, RMSE, MAE, and Pearson Correlation Coefficient are 0.69, 0.58, 0.32, and 0.83, respectively, which are closer to the model with all attributes.
The outcomes were able to suggest that the techniques that are used to assess the repetitions were found to be capable of identifying the relationship between the contentment of the clients and different aspects of the services of the institution [
69]. Different methods were found to be effective in determining the aspects that are more significant in contributing to the contentment of the clients. In addition, the process of obtaining similar aspects was able to enhance the precision in relation to the assessment of all different characteristics. With the help of this information, the administration team of the institution will be able to significantly improve the contentment of the clients. The outcomes were able to determine the major aspects that were found separately in various institutions. So, it will be a wise move to combine various university services for predicting customer satisfaction. Various university services seem to emphasize various aspects; therefore, the unification process will be able to substantially enhance the services of all the involved institutions. Moreover, the study can be equipped in many different situations to obtain effective outcomes.
The significance of every aspect in relation to the contentment of the clients has been carefully observed. From this research, it is clear that the maximum R-square value and Pearson correlation value are found to be 0.69068 and 0.83107, respectively, for Decision Tree Regressor as well as XGBoost Regressor. Moreover, the used feature selection approach is ANOVA Based Feature selection approach. Here, these results are derived using four different parameters like R-square value, RMSE, MAE, and Pearson correlation coefficient. The common attributes between the ANOVA features selection method and Kano’s one dimensional and delight features produce the highest Pearson correlation coefficient value that is equal to 83%. It is nearest to the results with all the attributes with a 98% Pearson correlation coefficient. It was achieved with only four features which can be considered a very small number of features as compared to the full model which has 37 attributes. This shows that the ANOVA technique is effective in the identification of aspects of the students that are found to be effectively contributing to the contentment of the students. Moreover, the four similar characteristics between Kano and ANOVA feature selection can produce acceptable readings of performance if the information is adequate. The four mentioned characteristics are Food, Dining Hall, Services, and the Possibility of communicating with the administration. They are located under the Delight category. The other common services are the Information in the E-services (Grades, Schedules, Payment Reports, etc.) and teaching quality. They are located under the one-dimensional category. The teaching quality feature has been selected by all feature selection methods, which means that it is the most important attribute. The correlation coefficient between the features and the student satisfaction index is not less than 0.48 for all prediction methods.
6. Conclusions
The main objective of the experiment is the construction of an effective model that can determine student satisfaction at university based on the independent variables, like features and facilities, provided by the university. Integrating the Kano model with data mining techniques could improve the selection of relevant characteristics that drive customer satisfaction. Different kinds of regression techniques were equipped in the experiment for the purpose of determining the contentment of the students. According to the results of integration between the Kano model and ANOVA feature selection method, we found Food, Dining Hall, Services, the Possibility of communicating with the administration as the most important features related to satisfaction. The Information in the E-services (Grades, Schedules, Payment Reports, etc.) relates to teaching quality. The teaching quality feature has been selected by all feature selection methods, which means that it is the most important attribute. It was achieved with only these four features, which can be considered as a very small number of features as compared to the full model which has 37 attributes. This shows that the ANOVA technique is effective in the identification of aspects of the students that are found to be effectively contributing to the contentment of the students. The comparison clearly shows that the best model with all attributes (XGBoost Regression model with n = 15) has R-Square value, RMSE, MAE, and Pearson Correlation Coefficient of 0.974, 0.169, 0.025, and 0.987, respectively. From this research, it is clear that the Maximum R-Square value, RMSE, MAE, and Pearson Correlation Coefficient are 0.69, 0.58, 0.32, and 0.83, respectively, for the XGBoost Regressor as well as the Decision Tree Regressor, which are closer to the model with all attributes. Furthermore, the correlation coefficient between the features and the student satisfaction index is not less than 0.48 for all prediction methods.
Based on the results, the administration team of the institution will be able to effectively make use of the connections to determine the contentment of the students in relation to any changes that are to be made to the characteristics of the institution. There are 646 records that are attributed to small data, and this is one of the very few disadvantages of the experiment. Moreover, the outcomes could be only effective for the institutions that are present within the country.
This research work can be further improved by using different imputation approaches to feature selection. In this paper, the common features among the Kano model as well as the ML-based feature selection approach have been used. Here, higher importance was given to the feature selection approach and ML prediction algorithms. In the future, the model tuning processes should be conducted to improve the model efficiency and accuracy.
Author Contributions
Conceptualization, A.A. and K.A.R.; methodology, K.A.R.; software, K.A.R.; validation, K.A.R. and F.A.; formal analysis, K.A.R.; investigation, K.A.R. and F.A.; resources, K.A.R.; data curation, K.A.R.; writing—original draft preparation, K.A.R.; writing—review and editing, K.A.R., F.A. and A.A.; visualization, K.A.R.; supervision, F.A. and A.A.; project administration, F.A.; funding acquisition, F.A. All authors have read and agreed to the published version of the manuscript.
Funding
This research was funded by United Arab Emirates University, grant number 31T076 and the APC was funded by United Arab Emirates University.
Institutional Review Board Statement
Not applicable.
Informed Consent Statement
Not applicable.
Data Availability Statement
The data presented in this study are available on request from the corresponding author.
Conflicts of Interest
The authors declare no conflict of interest.
References
- Lars, W.; Löfgren, M.; Dahlgaard, J.J. Theory of attractive quality and the kano methodology—The past, the present, and the future. Total. Qual. Manag. Bus. Excell. 2013, 24, 1241–1252. [Google Scholar] [CrossRef] [Green Version]
- Erdem, K.; Dong, X.; Suhara, Y.; Balcisoy, S.; Bozkaya, S.; Pentland, A.S. Behavioral attributes and financial churn prediction. EPJ Data Sci. 2018, 7, 41. [Google Scholar] [CrossRef] [Green Version]
- Mikulić, J.; Prebežac, D. A critical review of techniques for classifying quality attributes in the kano model. Manag. Serv. Qual. An. Int. J. 2011, 21, 46–66. [Google Scholar] [CrossRef] [Green Version]
- Amin, A.; Anwar, S.; Adnan, A.; Nawaz, M.; Alawfi, K.; Hussain, A.; Huang, K. Customer churn prediction in the telecommunication sector using a rough set approach. Neurocomputing 2017, 237, 242–254. [Google Scholar] [CrossRef]
- Yue, G.; Barnes, S.J.; Jia, Q. Mining meaning from online ratings and reviews: Tourist satisfaction analysis using latent Dirichlet allocation. Tour. Manag. 2017, 59, 467–483. [Google Scholar] [CrossRef] [Green Version]
- Li-Fei, C. A Novel approach to regression analysis for the classification of quality attributes in the kano model: An empirical test in the food and beverage industry. Omega 2012, 40, 651–659. [Google Scholar] [CrossRef]
- Yabing, Z.; Xu, X.; Wang, M. Predicting overall customer satisfaction: Big data evidence from hotel online textual reviews. Int. J. Hosp. Manag. 2019, 76, 111–121. [Google Scholar] [CrossRef]
- Rotar, J.; Kozar, L.; Kozar, M. The use of the kano model to enhance customer satisfaction. Organizacija 2017, 50, 339–351. [Google Scholar] [CrossRef] [Green Version]
- Shwetank, A.; Singh, R.; Rashmi, R. QFD and fuzzy kano model based approach for classification of aesthetic attributes of suv car profile. J. Intell. Manuf. 2018, 31, 271–284. [Google Scholar] [CrossRef]
- Siu-Tong, A.; Duan, R.; Jiang, W. A data mining framework for product and service migration analysis. Ann. Oper. Res. 2011, 192, 105–121. [Google Scholar] [CrossRef]
- Zi-Hung, Y.; Hu, Y.-H.; Tsai, C.-F.; Kuo, Y.-M. Integrating feature and instance selection techniques in opinion mining. Int. J. Data Warehous. Min. 2020, 16, 168–182. [Google Scholar] [CrossRef]
- Lucy, X.K. Simultaneous confidence bands for log-logistic regression with applications in risk assessment. Biom. J. 2017, 59, 420–429. [Google Scholar] [CrossRef]
- Jie, J.; Subramanian, N.; Ning, K.; Edwards, D. Product delivery service provider selection and customer satisfaction in the era of internet of things: A Chinese e-retailers’ perspective. Int. J. Prod. Econ. 2015, 159, 104–116. [Google Scholar] [CrossRef]
- Adnan, A.; Ersöz, S.; Toklu, B. Customer satisfaction and loyalty analysis with classification algorithms and structural equation modeling. Comput. Ind. Eng. 2015, 86, 95–106. [Google Scholar] [CrossRef]
- Amy, X.D.; Emam, S.; Gniadecki, R. Review of machine learning in predicting dermatological outcomes. Front. Med. 2020, 7, 266. [Google Scholar] [CrossRef]
- Emmanuel, M.I. Survey questionnaire survey pretesting method: An evaluation of survey questionnaire via expert reviews technique. Asian J. Soc. Sci. Stud. 2019, 4, 1. [Google Scholar] [CrossRef] [Green Version]
- Yueling, X.; Li, Q.; Wang, P.; Ye, M. Informative gene selection based on cost-sensitive fast correlation-based feature selection. Curr. Bioinform. 2021, 16. [Google Scholar] [CrossRef]
- Arefi, M.M. Application of Kano Model in higher education quality improvement: Study master’s degree program of educational psychology in State Universities of Tehran. World Appl. Sci. J. 2021, 17, 347–353. [Google Scholar]
- Arash, S.; Akasheh, S. Classifying customer requirements using Kano model and Kano map: The case of hospital services. Int. J. Product. Qual. Manag. 2017, 21, 500. [Google Scholar] [CrossRef]
- Hosseini, K.; Hamid, S.; Behboudi, L. Brand trust and image: Effects on customer satisfaction. Int. J. Health Care Qual. Assur. 2017, 30, 580–590. [Google Scholar] [CrossRef] [PubMed]
- Caigny, A.d.; Coussement, K.; de Bock, K.W. A New hybrid classification algorithm for customer churn prediction based on logistic regression and decision trees. Eur. J. Oper. Res. 2018, 269, 760–772. [Google Scholar] [CrossRef]
- Pandey, N.; Patnaik, P.K.; Gupta, S. Data pre-processing for machine learning models using python libraries. Int. J. Eng. Adv. 2020, 9, 1995–1999. [Google Scholar] [CrossRef]
- Francky, F. Exact conditioning of regression random forest for spatial prediction. Artif. Intell. Geosci. 2020, 1, 11–23. [Google Scholar] [CrossRef]
- Pinky, S.; Awasthi, N.; Sharma, V. Introduction to machine learning and its basic application in python. SSRN Electron. J. 2019. [Google Scholar] [CrossRef]
- Hung, H.; Jou, Z.-Y.; Huang, S.-Y. Robust mislabel logistic regression without modeling mislabel probabilities. Biometrics 2017, 74, 145–154. [Google Scholar] [CrossRef] [Green Version]
- Frank, E.-S.; Yang, Z.; Feng, H.; Tripathi, S.; Dehmer, M. An introductory review of deep learning for prediction models with big data. Front. Artif. Intell. 2020, 3, 4. [Google Scholar] [CrossRef] [Green Version]
- Gokhan, A.; Keceoglu, C.R. Comparison of results obtained from logistic regression, chaid analysis and decision tree methods. Eurasian J. Educ. Res. 2019, 19, 1–20. [Google Scholar] [CrossRef] [Green Version]
- Uma Mohan, M.; Suma, V.; Christa, S. Regression and decision tree approaches in predicting the effort in resolving incidents. Int. J. Bus. Inf. Syst. 2020, 1, 1. [Google Scholar] [CrossRef]
- Vinodhini, G.; Ramaswamy, C. Patient opinion mining to analyze drugs satisfaction using supervised learning. J. Appl. Res. Technol. 2017, 15, 311–319. [Google Scholar] [CrossRef]
- Gino, I.; Ciaburro, G.; Trematerra, A. Wind turbine noise prediction using random forest regression. Machines 2019, 7, 69. [Google Scholar] [CrossRef] [Green Version]
- Engin, P. Estimation of soil moisture using decision tree regression. Theor. Appl. Climatol. 2019, 139, 1111–1119. [Google Scholar] [CrossRef]
- Xiaoyan, Z.; Zhang, P.; Xie, M. A joint long short-term memory and adaboost regression approach with application to remaining useful life estimation. Measurement 2021, 170, 108707. [Google Scholar] [CrossRef]
- Amin, S.; Abbasi, M.; Haugen, Ø. Boosting algorithms for network intrusion detection: A comparative evaluation of real adaboost, gentle adaboost and modest adaboost. Eng. Appl. Artif. Intell. 2020, 94, 103770. [Google Scholar] [CrossRef]
- Koduri, B.; Gunisetti, S.L.; Ramesh, C.H.; Mutyalu, K.B.; Ganesh, D. prediction of crop production using adaboost regression method. J. Phys. Conf. Ser. 2019, 1228, 012005. [Google Scholar] [CrossRef]
- Kutlug, S.E. Assessing the predictive capability of ensemble tree methods for landslide susceptibility mapping using xgboost, gradient boosting machine, and random forest. SN Appl. Sci. 2020, 2, 1–17. [Google Scholar] [CrossRef]
- Avanijaa, J. Prediction of house price using xgboost regression algorithm. Turk. J. Comput. Math. Educ. 2021, 12, 2151–2155. [Google Scholar] [CrossRef]
- Feng, Z.; Jiao, J.R.; Yang, X.J.; Lei, B. Augmenting feature model through customer preference mining by hybrid sentiment analysis. Expert Syst. Appl. 2017, 89, 306–317. [Google Scholar] [CrossRef]
- Ahlem, A.; Hacine-Gharbi, A.; Ravier, P.; Mostefai, M. Mutual information based feature selection for fingerprint identification. Informatica 2019, 43. [Google Scholar] [CrossRef] [Green Version]
- Amir, A. Evaluation of the relationship between brand measures and customer satisfaction by using data mining techniques. J. Intell. Fuzzy Syst. 2017, 33, 2451–2462. [Google Scholar] [CrossRef]
- Nooshin, Z.; Shojaie, A.A.; Shariatmadari, M. Modeling and analysis of bank customer satisfaction using neural networks approach. Int. J. Bank Mark. 2015, 33, 717–732. [Google Scholar] [CrossRef]
- Jin, X.; Xiao, Y.; Huang, A.; Liu, D.; Wang, S. Feature-selection-based dynamic transfer ensemble model for customer churn prediction. Knowl. Inf. Syst. 2014, 43, 29–51. [Google Scholar] [CrossRef]
- Adnan, I.; Khan, A. Churn prediction system for telecom using filter–wrapper and ensemble classification. Comput. J. 2016, 60, 410–430. [Google Scholar] [CrossRef]
- Mubasher, H.M. Customer profiling and segmentation in retail banks using data mining techniques. Int. J. Adv. Res. Comput. Sci. 2018, 9, 24–29. [Google Scholar] [CrossRef]
- Jui-Sheng, C.; Chiu, C.-K.; Farfoura, N.; Al-Taharwa, I. Optimizing the prediction accuracy of concrete compressive strength based on a comparison of data-mining techniques. J. Comput. Civil. Eng. 2011, 25, 242–253. [Google Scholar] [CrossRef]
- Serhat, P.; Kocyigit, A.; Eren, P.E. A hybrid approach for predicting customers’ individual purchase behavior. Kybernetes 2017, 46, 1614–1631. [Google Scholar] [CrossRef]
- Nisheeth, J.; Katyayan, P.; Ahmed, S.A. Comparing classical ml models with quantum ml models with parametrized circuits for sentiment analysis task. J. Phys. Conf. Ser. 2021, 1854, 012032. [Google Scholar] [CrossRef]
- Yu-Cheng, L.; Huang, S.-Y. A new fuzzy concept approach for kano’s model. Expert Syst. Appl. 2009, 36, 4479–4484. [Google Scholar] [CrossRef]
- Salman, N.-S.; Keramati, A. Modeling customer satisfaction with new product design using a flexible fuzzy regression-data envelopment analysis algorithm. Appl. Math. Model. 2017, 50, 755–771. [Google Scholar] [CrossRef]
- Sajjad, S.; Safari, S.; Mohsenian, F. Improving candy industry competitiveness: Retailers’ perception regarding customer satisfaction. J. Food Prod. Mark. 2017, 24, 761–783. [Google Scholar] [CrossRef]
- Line, L.O.; Witell, L.; Gustafsson, A. Turning customer satisfaction measurements into action. J. Serv. Manag. 2014, 25, 556–571. [Google Scholar] [CrossRef] [Green Version]
- Rania, O.; Belkaroui, R.; Faiz, R. Extracting product features for opinion mining using public conversations in twitter. Procedia Comput. Sci. 2017, 112, 927–935. [Google Scholar] [CrossRef]
- Maria Grazia, V.; Vezzetti, E. Kano qualitative vs quantitative approaches: An assessment framework for products attributes analysis. Comput. Ind. 2017, 86, 15–25. [Google Scholar] [CrossRef]
- Xuefeng, H.; Ai, X.; Jing, Y.; Liu, Y. Partner selection of agricultural products supply chain based on data mining. Concurr. Comput. Pract. Exp. 2015, 28, 1246–1256. [Google Scholar] [CrossRef]
- Maria Jose, G.; Soto-Hidalgo, J.S.; Alcala-Fdez, J.; Alcala, R. experimental study on 164 algorithms available in software tools for solving standard non-linear regression problems. IEEE Access 2019, 7, 108916–108939. [Google Scholar] [CrossRef]
- Yanan, G.; Rasouli, S.; Timmermans, H.; Wang, Y. Trip stage satisfaction of public transport users: A reference-based model incorporating trip attributes, perceived service quality, psychological disposition and difference tolerance. Transp. Res. Part. A Policy Pract. 2018, 118, 759–775. [Google Scholar] [CrossRef]
- Kee Kuo, C.; Chiu, R.-H.; Chang, C.-R. Using beta regression to explore the relationship between service attributes and likelihood of customer retention for the container shipping industry. Transp. Res. Part. E Logist. Transp. Rev. 2017, 104, 1–16. [Google Scholar] [CrossRef]
- Hazra, T.K.; Sarkar, R.; Kumar, A. Handwritten english character recognition using logistic regression and neural network. Int. J. Sci. Res. 2016, 5, 750–754. [Google Scholar] [CrossRef]
- Daniel, C. Feature extraction algorithms from mri to evaluate quality parameters on meat products by using data mining. ELCVIA Electron. Lett. Comput. Vis. Image Anal. 2018, 16, 1. [Google Scholar] [CrossRef] [Green Version]
- Mohsen, F.; Patterson, A.R.; Rolland, R. Modeling customer satisfaction from unstructured data using a bayesian approach. Decis. Support. Syst. 2016, 90, 1–11. [Google Scholar] [CrossRef]
- David, B.; Mgbemena, C. Data-driven agent-based exploration of customer behavior. Simulation 2017, 94, 195–212. [Google Scholar] [CrossRef] [Green Version]
- Mohammad Ali Afshar, K.; Estemdad, N.; Poorebrahimi, A. customer behavior in banking industry: Comparison of data mining techniques. J. Adv. Manag. Sci. 2015, 3, 13–16. [Google Scholar] [CrossRef]
- Sebastian, R.; Patterson, J.; Nolet, C. Machine learning in python: Main developments and technology trends in data science, machine learning, and artificial intelligence. Information 2020, 11, 193. [Google Scholar] [CrossRef] [Green Version]
- Manuela, I.; Ulewicz, R. How to make e-commerce more successful by use of kano’s model to assess customer satisfaction in terms of sustainable development. Sustainability 2019, 11, 4830. [Google Scholar] [CrossRef] [Green Version]
- Madzík, P.; Budaj, P.; Mikuláš, D.; Zimon, D. application of the kano model for a better understanding of customer requirements in higher education—A pilot study. Adm. Sci. 2019, 9, 11. [Google Scholar] [CrossRef] [Green Version]
- Mahima, G.; Shri, C. Understanding customer requirements of corrugated industry using kano model. Int. J. Qual. Reliab. Manag. 2018, 35, 1653–1670. [Google Scholar] [CrossRef]
- Renáta, T. A generalization of traditional kano model for customer requirements analysis. Qual. Innov. Prosper. 2015, 19. [Google Scholar] [CrossRef]
- Simon, L.; Nahar, K.; Fung, B.C.M. Product customization of tablet computers based on the information of online reviews by customers. J. Intell. Manuf. 2013, 26, 97–110. [Google Scholar] [CrossRef]
- Setti, S.; Naidu, V.P.S. Mahalanobis-ANOVA criterion for optimum feature subset selection in multi-class planetary gear fault diagnosis. J. Vib. Control. 2021, 107754632110291. [Google Scholar] [CrossRef]
- Marcello, M.; di Fatta, G.; di Felice, M. Understanding customer satisfaction with services by leveraging big data: The role of services attributes and consumers’ cultural background. IEEE Access 2019, 7, 8195–8208. [Google Scholar] [CrossRef]
- Botchkarev, A. Evaluating performance of regression machine learning models using multiple error metrics in azure machine learning studio. SSRN Electron. J. 2018. [Google Scholar] [CrossRef]
- Botchkarev, A. A New typology design of performance metrics to measure errors in machine learning regression algorithms. Interdiscip. J. Inf. Knowl. Manag. 2019, 14, 45–76. [Google Scholar] [CrossRef] [Green Version]
- Made, S.I.; Nyoman, N.; Pinata, P.; Rusjayanthi, N.K.D.; Wisswani, N.W. Estimation of gourami supplies using gradient boosting decision tree method of xgboost. TEM J. 2021, 10, 144–151. [Google Scholar] [CrossRef]
- Yan-Hong, L. Text feature selection algorithm based on chi-square rank correlation factorization. J. Interdiscip. Math. 2017, 20, 153–160. [Google Scholar] [CrossRef]
- Omer, S.; Rokach, L. Approximating xgboost with an interpretable decision tree. Inf. Sci. 2021, 572, 522–542. [Google Scholar] [CrossRef]
- Werner, M.; Malan, K.M.; Engelbrecht, A.P. A feature selection algorithm performance metric for comparative analysis. Algorithms 2021, 14, 100. [Google Scholar] [CrossRef]
- Pandit, P.; Dey, P.; Krishnamurthy, K.N. Comparative assessment of multiple linear regression and fuzzy linear regression models. SN Comput. Sci. 2021, 2, 1–8. [Google Scholar] [CrossRef]
- Byeong, U.P.; Mammen, E.; Lee, Y.K.; Lee, E.R. Varying coefficient regression models: A review and new developments. Int. Stat. Rev. 2013, 83, 36–64. [Google Scholar] [CrossRef]
- Yuren, W.; Lu, X.; Tan, Y. Impact of product attributes on customer satisfaction: An analysis of online reviews for washing machines. Electron. Commer. Res. Appl. 2018, 29, 1–11. [Google Scholar] [CrossRef]
- Jaesung James, P.; Oh, J. Treatment effects analysis on credit guarantee using survey questionnaire. J. Ind. Econ. Bus. 2018, 31, 1079–1112. [Google Scholar] [CrossRef]
- Dhaval, J.A. An enhanced and secured predictive model of ada-boost and random-forest techniques in hcv detections. Mater. Today Proc. 2021. [Google Scholar] [CrossRef]
- Dimosthenis, T.; Montana, G. Random forest regression for manifold-valued responses. Pattern Recognit. Lett. 2018, 101, 6–13. [Google Scholar] [CrossRef] [Green Version]
- Sangwon, K.; Jeong, M.; Ko, B.C. Self-supervised keypoint detection based on multi-layer random forest regressor. IEEE Access 2021, 9, 40850–40859. [Google Scholar] [CrossRef]
- Suljic, M.; Osmanbegovic, E.; Dobrović, Ž. Common metamodel of questionnaire model and decision tree model. Res. Appl. Econ. 2018, 10, 106. [Google Scholar] [CrossRef] [Green Version]
| Publisher’s Note: MDPI stays neutral with regard to jurisdictional claims in published maps and institutional affiliations. |
© 2021 by the authors. Licensee MDPI, Basel, Switzerland. This article is an open access article distributed under the terms and conditions of the Creative Commons Attribution (CC BY) license (https://creativecommons.org/licenses/by/4.0/).


