1. Introduction
Extensive investigations and efforts have been made for experimentally studying steam condensation, through means of convergent-divergent nozzles, beginning with the experiments documented by Stodola [
1] already in 1922. Since the 1990s, Computational Fluid Dynamics (CFD) has successfully been applied to condensing steam flows to predict condensation onset and further two-phase steam flow phenomena. Such numerical simulations must include models for subcooling, nucleation, and droplet growth and there is a variety of different approaches and combinations of models. The performance of different CFD-codes has been investigated by Starzmann et al. [
2] in the International Wet Steam Modelling Project (IWSMP) where numerous wet-steam CFD methods are compared to each other and to experimental data, for several nozzle test cases. The authors demonstrated a reasonable agreement with experimental data, i.e., pressures measured along the nozzle axis. Nevertheless, it was assessed that there are still considerable differences among the various condensation models used, especially regarding calculating the droplet spectra. Furthermore, it was concluded that the experimental data are not sufficient to achieve proper numerical validation.
The research of Moses & Stein [
3], Moore et al. [
4], Barschdorff [
5] and Gyarmathy & Lesch [
6] contain the best documented and available experimental data, even though they have been published decades ago. Unfortunately, as reliable as these experiments have proven to be, proper droplet spectra data are not featured in the data sets. Moreover, the documented spatial resolution of the pressure measurements is frequently not sufficient to identify the exact condensation locations.
With regard to the latter issue, the experiments performed by Barschdorff are an exception. During their experiments, he used a sliding probe to measure the pressure rise along the nozzle and to determine aerothermodynamic shocks. However, when using sensors placed away from the measurement location, a change in pressure is always recorded with a delay. Yet, the impact of relaxation time on the pressure measurements is not discussed by Barschdorff. In addition, droplet data are not featured and the results have not been reproduced since.
Consequently, the nozzle based on the Barschdorff geometry has been studied experimentally at the steam tunnel of the ITSM at the University of Stuttgart, featuring enhanced instrumentation. It was the motivation to provide new and more accurate validation data for more comprehensive numerical validation, including droplet spectra. Additionally, all measurements have been effectively reproduced to prove data reliability. This manuscript corresponds to our meeting paper ETC2023-165 published in the Proceedings of the 15th European Turbomachinery Conference, Budapest, Hungary, 24–28 April 2023 [
7].
2. Description of Steam Nozzle Test Rig at ITSM
2.1. Background
Over several decades ago, the ITSM has studied relevant experimental and numerical test cases on the study of two-phase steam flow phenomena. The first facilities of a steam wind tunnel date back to the 1990s (Renner [
8]), which originally featured a cylindrical slotted nozzle. The possibility of pneumatic measurements was quite limited. Furthermore, the conditioning of the inlet steam was performed by means of water sprays upstream of the test section, which did not allow for achieving saturated conditions.
Eberle [
9] modified the test facility and installed a reproduction of the Barschdorff nozzle. The modifications included new piping lines, water traps, and new instrumentation that could measure droplet spectra through optical means. Numerous experiments were carried out, although significant challenges were faced regarding droplet populations. Specifically, a considerable amount of large water droplets was randomly entering the nozzle, leading to heterogeneous condensation and tainting the droplet size measurements. The source was found to be that after the water injection nozzle (for the steam conditioning), the liquid was not fully evaporated before entering the nozzle. This meant that the control of the inlet temperature was a greatly demanding task and made the measurement time window utterly limited.
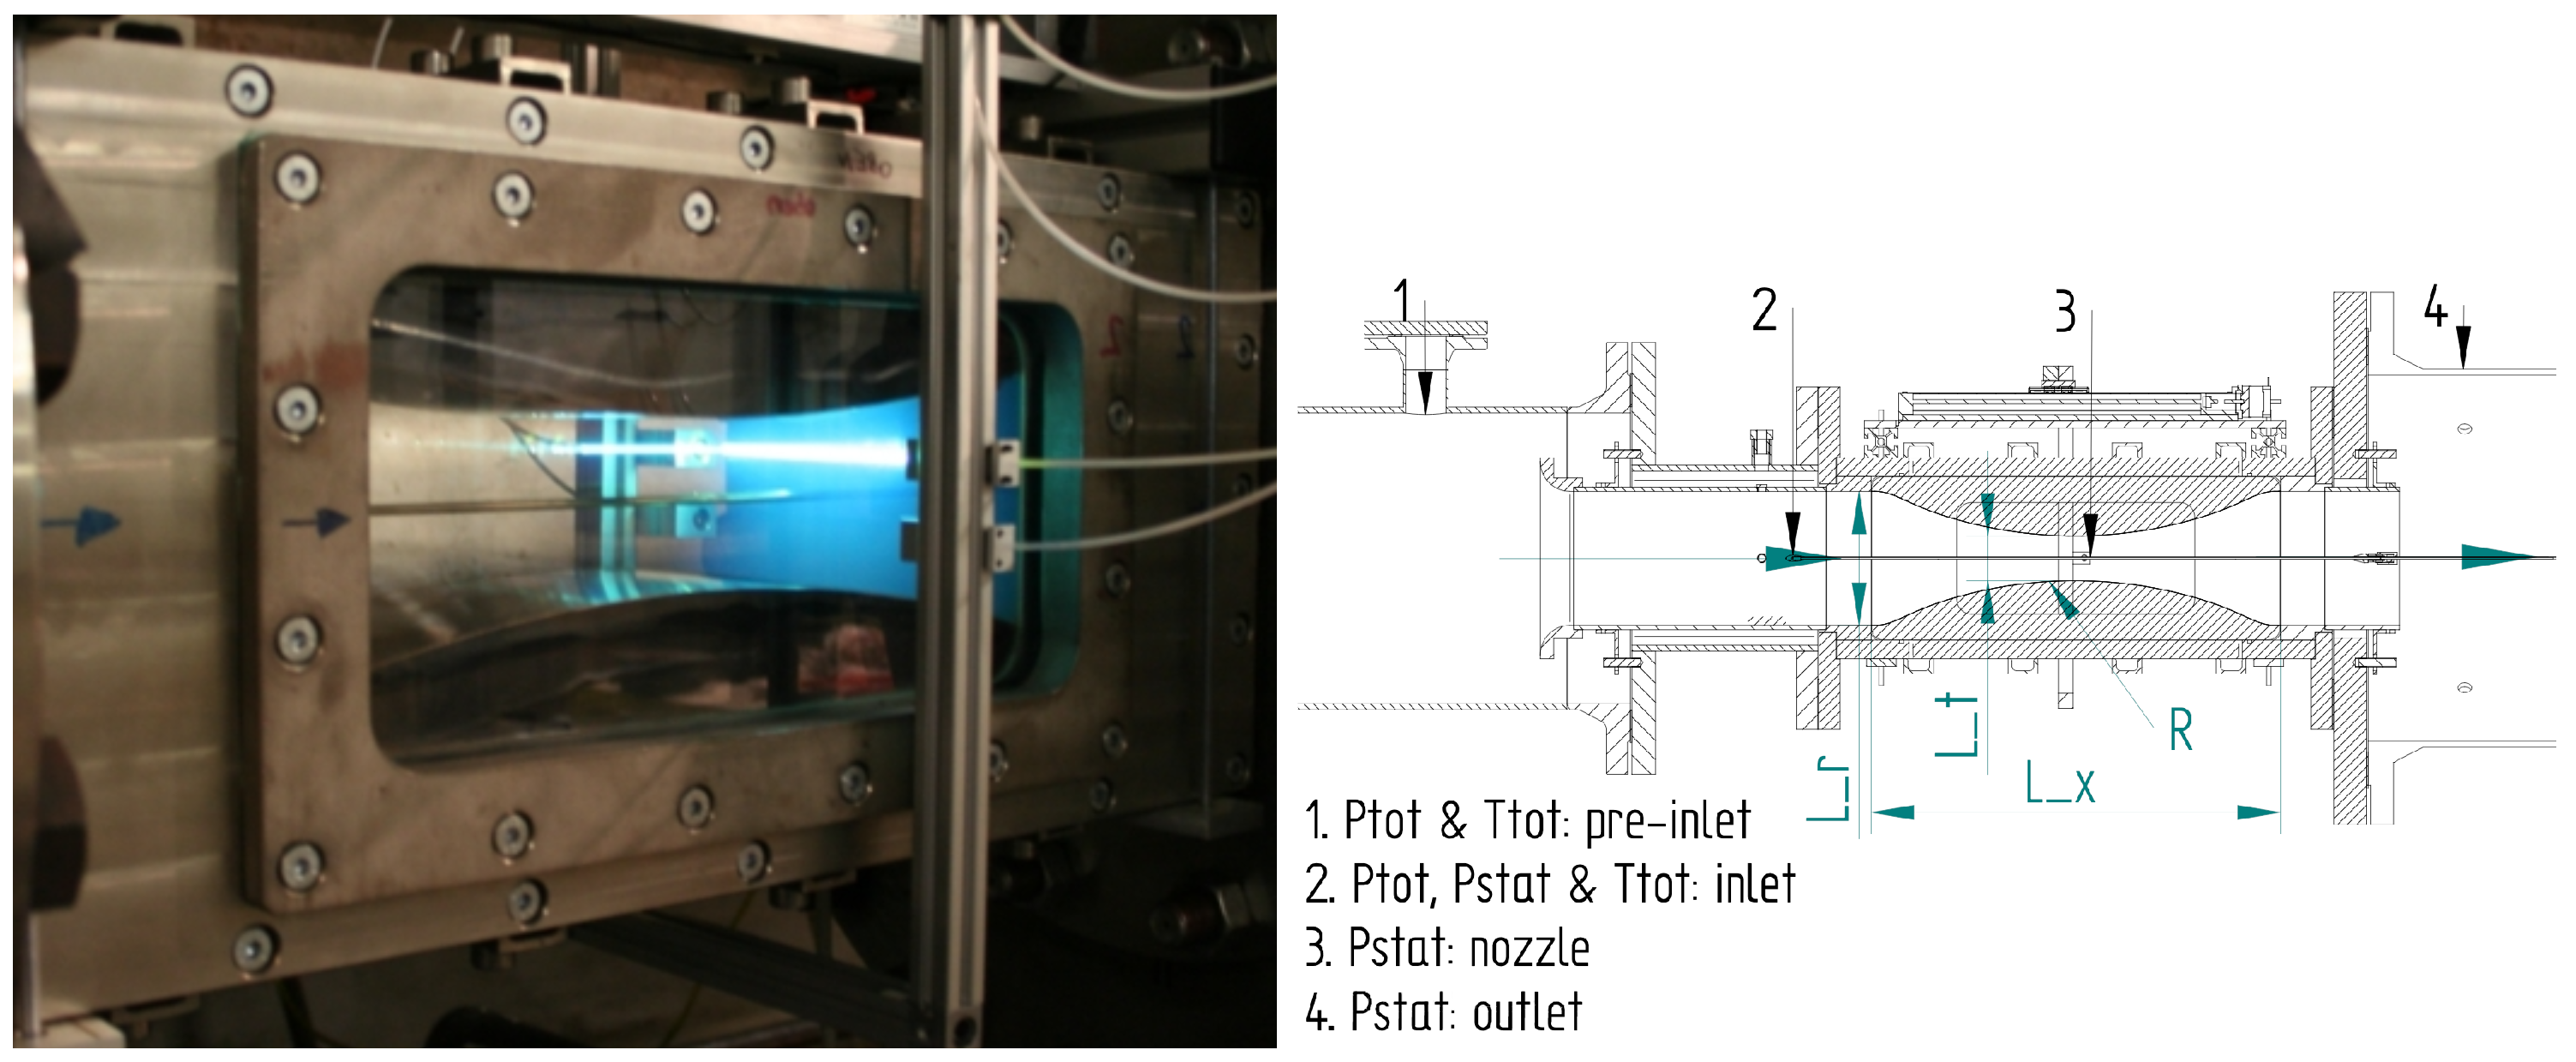
Figure 1 shows the ITSM steam wind tunnel facility with the Barschdorff geometry installed. The pressures are measured with several absolute and relative pressure transducers and the temperatures with a Pt100 and a thermocouple type-K. Additionally, the nozzle dimensions are displayed, where
= 550 mm corresponds to the nominal axial length of the nozzle,
= 180 mm to the inlet and outlet height and
= 60 mm to the throat height. The nozzle radius is
R = 584 mm and the nozzle width is 100 mm.
2.2. Steam Cooler
This paper also introduces the most recent modification to the ITSM nozzle test rig. It consists of adding a 8 m water bath steam cooling vessel system to improve the control of the operating points (OP) in the nozzle. With this scheme, it is possible to maintain stable and dry inlet conditions, yielding in having sufficient time to measure the flow features and droplet spectra repeatedly, generating new and reliable experimental data.
Based on the desuperheating principle, the water bath steam cooler contains a column of water, which works as a heat exchanger with the superheated steam entering the piping. The steam conditioning is therefore controlled by the pressure in the vessel. This allows the delivery of saturated steam at a specified temperature. Consequently, nozzle inlet superheat can be controlled by setting the appropriate pressure in the vessel and throttling to the required inlet pressure into the nozzle measurement section. At the ITSM test rig, it is possible to make fine inlet pressure adjustments, down to 0.2 mbar approximately. If saturated conditions at the nozzle inlet are required, valves are fully opened to minimize the pressure drop. Downstream of the steam cooler, as a way to keep the presence of larger droplets to a minimum, a steam cyclone separator is installed.
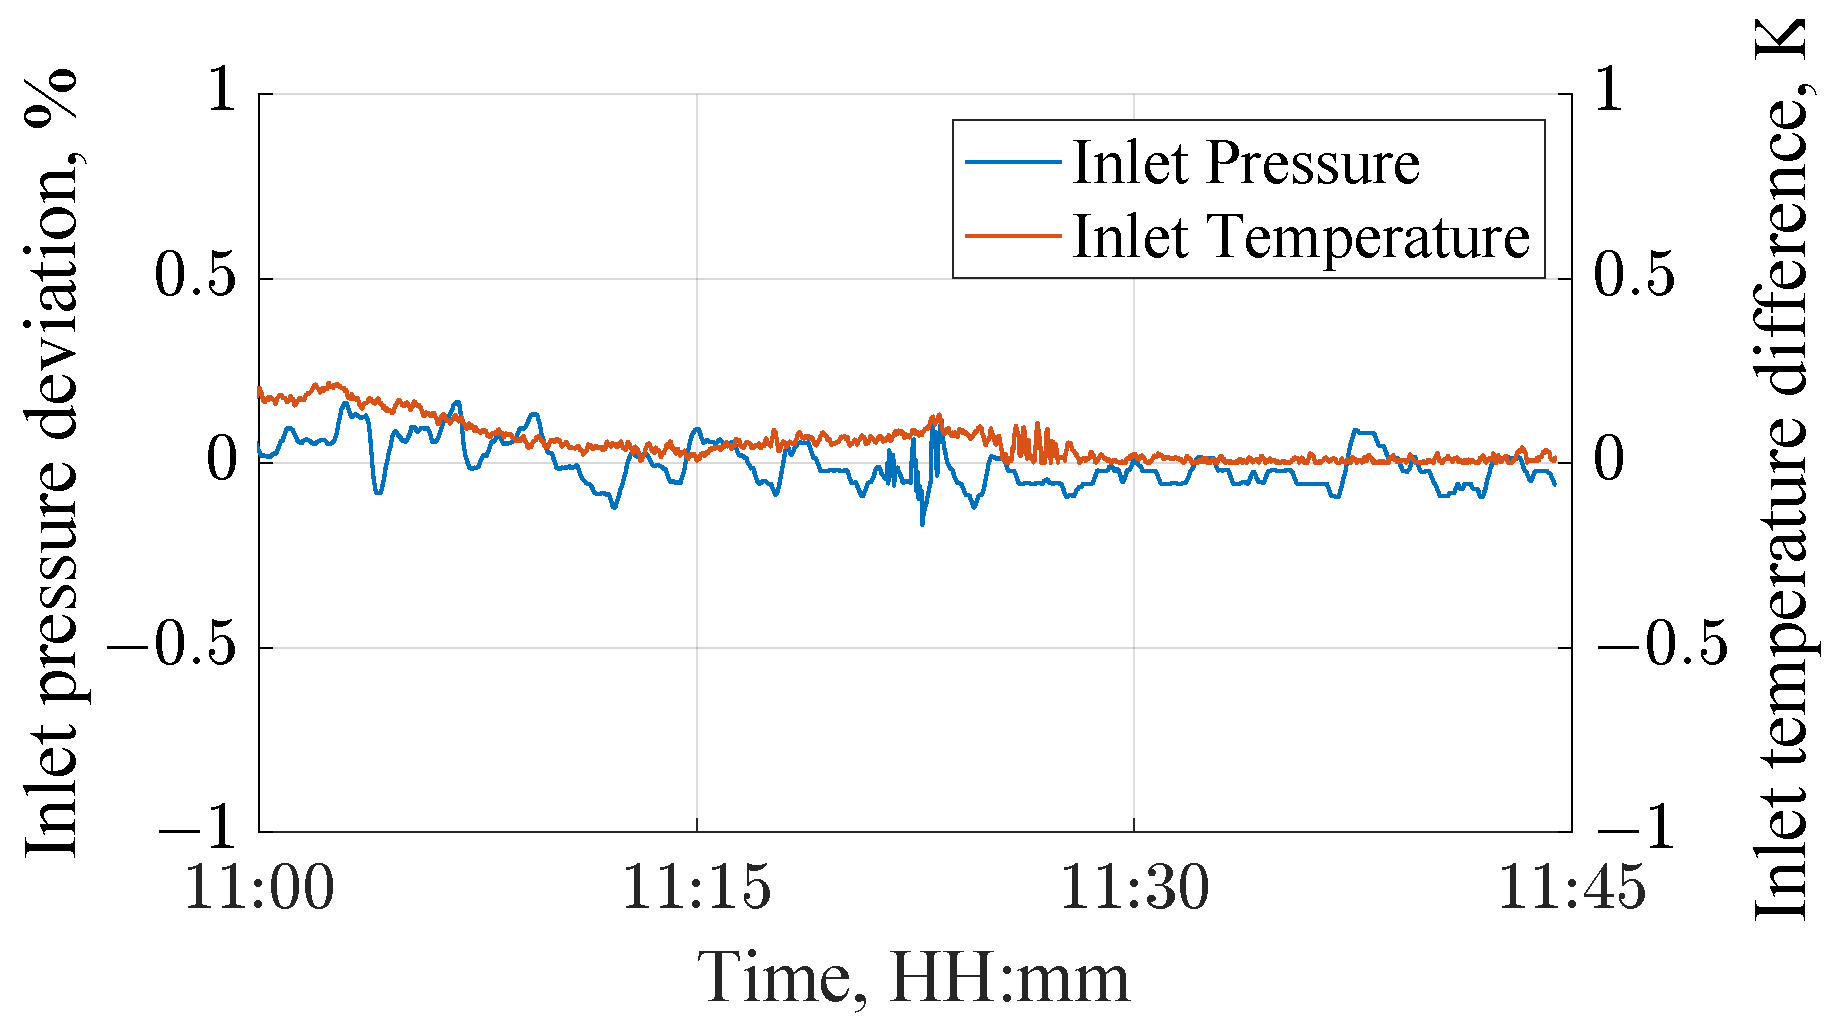
The data acquired during the measurement campaign after the modifications proved that there were no more random large water droplets entering the nozzle. Furthermore, as long as the main inlet steam feed remained constant, the inlet conditions of the rig remained equally stable. This allows having a longer measurement period for each OP, as well as reproduction of the experiment. In
Figure 2, the steady and constant course of inlet conditions during one of the experiments, i.e., pressure and temperature over time, is shown as an example.
3. Measurement Techniques
3.1. Pneumatic
The test rig is equipped with a pneumatic and optical traverse system. This frame is capable of simultaneously capturing pneumatic and optical data with a spatial resolution of 1 mm. Similar to Barschdorff, a pneumatic probe traverses the nozzle axially, inside a fixed hollowed tube that is located horizontally at the centreline of the nozzle. The tube has a 4 mm outer diameter and a 2 mm inner diameter hole. Additionally, the hollowed tube has a slit that is aligned with the transducer tap, which enables the capture of pneumatic data. Equally, at the nozzle inlet, total and static pressure, as well as total temperature are measured to calculate the inlet conditions. The back pressure of the nozzle is measured and can be controlled by a throttle valve, achieving pressures lower than 50 mbar if required. The nozzle measurement section is displayed in
Figure 1, where the frame with the optical traverse, as well as the pneumatic tube, can be observed.
3.2. Droplet Spectra
The optical traverse consists of two collimator lenses installed in the optical traverse frame. The lens diameter is 5 mm. As a way to improve spatial resolution, these collimators have been modified by restricting the width of the light beam path, down to 1 mm. Droplet spectra are measured by means of the light extinction method (Walters [
10]). As shown by Equation (
1), the principle of light extinction is based on the light scattering of single particles. When a water droplet—or any given particle with a corresponding refraction index—travels through any kind of light, such particles or molecules generate a decrease of light intensity through absorption and scattering.
In this equation, the optical length
l is the width of the nozzle,
and
are the measured light reference and sample intensities, respectively. The reconstruction of droplet size and droplet number is then calculated, based on measured spectral extinction along the nozzle (function of the wavelength
, extinction coefficient
and droplet diameter range
D). For details on the methodology used for this publication, the interested reader may refer to works performed by Schatz [
11], and Eberle et al. [
12].
The light is transmitted through a quartz window on each side of the nozzle. The light source used for the experiments is a Deuterium-Halogen light with wavelengths of 250–750 nm. Intensity measurements were performed using a 12-bit spectrometer. Since extinction spectra are used to determine the features of the steam, it is of vital importance to mention that the extinction characteristic of any particle depends on the ratio of its circumference and the wavelength of the light (
) being attenuated. This ratio is defined as the Mie-parameter:
In general terms, this number gives an insight as to the amount of light that is being scattered by a droplet, which can be divided into three regimes:
Rayleigh-scattering: Up to ∼ 1, with scattering characteristics more or less independent of droplet diameter
Mie-scattering: 1 ∼ ∼ 35, with distinct scattering features
: Geometrical optics
The lower wavelength limit of roughly 250 nm from the Deuterium-Halogen light source allows the detection of steam droplets as small as 100 nm. Based on the definition of the Mie-parameter with the wavelengths used, this is translated to measure in the region of Rayleigh scattering. This represents a significant challenge because the spectral extinction curve does not exhibit characteristic features that can be used to easily identify the droplet diameter. Instead, the droplet number is a second parameter. Moreover, there is a significant impact of noise on the results. As a consequence, the light intensity samples must be as clean as possible. Hence, for a reliable experiment, it is fundamental to cross-check every component of the optical equipment, and to achieve as steady inlet conditions as provided in the current experiment. Likewise, an extinction measurement is a relative method including a reference intensity, i.e., for undisturbed light, the determination of the latter must also be performed with great care.
4. Experimental Setup
Three OPs are evaluated for this publication, based on inlet total pressure and temperatures. A constant inlet total pressure of approximately 784 mbar is used. The temperatures measured were , and . All measurements were accomplished at least three times and on different days. The quality of the experiments is demonstrated by the remarkable reproducibility of the results. The measurement methodology and results are described in this section. All pressure transducers and temperature sensors have been thoroughly calibrated before the start of the experiments presented in this paper. The maximum calculated uncertainty of the inlet pressure transducer, as well as the nozzle traverse, are 0.0342% and 0.113% relative to the measured pressure, respectively.
Measurement Methodology
Initially, in order to bring off a proper light extinction measurement, it is extremely important to capture a clean light intensity that will be used as a reference. Due to the nature of the experiments, the light references are taken once the nozzle section is superheated, such as to ensure that no condensation is present. This makes it possible to measure comparative extinction spectra and hence, to calculate a more realistic droplet distribution. Moreover, as described by Equation (
1), a light extinction measurement is a relative measurement, which infers that without an adequate light reference, the light extinction methodology cannot be used to generate reliable results.
At least two light references were taken for every OP measurement, for every position where a sample was taken. During the experiments, a small but continuous degradation of reference intensity was observed due to the accumulated dirt (corrosion particles) present in the piping system. An assessment of the light references is thoroughly performed by comparing the variation of different wavelengths over time. Only if the change in intensity during measurement is small, the light reference is accepted as valid. On the left side of
Figure 3, an example of the change of the light references during the day is shown. The wavelength analysis is presented over time on the right.
Once the conditions of the steam saturator achieved the desired saturation pressure, wet steam is fed into the nozzle. As the steam stabilizes through the nozzle, the pneumatic-optical traverse frame is traversed axially. Defining “0” as the nozzle throat, the traverse acquires the static pressure and light intensities, starting from a location without condensation (i.e., close to the nozzle inlet, typically 20 mm upstream of the throat) down to the furthest point allowed geometrically by the windows, 120 mm downstream of the throat and back.
Purging is essential for pneumatic measurements. This is performed using pressurized air and applied during the probe relocation only. For every measurement point, purging is enabled for 15 s while the traverse frame changes position. Thereafter purging is switched off and the pressure is taken as stable once its standard deviation is below 0.2%. Afterwards, pneumatic and optical data acquisition takes place and purging starts again.
Reliable data can be interpreted as reproducible data. With the intention to ensure reliability, each OP point was successfully measured at least three times. From the traverse starting point, the system was moved first in steps of 10 mm in regions where no condensation was observed, refining the spatial increments down to 1 mm spatial resolution in the area around condensation onset, thereafter coarsening the intervals again. Besides doing several measurements for each OP during a measurement day, repetition of the OPs on different days was performed.
5. Numerical Setup
All CFD simulations are performed using Ansys CFX 2022 R2. Ansys CFX is capable of performing non-equilibrium two-phase flow simulations (NES) within an Euler–Euler framework. Although, only a single droplet diameter per cell is calculated which leads to a monodispersed droplet distribution, introducing a small but noticeable error in the calculation for condensing nozzle flows (Hughes [
13]). Fluid properties are determined with the IAPWS-97 formulation. To predict the nonequilibrium expansion of steam, additional equations for nucleation and droplet growth are necessary. The nucleation rate
J is calculated based on the classical nucleation theory of Becker [
14] with the non-isothermal correction presented by Kantrowitz [
15]. The droplet growth is modeled using the well-known equation proposed by Young [
16]. For more information on the NES implementation in Ansys CFX, see Gerber et al. [
17] or Gruebel et al. [
18]. Starzmann et al. [
2] suggest using
= 9,
= 0 and
as coefficients within the droplet growth model. However, to be in line with the presented measurement data and to predict the onset of nucleation and droplet growth correctly, the coefficients
and
had to be set to 3 and 2, respectively. A comparison of changing these parameters for one OP is shown at the top of
Figure 4. As the droplet diameters are expected to be smaller than 1
, no slip between the phases is assumed and the droplet temperature can be calculated using an algebraic equation introduced by Gyarmathy [
19]. Note that the error in the NES implementation in CFX reported by Gruebel et al. [
20] is fixed in CFX-release 2020 R2. The SST model is applied to account for turbulence.
For the present work, the nozzle flow has been modeled as a 2D flow only. For this purpose, Ansys ICEM CFD was used to generate quasi-3D block-structured hexahedron meshes with one cell orthogonal to the flow direction. The mesh is refined towards the wall and condensation zone to ensure a sufficient boundary layer resolution with
and to account for strong gradients in the area of condensation, respectively. A grid study was performed with meshes containing 200k, 400k, and 800k nodes with the inlet conditions being a total temperature of
= 100.2
C and a total pressure of
= 783.9 mbar. This operation point is chosen as the low inlet superheating leads to supercritical heat release and consequently strong gradients in the flow which need to be resolved properly by the mesh. The quality of the grids is evaluated using normalized pressure distributions along the centreline. These results are depicted at the bottom of
Figure 4. As can be seen, a grid with at least 400k nodes is necessary to capture the supercritical heat release sufficiently accurately at a moderate computational cost. Thus, all CFD simulations are performed with the medium fine grid.
6. Results and Discussion
The presentation and discussion of the results obtained in the experimental campaign are described in this section. As mentioned in previous sections of this paper, the OPs are defined by three different inlet temperatures, , and , while the inlet total pressure is kept constant at 784 mbar. These operating conditions can also be found in the original work of Barschdorff. CFD results are displayed and compared for each OP.
For each measurement, the pressure distribution, droplet spectra, and droplet number are discussed for both experimental and numerical results. Furthermore, the 99%-confidence interval (i.e., a range of ±3 around the arithmetic mean), inferred from the measurement data and normalized by the respective average pressure is given for each axial position. Lastly, a comparison and discussion between the original and ITSM results is given at the end of this section.
6.1. Inlet Temperature 107.4 C
A total of five runs were successfully achieved in this OP, during two different measurement days. Both the Wilson point location as well as the subsequent pressure rise, its local maximum, and the corresponding locations are successfully reproduced in every run. The results of the pressure distribution along the axis calculated by CFD are in very good agreement with the experimental data. The difference between the experiment and CFD at the local maximum pressure is approximately 3%. The location of condensation onset, as well as the course of pressure along the nozzle match very well. The normalized 99%-confidence interval is below 1% for the vast majority of data.
Experimental reproducibility of the measured droplet size and number is good considering the extremely small droplets generated at this OP. Results are displayed in
Figure 5. From the optical measurements, droplets can be first identified at an axial coordinate of about 45 mm, with a quick droplet growth to about
. For one measurement run, a slightly larger droplet diameter of approximately
was inferred. The droplet number is calculated from the measured approaches to
m
−3 towards the end of the nozzle. The Sauter diameter is overestimated by CFD by a factor of about 1.6 with respect to the experimental results. Consequently, the droplet number is underestimated.
6.2. Inlet Temperature 103.8 C
Six runs in three different days were considered to complete this inlet condition. An interesting phenomenon occurred prior to the onset of condensation between x = 35 mm and x = 45 mm. The pressure remains approximately constant within this interval before the pressure rise, due to the release of latent heat, can be observed. Further downstream, the expansion continues as expected. Extensive tests were performed in order to rule out any influence of the measurement system, such as purging, but this behavior was fully reproducible. CFD results match experimental data generally well along the entire expansion, again with a deviation of roughly 3% with regard to the peak pressure after condensation onset. However, the measured plateau cannot be seen in the numerical results.
The droplet diameters and numbers calculated from spectral extinction data exhibit an even better reproducibility than the previous point with higher inlet temperature. This is due to the slightly larger droplet size. The average droplet size for this operating condition is 0.087
m, with a scatter in a narrow range between 0.065
m and 0.101
m. The droplet number was determined to be approximately
m
−3 with only small deviations between the different runs. It was not possible to properly capture the droplet formation process during the condensation onset, yet extrapolation of the droplet growth indicates that droplet formation initiated at an axial coordinate of ∼30 mm. Similar to the first OP, CFD results deviate from the experimental Sauter diameters by a factor of about 1.5.
Figure 6 displays the results:
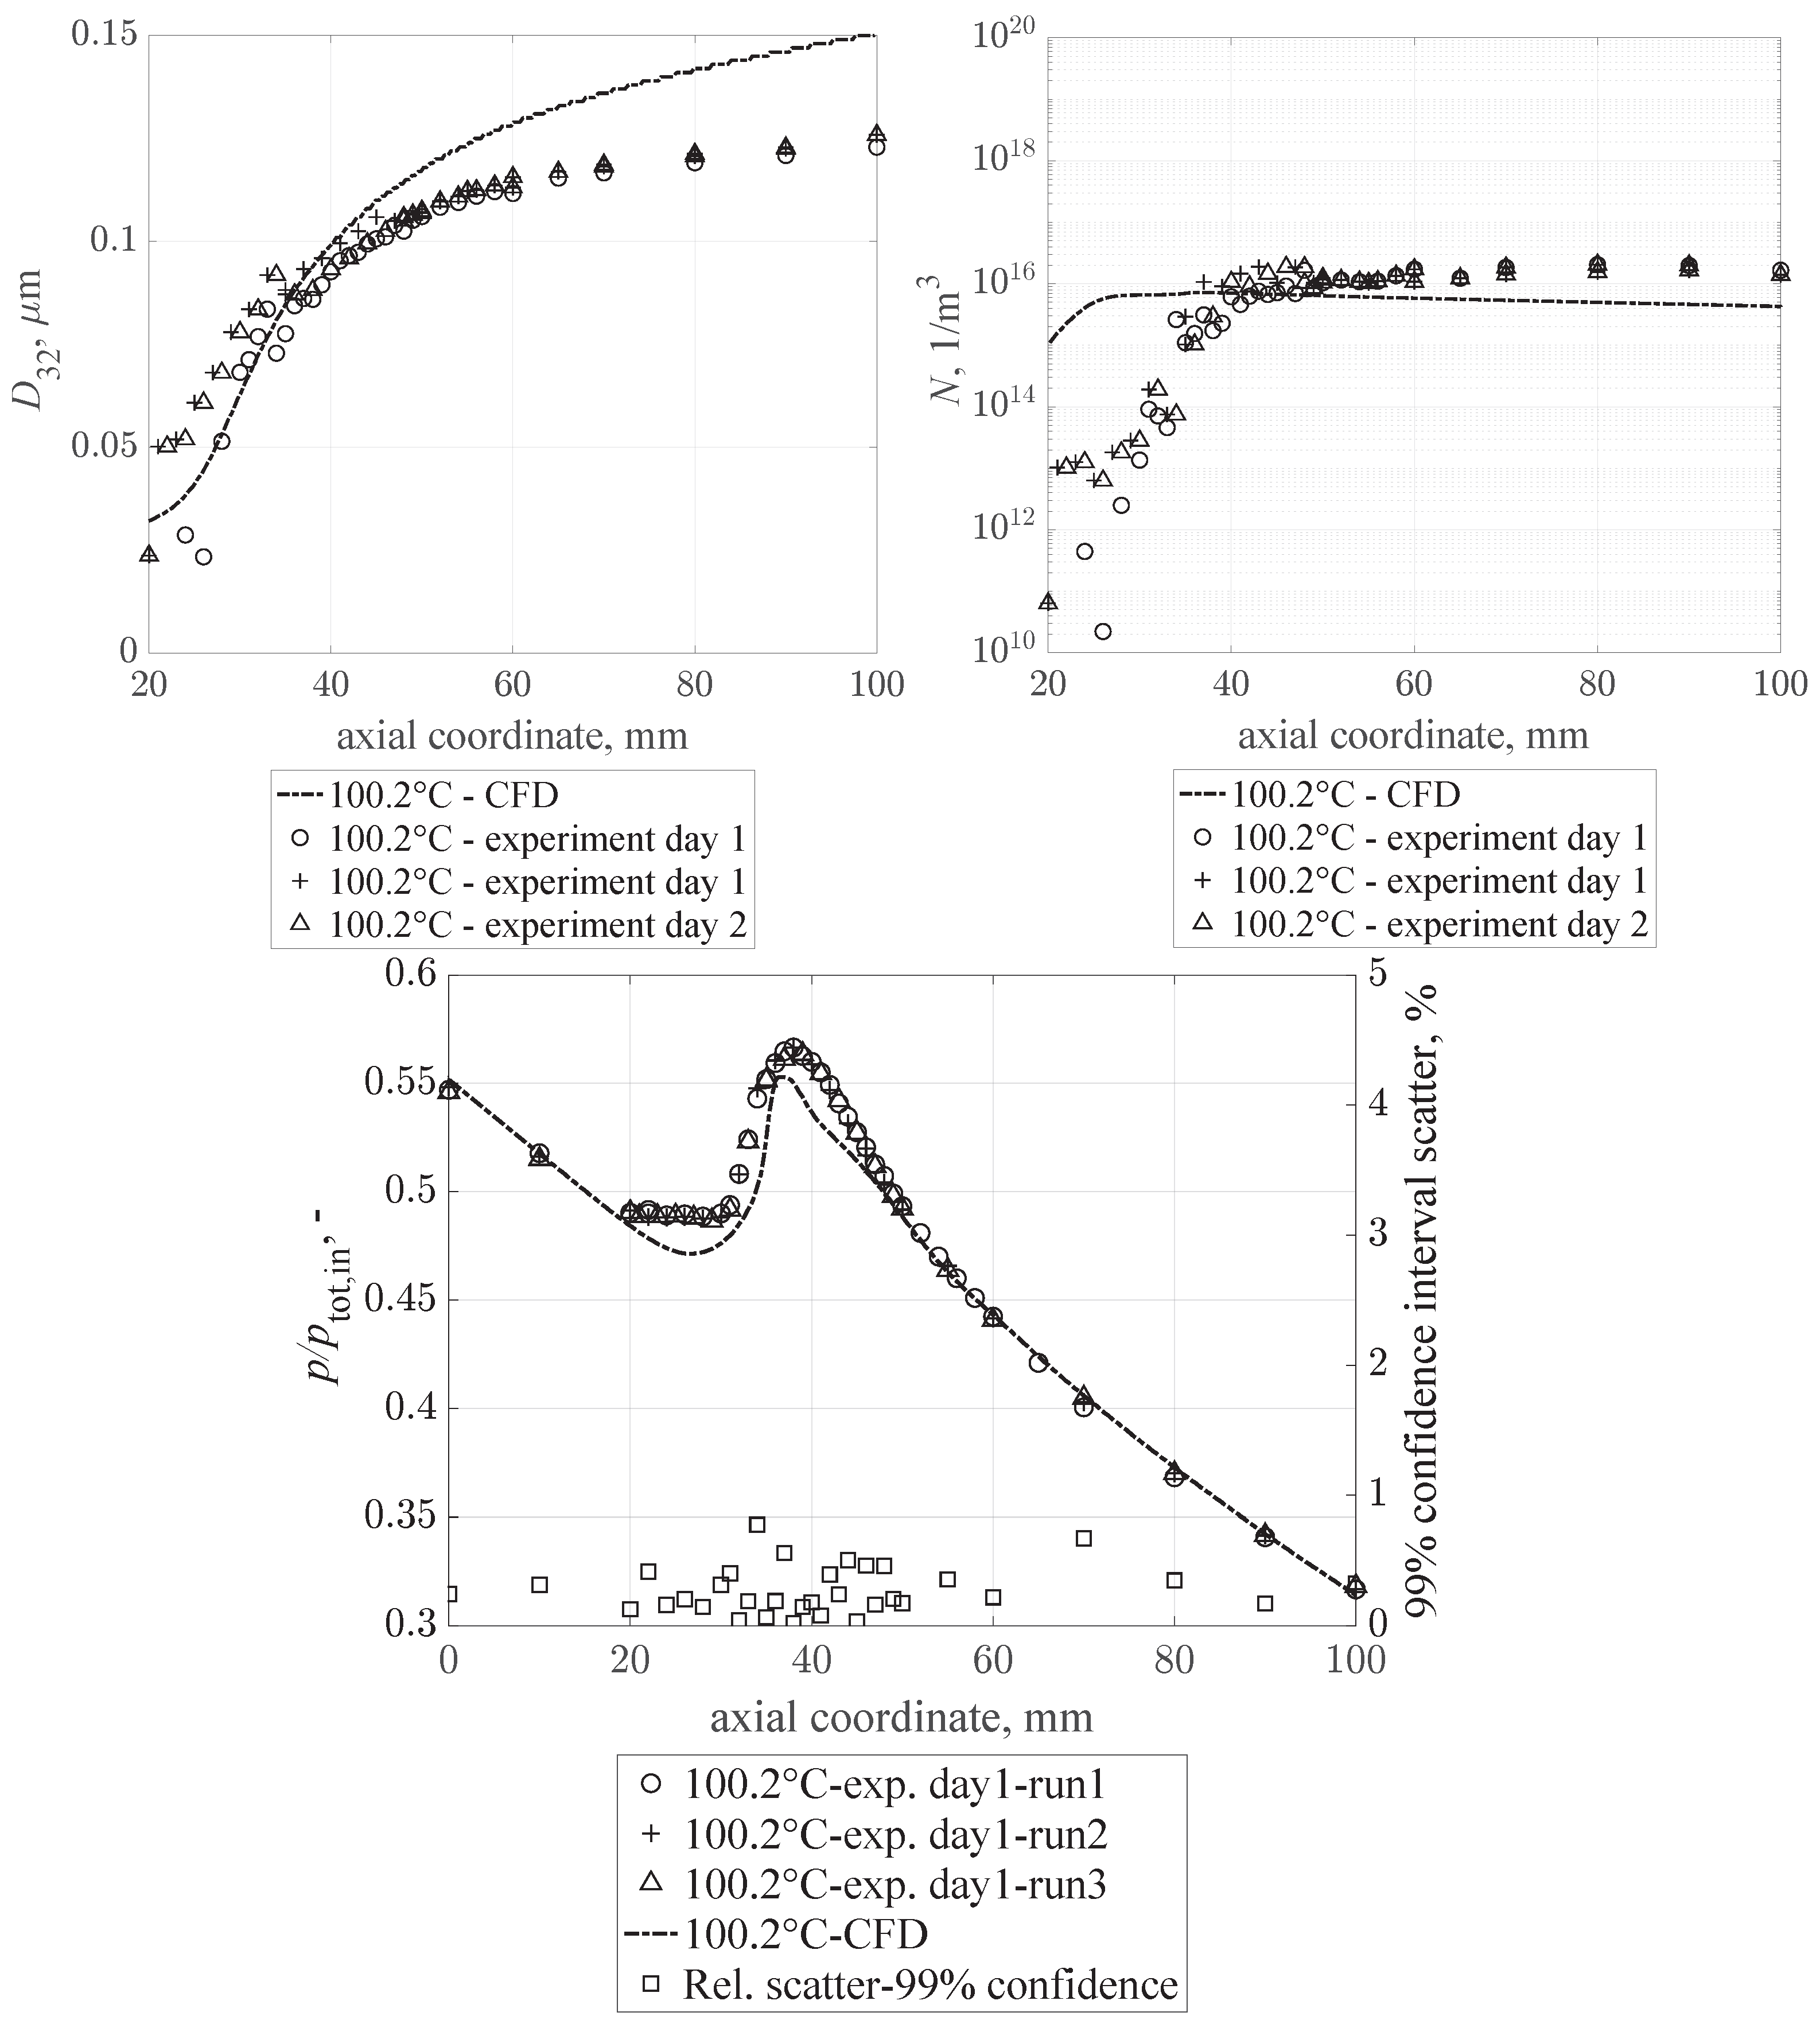
6.3. Inlet Temperature 100.2 C
For the lowest inlet temperature, three runs were fulfilled on two different measurement days. At x = 20 mm, the pressure plateau already described for the previous OP is now even more evident and was reproduced in all runs. Again, this phenomenon was not captured by the CFD simulations.
The reproducibility of the droplet size and number is excellent as can be seen from
Figure 7; droplet formation begins shortly downstream of the throat (this is not shown in
Figure 7, in order to allow comparison to the results obtained at the two other OPs) and massive droplet growth can be observed to occur to about
x = 40 mm. Thereafter, droplets continue to grow steadily towards the nozzle outlet, reaching a droplet diameter of about
. The average Sauter diameter is
with a maximum and minimum value of
and
, respectively. Similarly, the maximum calculated droplet number is approximately
m
−3. Regarding the droplet size from CFD, the agreement is better than for the other operating conditions studied. Sauter diameters are numerically overestimated by a factor of approximately 1.2.
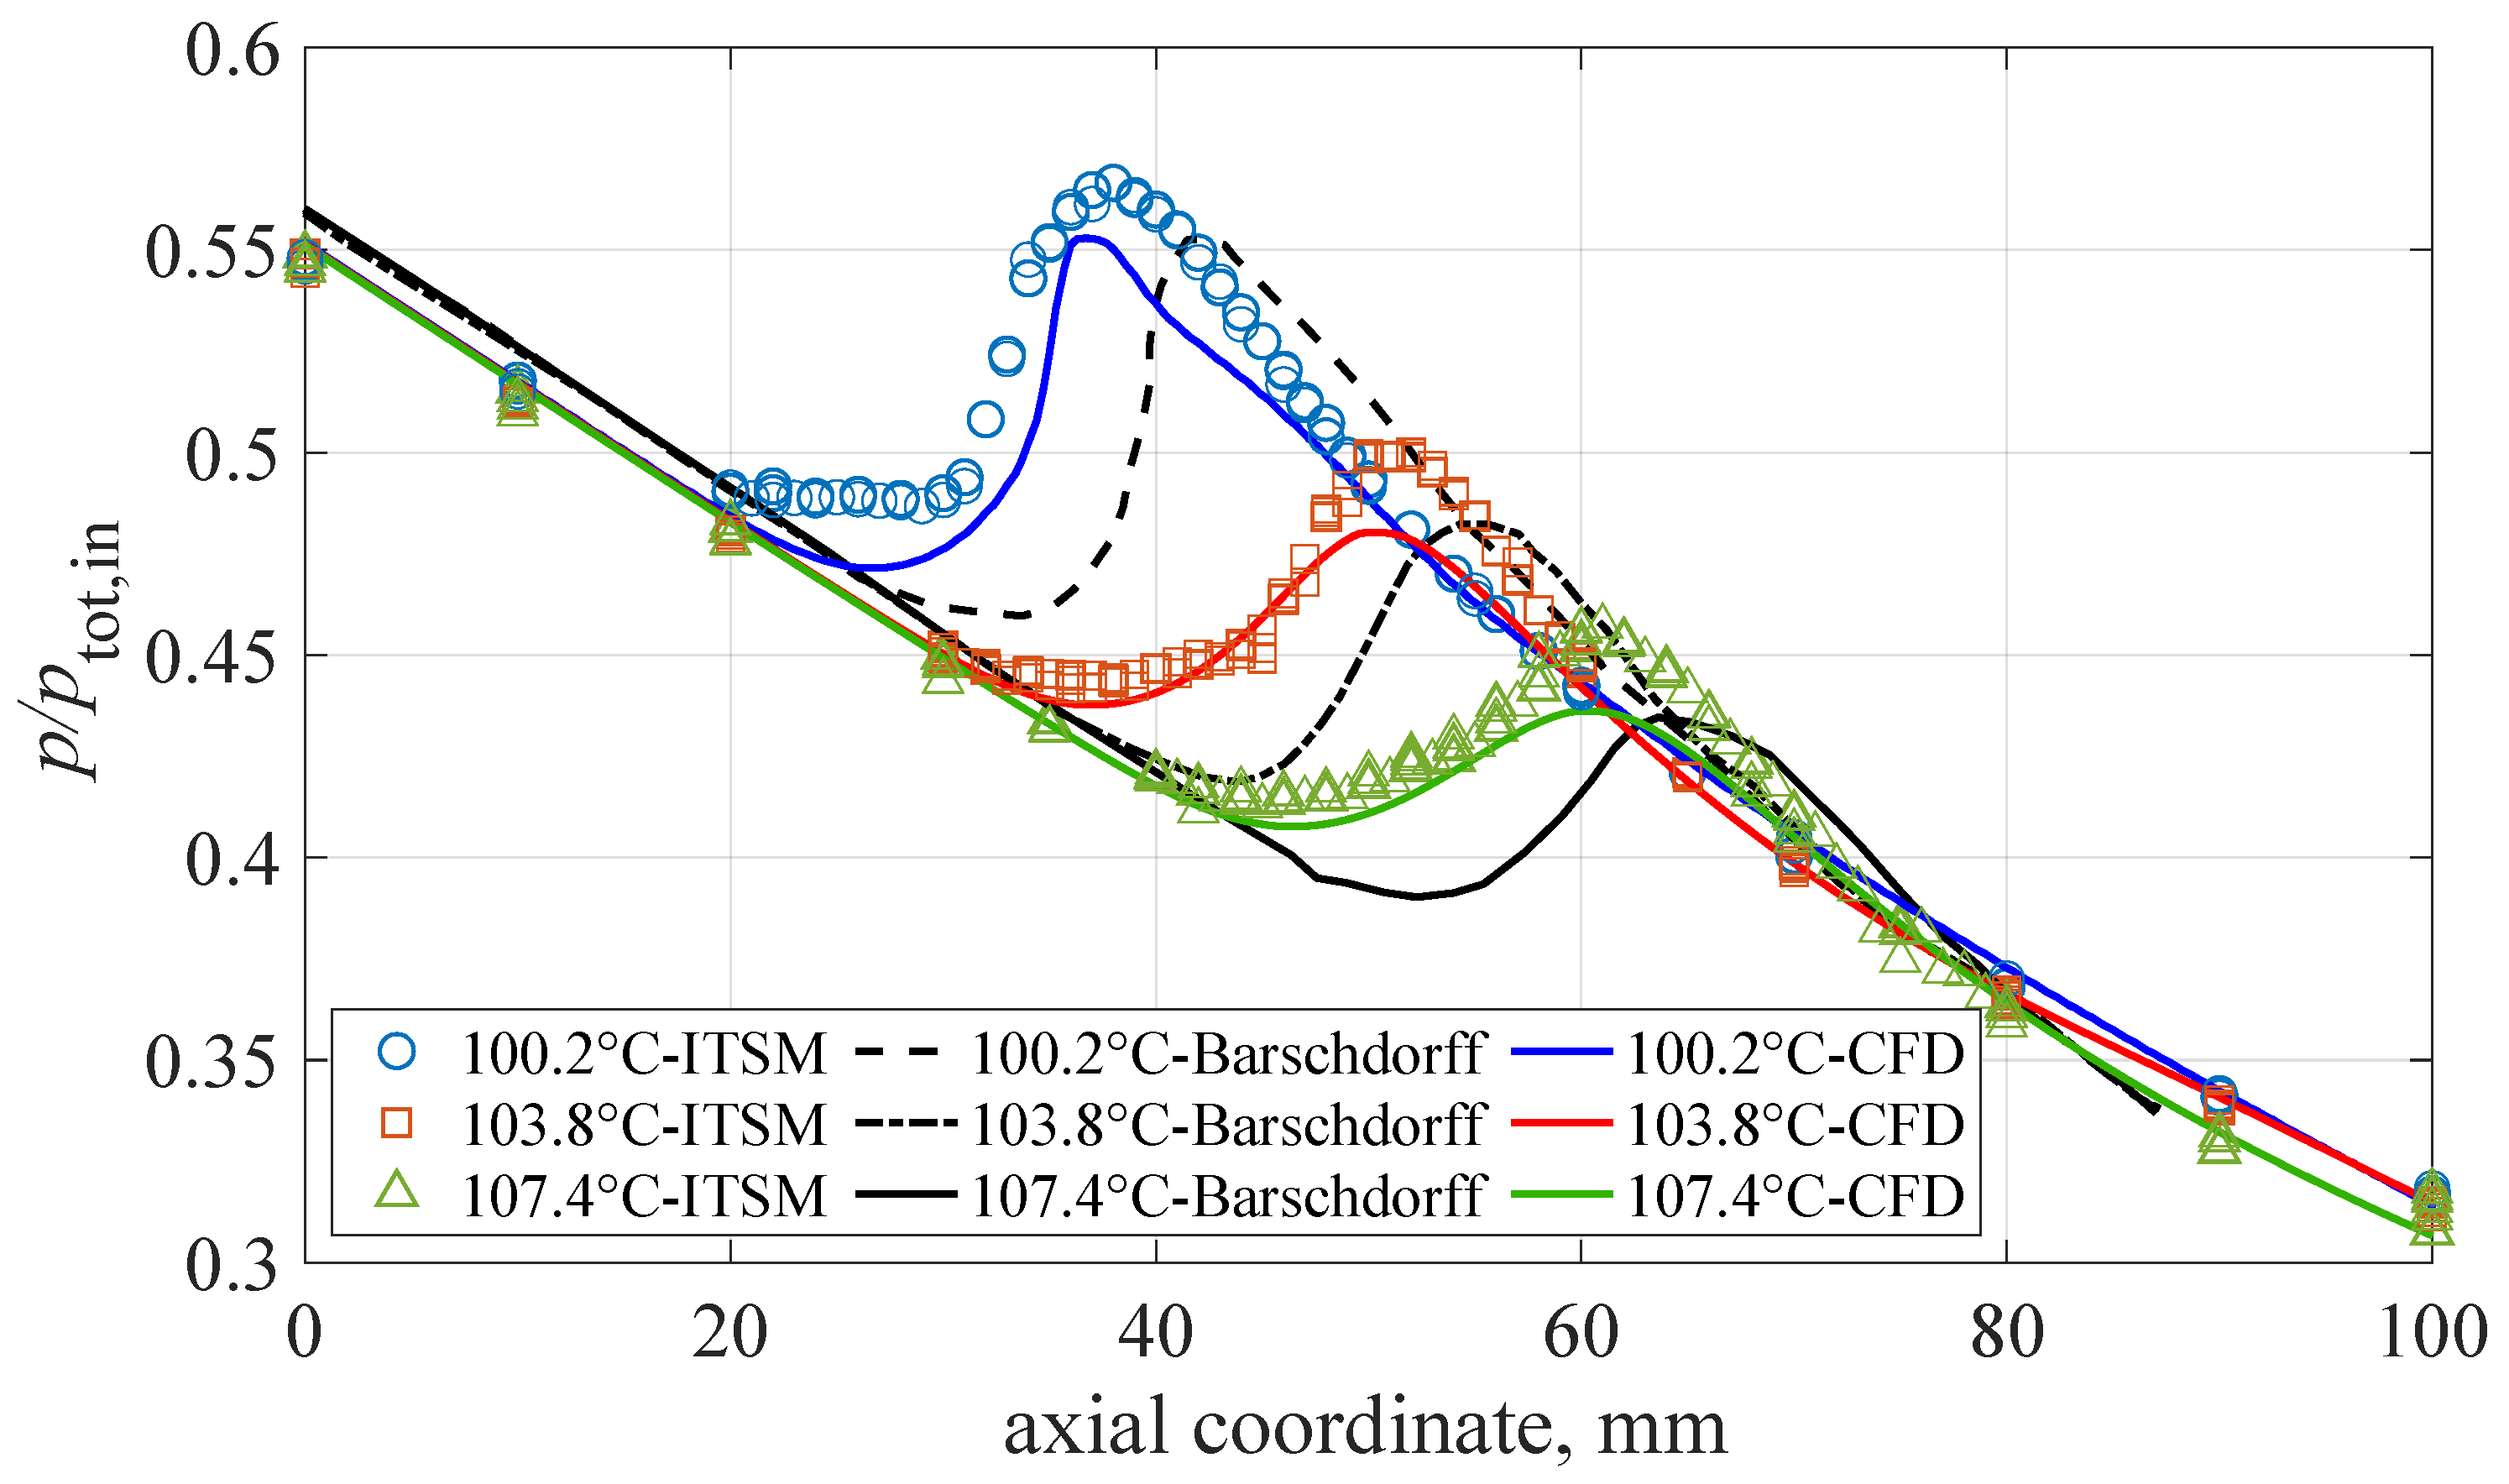
6.4. Comparison of Barschdorff and ITSM Data
It has been found that the pressures measured in the experiments of Barschdorff have a disagreement with respect to the measurements of this paper. There is an offset of approximately 10 mm in the axial coordinate in the pressure peak induced by the release of latent heat during condensation onset, together with a higher peak pressure measured in the current experiments. Moreover, there is a shift of approximately 2% in the pressure ratio already at the throat as can be seen from the data comparison in
Figure 8.
Interestingly, there is a remarkably good match between the experimental data obtained at ITSM and the CFD calculations with regard to the overall course of pressure ratio along the nozzle axis during dry expansion, as well as concerning condensation locations. However, the local maximum pressure point is numerically underestimated by between 2% and 4.5%. It has to be mentioned again that only 2D-CFD simulations have been performed, thus the numerical results are not fully comparable as boundary layer effects on the side walls and 3-D flow aspects, such as corner vortices, were not resolved. Nevertheless, as the nozzle width is 100 mm, such effects are not considered to have a significant impact on the overall flow characteristics.
A possible explanation for the deviations between Barschdorff’s results and those obtained by the recent measurements performed at ITSM could be the different measurement approach. Barschdorff stated in his publication that the pressure probe was slowly but continuously moved along the nozzle axis with no purging flow. Depending on the experimental setup (distance between probe tap and sensor, size and length of the tubing, traversing velocity, etc.), this procedure can lead to a delay as well as a damping of the sensor response which would translate into the phenomena observed here. During the measurements performed at ITSM, the measurements were performed in a steady way, such that a correct measurement is ensured, which is also mirrored by the excellent reproducibility of the data.
Additionally, pressure plateaus have been measured and reproduced at condensation onset for two OPs. This phenomenon is not captured by the simulation, as this was not part of the scope of this work. No droplets have been observed through extinction measurements at the inlet. Corrosion particles in the steam flow are present and can be identified through a small, but continuous degradation of the reference spectra during operation, yet at a very small concentration; thus an impact on condensation can actually be neglected. From measurements at the university power plant, it is inferred that steam purity is very high, so heterogeneous condensation due to salt impurities can also be ruled out. Finally, heterogeneous condensation would result in larger droplets, yet droplet size is consistently smaller than numerically predicted. Furthermore, the hollow tube inside the nozzle could have an impact on the condensation process. In conclusion, this observation definitely requires further detailed investigation. The summary of all results is displayed in
Figure 8.
7. Conclusions
A nozzle featuring the geometry already studied by Barschdorff in 1971 has been installed at the ITSM steam nozzle test rig, where major modifications to the facilities have been performed to ensure exact and stable inlet operating conditions. Based on the experiments performed by Barschdorff, three OPs at a constant total inlet pressure of 784 mbar have been measured, defined by different inlet temperatures: , and . Apart from the pressure measurements already provided by Barschdorff, extinction measurements have been performed by ITSM, which provides droplet spectra. Numerous experiments have been carried out in order to demonstrate the reliability of the measurements through the reproducibility of results. CFD simulations have also been carried out, so as to provide a comprehensive comparison. Thus, for the first time, reliable results are available for a well-defined and frequently used test case and can be used for proper validation of condensation models used in CFD.
With regard to the distribution of the pressure along the nozzle axis, the results of the experiments show a generally very good agreement with CFD calculations. Nevertheless, there is still a significant quantitative gap in comparison to the droplet spectra. At the lowest inlet temperature point, the results show a better overall match. Additionally, pressure plateaus have been measured and reproduced 20 mm downstream of the throat, at condensation onset for two OPs. This phenomenon is not apparent in CFD results. It is inferred that more detailed numerical studies are necessary.
An experimental comparison between Barschdorff’s and ITSM’s results is discussed. There is a disagreement in all pressure measurements, showing an axial shift of the pressure peak induced by condensation of approximately 10 mm, as well as a shift of the pressures during dry expansion, before condensation onset. However, the pneumatic results of the ITSM experiments have a good agreement with the numerical results in this case. One reason for the shift could be the measurement procedure of Barschdorff, i.e., a continuously moving probe, which can result in both damping and alteration of results due to relaxation effects in the tubing between the pressure tap and sensor. It is equally important to remark on the high reproducibility of the experiments performed on different days, as well as the low scatter percentage out of a 99% confidence interval.
Author Contributions
Conceptualization, M.S. and M.E.M.M.; methodology, M.E.M.M., S.S. and M.S.; software, M.S. and M.E.M.M.; validation, M.E.M.M., M.S. and S.S.; formal analysis, M.E.M.M. and M.S.; investigation, M.E.M.M., S.S. and M.S.; resources, D.M.V.; data curation, M.E.M.M. and S.S.; writing—original draft preparation, M.E.M.M.; writing—review and editing, M.E.M.M., S.S., M.S. and D.M.V.; visualization, M.E.M.M.; supervision, M.S.; project administration, D.M.V.; funding acquisition, M.S. and D.M.V. All authors have read and agreed to the published version of the manuscript.
Funding
This research received no external funding.
Institutional Review Board Statement
Not applicable.
Informed Consent Statement
Not applicable.
Data Availability Statement
Data are fully available for sharing upon direct request to the main author of this paper.
Acknowledgments
The authors are grateful with the ITSM laboratory staff, M. Brausewetter and M. Krinn. Without their support, this experimental campaign would have not been possible.
Conflicts of Interest
The authors declare no conflict of interest.
Abbreviations & Nomenclature
The following abbreviations are used in this manuscript:
| Latin Symbols |
| Sauter Diameter [] |
| g | Extinction [] |
| I | Light intensity [] |
| J | Nucleation rate [] |
| l | Optical length [] |
| m | Relative index of refraction [-] |
| N | Droplet number [] |
| Expansion rate [] |
| p | Pressure [] |
| Extinction coefficient [-] |
| T | Temperature [] |
| x | Axial Coordinate [mm] |
| Greek symbols |
| isentropic exponent [-] |
| Wavelength [nm] |
| Abbreviations |
| CFD | computational fluid dynamics |
| NES | non-equilibrium expansion |
| IWSMP | International wet-steam modelling project |
| OP | Operating Point |
| Subscripts |
| total |
| Superscripts |
| * | critical state |
References
- Stodola, A. Chapter 41: Die Unterkühlung bei der Entspannung gesättigten Dampfes. In Dampf- und Gasturbinen; Springer: Berlin/Heidelberg, Germany, 1922. [Google Scholar]
- Starzmann, J.; Hughes, F.R.; Schuster, S.; White, A.J.; Halama, J.; Hric, V.; Kolovratnik, M.; Lee, H.; Sova, L.; Št’astný, M.; et al. Results of the International Wet Steam Modeling Project. Proc. Inst. Mech. Eng. Part A J. Power Energy 2018, 232, 550–570. [Google Scholar] [CrossRef]
- Moses, C.A.; Stein, G.D. On the Growth of Steam Droplets Formed in a Laval Nozzle Using Both Static Pressure and Light Scattering Measurements. Trans. ASME J. Fluids Eng. 1978, 100, 311–322. [Google Scholar] [CrossRef]
- Moore, M.J.; Walters, P.T.; Crane, R.I.; Davidson, B.J. Predicting the fog-drop size in wet-steam turbines. Inst. Mech. Eng. 1973, C37/73, 101–109. [Google Scholar]
- Barschdorff, D. Verlauf der Zustandsgrößen und gasdynamische Zusammenhänge bei der spontanen Kondensation reinen Wasserdampfes in Lavaldüsen. Forsch. Ingenieurwesen 1971, 37, 146–157. [Google Scholar] [CrossRef]
- Gyarmathy, G.; Lesch, F. Fog droplet observations in Laval nozzles and in an experimental turbine. Proc. Instn. Mech. Eng. 1970, 184, 29–36. [Google Scholar] [CrossRef]
- Maqueo Martinez, M.E.; Schippling, S.; Schatz, M.; Vogt, D.M. New supersonic nozzle test-rig used to generate condensing flow test data according to Barschdorff. In Proceedings of the 15th European Turbomachinery Conference Paper n. ETC2023-165, Budapest, Hungary, 24–28 April 2023; Available online: https://www.euroturbo.eu/publications/conference-proceedings-repository/ (accessed on 9 June 2023).
- Renner, M.; Stetter, H.; Cai, X.S. Flow and Wetness Measurements at a Transonic Wind Tunnel with a Slotted Nozzle. In Proceedings of the 12th Symposium on Measuring Techniques for Transonic and Supersonic Flow in Cascades and Turbomachines, Prague, Czech Republic, 12–13 September 1994. [Google Scholar]
- Eberle, T. Entwicklung und Erprobung eines Optischen Messsystems zur Untersuchung von Instationären Nässephänomenen in Düsen und Dampfturbinen. Ph.D. Thesis, ITSM, Universität Stuttgart, Stuttgart, Germany, 2016. [Google Scholar]
- Walters, P.T. Optical measurement of water droplets in wet steam flows. In Proceedings of the IMECHE Conference of Wet Steam 4, Coventry, UK, 3–5 April 1973. [Google Scholar]
- Schatz, M. Bestimmung der Zusammensetzung der Zweiphasen-Strömung in Niederdruck-Dampfturbinen auf der Grundlage der Lichtextinktionsmethode. Ph.D. Thesis, ITSM, Universität Stuttgart, Stuttgart, Germany, 2012. [Google Scholar]
- Eberle, T.; Schatz, M.; Starzmann, J.; Gruebel, M.; Casey, M. Experimental Study of Steam Wetness in a Model Steam Turbine Rig: Presentation of Results and Comparison with Computational Fluid Dynamics Data. Proc. Inst. Mech. Eng. Part A J. Power Energy 2014, 228, 129–142. [Google Scholar]
- Hughes, F.R. Throughflow Methods for Two-Phase Flow in Steam Turbines. Ph.D. Thesis, University of Cambridge, Cambridge, UK, 2016. [Google Scholar]
- Becker, R.; Döring, W. Kinetische Behandlung der Keimbildung in übersättigten Dämpfen. Ann. Phys. 1935, 416, 719–752. [Google Scholar] [CrossRef]
- Kantrowitz, A. Nucleation in Very Rapid Vapor Expansions. J. Chem. Phys. 1951, 19, 1097–1100. [Google Scholar] [CrossRef]
- Young, J.B. The Spontaneous Condensation of Steam in Supersonic Nozzles. Physicochem. Hydrodyn. 1982, 3, 57–82. [Google Scholar]
- Gerber, A.G.; Sigg, R.; Völker, L.; Casey, M.V.; Sürken, N. Predictions of Nonequilibrium Phase Transition in a Model Low Pressure Steam Turbine. In Proceedings of the 7th European Conference on Turbomachinery, Athens, Greece, 5–9 March 2007. [Google Scholar]
- Grübel, M.; Grübel, M.; Starzmann, J.; Schatz, M.; Eberle, T.; Vogt, D.M.; Sieverding, F. Two-Phase Flow Modeling and Measurements in Low-Pressure Turbines—Part 1: Numerical Validation of Wet Steam Models and Turbine Modeling. Trans. ASME J. Eng. Gas Turb. Power 2015, 137, 042602. [Google Scholar] [CrossRef]
- Gyarmathy, G. Grundlagen einer Theorie der Naßdampfturbine. Ph.D. Thesis, ETH Zürich, Zürich, Switzerland, 1962. [Google Scholar]
- Grübel, M.; Starzmann, J.; Schatz, M.; Vogt, D.M. Modelling of Condensing Steam Flows in Laval Nozzles with ANSYS CFX. Proc. Inst. Mech. Eng. Part A J. Power Energy 2018, 232, 571–575. [Google Scholar] [CrossRef]
| Disclaimer/Publisher’s Note: The statements, opinions and data contained in all publications are solely those of the individual author(s) and contributor(s) and not of MDPI and/or the editor(s). MDPI and/or the editor(s) disclaim responsibility for any injury to people or property resulting from any ideas, methods, instructions or products referred to in the content. |
© 2023 by the authors. Licensee MDPI, Basel, Switzerland. This article is an open access article distributed under the terms and conditions of the Creative Commons Attribution (CC BY-NC-ND) license (https://creativecommons.org/licenses/by-nc-nd/4.0/).

 ,
, 


