Article

Impact of Unsteady Wakes on the Secondary Flows of a High-Speed Low-Pressure Turbine Cascade †

1
Turbomachinery and Propulsion Department, von Kàrmàn Institute for Fluid Dynamics, Chaussée de Waterloo 72, 1640 Rhode-St-Genèse, Belgium
2
Departement of Aerospace & Mechanical Engineering, University of Liège, Allée de la Découverte 9, 4000 Liège, Belgium
*
Author to whom correspondence should be addressed.
This manuscript is an extended version of the ETC2023-290 meeting paper published in the Proceedings of the 15th European Turbomachinery Conference, Budapest, Hungary, 24–28 April 2023.
Int. J. Turbomach. Propuls. Power 2023, 8(4), 36; https://doi.org/10.3390/ijtpp8040036
Submission received: 13 June 2023 / Revised: 27 June 2023 / Accepted: 20 September 2023 / Published: 22 September 2023

Abstract

:
The aerodynamics of a high-speed low-pressure turbine (LPT) cascade were investigated under steady and unsteady inlet flows. The tests were performed at outlet Mach (M) and Reynolds numbers ( R e ) of 0.90 and 70k, respectively. Unsteady wakes were simulated by means of a wake generator equipped with bars. A bar reduced frequency ( f + ) of ∼0.95 was used for the unsteady case. The inlet flow field was characterized in terms of the total pressure profile and incidence. The blade aerodynamics at midspan and the secondary flow region were investigated by means of pneumatic taps and hot-film sensors. The latter provided a novel view into the impact of the secondary flows on the heat transfer topology on the blade suction side (SS). The cascade performance was quantified in terms of the outlet flow angle and losses by means of a directional multi-hole probe. The results report the phase-averaged impact of unsteady wakes on the secondary flow structures in an open test case high-speed LPT geometry.

1. Introduction

The Ultra-High Bypass Ratio Geared Turbofan (GTF) enables a reduction in the specific fuel consumption (SFC), LPT stage count and weight comparatively to modern turbofans [1]. The latter can account for as much as one third of the overall engine weight [2]. Torre et al. [3] performed a thorough investigation of a high-speed LPT in a transonic rotating rig. Their work also highlighted the difference in the operating conditions between conventional and high-speed LPTs. Due to the increase in the rotational velocity of the low-pressure spool imposed by the gearbox, the LPT operates at transonic exit Mach numbers ( M o u t > 0.80 ) in combination with the low Reynolds numbers encountered during a cruising regime [4]. The combination of these flow regimes has been highlighted as one of the main challenges in the development of transonic LPTs for GTFs [5,6].
Models describing the secondary flow structures in turbine cascades have been detailed in previous works [7,8,9,10]. The secondary flows impact the aerodynamic loss as the core of the composing structures is characterized by a deficit in kinetic energy that is dissipated as the structures convey downstream of the turbine cascade [11]. The relative weight of the secondary loss in comparison to the profile loss depends on factors such as the operating condition, blade aspect ratio, blade turning, and pitch-to-chord ratio, among others. However, the secondary loss can account for as much as 50% of the aerodynamic losses [8]. Satta et al. [12] reported a secondary loss in excess of 40% of the overall losses in their investigations of a high-lift LPT blade tested in a low-speed linear cascade under a steady incoming flow.
A wide range of investigations on secondary flows have been performed under a steady inlet flow in a linear cascade configuration. The impact of the on- and off-design point (Mach, Reynolds, tapper, incidence, etc.) on the secondary flows has been investigated in the scope of both LPTs [13,14,15,16,17] and high-pressure turbines [18,19,20].
The investigation of turbine geometries in a steady state environment misses the inherently unsteady flow field encountered in real machines. A description of the complex interactions between blade rows was provided by Behr [21]. In a real engine environment, there is a combined interaction of the potential flow fields of adjacent rows [22], the interaction of secondary flows and wakes shed from upstream rows on the downstream ones, and leakage flows [23]. This highlights the relevance of linear cascade testing in isolating flow phenomena or geometry features of interest and obtaining measurements in a configuration that is favorable for the development of numerical tools and flow models and the validation of CFD codes. Infantino et al. [24] highlighted the importance of accounting for the impact of unsteadiness in the early design procedures of LPT blades.
The literature dealing with the impact of unsteady wakes on the secondary flow development at engine-relevant Mach and Reynolds numbers with engine-matched wake reduced frequency is scarce. Volino et al. [25] experimentally investigated the impact of incoming wakes on an HPT passage in a low-speed linear cascade under low reduced frequency unsteady wakes. An increase of 80% and 36% in the loss at midspan and endwall vicinity was reported as unsteady wakes were introduced, respectively. Additionally, a periodic reduction in the strength of the secondary loss structures was reported. Ciorciari et al. [26] conducted a combined numerical and experimental study on the impact of unsteady wakes of low reduced frequency on the aerodynamics of the T106 blade at engine-relevant Mach and Reynolds numbers. The wakes were simulated by means of cylindrical bars. An increasingly periodic reduction in the under/overturning for the unsteady case was found with increasing wake reduced frequency. Moreover, bar-induced wake vortices caused a periodic reduction in the intensity of the passage vortex in addition to the trailing shed vortex. Satta et al. [12] experimentally investigated the impact of unsteady wakes with varying Reynolds numbers on a high-lift LPT blade tested in a low-speed linear cascade at an engine-representative Reynolds number. The wakes resulted in a shift in the secondary flow structures towards the endwall regardless of the Reynolds number. The total losses were found to decrease for the case without unsteady wakes, being Reynolds number insensitive. Infantino et al. [24] experimentally investigated the effect of unsteady wakes in a high-lift LPT in a low-speed linear cascade tested at an engine-relevant Reynolds number. The periodic distortion and attenuation of the passage vortex, as well as a shift towards the endwall, was detected for the case with unsteady wakes.
This research develops the recent study on the characterization of the steady aerodynamics of an open-access transonic LPT geometry tested at its on- and off-design operating point in a linear cascade environment at engine-relevant Mach and Reynolds numbers [17]. This work aims at extending the existing literature on the impact of unsteady wakes on a high-speed LPT operating at engine-relevant Mach and Reynolds numbers and wake reduced frequency typically encountered in geared turbofan LPTs. The experimental data described in this paper can be obtained at the open access repository https://doi.org/10.5281/zenodo.7264761 (accessed on 19 September 2023).
This manuscript corresponds to the paper published in the proceedings of the 15th European Turbomachinery Conference [27].

2. Experimental Apparatus

2.1. SPLEEN Test Case

This work was performed in the framework of the EU project SPLEEN (Secondary and Leakage Flow Effects in High-SPeed Low-PrEssurE TurbiNes). A thorough description of the test case can be found in Simonassi et al. [28]. Cascade C1 is characteristic of a rotor hub geometry of a geared LPT. The linear cascade consisted of 23 blades with a span of 165 mm. This investigation was conducted at an outlet Mach (M) and Reynolds ( R e ) of 0.90 and 70k. A freestream turbulence intensity of ∼2.40% was fixed by a passive turbulence grid. The recreation of periodic wakes was performed by means of a spoked-wheel-type wake generator equipped with 96 cylindrical bars with 1.00 mm diameter. The bar diameter was selected to be similar to the trailing edge thickness to produce an airfoil representative wake of the blade being tested [29]. The bar tip reaches ∼73% of the cascade span when parallel to the central blade leading edge (LE). The distance between the midspan and the center of rotation is 480 mm. The wake reduced frequency ( f + ) at the midspan is ∼0.95, which results in a flow coefficient of 0.80. Detailed information on the wake generator assembly can be found in a document presenting the hardware of the test case present in the open access repository https://doi.org/10.5281/zenodo.7264761 (accessed on 27 June 2023).

2.2. The VKI S-1/C High-Speed Linear Cascade

The measurements were conducted in the transonic, low Reynolds linear cascade S-1/C at the Von Karman Institute. An illustration of the wind tunnel is shown in Figure 1a. The VKI S-1/C consists of a continuous closed-loop rig driven by a 615 kW 13-stage axial compressor. A heat exchanger ensures that the temperature of the flow supplied to the test section is near ambient. The mass flow is regulated by means of the compressor rotational speed and a bypass valve. A minimum absolute pressure of ∼5000 Pa during tests is achievable by means of a vacuum pump. The cascade test section sits in the upper-left elbow of the loop in Figure 1a. The homogeneity of the inlet flow to the test section is controlled via wire meshes and honeycombs. The outlet Mach and Reynolds numbers can be set independently, hence enabling the testing of a wide extent of LPT-relevant conditions. The test section was subjected to a major refurbishment to enable the test of quasi 3D flows with the presence of periodic wakes and purge flows [28].

2.3. Experimental Methodology

Figure 1b shows the meridional view of the test section, the measurement planes, and the cascade reference system. The pitchwise coordinate (y) increases towards passages out of the figure plane. The operating point was defined in terms of the outlet isentropic Reynolds and Mach number. The Reynolds number was based on the true chord and outlet flow conditions. These were monitored with the total pressure and temperature upstream and static pressure downstream of the cascade. The cascade total temperature was measured by means of a type-K thermocouple at Plane Ref. This plane sat sufficiently far upstream so that the reference instrumentation was not impacted by the cascade potential flow field. The work produced by the WG bars was neglected and therefore it was assumed that the total temperature across the cascade was conserved. The uncertainty associated with the temperature was ± 0.518 K (20:1). The total pressure at Plane 01 was computed based on a correlation built to estimate the total pressure loss across the TG and WG at different operating points. The inlet total pressure was estimated with a total uncertainty of ± 31 Pa (20:1). The static pressure at the outlet was measured by means of static pressure taps at Plane 06. The taps were connected to a Scanivalve MPS4264—1 PSI, resulting in a total uncertainty of ± 29 Pa (20:1) for the measured pressure.
The inlet flow fields of total pressure and incidence were mapped by means of a pneumatic Cobra five-hole probe (C5HP) traversed at Plane 02, placed at 0.50 axial chords ( C a x ) upstream of LE. The probe ports were connected to a Scanivalve MPS4264—1 PSI and aerodynamic calibration coefficients were used to determine the local total and static pressures, as well as the yaw and pitch angles in the probe head reference system. The total uncertainty in the total and static pressures was ± 37 Pa (20:1), ± 29 Pa (20:1), respectively. The flow angles in the probe reference system were transformed into flow angles in the cascade reference system to compute the incidence (i) with an expanded uncertainty of ± 0.24 (20:1).
The cascade losses and deviation were obtained with a pneumatic L-shaped five-hole probe (L5HP) at Plane 06 ( 0.50 C a x downstream of TE). The measurement chain and data reduction methodology were the same as for the C5HP. The losses were characterized with the kinetic energy loss coefficient ( ξ ) and the flow deviation was computed as the difference between the primary flow direction ( β ) and the outlet metallic angle. The latter had an expanded uncertainty of ± 0.0019 (20:1) and ± 0.24 (20:1), respectively.
The impact of the unsteady wakes on the phase-averaged blade pressure side (PS) and suction side (SS) aerodynamics was investigated by means of static pressure taps. The blade taps were displaced in the spanwise direction to obtain a map of the blade loading from the endwall until midspan. The pressure taps were connected to a Scanivalve MPS4264—1 PSI. The blade tap measurements and freestream total pressure were coupled to compute the local isentropic Mach number with an expanded uncertainty of ± 0.005 (20:1).
Lastly, Senflex® surface hot films (HF) were used to map the impact of the secondary flows on the blade SS. The nickel sensor elements and the cooper leads were printed on a Upilex S polyamide film®. The sensor geometry had a sensing element with a width, thickness, and length of 0.1016 mm × 0.0002 mm × 1.4478 mm, respectively. A cold resistance of ∼9.9 Ω was measured at 20 °C. The leads had a width, thickness, and length of 0.60 mm × 0.0127 mm × 215 mm, respectively. The total number of sensors, equally spaced by 2 mm, on the SS and PS was 31 and 21, respectively. The HF array, designed in-house and produced by Tao Systems, was wrapped around the LE and cut to fit a recess on the blade SS and PS to avoid steps on the blade profile.
The sensors were operated under constant temperature anemometry. A Dantec Streamline Pro chassis with six Wheatstone bridges was used to sample all the sensors. The acquisition of the sensors was made in groups of five or six sensors for which the distance between operating sensors was maximized to reduce heating effects from neighboring sensors. The sensors were operated with an overheat ratio of 0.50, which resulted in an over-temperature of ∼60 K. Prior to testing, a square-wave test was performed to maximize the bandwidth of the sensors. A minimum bandwidth of 50 KHz was found between all the sensors. The signals were acquired with a sampling frequency of 1.2 MHz for 3 s. An analogue anti-aliasing low-pass filter of 100 KHz was used during the test, and the signals were further digitally filtered at 8 KHz and 30 KHz during the data reduction for the steady and unsteady cases, respectively.
Hot films exploit the established relationship between convective heat flux and wall shear stress ( τ w ) as proposed by Bellhouse and Schultz [30]. The practical calibration of HF is troublesome and time-consuming since the sensors must be calibrated for a known boundary layer (BL) state. For this reason, the HF technique is often used to estimate the quasi-wall shear stress ( τ q ), which still provides information on the state of the BL and does not require the calibration of the sensors [31,32,33]. According to Hodson [34] and Hodson et al. [35], the quasi-wall shear stress is defined as
τ w τ q = E 2 E ¯ 0 2 E ¯ 0 2 3
where E is the measured bridge voltage during the experiment and E ¯ 0 2 is the average value of the square of the bridge voltage without incoming flow, with the same sensor-to-gas temperature difference. The latter is obtained after the rig shutdown, so the gas temperatures during the test and flow-off are similar. The temperature decreases as soon as the rig’s compressor is slowed down and the flow stops circulating. Thus, the sensor-to-gas temperature difference during the test and the flow-off phases becomes different. For this reason, the flow-off voltage is compensated for with the correction proposed by Hultmark and Smits [36]:
E c o r r = E × T S T 0 T S T a
where T S is the sensor temperature during operation, T a is the gas temperature during the measurement, and T 0 is the reference temperature to which the over-temperature resultant from the overheat ratio is applied during the setup.

3. Results

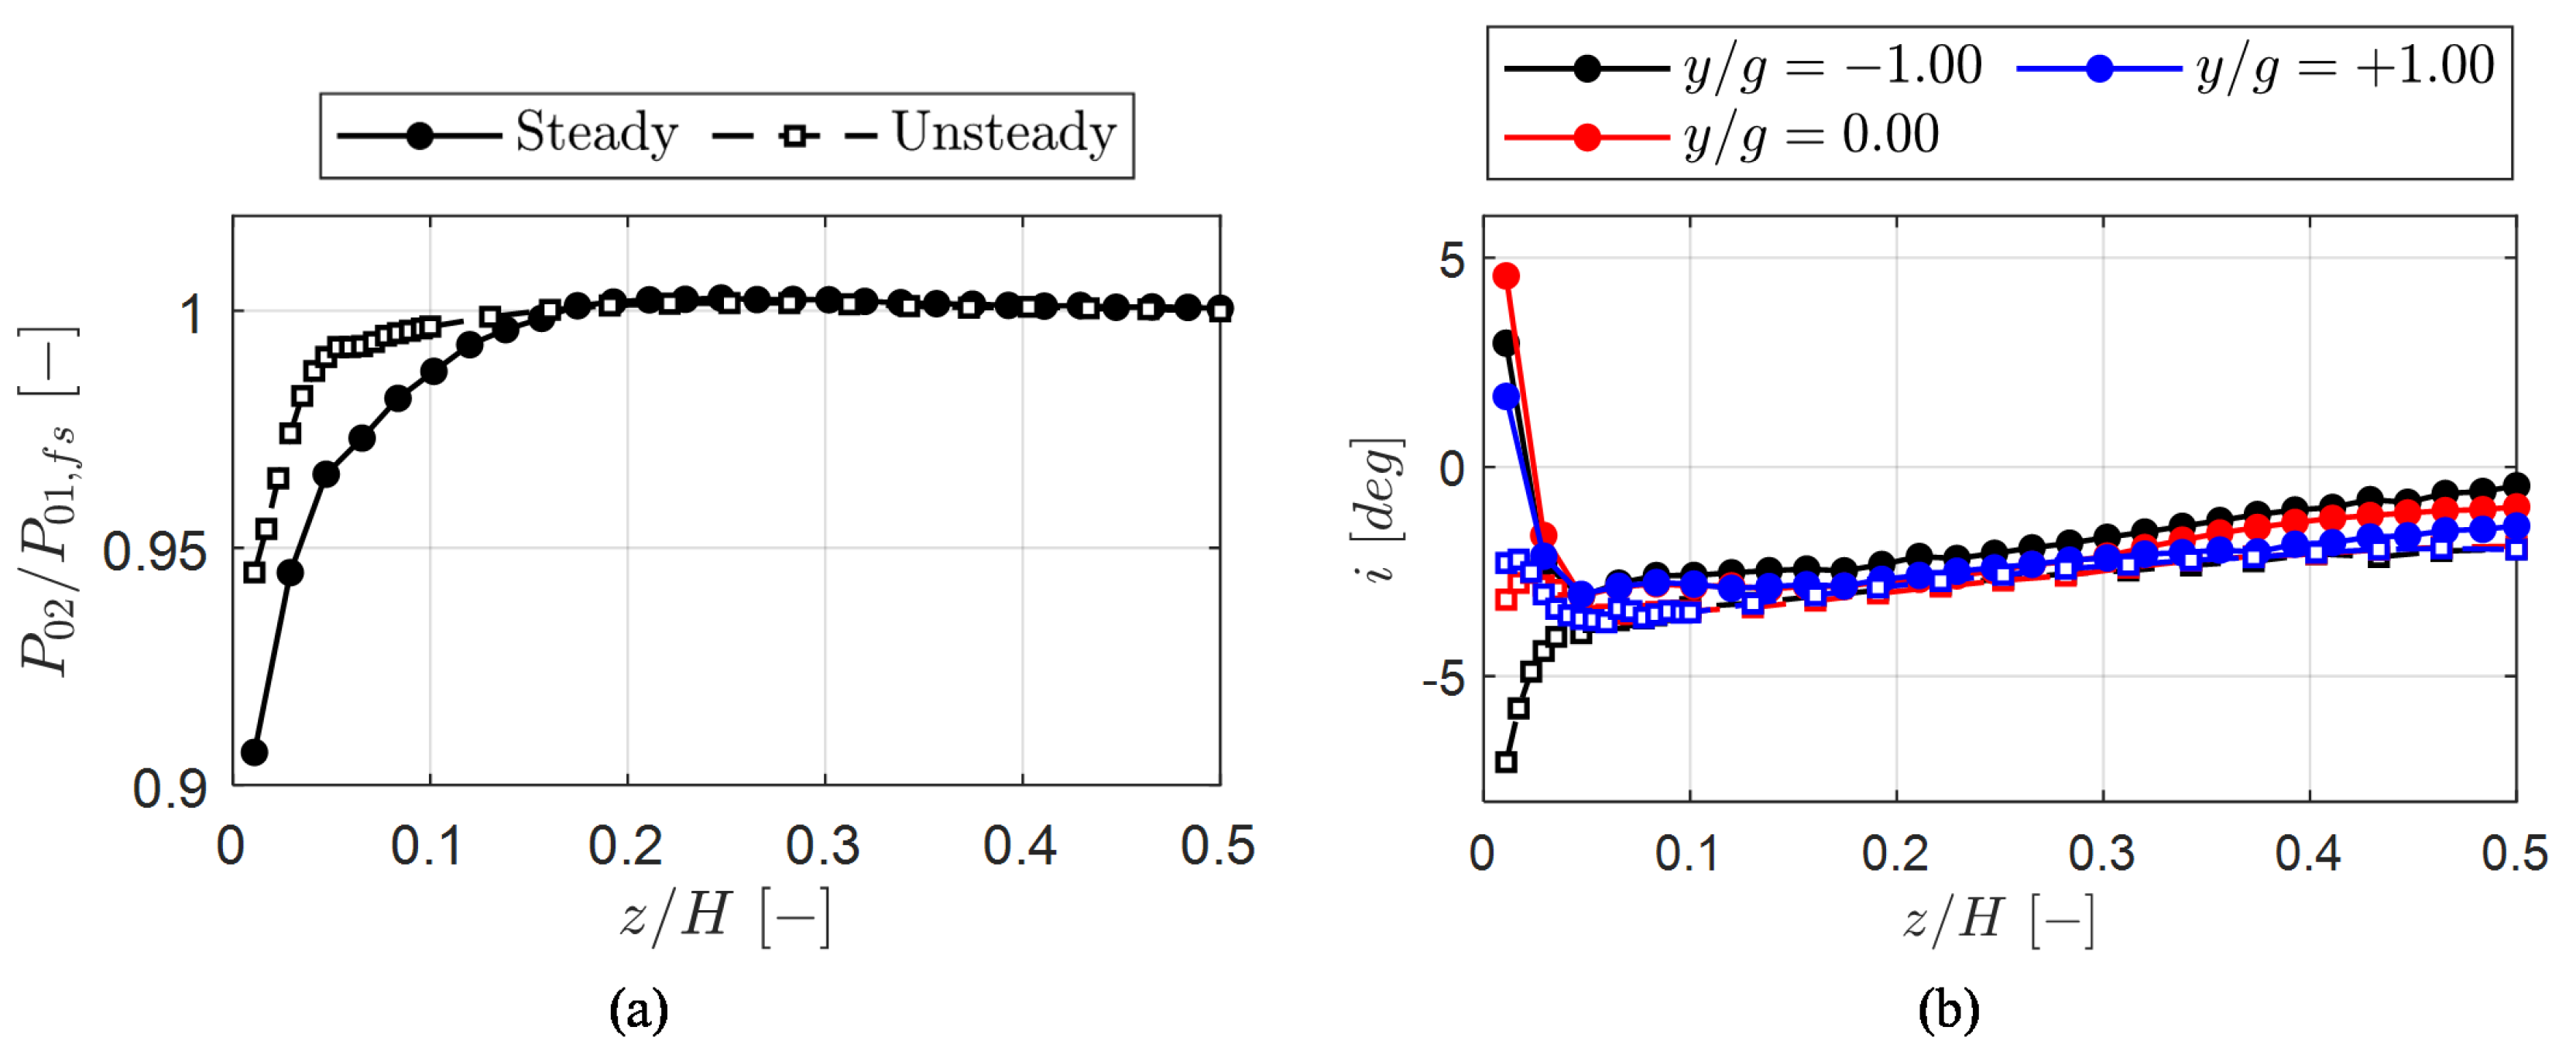
3.1. Inlet Flow Characterization

The inlet pressure profiles alongside the incidence measured at Plane 02 with the C5HP for the steady and unsteady cases are displayed in Figure 2. The spanwise total pressure is normalized by the freestream total pressure ( P 01 , f s ). The inlet total pressure profile in Figure 2a is displayed at a single normalized pitch location ( y / g = 0 ) since the pitch-to-pitch variation is within ± 0.0003 and ± 0.0010 at midspan for the steady and unsteady flow cases, respectively. The pitch-to-pitch variation increases in the boundary layer region to ± 0.0050 and ± 0.0121 at the closest measured point to the endwall ( z / H = 1.09 % ). The steady inlet pressure profile differs significantly from the unsteady one. An overshoot in the normalized total pressure above unity around z / H = 0.20 resulted in a negative value of the momentum thickness. The pitchwise averaged displacement thickness of the inlet profiles was computed to be 1.90 mm and 1.03 mm for the steady and unsteady cases, respectively. The decreased boundary layer thickness for the unsteady case resulted from the fact that the wake generator slot used to introduce the bars into the test section caused a restart of the boundary layer. The inlet boundary layer kinetic energy deficit was accounted for in the computation of the cascade losses.
Figure 2b displays the spanwise distribution of the inlet incidence for three pitchwise locations for the steady (solid line with solid markers) and unsteady flow (dashed line with hollow markers) cases. The cascade sits on a rotatable endwall that can be adjusted to vary the incidence angle. Both in the absence and presence of wakes, the cascade was rotated to attempt the alignment of the flow angle with the inlet metal angle. The rotation of the cascade with unsteady wakes considered the additional flow turning induced by the bars [37,38]. However, the alignment of the cascade with the incoming flow was not possible since the measured incidence varied when the cascade angle was adjusted. This is attributed to the blockage caused by a boundary layer lip mounted in the test section that is parallel to the blade LE plane, and therefore angled to the incoming flow. In this work, a mean inlet incidence of 0.89 and 2.00 was measured at midspan for the steady and unsteady cases, respectively. In addition, a pitch-to-pitch variation of ± 0.44 at midspan was measured for the steady case, whereas no variation was observed for the unsteady flow case.
The topology of the spanwise distributions at different pitchwise locations is similar for the steady flow case: the incidence decreases from midspan towards z / H = 4.27 % . The incidence increases from the latter span until the endwall, reaching positive values at the point measured closest to the endwall. The pitch-to-pitch variation in the incidence reaches ± 1.44 near the endwall.
On the other hand, the spanwise profiles vary significantly for the unsteady case. From midpsan towards the endwall, a decrease in the incidence is observable. However, close to z / H = 5.00 % , the behavior of the profiles varies with the pitchwise location. At y / g = 0 , the incidence remains practically unaltered. For pitchwise locations towards negative passages, the incidence decreases between z / H = 5.00 % and the endwall. The opposite happens for the positive passages. The near-endwall variation is within ± 2.38 . The pitch-to-pitch variations are attributed to flow ingress/egress from the wake generator slot since the rotating wake generator imposes a spanwise velocity component to the flow when the bar leaves or re-enters the slot.

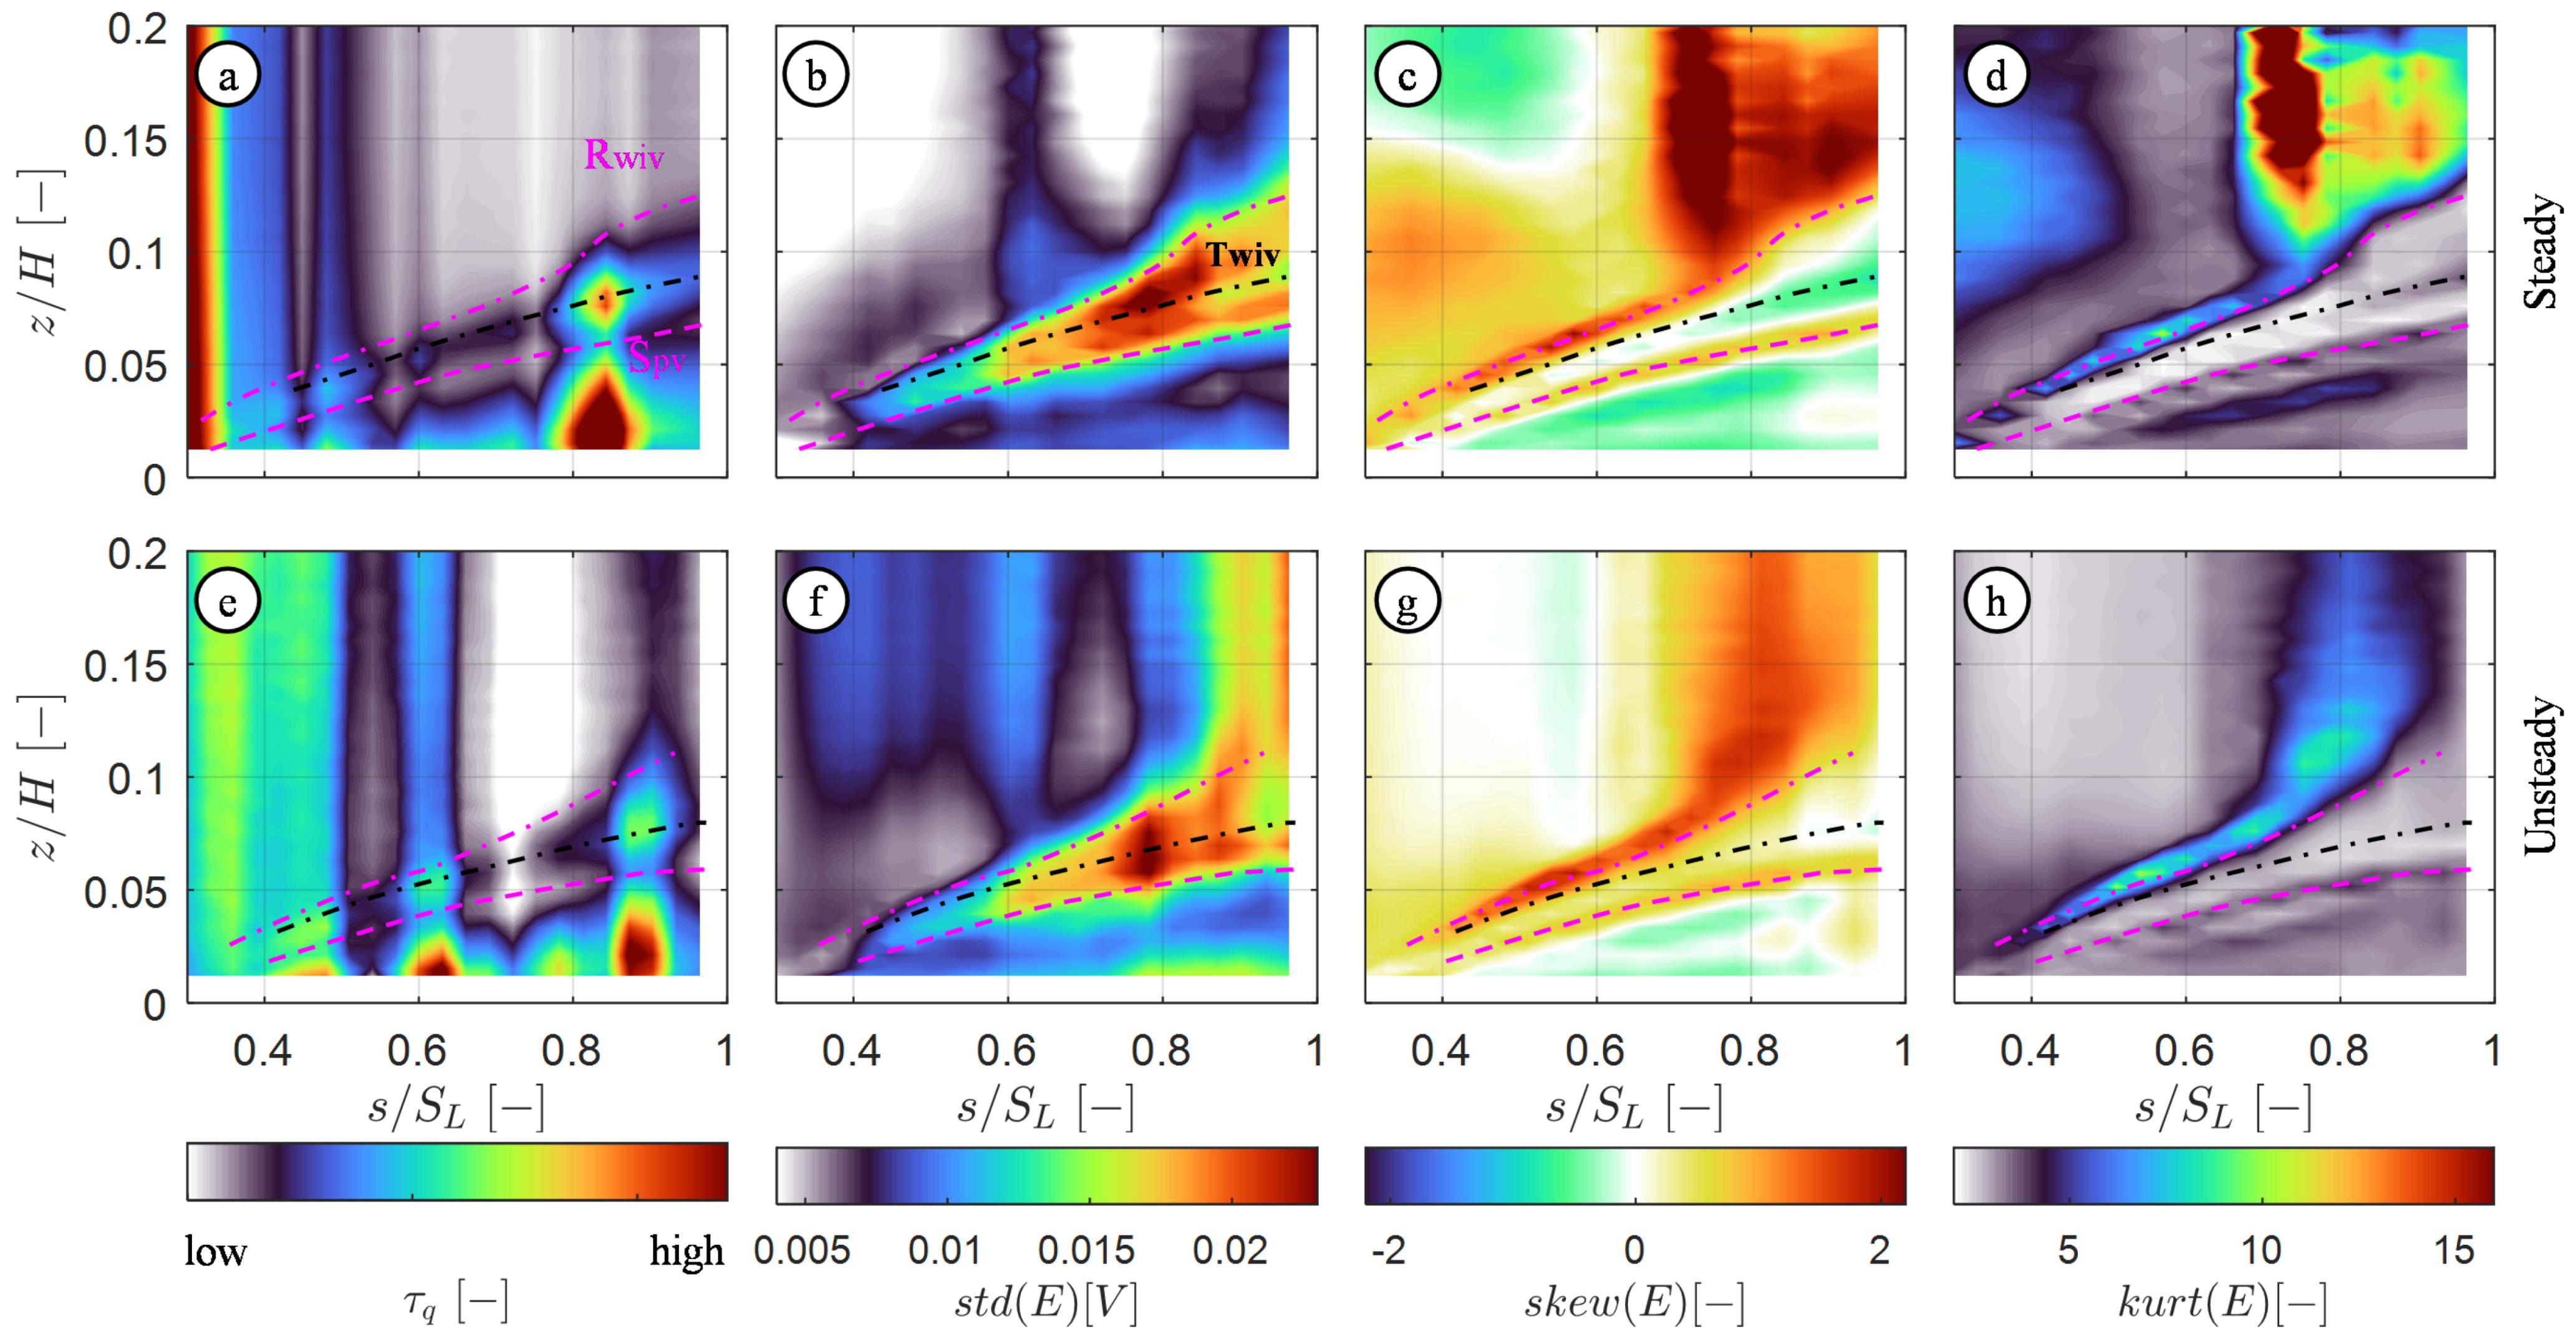
3.2. Blade Aerodynamics

The isentropic Mach number distributions along the blade PS and SS surface distance (s) normalized by the surface length ( S L ) measured at spanwise locations ranging from the vicinity of the endwall to midpsan are displayed in Figure 3. A zoomed-in region of the rear portion of the SS ( s / S L [ 0.50 , 1.00 ] ) is also displayed in the secondary plot axes (red). All the way from the endwall to midspan, the impact of the different inlet incidences between the steady and unsteady cases can be perceived as a local reduction in the blade loading near the LE on the SS. The PS is not largely impacted by the presence of wakes in a region sufficiently away from the endwall, as displayed in Figure 3c,d. However, closer to the endwall (Figure 3a,b), a decrease in the isentropic Mach number ranging from the LE to as far as s / S L 0.60 takes place. Even though the steady and unsteady cases were tested at the same time-averaged operating point, the velocity peak suffers an increase in magnitude and a shift towards the TE throughout the whole span. Outside of the secondary flow region (Figure 3d), the wakes impact the transition process in the rear portion of the SS. A thorough analysis of the 2D aerodynamics with and without unsteady wakes at on- and off-design conditions can be found in Simonassi et al. [39].
Figure 4 displays the skin friction coefficient, C f , distributed on the blade SS obtained with a 3D fully turbulent Reynolds-averaged Navier–Stokes (RANS) CFD computation that is not commented on in this work. A description of the impact of the secondary flow structures on the skin friction is necessary to comment on the results obtained with the surface-mounted HF. In Figure 4a, the viscous stress streamlines are superimposed to the contour of C f . In the vicinity of the endwall ( z / H < 0.01 ), a suction side corner vortex (CV) can be identified in a region of low C f . Above the latter, the passage vortex (PV) is superimposed to a region of high C f , with a peak in the vicinity corner vortex at s / S L 0.50 . Above the passage vortex, a wall-induced vortex (WIV) with opposite rotation to the PV is present. The latter results from the impingement of the pressure side leg of the horseshoe vortex on the blade SS. Although not as high as for the region of the PV, an increase in the skin friction takes place in the path of the WIV.
Figure 4b displays again the contour of C f . In addition, the separation/reattachment lines (pink lines) resultant from the interaction of the vortices are superimposed. The reattachment line of the CV ( R C V ) is the closest to the endwall, with the separation line of the passage ( S P V ) and reattachment line of the wall-induced vortex ( R W I V ) following. The separation lines sit in regions of decreased C f , most likely resulting from the deflection of the vortices’ velocity streamlines away from the surface because of their interaction near the separation line. Between the separation lines, trajectories (black lines) of increased C f are identified for the passage vortex ( T P V ) and wall-induced vortex ( T W I V ).
The aforementioned methodology was applied to the HF measurements. The corner vortex separation line could not be captured due to the instrumentation resolution in the vicinity of the endwall. The passage vortex trajectory cannot be clearly identified from the quasi-wall shear stress contours displayed in Figure 5a,e. However, the trajectory of the WIV is recognizable as the path of maximum local τ q . The statistical moments (standard deviation, skewness, and kurtosis) of the HF bridge voltage are displayed in Figure 5 as well. The trajectory of the WIV is coupled with the high standard deviation of the bridge voltage and therefore heat flux fluctuations ( E 2 R S ( Q ˙ F + Q ˙ S ) ). Additionally, the trajectory is marked by a low skewness level. The separation line of the passage vortex is identified by a path of low τ q . The region between S P V and the endwall contains high levels of τ q due to the presence of the PV. The S P V limits a region above which there is a rapid increase in the standard deviation level up to the maximum that is coincident with the trajectory of the WIV. The separation line of the passage vortex is superimposed with a path of increased skewness and kurtosis. The identification of the reattachment line of the WIV is troublesome due to the fact that this structure interacts with an open separation at the rear part of the blade SS that is not captured by the fully turbulent RANS computation. In the scope of this work, the latter is identified as a path of increased skewness above the T W I V and above which there is a sharp rise in the kurtosis level. This line reflects the upper limit of the region of increased standard deviation induced by the WIV.
Based on the current identification, the differences between the steady and unsteady cases are mainly driven by the extent of the regions since very similar topologies exist for both. The region impacted by the PV is broader for the steady case due to the thicker inlet boundary layer, which is the main contributor to this vortex.

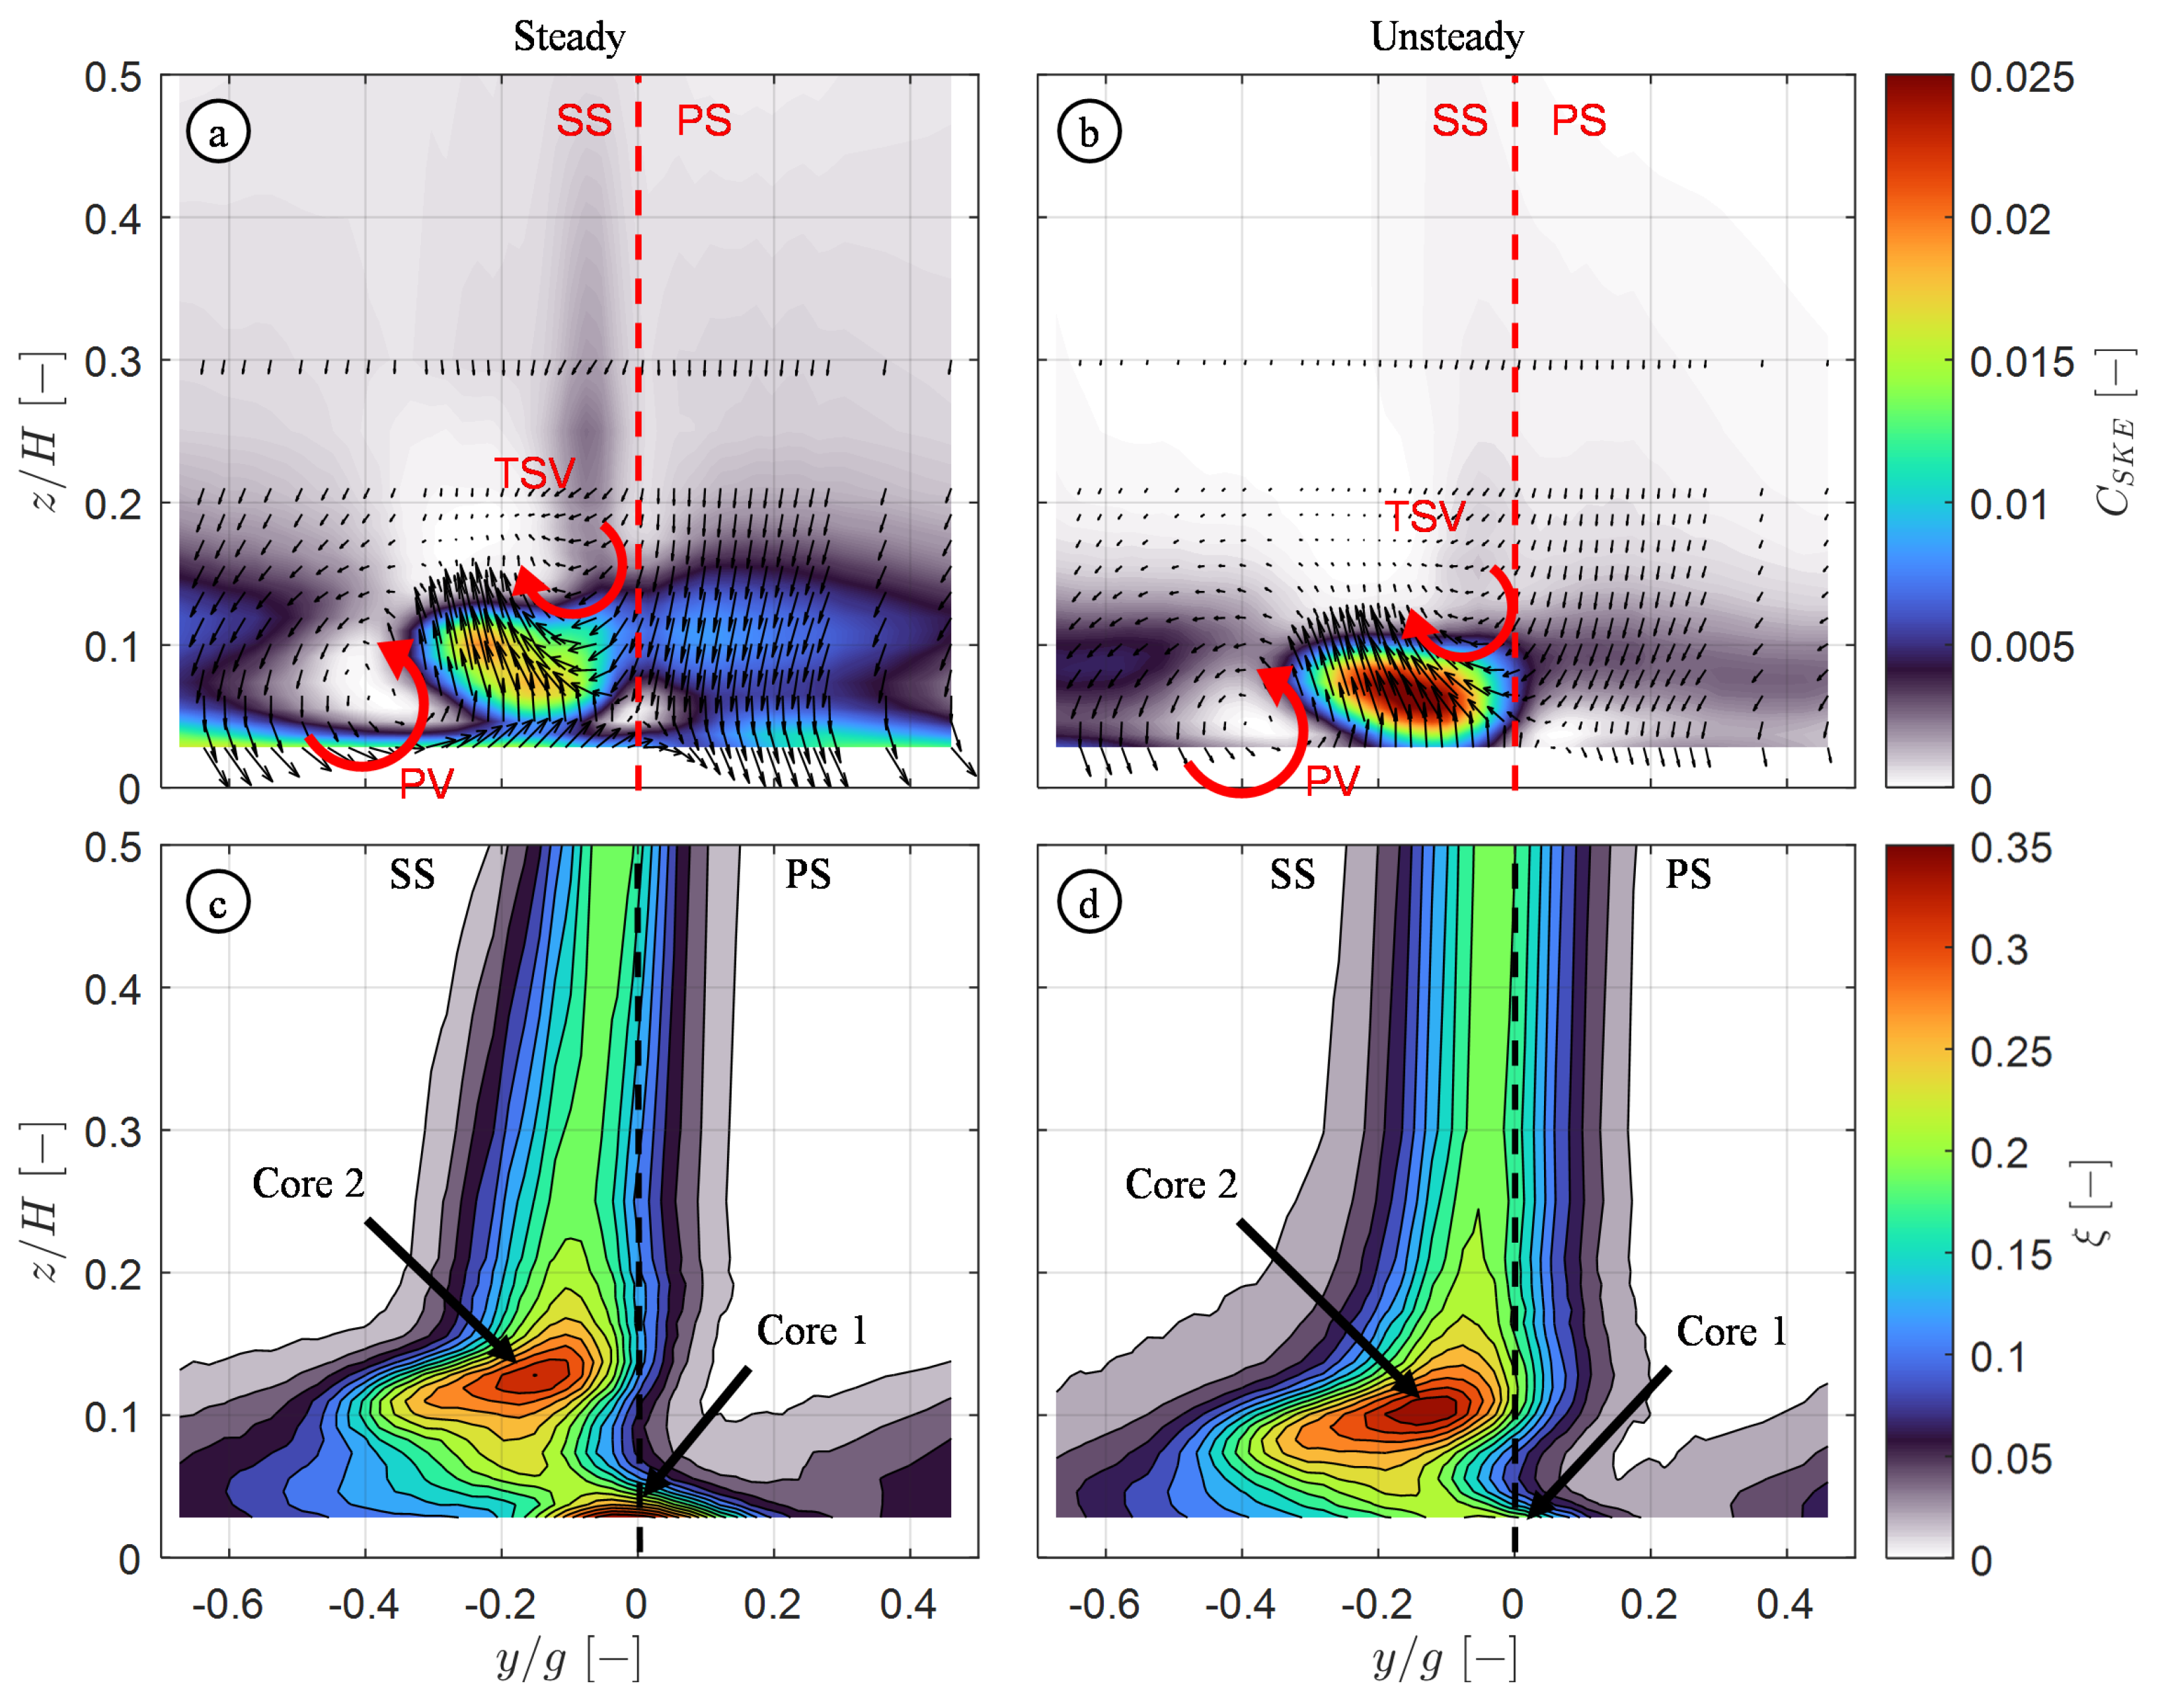
3.3. Outlet Flow Field

The field of secondary kinetic energy and the kinetic energy loss coefficient measured at Plane 06 with the L5HP for the steady and unsteady cases are presented in Figure 6. The computation of the kinetic energy loss coefficient is reported in Lopes et al. [17], with the particularity of assuming a constant inlet total pressure field instead of the inlet pressure profile. The secondary kinetic energy (SKE) coefficient is computed as
C S K E = ρ v y , s e c 2 + v z , s e c 2 γ P 6 M 6 , i s 2
where the secondary velocity vectors are projected in a plane perpendicular to the local flow direction. The secondary velocity vectors are superimposed to the contour of C S K E . The vectors are displayed for each of the three measurement points to enhance the C S K E visibility. The dissipation of SKE is a major contributor to the secondary loss in turbine cascades [40,41,42]. The C S K E (Figure 6a,b) displays significantly larger extent near the endwall for the steady flow case. Up to z / H = 0.05 , a region of increased C S K E that extends across the full pitchwise domain is present for the steady case. In addition, a second region of high C S K E exists between y / g = 0.00 and y / g = + 0.50 . These regions are both likely resultant from the thicker inlet boundary layer in the steady case that results in a stronger passage vortex system. A common region with high C S K E exists for both cases. Constrained between y / g = 0.33 and 0.05 , this region results from the interaction of the counter-clockwise rotating PV and the trailing shed vortex (TSV) that has clockwise motion in this frame of reference. The TSV results from a reduction in the blade loading towards the endwall [43]. It is likely that this clockwise rotating structure also comprises the WIV.
The increased C S K E is due to the increased shear between the secondary flow structures. The magnitude of the secondary velocity vectors increases significantly because of this interaction. A shift in the secondary flow structures towards the endwall and blade SS is present due to the thinner inlet boundary layer measured for the unsteady case. The magnitude of the core of high C S K E increases by ∼36% with the introduction of unsteady wakes. The shift in the secondary flow structures towards the endwall can also be perceived from the kinetic energy loss coefficient (Figure 6c,d). The introduction of unsteady wakes promotes an increase in the extent of the two-dimensional flow, as seen by the “straight wake” compared to the angled wake present in the steady case. Two major loss cores are identified for both the steady and unsteady cases. Core 1 sits in the vicinity of the endwall and is mainly attributed to the SS corner vortex. The location of Core 2 is related to the region of increased C S K E , highlighting that this core comprises losses due to the PV and TSV. In addition to the migration of Core 2 towards the endwall, its magnitude increases by ∼6% when unsteady wakes are introduced.

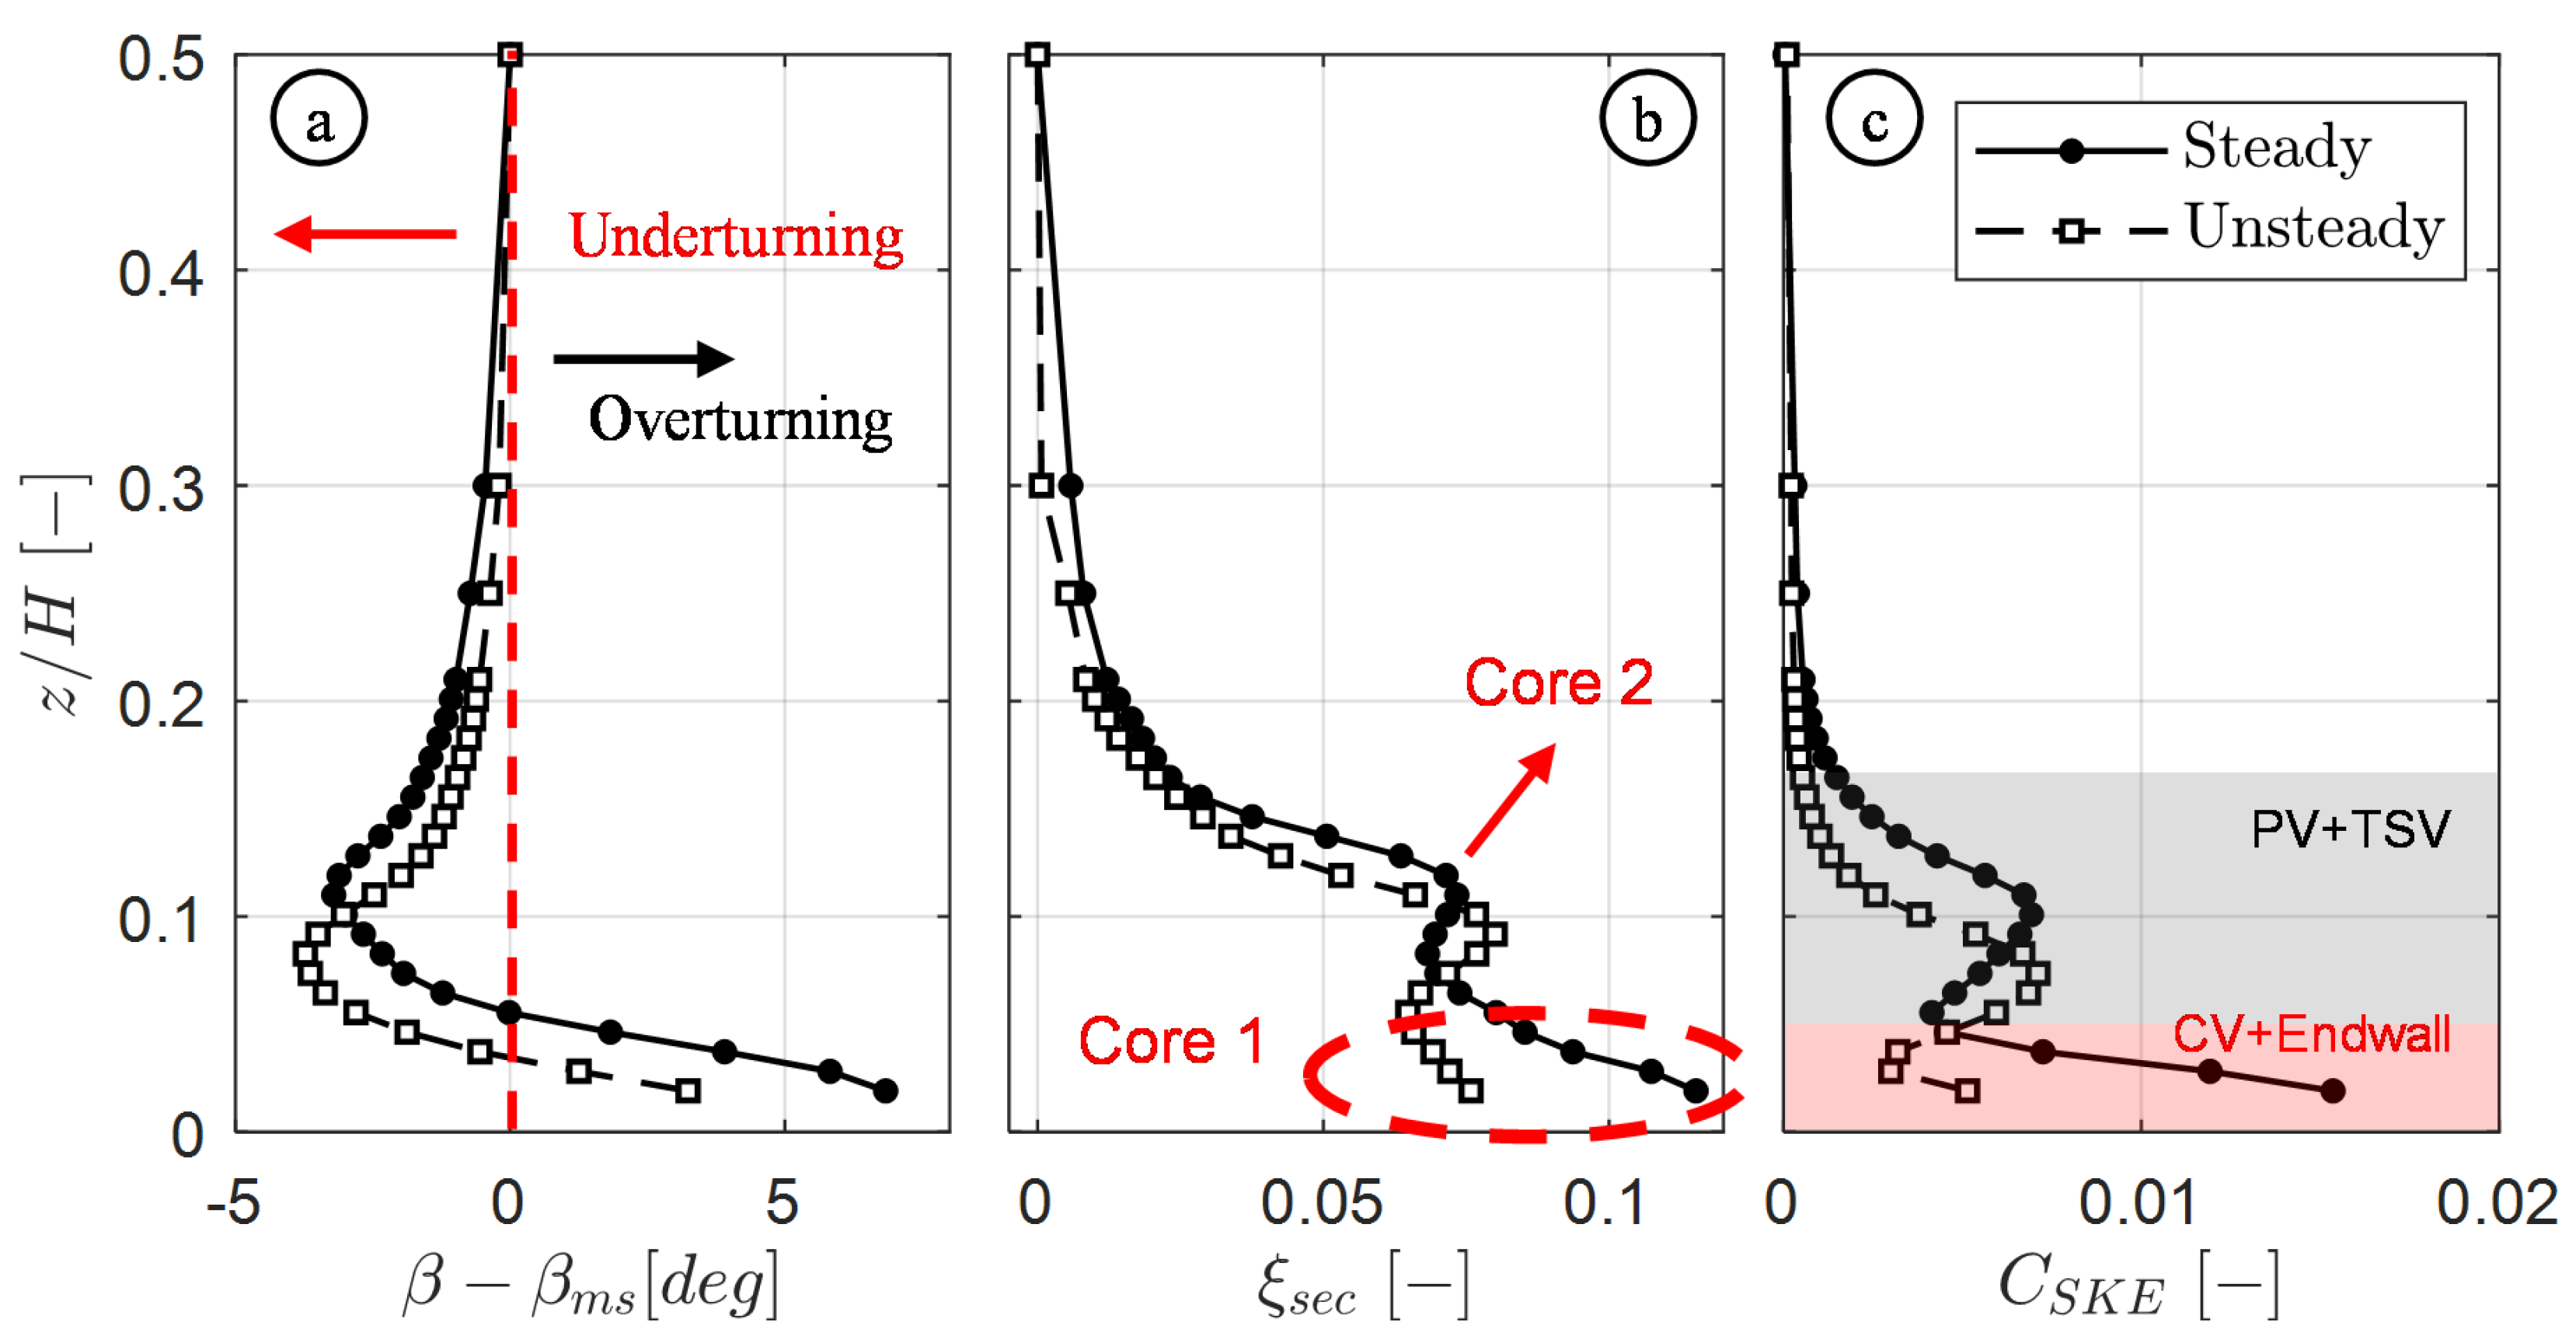
3.4. Pitchwise Averaged Quantities

The spanwise distribution of the pitchwise averaged deviation from the primary flow direction is displayed in Figure 7a. The spanwise distribution of the mass-averaged secondary kinetic energy loss coefficient and C S K E are displayed in Figure 7b,c, respectively. The deviation from the primary flow direction is obtained by removing the mass-averaged primary flow direction at midspan to the spanwise distribution. Similarly, the secondary kinetic energy loss coefficient is computed by removing the profile loss to the spanwise distribution of losses, assuming that the profile loss is constant along the span [44]. The midspan values are reported in Table 1 for completeness.
Near the endwall, the overturning caused by the PV has a larger spanwise extent for the steady case. The same can be observed for the peak in underturning originating from the shear interaction of the PV and TSV. In addition to being closer to the endwall, an increase in the underturning by 16 % is present for the unsteady case when compared to the steady flow case.
The cores that are visible in the kinetic energy contours displayed in Figure 6 are also present in the spanwise distribution of the kinetic energy loss coefficient (Figure 7b). The increased loss in the vicinity of the endwall includes the contribution of the inlet boundary layer—hence the higher value for the steady case. On the other hand, the magnitude of the peak associated with Core 2 increases by ∼25% when unsteady wakes are introduced. This highlights the increase in the endwall loss from the steady to the unsteady case since this increase surpasses the impact of the thicker inlet BL for the steady case.
Lastly, the C S K E highlights the regions dominated by the interaction of BL fluid with the corner vortex (red shaded area), and the interaction of PV with TSV (gray shaded area). The increased inlet BL thickness for the steady case results in a larger amount of BL migrating near the endwall due to the passage pressure gradient. The latter results in higher C S K E in the vicinity of the endwall for the steady case (∼200%). The higher peak migrates towards the endwall for the unsteady case. The magnitude of the C S K E does not change significantly.

3.5. Loss Breakdown

A loss breakdown was performed to decouple the impact of the inlet BL and profile loss from the endwall loss. The endwall loss was computed by subtracting the planewise mass-averaged kinetic energy loss coefficient from the inlet BL and the profile loss from the gross planewise mass-averaged averaged kinetic energy loss coefficient at the outlet as follows:
ξ e n d = ξ g r o s s ξ B L ξ p r o f
The endwall loss includes the contribution from the endwall BL dissipation and secondary flow mixing. Figure 8 presents the loss breakdown for the steady and unsteady cases. As expected, the BL loss for the steady case is ∼200% higher than for the unsteady one. The effect of the BL loss on the overall budget is compensated for by the increased profile loss with wakes ( + 31 % ). The increase in the profile loss with the introduction of the wakes has been reported in previous works [2,12]. The latter is attributed to the turbulence transported by the bar wakes that promote an increase in the turbulent boundary layer wetted area. The effect is aggravated by the high reduced frequency present in this test case.
By accounting for the inlet BL and profile loss, the endwall loss increases by ∼10% with the introduction of the unsteady wakes in the flow domain. This finding contradicts the existing literature on the topic. The contribution of all loss components for the cases investigated is displayed in Table 2 for completeness.

4. Conclusions

A high-speed LPT profile was tested in a high-speed linear cascade under steady and unsteady flow conditions. The measurements were performed at engine-representative Mach (0.90) and Reynolds (70k) numbers. For the unsteady case, a bar reduced frequency of 0.95 was achieved.
The inlet characterization illustrated the thinner inlet boundary layer resultant from a possible restart of the BL due to the wake generator slot, which was not present in the steady case. The thicker boundary layer impacted the development of the secondary flows as captured by the blade and outlet flow field measurements.
HF sensors on the blade SS enabled the identification of regions impacted by the secondary flow structures. The secondary flow structures presented a different type of boundary layer development along the blade SS in the vicinity of the endwall, which resulted in the modification of the quasi-wall shear stress and statistical moments of the measured signals.
Measurements at the cascade outlet highlighted secondary flow structures nearer the endwall for the unsteady flow case. The latter is mainly justified by the thinner inlet BL measured for the unsteady flow case. The flow deviation downstream displayed an increase in the underturning caused by the interaction of the PV and TSV by 16 % when unsteady wakes were introduced. In addition, the mass-averaged loss associated with the latter structures increased by 25 % . These results oppose the existing literature on the topic.
A loss breakdown enabled the decoupling of the profile loss and inlet BL loss from the overall loss measured downstream of the cascade. As expected, a large contribution to the losses was due to the thicker inlet BL for the steady case. This effect was counteracted by the increased profile losses for the unsteady case ( 31 % ). Lastly, the endwall losses were found to increase by 10 % with the introduction of the unsteady wakes in the cascade operating at engine-relevant Mach and Reynolds numbers and wake reduced frequency.

Author Contributions

Conceptualization, G.L., L.S. and S.L.; Methodology, G.L., L.S. and S.L.; formal analysis, G.L., L.S. and S.L.; investigation, G.L., L.S. and S.L.; data curation, G.L., L.S. and S.L.; writing—original draft preparation, G.L., L.S. and S.L.; writing—review and editing, G.L., L.S. and S.L. All authors have read and agreed to the published version of the manuscript.

Funding

This research was funded by the Clean Sky 2 Joint Undertaking under the European Union’s Horizon 2020 research and innovation program under the grant agreement 820883.

Institutional Review Board Statement

Not applicable.

Informed Consent Statement

Not applicable.

Data Availability Statement

The data presented in this study are openly available in Zenodo at https://doi.org/10.5281/zenodo.7264761, accessed on 13 June 2023.

Acknowledgments

The authors gratefully acknowledge the funding of the SPLEEN project by the Clean Sky 2 Joint Undertaking under the European Union’s Horizon 2020 research and innovation program under the grant agreement 820883.

Conflicts of Interest

The authors declare no conflict of interest.

List of Symbols

Abbreviations
BLboundary layer
CVsuction side corner vortex
FSTIfreestream turbulence intensity
GTFgeared turbofan
HFsurface-mounted hot film
LEleading edge
LPTlow-pressure turbine
PVpassage vortex
PSpressure side
RANSReynolds-averaged Navier–Stokes
SFCspecific fuel consumption
SKEsecondary kinetic energy coefficient
SSsuction side
TEtrailing edge
TSVtrailing shed vortex
TGturbulence grid
WIVwall-induced vortex
WGwake generator
Roman
Ctrue chord
C f skin friction coefficient
C S K E secondary kinetic energy coefficient, ρ 6 ( υ y , s e c 2 + υ z , s e c 2 ) γ P 6 M 6 , i s 2
Ebridge voltage
ffrequency
f + bar reduced frequency, f b a r · C / V 6 , i s
gcascade pitch
Hcascade span
iincidence, β β i n
MMach number
othroat
Ppressure
Q ˙ heat flux
Rreattachment line, resistance
R e Reynolds number, ρ C V / μ
Sseparation line, location along surface length
s k e w skewness
S L surface length
s t d standard deviation
Ttrajectory
Ubar peripheral speed
Vabsolute velocity
x , y , z location along axial chord, pitchwise and spanwise direction
Greek letters
β primary flow direction, t a n 1 V a x / V t a n
γ ratio of specific heats
μ dynamic viscosity
ξ kinetic energy loss coefficient, 1 1 ( P 6 P 06 ) γ 1 γ 1 ( P 6 P 01 ) γ 1 γ
ρ density
τ q quasi-wall shear stress
Φ flow coefficient, V a x / U
Subscripts
aambient
axaxial
barbar
Fflow
fsfreestream
Endendwall
ininlet
isisentropic
metmetallic
outoutlet
Profprofile
qquasi
ssensor, substrate
secsecondary
wwall
0flow-off, cold, total
2at Plane 02
6at Plane 06

References

  1. Kurzke, J. Fundamental Differences Between Conventional and Geared Turbofans. In ASME Turbo Expo 2009: Power for Land, Sea, and Air; Paper No: GT2009-59745; ASME: New York, NY, USA, 2009; pp. 145–153. [Google Scholar] [CrossRef]
  2. Hodson, H.P.; Howell, R.J. The role of transition in high-lift low-pressure turbines for aeroengines. Prog. Aerosp. Sci. 2005, 41, 419–454. [Google Scholar] [CrossRef]
  3. Torre, D.; García-Valdecasas, G.; Puente, A.; Hernández, D.; Luque, S. Design and Testing of a Multi-Stage IP Turbine for Future Geared Turbofans. In ASME Turbo Expo 2021: Turbomachinery Technical Conference and Exposition; Paper No: GT2021-59219; ASME: New York, NY, USA, 2021; p. V02BT32A007. [Google Scholar] [CrossRef]
  4. Hourmouziadis, J. Aerodynamic design of low pressure turbines. In AGARD Lecture Series 167; Von Karman Institute: Rhode-St-Genèse, Belgium, 1989. [Google Scholar]
  5. Giovannini, M.; Rubechini, F.; Marconcini, M.; Arnone, A.; Bertini, F. Analysis of a LPT Rotor Blade for a Geared Engine: Part I—Aero-Mechanical Design and Validation. In ASME Turbo Expo 2016: Turbomachinery Technical Conference and Exposition; ASME: New York, NY, USA, 2016; p. V02BT38A053. [Google Scholar] [CrossRef]
  6. Malzacher, F.J.; Gier, J.; Lippl, F. Aerodesign and Testing of an Aeromechanically Highly Loaded LP Turbine. J. Turbomach. 2003, 128, 643–649. [Google Scholar] [CrossRef]
  7. Langston, L. Secondary Flows in Axial Turbines—A Review. Ann. N. Y. Acad. Sci. 2001, 934, 11–26. [Google Scholar] [CrossRef] [PubMed]
  8. Sharma, O.P.; Butler, T.L. Predictions of Endwall Losses and Secondary Flows in Axial Flow Turbine Cascades. J. Turbomach. 1987, 109, 229–236. [Google Scholar] [CrossRef]
  9. Sieverding, C.H.; Van den Bosche, P. The use of coloured smoke to visualize secondary flows in a turbine-blade cascade. J. Fluid Mech. 1983, 134, 85–89. [Google Scholar] [CrossRef]
  10. Wang, H.P.; Olson, S.J.; Goldstein, R.J.; Eckert, E.R.G. Flow Visualization in a Linear Turbine Cascade of High Performance Turbine Blades. J. Turbomach. 1997, 119, 1–8. [Google Scholar] [CrossRef]
  11. Denton, J.D. Loss Mechanisms in Turbomachines. In ASME 1993 International Gas Turbine and Aeroengine Congress and Exposition; ASME: New York, NY, USA, 1993; p. V002T14A001. [Google Scholar] [CrossRef]
  12. Satta, F.; Simoni, D.; Ubaldi, M.; Zunino, P.; Bertini, F. Profile and secondary flow losses in a high-lift LPT blade cascade at different reynolds numbers under steady and unsteady inflow conditions. J. Therm. Sci. 2012, 21, 483–491. [Google Scholar] [CrossRef]
  13. Brunner, S.; Fottner, L.; Schiffer, H.P. Comparison of Two Highly Loaded Low Pressure Turbine Cascades Under the Influence of Wake-Induced Transition. In ASME Turbo Expo 2000: Power for Land, Sea, and Air; ASME: New York, NY, USA, 2000; p. V003T01A073. [Google Scholar] [CrossRef]
  14. Duden, A.; Fottner, L. Influence of taper, Reynolds number and Mach number on the secondary flow field of a highly loaded turbine cascade. Proc. Inst. Mech. Eng. Part A J. Power Energy 1997, 211, 309–320. [Google Scholar] [CrossRef]
  15. Hodson, H.P.; Dominy, R.G. The Off-Design Performance of a Low-Pressure Turbine Cascade. J. Turbomach. 1987, 109, 201–209. [Google Scholar] [CrossRef]
  16. Hodson, H.P.; Dominy, R.G. Three-Dimensional Flow in a Low-Pressure Turbine Cascade at Its Design Condition. J. Turbomach. 1987, 109, 177–185. [Google Scholar] [CrossRef]
  17. Lopes, G.; Simonassi, L.; Torre, A.F.M.; Patinios, M.; Lavagnoli, S. An Experimental Test Case for Transonic Low-Pressure Turbines—Part 2: Cascade Aerodynamics at On- and Off-Design Reynolds and Mach Numbers. In ASME Turbo Expo 2022: Turbomachinery Technical Conference and Exposition; ASME: New York, NY, USA, 2022; p. V10BT30A027. [Google Scholar] [CrossRef]
  18. Abo El Ella, H.M.; Sjolander, S.A.; Praisner, T.J. Effects of an Upstream Cavity on the Secondary Flow in a Transonic Turbine Cascade. J. Turbomach. 2012, 134, 051009. [Google Scholar] [CrossRef]
  19. Perdichizzi, A. Mach Number Effects on Secondary Flow Development Downstream of a Turbine Cascade. J. Turbomach. 1990, 112, 643–651. [Google Scholar] [CrossRef]
  20. Taremi, F. Endwall Flows in Transonic Turbine Cascades. Ph.D. Thesis, Carleton University, Ottawa, ON, Canada, 2013. [Google Scholar]
  21. Behr, T. Control of Rotor Tip Leakage and Secondary Flow by Casing Air Injection in Unshrouded Axial Turbines. Ph.D. Thesis, ETH Zurich, Zurich, Switzerland, 2007. [Google Scholar] [CrossRef]
  22. Lengani, D.; Paradiso, B.; Marn, A.; Göttlich, E. Identification of Spinning Mode in the Unsteady Flow Field of a Low Pressure Turbine. J. Turbomach. 2012, 134, 051032. [Google Scholar] [CrossRef]
  23. Ong, J.; Miller, R.J.; Uchida, S. The Effect of Coolant Injection on the Endwall Flow of a High Pressure Turbine. J. Turbomach. 2012, 134, 051003. [Google Scholar] [CrossRef]
  24. Infantino, D.; Satta, F.; Simoni, D.; Ubaldi, M.; Zunino, P.; Bertini, F. Phase-Locked Investigation of Secondary Flows Perturbed by Passing Wakes in a High-Lift LPT Turbine Cascade. In ASME Turbo Expo 2015: Turbine Technical Conference and Exposition; ASME: New York, NY, USA, 2015; p. V02CT44A008. [Google Scholar] [CrossRef]
  25. Volino, R.J.; Galvin, C.D.; Ibrahim, M.B. Effects of Periodic Unsteadiness on Secondary Flows in High Pressure Turbine Passages. In ASME Turbo Expo 2013: Turbine Technical Conference and Exposition; ASME: New York, NY, USA, 2013; p. V06CT42A042. [Google Scholar] [CrossRef]
  26. Ciorciari, R.; Kirik, I.; Niehuis, R. Effects of Unsteady Wakes on the Secondary Flows in the Linear T106 Turbine Cascade. J. Turbomach. 2014, 136, 091010. [Google Scholar] [CrossRef]
  27. Lopes, G.; Simonassi, L.; Lavagnoli, S. Impact of Unsteady Wakes on the Secondary Flows of a High-Speed Low-Pressure Turbine Cascade. In Proceedings of the 15th European Conference on Turbomachinery Fluid Dynamics and Thermodynamics, Paper n. ETC2023-290, Budapest, Hungary, 24–28 April 2023; Available online: https://www.euroturbo.eu/publications/conference-proceedings-repository/ (accessed on 19 September 2023).
  28. Simonassi, L.; Lopes, G.; Gendebien, S.; Torre, A.F.M.; Patinios, M.; Lavagnoli, S.; Zeller, N.; Pintat, L. An Experimental Test Case for Transonic Low-Pressure Turbines—Part I: Rig Design, Instrumentation and Experimental Methodology. In ASME Turbo Expo 2022: Turbomachinery Technical Conference and Exposition; ASME: New York, NY, USA, 2022; p. V10BT30A012. [Google Scholar] [CrossRef]
  29. Pfeil, H.; Herbst, R.; Schröder, T. Investigation of the Laminar-Turbulent Transition of Boundary Layers Disturbed by Wakes. J. Eng. Power 1983, 105, 130–137. [Google Scholar] [CrossRef]
  30. Bellhouse, B.J.; Schultz, D.L. Determination of mean and dynamic skin friction, separation and transition in low-speed flow with a thin-film heated element. J. Fluid Mech. 1966, 24, 379–400. [Google Scholar] [CrossRef]
  31. Halstead, D.E.; Wisler, D.C.; Okiishi, T.H.; Walker, G.J.; Hodson, H.P.; Shin, H.W. Boundary Layer Development in Axial Compressors and Turbines: Part 1 of 4—Composite Picture. J. Turbomach. 1997, 119, 114–127. [Google Scholar] [CrossRef]
  32. Oldfield, M.L.G.; Kiock, R.; Holmes, A.T.; Graham, C.G. Boundary Layer Studies on Highly Loaded Cascades using Heated Thin Films and a Traversing Probe. J. Eng. Power 1981, 103, 237–246. [Google Scholar] [CrossRef]
  33. Pucher, P.; Goehl, R. Experimental Investigation of Boundary Layer Separation With Heated Thin-Film Sensors. J. Turbomach. 1987, 109, 303–309. [Google Scholar] [CrossRef]
  34. Hodson, H. The detection of boundary-layer transition and separation in high speed turbine cascades. In Measurement Techniques for Transonic and Supersonic Flow—Proc. 7th Symposium; University of Cambridge: Cambridge, UK, 1984. [Google Scholar]
  35. Hodson, H.P.; Huntsman, I.; Steele, A.B. An Investigation of Boundary Layer Development in a Multistage LP Turbine. J. Turbomach. 1994, 116, 375–383. [Google Scholar] [CrossRef]
  36. Hultmark, M.; Smits, A.J. Temperature corrections for constant temperature and constant current hot-wire anemometers. Meas. Sci. Technol. 2010, 21, 105404. [Google Scholar] [CrossRef]
  37. Simoni, D.; Berrino, M.; Ubaldi, M.; Zunino, P.; Bertini, F. Off-Design Performance of a Highly Loaded Low Pressure Turbine Cascade Under Steady and Unsteady Incoming Flow Conditions. J. Turbomach. 2015, 137, 071009. [Google Scholar] [CrossRef]
  38. Vera, M.; Hodson, H. Low Speed vs. High Speed Testing of LP Turbine Blade-Wake. In Proceedings of the 16th Symposium on Measuring Techniques in Transonic and Supersonic Flow in Cascades and Turbomachines, Cambridge, UK, 23–24 September 2002; pp. 1–10. [Google Scholar]
  39. Simonassi, L.; Lopes, G.; Lavagnoli, S. Effects of Periodic Incoming Wakes on the Aerodynamics of a High-Speed Low-Pressure Turbine Cascade. In Proceedings of the 15th European Conference on Turbomachinery Fluid Dynamics & Thermodynamics, Budapest, Hungary, 24–28 April 2023; Available online: https://www.euroturbo.eu/publications/conference-proceedings-repository/ (accessed on 23 June 2023).
  40. Coull, J.; Clark, C.; Vazquez, R. The sensitivity of turbine cascade endwall loss to inlet boundary layer thickness. J. Glob. Power Propuls. Soc. 2019, 3, 540–554. [Google Scholar] [CrossRef]
  41. Coull, J.D. Endwall Loss in Turbine Cascades. J. Turbomach. 2017, 139, 081004. [Google Scholar] [CrossRef]
  42. Coull, J.D.; Clark, C.J. The Effect of Inlet Conditions on Turbine Endwall Loss. J. Turbomach. 2022, 144, 101011. [Google Scholar] [CrossRef]
  43. Pullan, G.; Denton, J.; Dunkley, M. An Experimental and Computational Study of the Formation of a Streamwise Shed Vortex in a Turbine Stage. J. Turbomach. 2003, 125, 291–297. [Google Scholar] [CrossRef]
  44. Kacker, S.C.; Okapuu, U. A Mean Line Prediction Method for Axial Flow Turbine Efficiency. J. Eng. Power 1982, 104, 111–119. [Google Scholar] [CrossRef]
Figure 1. The VKI S-1/C wind tunnel (a) and test section layout and instrumentation at each measurement location (b).
Ijtpp 08 00036 g001
Figure 2. Inlet total pressure profiles (a) and inlet incidence (b) measured for the steady and unsteady cases at Plane 02 with the C5HP.
Ijtpp 08 00036 g002
Figure 3. Blade loading distributions at (a) z / H = 2.12 % , (b) z / H = 5.15 % , (c) z / H = 10.00 % , and (d) z / H = 50.00 % . The red curve is a zoomed-in region capturing the rear portion of the SS.
Ijtpp 08 00036 g003
Figure 4. Contour of skin friction coefficient superimposed with viscous stress lines (a) and identification of separation lines due to the secondary flows (b).
Ijtpp 08 00036 g004
Figure 5. Contour of quasi-wall shear stress measured along the span for the steady (a) and unsteady (e) cases, alongside the standard deviation (b,f), skewness (c,g), and kurtosis (d,h) of the hot film’s bridge voltage.
Ijtpp 08 00036 g005
Figure 6. Fields of secondary kinetic energy for the steady (a) and unsteady cases (b) alongside the kinetic energy loss coefficient for the steady (c) and unsteady cases (d).
Ijtpp 08 00036 g006
Figure 7. Spanwise distributions of pitchwise averaged deviation from primary flow direction (a), secondary kinetic energy loss coefficient (b), and secondary kinetic energy coefficient (c) for the steady and unsteady cases.
Ijtpp 08 00036 g007
Figure 8. Loss breakdown for steady and unsteady cases.
Ijtpp 08 00036 g008
Table 1. Pitchwise averaged primary flow direction and energy loss coefficient at midspan.
QuantitySteadyUnsteady
β 52.9151.72
ξ 0.03130.0414
Table 2. Summary of loss contributions for all cases.
LossSteadyUnsteady
ξ B L 0.01020.0034
ξ P r o f 0.03140.0412
ξ E n d 0.01470.0161
Disclaimer/Publisher’s Note: The statements, opinions and data contained in all publications are solely those of the individual author(s) and contributor(s) and not of MDPI and/or the editor(s). MDPI and/or the editor(s) disclaim responsibility for any injury to people or property resulting from any ideas, methods, instructions or products referred to in the content.

