1. Introduction
Vibration control represents a key issue in the field of hydraulic turbines. Although many types of vibration can occur, the most common vibrational phenomenon is represented by the vibrations induced by the shedding of the von Karman vortexes from the blade trailing edge [
1]. If the vortex shedding frequency also synchronizes with the cross-flow structural frequency [
2], resulting in the so-called “lock-in” condition, the vibrations become even more severe and are accompanied by hissing sounds. The occurrence of lock-in entails an increase in the dynamic load on the blade trailing edge with the potential occurrence of structural damages due to fatigue phenomena.
Although vibration phenomena can occur in all machine components, the lock-in condition occurs most frequently on the stay vanes because the flow at the trailing edges is relatively uniform and structural damping is low [
3]. An example of cracks in stay vanes induced by wake vortices is reported in [
4], while in [
5], the excitation frequency of the von Karman shedding frequency is found to be close to the natural frequency of a runner manifesting severe damages due to fatigue effects.
In the traditional approach, the shedding frequency of the vortexes is estimated by assuming a reference value for the Strouhal number, which is defined as follows:
where
f = vortex shedding frequency [Hz];
𝑣 = reference fluid speed (e.g., free stream velocity at the point of boundary-layer separation) [m/s];
𝑑 = reference thickness (e.g., thickness of the wake at the point of boundary-layer separation) [m].
The so-defined Strouhal number should be independent of the geometry and the Reynolds number [
6].
Once a reasonable value for the Strouhal number is assigned, the shedding vortex frequency is estimated and then compared with the natural frequencies of the component: the machine is considered safe from vortex-induced vibrations if the natural frequency is at least 30% higher than the shedding frequency [
7]. However, a proper estimation of the Strouhal number for hydraulic turbine components is rather difficult, and the values suggested in the literature (in the range between 0.16 and 0.24) [
8] are based on experimental studies carried out on bluff bodies, for which it is possible to easily assess the boundary layer and the separation point, such as cylinders and cones.
This simplified approach has been used successfully in the past because the geometries were simpler, and the chamfering adopted in the past was more like that of a bluff body than an airfoil. However, the new design strategies of hydraulic machines have increased the complexity of the geometry and have made this simplified approach less effective, highlighting the need for a more in-depth investigation, like the one carried out by Zobeiri et al. [
9], on the influence of the trailing edge geometry on the wake vortex development.
In a scenario in which the correct prediction of the vortex shedding frequency represents a key issue in the design strategy of a hydraulic turbine, the computational fluid dynamics undoubtedly represents a powerful tool for supporting the design procedure. Nevertheless, numerical simulations may require great effort, both in terms of resources and time consumption, slowing the development phase and increasing the costs.
The aim of this paper is to propose a simple numerical model capable of evaluating the unsteady behavior of the fluid flow in a Francis turbine with a very low computational cost.
For this purpose, a reduced numerical model of a Francis turbine with a mean drop height and a specific speed, exhibiting resonance phenomena that are presumably due to the vortex shedding frequency at the trailing edge of the impeller blades, was created in order to limit the computational effort and still ensure a detailed representation of the fluid flow in the turbine.
This paper is organized as follows:
Section 2 presents the numerical model of the hydraulic machine under study;
Section 3 reports the results of the validation procedure performed by comparing the numerical estimated hydraulic efficiency with the experimental data; finally, in
Section 5, the potential of the model is demonstrated by analyzing the capability of reproducing the small- and large-dimensional flow turbulent structures occurring when the machine is working at the design point. Moreover, the von Karman shedding frequencies are analyzed in depth, comparing the numerical shedding frequency with the available experimental data.
2. The Case Study
The case study of this analysis consists of a run-on-river small hydropower plant built in 2020, located on a river in the north of the Veneto region (northern Italy). The power plant consists of two twin units, with a total rated power of 0.8 MW. Regarding the hydraulic machines, the two Francis turbines provide a rated power of 400 kW each at the nominal discharge of 1.05 m3/s. The gross head is equal to 39 m, while the nominal rotational speed is 750 rpm.
From the very beginning, since the unit’s commissioning, loud and high-frequency whistling noises were recorded in the powerhouse when the machines operated near the nominal discharge (1.05 m3/s). As a result, the operators of the power plant decided to limit the operating ranges of the machines to a power range below 300 kW per machine in order to avoid the development and propagation of fatigue cracks until corrective measures were carried out on the turbine parts.
To characterize the noise emission, the acoustic signals were acquired on-field during maintenance activity at a sampling frequency of 44.1 kHz, and an FFT analysis was carried out. The FFT at nominal discharge of one machine was dominated by two frequency peaks around 188 Hz and 2000 Hz (
Figure 1a), whereas at partial load, the high-frequency disappeared and the FFT showed just one frequency peak around 188 Hz likely due to the runner’s rotor–stator interaction. Indeed, the product of the runner blade number, equal to 15, and the rotational speed highlights a rotor–stator interaction equal to 187.5 Hz.
The source of the noise emission at nominal discharge was most likely a vibration phenomenon occurring in the runner, caused by the resonance between the system frequency and the von Karman vortex shedding frequency at the runner blade trailing edge. In cases like this, the only option available for plant owners is to disassemble the runner and to rework the blade trailing edge, so as to vary the geometry and the separation point and hence to affect the vortex shedding frequency. However, this approach is extremely expensive due to the costs of the extraordinary maintenance activities and the profit loss caused by the production stop. It would have been preferable to know the existence of the resonance condition during the design phase. However, in this case, the standard approach estimating the vortex shedding frequency starting from the Strouhal number failed because of the above-mentioned limits, and detailed CFD analyses of the machine cannot represent a standard design tool due to the unacceptably long computational time. Therefore, to provide an investigation strategy that is more effective in the design phase, an innovative reduced numerical model was proposed and validated with reference to this case study. The model is presented below.
3. The Numerical Model
The hydraulic machine under investigation consists of a medium specific speed Francis turbine (ns = 157 rpm m3/4s−1/2) characterized by a radial shrouded runner with 15 blades. The distributor comprises 16 stay vanes and 16 guide vanes while the draft-tube is a straight cone type.
Since the aim of the approach is to reduce the computational effort, a single blade channel was modeled, including hence only 1/15 of the runner domain and 1/16 of the stay and guide vanes. As regards the other stationary components, the entire draft tube was included, while the spiral case was not considered (
Figure 2).
Since the von Karman vortex shedding phenomenon is significantly affected by the boundary-layer thickness near the blade trailing edge, an accurate prediction of the vortex shedding requires a high boundary-layer resolution. Special attention was, hence, paid to the boundary mesh refinement of the stay vanes, guide vanes, and runner, adopting a structured mesh with an O-grid topology. A structured mesh was also built for the draft tube with the commercial software ICEM CFD 2022, while the Ansys Turbogrid 2022 software was adopted for the discretization of the remaining domains.
The mesh independency was studied in a preliminary analysis by considering four different grid resolutions, named coarser, coarse, medium, and fine mesh (
Table 1). Then, the mesh independency was evaluated by comparing the head H values and the runner torque T, adopting the simulation settings reported in the next section. As seen in
Figure 3, computational meshes with greater than 4 million nodes show negligible differences, and hence, the medium size mesh was selected.
The y+ value distribution for each domain component is reported in
Table 2.
Regarding the turbulent model, wall functions are not suitable in such applications, and a very fine mesh resolution near the solid wall is required to properly resolve the flow behavior in the boundary-layer region. In this case, a proper turbulence model is the k-
ω, since it allows a direct integration to the wall without having to subdivide the flow domain into low- and high-Reynolds-number regions as required by the k-
ε turbulence model [
10].
Although the SST (Shear Stress Transport) formulation of the k-ω turbulence models has also proved to be valid in the evaluation of the von Karman shedding phenomena [
11], a hybrid URANS-scale resolved approach with SAS-SST (Scale Adaptive Simulation–Shear Stress Transport) was preferred for this study. In fact, as reported by Neumann et al. [
4], the SAS turbulent model has been proven to give good accuracy in frequency prediction, and it results in more realistic force amplitudes compared with other two-equation turbulence models such as the SST. Moreover, such an approach has been successfully adopted for the evaluation of the tridimensional behavior of the fluid flow in hydraulic turbines [
12]. Indeed, the SAS model allows the turbulent model to be adapted to the local-turbulence length scale by switching from the LES model in the unsteady flow regions to the RANS, in this case, the SST model, in the steady ones. Compared to the RANS-SST model, smaller turbulence structures can be generated with a resolution down to the grid size [
13].
Simulation Settings
The commercial software ANSYS CFX 20.0 was used to perform an unsteady incompressible turbulent flow numerical simulation of the reduced machine model.
As regards the boundary conditions, the mass flow rate was applied at the stay vane inlet section while the relative static pressure was applied at the draft tube outlet sections. A stochastic fluctuation of the velocities with a 5% free-stream turbulent intensity was set for the inlet mass flow. In order to reproduce the effect induced on the fluid trajectories by the spiral case geometry, the fluid velocity at the domain inlet section was tilted, in referment to the radial direction, for an angle equal to 32° representing the design angle adopted in the design procedure of the stay vane blades. At the draft tube outlet section, an opening condition was adopted.
The walls were defined as no-slip smooth walls, while the runner blade, hub, and shroud were set as rotating walls. Rotational periodic interfaces were adopted between the domains’ periodic faces. A general connection interface was set between the stay vane and the guide vane domains, while a mixing plane interface was set between the runner and guide vane. The stage (mixing plane) interface was adopted to reduce the effect on the domain coupling introduced by the relative position between the runner and guide vanes. Indeed, in order to realize the data transfer between regions, the mixing plane method constructs the inlet and outlet boundary conditions at the interface, and the data are transmitted to the downstream region in a circumferential or radial average [
14].
The high-resolution advection scheme of the CFX software, based on the second-order backward Euler method for time integration, was used with a residual target set at 1 × 10⁻⁵ for the root mean square (RMS) values (u momentum, v momentum, w momentum, turbulence kinetic energy).
Since the time step was expected to play a significant role in the simulation accuracy, a sensitivity analysis was also carried out to evaluate the influence of the time-step value on the shedding frequency. As shown in
Figure 4a, the analysis indicated a neglected variation in the shedding frequency after a time step of 75 cycle per period (2000 Hz) equivalent to 0.03° of runner revolution per time step. For this reason, this value was fixed in the numerical simulations.
Finally, the influence of the grid resolution was evaluated by comparing the vortex shedding frequency at the runner blade trailing edge in correspondence of the midspan section (
Figure 4b). As result, the coarser mesh was proven to be unsuitable for the analysis since it was not able to capture the vortex shedding. Meanwhile, a difference of 1.5% was evaluated between the medium and fine mesh shedding frequency, testifying to the high sensitivity of the phenomena to the runner grid resolution.
With these settings, the average Courant number of the simulation was found to be below 0.2.
Thanks to this approach, the numerical model is able to evaluate the von Karman shedding frequency within a reduced computational time of approximately 200 CPU h.
4. Validation of the Numerical Model
To validate the numerical model, a series of steady-state simulations with different guide vane openings were carried out to replicate the experimental efficiency curve of the machine. Specifically, seven configurations with a progressive guide vane opening from 12° to 30° with a 3° step were tested.
A variable discharge value at the inlet section of the machine was set as a boundary condition. A calculation routine was implemented in the software to determine the correct discharge value for each vane opening, corresponding to the nominal head. This approach circumvented the disadvantages of the pressure boundary condition in terms of stability of the numerical solution by adopting the mass flow condition, which at the same time guarantees the correct value for the head.
As shown in
Figure 5, the numerical model reproduces, with sufficient accuracy, the machine hydraulic efficiency curve pattern, with a foreseeable efficiency overestimation that increases as the operating point moves away from the nominal operating condition. The efficiency overestimation is due to the simplifications introduced in the numerical model, since the absence of the spiral case and the labyrinth seal fluid domains involve an underestimation in the head losses as well as an overestimation in the runner torque. Although the head losses occurring in the spiral case can be considered minor, the friction losses occurring in the labyrinth seal can significantly affect the overall machine efficiency with a greater influence in the case of lower machine specific speeds [
15].
5. Results and Discussion
As mentioned above, the intense and high-frequency noises recorded in the powerhouse are most likely the result of resonance phenomena between the vibration modes of one or more machine parts and the von Karman vortex shedding frequency. To confirm or refute this hypothesis, the proposed simplified numerical approach, based on a transient numerical simulation of the reduced machine model, was tested.
5.1. Fluid-Dynamic Analysis
First, in order to propose a complete characterization of the machine hydrodynamics at the nominal discharge operative condition, the tridimensional topology of the main turbulent structures occurring in the flow was carefully analyzed.
Two different visualization strategies were adopted, and both of them confirmed the capability of the simplified numerical approach to capture—at least qualitatively—the phenomena causing the high-frequency resonance phenomena.
On one side, to visualize the development of the vortex street at the runner trailing edge, the representation of the velocity curl evaluated with reference to the runner rotational axis (z-axis) was also adopted (
Figure 6).
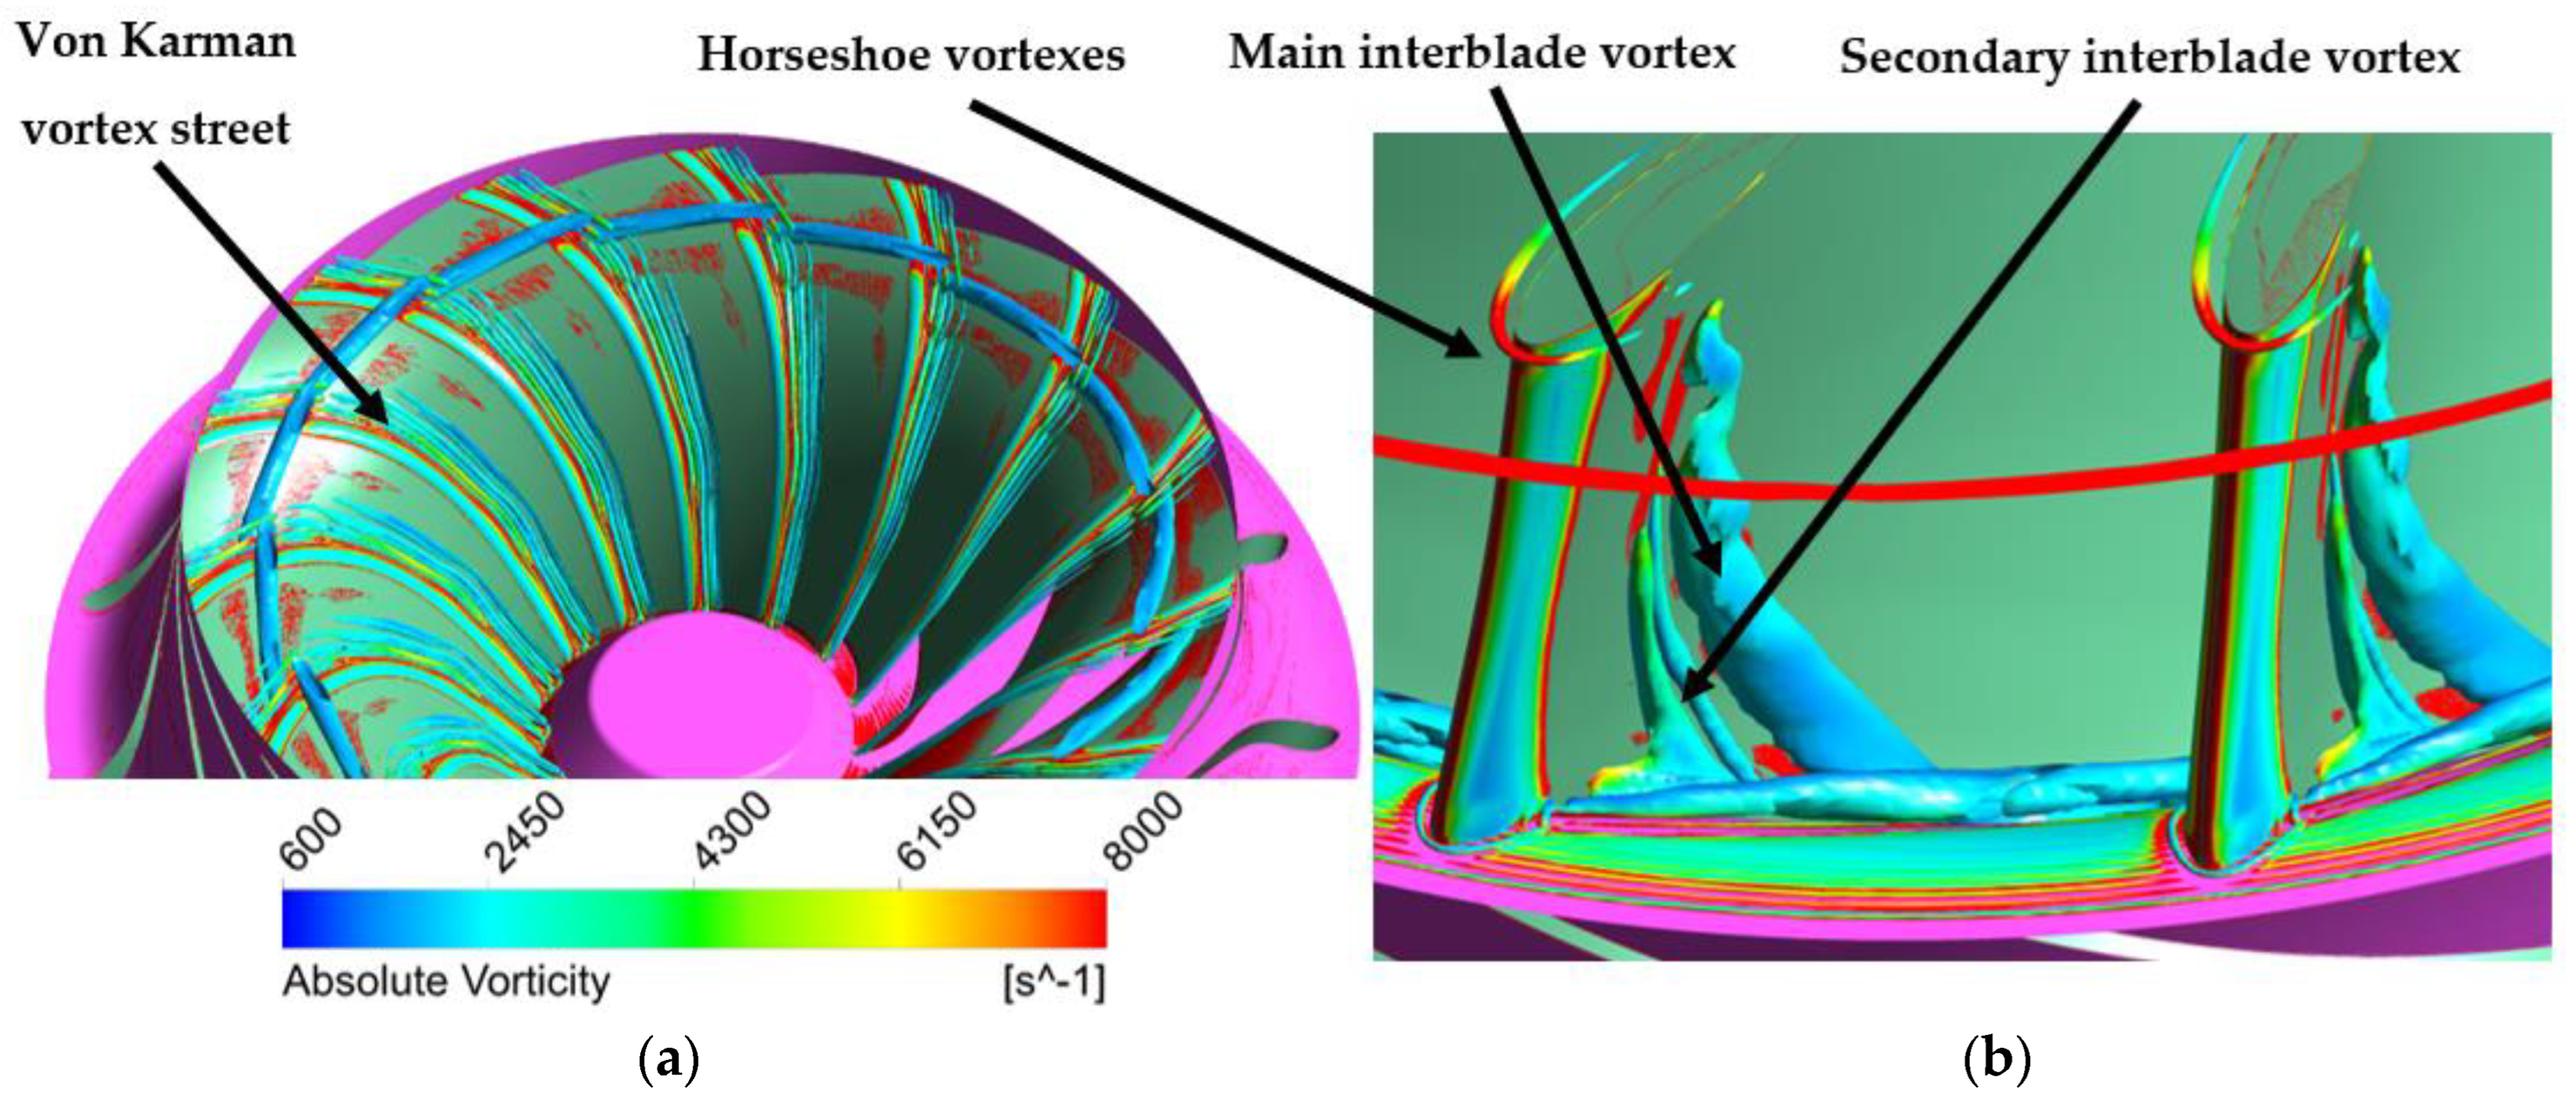
On the other side, to better capture the 3D evolution of the vortexes developing in the runner, the Q-criterion method, identifying the areas where the vorticity magnitude is greater than the magnitude of the rate of strain, was applied. This method allowed the capture of both the propagation of the von Karman vortex street in the runner (
Figure 7a) and the presence of a large-dimension interblade vortex located on the blade pressure side (
Figure 7b).
This vortex structure develops as a consequence of a negative angle of attack in the inlet region of the runner. The mismatch between the blade angles and flow trajectories varies in the spanwise direction with an increasing trend in proximity to the runner hub surface. As result, the inception of the interblade vortex is confined in a restricted portion of the blade leading edge in correspondence with the blade pressure side. The flow separation then propagates in the runner interblade channel due to the advection of the main flow.
Although this interblade vortex topology has been studied previously in the literature, this analysis allowed a second vortex structure to be identified, developing at the junction between the blade leading edge and the shroud surface (
Figure 7b). A similar vortex structure was identified by Zhou et al. [
16], and its origin was thought to be related to the propagation of the shroud horseshoe vortex downstream in the interblade channel. However, this paper suggests a different nature of this vortex, which seems to be the result of a more complex interaction between different vortex structures.
In more detail, as seen in
Figure 8 reporting the streamlines of the different vortex structures, the main interblade vortex is composed of two different counter-rotating structures: the first, marked in blue, develops near the hub surface for the above-mentioned reasons and then propagates from the hub to the shroud, also moving downstream in the runner channel due to the advection of the main flow; the second one, marked in purple, develops in the same region and then propagates just crossways to the shroud surface. The incidence between the second structure with the shroud creates a secondary interblade vortex independent from the shroud horseshoe vortex.
Moreover, the secondary vortex increases in volume as a result of mixing with the main flow, marked in red in
Figure 8, and with the horseshoe vortex, marked in green, thus propagating in the whole channel.
Therefore, regarding the origin of two separate interblade vortex regions in proximity to the blade leading edge, close to the hub, the secondary one appears to be consequent to the development of the main interblade vortex. Indeed, the interaction between the main interblade vortex and the boundary layer generates a low-energy-density region, which is then driven toward the shroud surface by the centrifugal force, evolving into a counter-rotating vortex structure.
The counter-rotating nature of these two turbulent structures is highlighted in
Figure 9 showing the z-velocity contour at the runner midspan section.
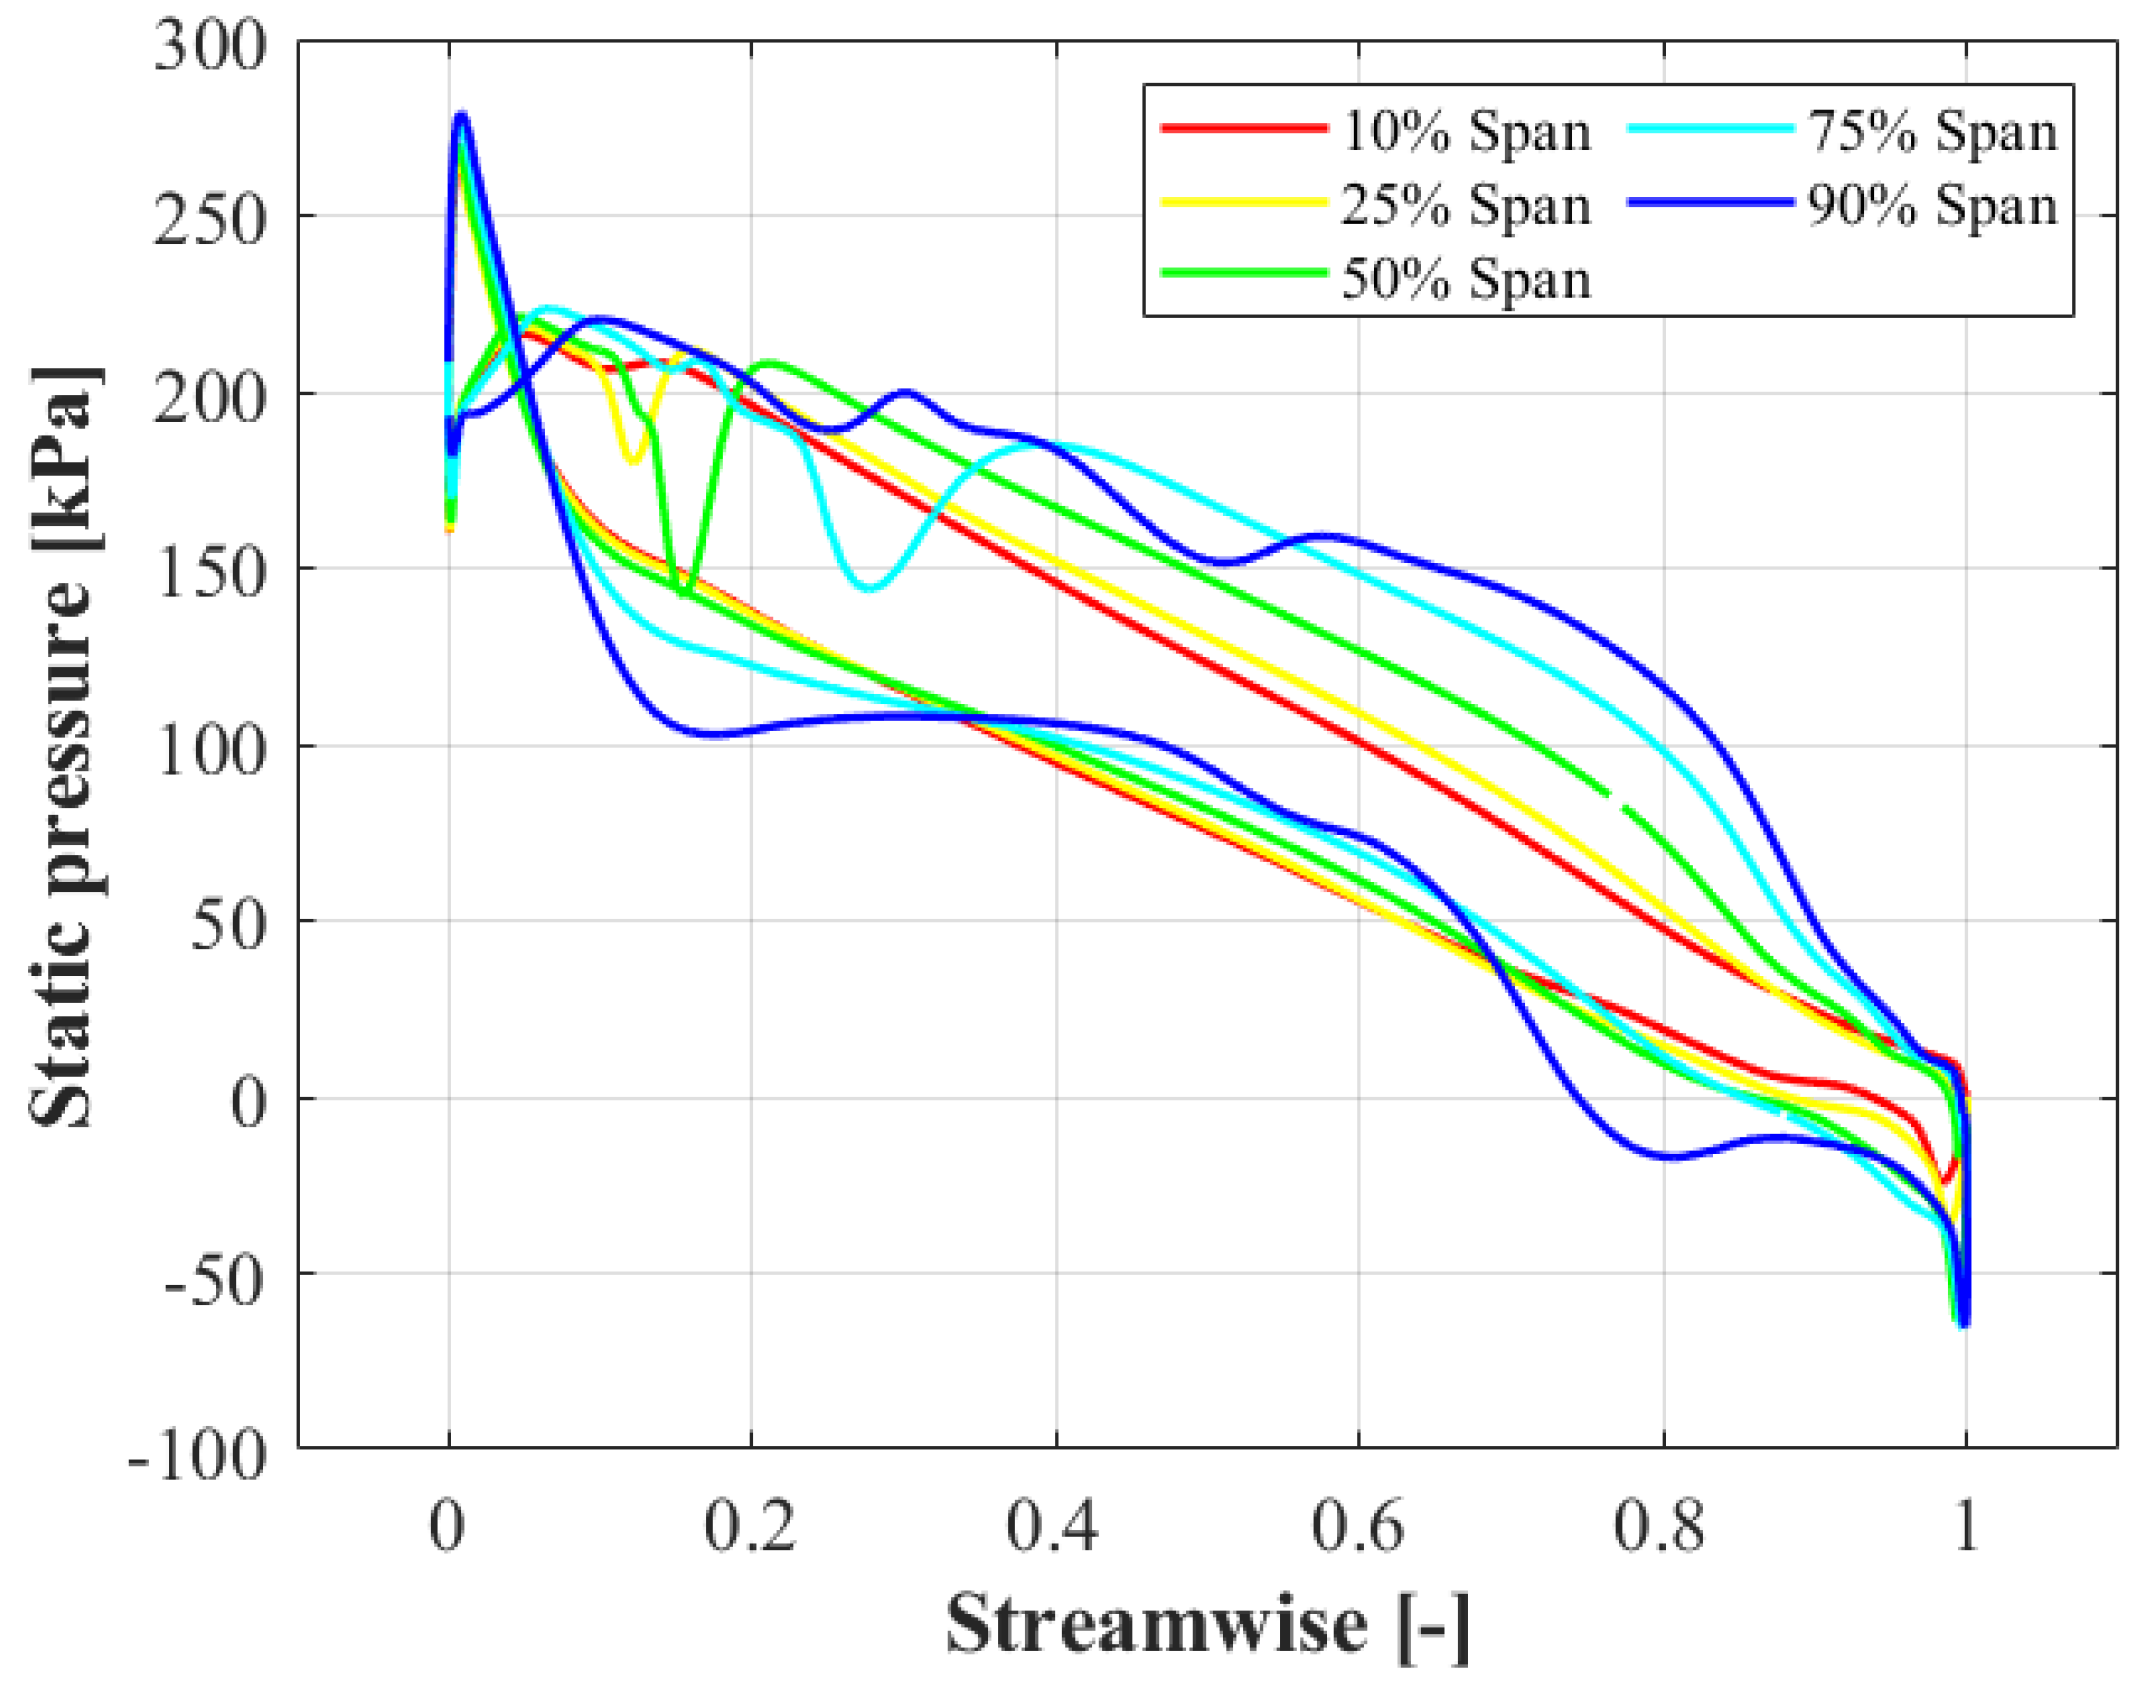
The development of the interblade vortex structure also drastically influences the blade pressure distribution due to the occurrence of a low-pressure area in correspondence of the blade pressure side (
Figure 10).
Despite a restricted low-pressure area developing at the leading edge due to the flow incidence on the blade suction side, the presence of the pressure-side interblade vortex is clearly visible starting from the 25% span load distribution, with a low-pressure area located at 12% of the streamwise coordinate. This area then progressively moves downstream from 15% to 28% of the streamwise coordinate passing from 50% to 75% in the hub-to-shroud direction.
The influence of the interblade vortex on the runner blade pressure distribution is due to the position of the turbulent structures, which firstly appear to be adherent to the pressure side. Secondarily, after the incidence with the runner shroud surface, the turbulent structure moves progressively in the runner channel then adhering to the following blade’s suction side.
Because of this, the presence of the interblade vortex also affects the pressure distribution on the blade suction side with the occurrence of a low-pressure area located in proximity to the trailing edge, close to the shroud surface. As results, the pressure distribution at 90% span manifests a local depression located at around 80% of the spanwise coordinate.
The influence of the interblade vortex on the blade pressure distribution is also visible in
Figure 11, which shows the static pressure distribution on the runner blade pressure and suction side. In this scenario, it is possible to assert that the development of the interblade vortex negatively influences the cavitation behavior of the hydraulic machine by creating a local depression band in proximity to the runner trailing edge (
Figure 11a).
Nevertheless, the von Karman’s vortex street does not seem to be disturbed by the development of these large-scale interblade turbulent structures, whose development exhibits an almost steady behavior.
5.2. The Spectral Analysis
Once we verified the effectiveness of the model in qualitatively capturing the von Karman vortex shedding, the simplified numerical approach was also tested from a quantitative point of view, investigating its effectiveness in identifying the shedding frequency. Therefore, to investigate the spectral content of the machine and the correlation with the fluid-dynamic behavior, three control points were set on the runner blade trailing edge (
Figure 12a) in five different sections in the spanwise direction (
Figure 12b).
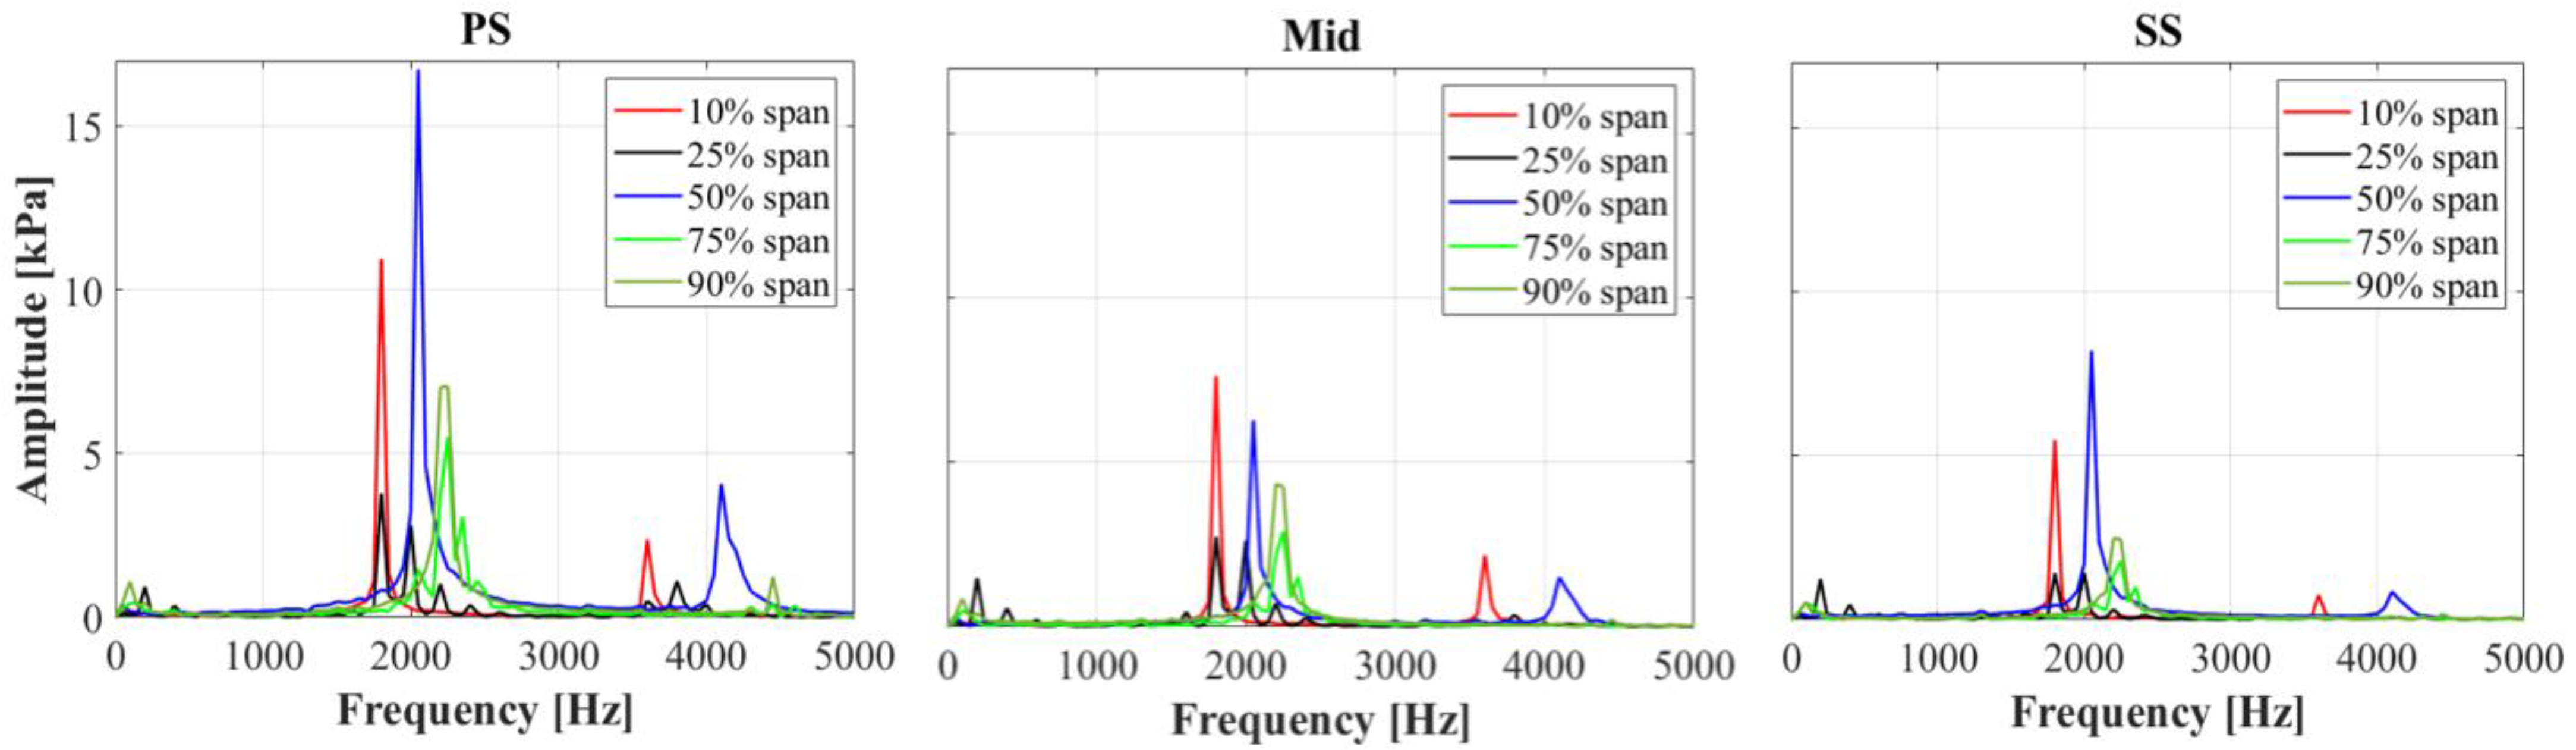
As clearly visible in
Figure 13, the FFT analysis performed on the pressure signals acquired at the control points confirmed a dominant peak in the spectra around 2000 Hz, in agreement with the experimental results (
Figure 1) and, therefore, demonstrated the capability of the simplified numerical approach to capture the resonance excitation source. In particular, the pressure-side pressure distribution appears to be more sensitive to the shedding of the vortex street.
Moreover, the same peak can also be seen in the frequency spectrum of the torque acting on the runner blade signal (
Figure 14). Indeed, the pressure perturbation induced by the shedding of the von Karman vortex street influences the blade pressure distribution, hence, resulting in the fluctuation of the blade torque.
In order to better describe the influence of the pressure perturbation on the runner torque,
Figure 15b reports the blade pressure distribution in correspondence to the runner midspan trailing edge section at two different time instants, respectively, related to a peak and a valley of the midspan pressure signal (
Figure 15a).
The frequency spectra also show the existence of a low-amplitude, low-frequency phenomenon that lies in a frequency range between 110 Hz and 180 Hz and appears in the 25% span signals in almost good agreement with the measured signal at 190 Hz (
Figure 1a,b). Since this perturbation remains unchanged under different flow conditions, it can be assumed that the phenomenon is independent of von Karman’s vortex shedding, which indeed strictly depends on the flow rate. In particular, this low-frequency band is very close to the blade passage frequency in the rotating frame (187.5 Hz), a hypothesis confirmed by the wakes of the guide vanes disturbing the runner inlet.
The reason for the approximation in the frequency determination is the average influence of the stage interface on the total pressure field. Nevertheless, this perturbation does not appear in the torque signals of the runner blades, thus pointing out a minor effect compared to the von Karman vortex street shedding.
Finally, in order to evaluate the possible contribution of the stay vanes’ trailing edge on the resonance occurrence, the spectral content of a pressure-control point located in the midspan section of the stay vane trailing edge was analyzed, showing a shedding frequency equal to 500 Hz (
Figure 16). However, this peak is not present in the runner signals and, hence, does not seem to provide any significant contribution to the resonance phenomena. This is also in agreement with the experimental measurements.
Summing up the frequency analysis, the runner Strouhal number resulting from the numerical simulation was determined. In particular, considering the numerically evaluated shedding frequency (2070 Hz), the blade trailing edge width, and the relative flow speed at the runner midspan section, the runner Strouhal number result was 0.186, which falls within the suggested range for Francis turbines (0.16–0.24), thus supporting the goodness of this numerical approach.
6. Conclusions
This work represents the extended version of the paper presented by the authors at the 15th European Turbomachinery Conference (ETC15) in Budapest, Hungary [
17].
A simplified single-passage numerical model has been developed to evaluate the effect induced by the von Karman shedding frequency at the trailing edge of the blades on the hydrodynamic behavior of a Francis turbine, requiring reduced computational effort.
The case under study involves a medium specific speed Francis turbine manifesting structural resonance phenomena during operation at the rated power.
The proposed approach demonstrated its effectiveness in capturing the vortex shedding phenomena from both the fluid-dynamical and spectral points of view. In particular, the spectral content of the signals, numerically acquired in the runner, showed good agreement with the experimental acoustic ones, identifying with good accuracy the vortex shedding frequency in a reduced computational time of approximately 200 CPU h in comparison with a transient simulation of the entire machine.
Moreover, the machine’s hydrodynamic behavior was investigated in depth, giving a detailed description of the main turbulent structures characterizing the fluid flow when operating close to the nominal discharge. In particular, it allowed us to determine the existence of two interblade vortexes and the causes of the 3D development of the secondary vortex.
Although a more simplified numerical model could be built by reconducting the 3D machine geometry into a 2D model, the proposed numerical approach represents a compromise between the computational effort and the result accuracy. Hence, it represents a useful tool to be adopted in the preliminary design phase. Indeed, thanks to this approach, von Karman vortex shedding could be also captured at off-design conditions characterized by a more pronounced 3D flow, which cannot be captured by a 2D approach.


