Article

Heat Transfer Analysis of Damaged Shrouded High-Pressure Turbine Rotor Blades †

1
Department of Mechanical, Chemical and Materials Engineering, University of Cagliari, 09123 Cagliari, Italy
2
Rolls-Royce plc, Innovation Hub—Future Methods, Derby DE24 8BJ, UK
*
Author to whom correspondence should be addressed.
This manuscript is an extended version of the ETC2023-321 meeting paper published in the Proceeding of the 15th European Turbomachinery Conference, Budapest, Hungary, 24–28 April 2023.
Int. J. Turbomach. Propuls. Power 2023, 8(3), 24; https://doi.org/10.3390/ijtpp8030024
Submission received: 8 June 2023 / Revised: 17 July 2023 / Accepted: 21 July 2023 / Published: 1 August 2023

Abstract

:
Due to the increasingly high turbine inlet temperatures, heat transfer analysis is now, more than ever, a vital part of the design and optimization of high-pressure turbine rotor blades of a modern jet engine. The present study aimed to find out how shape deviation and in-service deterioration affect heat exchange patterns on the rotor blade. The rotor geometries used for this analysis are represented by a set of high-resolution 3D structured light scans of blades with the same number of in-service hours. An automatic meshing technique was employed to generate high-resolution meshes directly on the scanned rotor geometries, which captured all the surface features with high fidelity. Steady-state 3D RANS flow simulations with a k-ω SST turbulence model were conducted on a one-and-a-half stage computational domain of the scanned geometries. First, the distribution of the heat transfer coefficient was calculated for each blade; then, a correlation was sought between the heat transfer coefficient and parametrized shape deviation, to assess the impact of each parameter on HTC levels.

1. Introduction

To achieve high cycle efficiencies and to maximize power outputs, modern gas turbine engines employ increasingly high turbine inlet temperatures, exceeding 2000 K [1]. These temperatures are significantly higher than the metal’s melting point, which is around 1400 K [2]. A prolonged overheating of the blade surface, even by a relatively low value in the order of the tens of Kelvins, can lead to a dramatic acceleration of thermal barrier coating (TBC) erosion and melting of the metal alloy. High-pressure turbine (HPT) rotors are known to experience the most arduous thermal conditions, particularly towards the tip region [3]. Higher-than-nominal temperatures may accelerate the creep process locally [4], and have been shown to degrade the metal alloy on a microstructural level [5]. For these reasons, the temperature of the HP components must be managed carefully through the use of sophisticated internal and external cooling mechanisms. The amount of coolant that is injected must be kept to a minimum, to limit mixing losses and overall cycle losses due to the compressor bleed. Therefore, the heat transfer systems need to be highly efficient and finely optimized to fulfil their purpose.
These systems are conceived around the nominal “running” geometries, and a set of operating conditions (usually takeoff and cruise), where they operate at peak performance. There are, however, a number of factors that may lead to deviations from the nominal. These include geometric modifications due to manufacturing variations [6,7], defects and handling damage, fouling near the film-cooling holes, as well as variations in operating conditions such as outboard traverse bias [
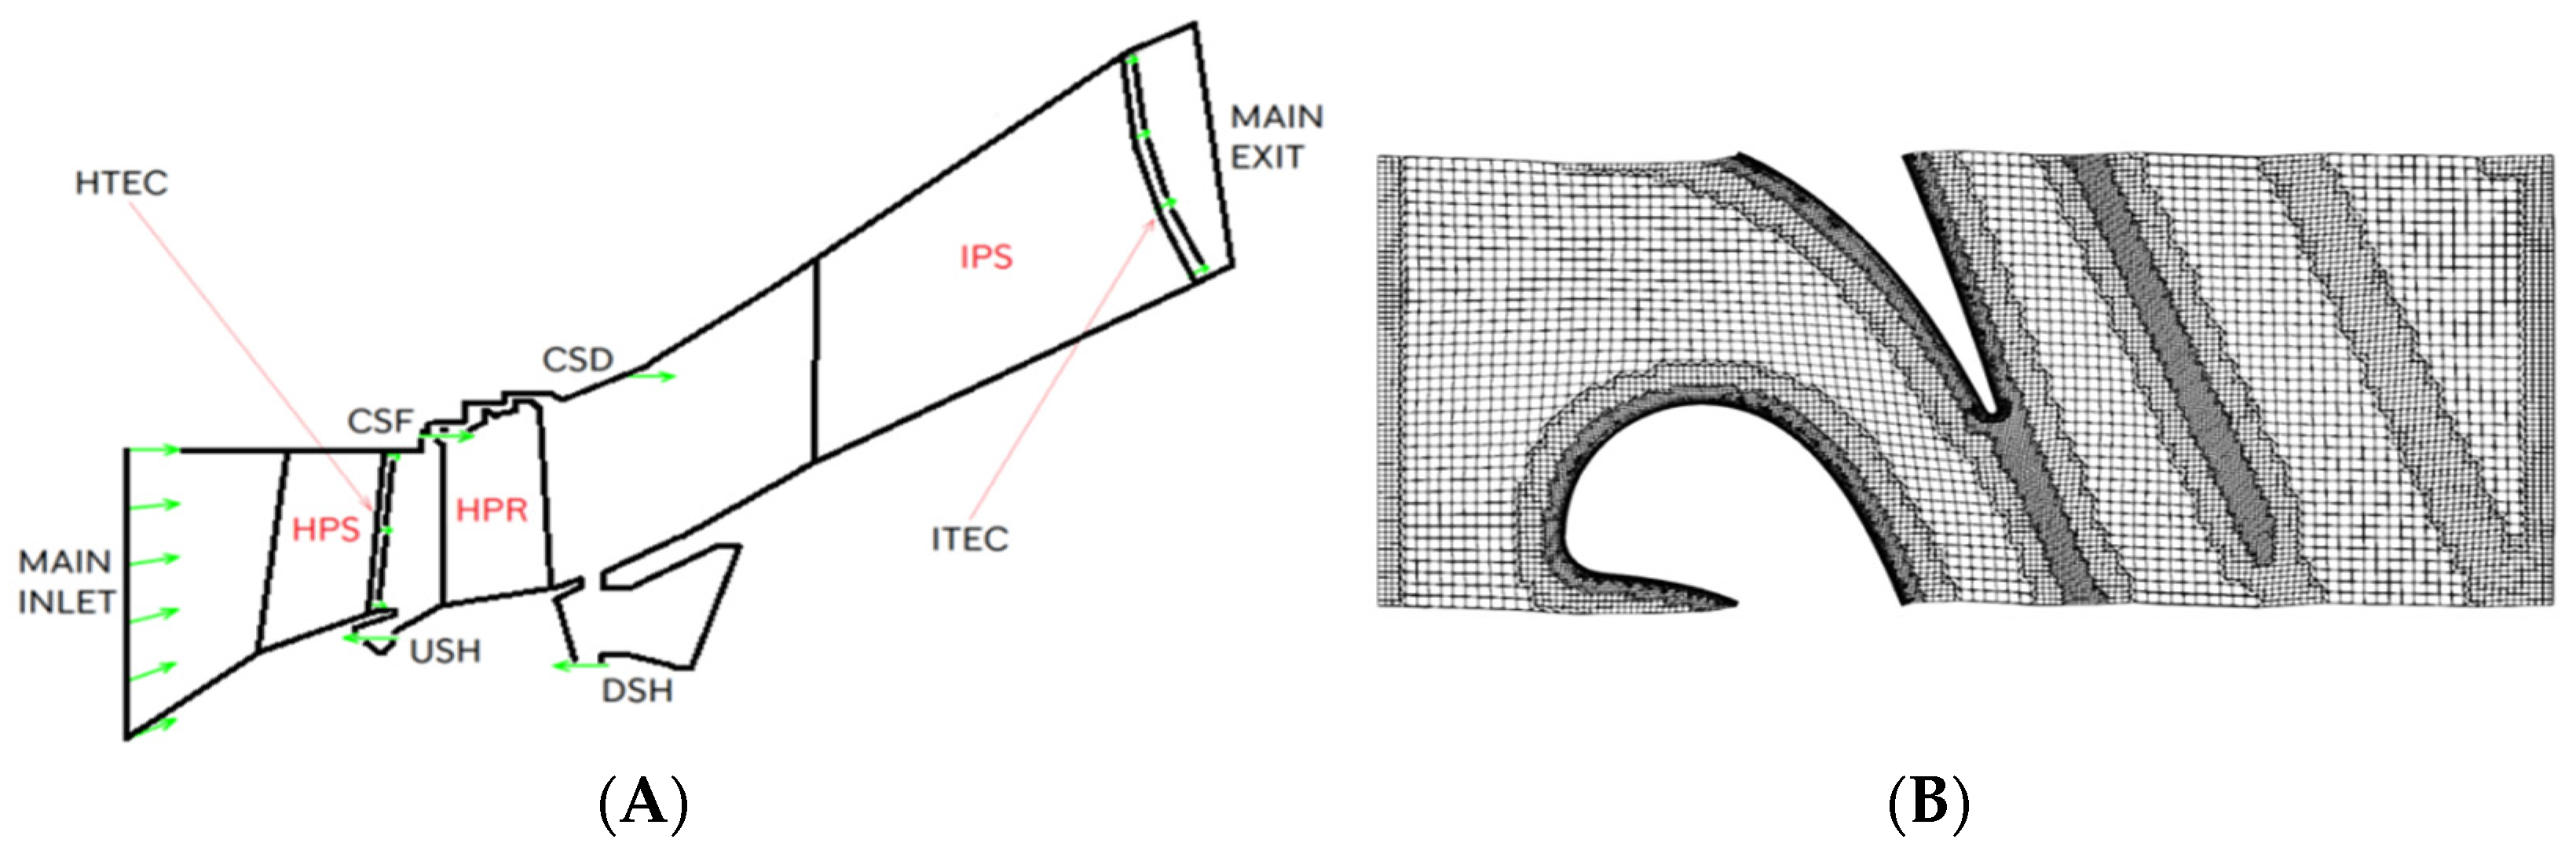
8], or engine over-throttling due to an overall performance deficit. The ‘aim’ of the present analysis was to study the correlation between the geometric deviation from the design intent and the distribution of surface heat transfer coefficient, for a large set of in-service shrouded HP turbine rotor blades of a modern jet engine resulting from high-resolution 3D-structured light optical scans. Thermal results were obtained through the use of a CFD methodology published by Maffulli and He (Maffulli and He, 2013, 2014), which calculates the heat transfer coefficient (HTC) by fitting a quadratic relation between the local wall temperature and heat flux. This technique is described in further detail in the Methodology section of this paper. This three-point non-linear fitting process requires three CFD simulations of the flow around the same blade geometry, with prescribed wall temperatures. Previous work [9] has focused on studying the correlation between aerodynamic efficiency loss and parametrized geometric deviation, and understanding the main loss mechanisms that characterize the flow field around in-service HP turbine blades. The objective of this analysis was to determine whether in-service deterioration, by virtue of inducing a modification in the geometry of the blades and the flow conditions, can cause an increase in the heat transfer coefficient in critical areas such as the blade shroud, leading the blades to experience a consequential acceleration of their degradation process.

2. Methodology

2.1. Geometries

The rotor geometries considered for this analysis had a shrouded tip design. Compared with its unshrouded counterpart, the shrouded design (see Figure 1A) has its main advantage in the higher aerodynamic stage efficiency due to reduced tip leakages. However, this comes at a price: increased difficulty in cooling the shroud region [10]. A set of HP in-service shrouded rotor geometries are analyzed in the present study. The blades belonged to a single “test” engine that operated in an experimental rig beyond its normal life timeframe, with the intent of determining the modes and rate of deterioration.
This section presents a description of geometries and methods that have been used to quantify the amount of damage. The rotor domain of each individual case constituted a single circumferential repetition of the same geometry, to enable single-passage CFD analysis with periodic boundaries. All the blade-to-blade measurements described in this section were taken between two identical blades with an angular shift equal to the periodicity angle.
These geometries (see Figure 1B) were obtained through high-resolution blue-light scanning, carried out using GOM Metrology (GOM scans). The blades exhibited different degrees of in-service deterioration, commonly including elongation, twist, erosion, and local loss of the thermal barrier coating. On this set of blades, the most damage could be seen in the shroud region, with an increase in all the clearances (tip gaps and inter-platform gaps). Measurements taken in the shroud region of each blade were used to quantify the deformation of the shroud region. The measurements included the two tip clearances, T1, T2, and the three inter-platform shroud gaps, S1, S2, and S3max, as depicted in Figure 2. On this set of scans, a V-shaped opening could be observed in the rear half of the platform region. To quantify the extent of this opening on each blade, the inter-platform gap distance was measured throughout all the rear half portion of the shroud (between the dashed lines in Figure 2B), and the maximum distance value is exported as S3max. Conversely, S1 and S2 shroud gap measurements were taken for all blades at two fixed axial positions. T1 and T2 were measured as the radial distances between the tip of the respective fin and the design intent casing at the top center position. The relative orientation of the shroud fins in Figure 2B also indicates that the typical scan displays a twist of the platform with respect to the design intent geometry. This counter-clockwise twist was, in part, responsible for the increase in shroud gap, as discussed in a previous study [9]. To quantify this, a parameter called the “shroud angle” was measured on all the blades as the angle formed by the shroud gap mean line with the axial direction. To quantify elongation, the blade radius at three points, R1, R2, and R3, on the upper face of the shroud platform was measured, as shown in Figure 2B.
Finally, the volume of the rear half of the inter-platform shroud gap was measured directly on the computational grids by calculating the volume of the mesh in between the two neighboring shroud platforms. In order to do so, three points, R1, R2, and R3, and the shroud angle on each blade, were used as a reference to place a cuboid in the gap region. The cuboid includes the gap space and the side platform metal from two neighboring blades. The volume occupied by the fluid mesh within the cuboid was then calculated in the Paraview-based proprietary Rolls-Royce software SS02. This measurement is proportional to the volume of metal that was lost to erosion in the rear shroud gap region (between dashed lines in Figure 2B). Table 1 reports all the parameters used to quantify geometric deviation in the present analysis.

2.2. CFD Modelling Technique

The computational domain used in the present study was a one-and-a-half stage comprising an HP stator, HP rotor, and IP stator, as shown in Figure 3A. CFD simulations were conducted on various combinations of this computational domain where, for each case, the rotor blade (HPR in Figure 3A) was represented by a different in-service geometry. The case with the design intent rotor geometry was also simulated to serve as a reference. The stator geometries (HPS, IPS) were, in every case, the design intents. Prior to meshing, a cold-to-hot transformation was applied to the geometries, in order to scale them to running/operational conditions. This transformation included an axial translation and 3D scaling by three different (x, y, and z) factors. The HP stator (HPS) and HP rotor (HPR) were fitted with source terms called “strip models” to surrogate the presence of multiple rows of cooling holes ejecting coolant from the internal cooling circuit. Both stator domains presented cooling flow slots at the trailing edges. The rotor domain also included the front and rear hub cavities, with their respective leakage inflows (USH and DSH). Casing upstream (CSF) and downstream (CSD) leakages were also included in the model. The three rows were connected using mixing-plane interfaces.
Standard practice for the CFD meshing of turbine domains in Rolls-Royce is to use the in-house tool PADRAM (Parametric Design and Rapid Meshing) [11], a tool that enables the rapid generation of high-quality meshes using templates, as well as the deformation of existing geometries using a rich set of parameters. The two stator domains are meshed in PADRAM with an H-O-H multi-block structured approach, with a process requiring only a few seconds to complete. Conversely, BOXER [12] is adopted for meshing the rotor domains in all cases, with an octree-based unstructured approach. This enables the degraded surfaces to be meshed directly, thus capturing all the small-scale surface features that characterize the scanned geometries. Twenty structured prismatic layers are generated on the wall surfaces. Different mesh refinement settings are used in BOXER to locally increase mesh density in critical areas such as the shroud, TE, cavities, and wake regions. A solution from a preliminary CFD run was used to identify the approximate physical location (within the rotor domain volume) of the main flow features such as the wake, cavity flows, leakage flows, and main vortical structures. Once these features were located, the domain was re-meshed with “refinement shells” positioned at each location, to locally refine the mesh for better resolution of the flow features. On average, the BOXER rotor meshes have 35 million elements. The meshing process is executed automatically on all the blades through a script. Figure 3B shows a section of the BOXER mesh on the design intent rotor geometry. The complete multi-row CFD domain mesh has an average of approximately 40 million elements. A verification study for this modelling technique was carried out previously [9], and as such is omitted here.
Three-dimensional steady-state RANS simulations of the compressible flow were carried out using Rolls-Royce’s proprietary finite volume solver HYDRA [13], with k-ω SST turbulence modelling and an implicit time-marching scheme. Convergence of the CFD simulations was monitored both in terms of residuals of the momentum equations (converged for R ≤ 10−12 and a drop 4 orders of magnitude relative to the initial values) and the stabilization of the quantities of interest. Boundary conditions used for the present analysis are representative of the engine’s “cruise” operating point. One-dimensional total pressure and total temperature radial distributions are specified at the HP stator inlet. The secondary inlets shown in Figure 3A (USH, DSH, CSF, CSD, HTEC, and ITEC), with green arrows fitted with prescribed mass inflow boundary conditions. A non-reflective outflow boundary condition was assigned to the IP stator exit, where a one-dimensional radial distribution of static pressure was specified. In order to collect information on the isentropic stage efficiency, monitors were placed on the flow inlets and exits, as shown in Figure 3A, and at the exit boundary of the HP rotor domain. Each monitor was used to obtain the converged values of mass flow and total enthalpy, the latter being calculated by mass-averaging the total pressure and temperature values. The formula used to compute stage efficiency is detailed in Equation (1), where the ideal total enthalpy exit term at the denominator is calculated as that resulting after the isentropic expansion of every gas stream to the total mass-averaged pressure of the main rotor exit. The gas model used was selected within HYDRA’s BS29 library [14] to be the kerosene–air exhaust gas mix. For this gas model, both the ratio of specific heats and the heat capacities of the gas varied non-linearly with temperature.
η = i = i n l e t s ( m ˙ H 0 ) i ( m ˙ H 0 ) o u t i = i n l e t s ( m ˙ H 0 ) i ( m ˙ H 0 _ i d e a l ) o u t

2.3. Heat Transfer Coefficient Calculation Technique

The expression that defines the heat transfer coefficient was derived from Newton’s Law of cooling, as given in Equation (2): the heat flux on the left-hand side is defined as the product of heat transfer coefficient “h” and the difference between wall temperature Tw and recovery temperature (or adiabatic wall temperature) Trec.
q ˙ = h ( T w T r e c )
Equation (2) can be used to estimate the heat transfer coefficient on a turbine blade, by conducting two CFD runs. The first one is the simulation of the flow, assuming adiabatic wall surfaces, which enables calculation of the recovery temperature distribution on the blade. The second one is a prescribed-wall-temperature run, where the blade’s surface temperature is specified as a boundary condition. This prescribed temperature distribution can be obtained by offsetting the recovery temperature distribution derived from the adiabatic run by a few tens of Kelvins. However, this method is based on the hypothesis that the heat transfer coefficient is independent from the wall temperature, which is often not very realistic [15,16]. A new three-point non-linear method was published by Maffulli and He [17] to account for the HTC’s dependency on the wall temperature by introducing a linear relation between the heat transfer and the temperature difference.
q ˙ = ( h 0 + j 1 T w ) ( T w T r e c )
q w 1 ˙ = ( h 0 + j 1 T w 1 ) ( T w 1 T r e c ) q w 2 ˙ = ( h 0 + j 1 T w 2 ) ( T w 2 T r e c )
This new formulation is reported in Equation (3), where the locally corrected HTC (with the “j” linear correction terms) value is represented by the first term on the right-hand side. To solve Equation (3) for the HTC, three CFD runs are necessary. The first one is still represented by the adiabatic case for initial calculations of the recovery temperature, and the remaining two consist of two separate prescribed-wall-temperature runs. The HTC distribution on the blade surfaces is then calculated by solving the system in Equation (4) where the flow solutions provide the values for the q and T terms, enabling calculation of the unknowns (h0 and j1). In the present study, the specified wall temperature boundary conditions for the two cases listed in Equation (4) are created by offsetting the recovery surface temperature calculated during the adiabatic run, by +50 K and −50 K, respectively. This quantity is chosen as a trade-off between the fitting accuracy (ideally requiring the smallest possible offset) and the stability of the fitting process, which, in turn, becomes less robust the closer together the two prescribed temperature values are.

3. Results

The scanned blades displayed notable differences from the nominal, both in terms of geometry and heat transfer, particularly in the shroud region. 
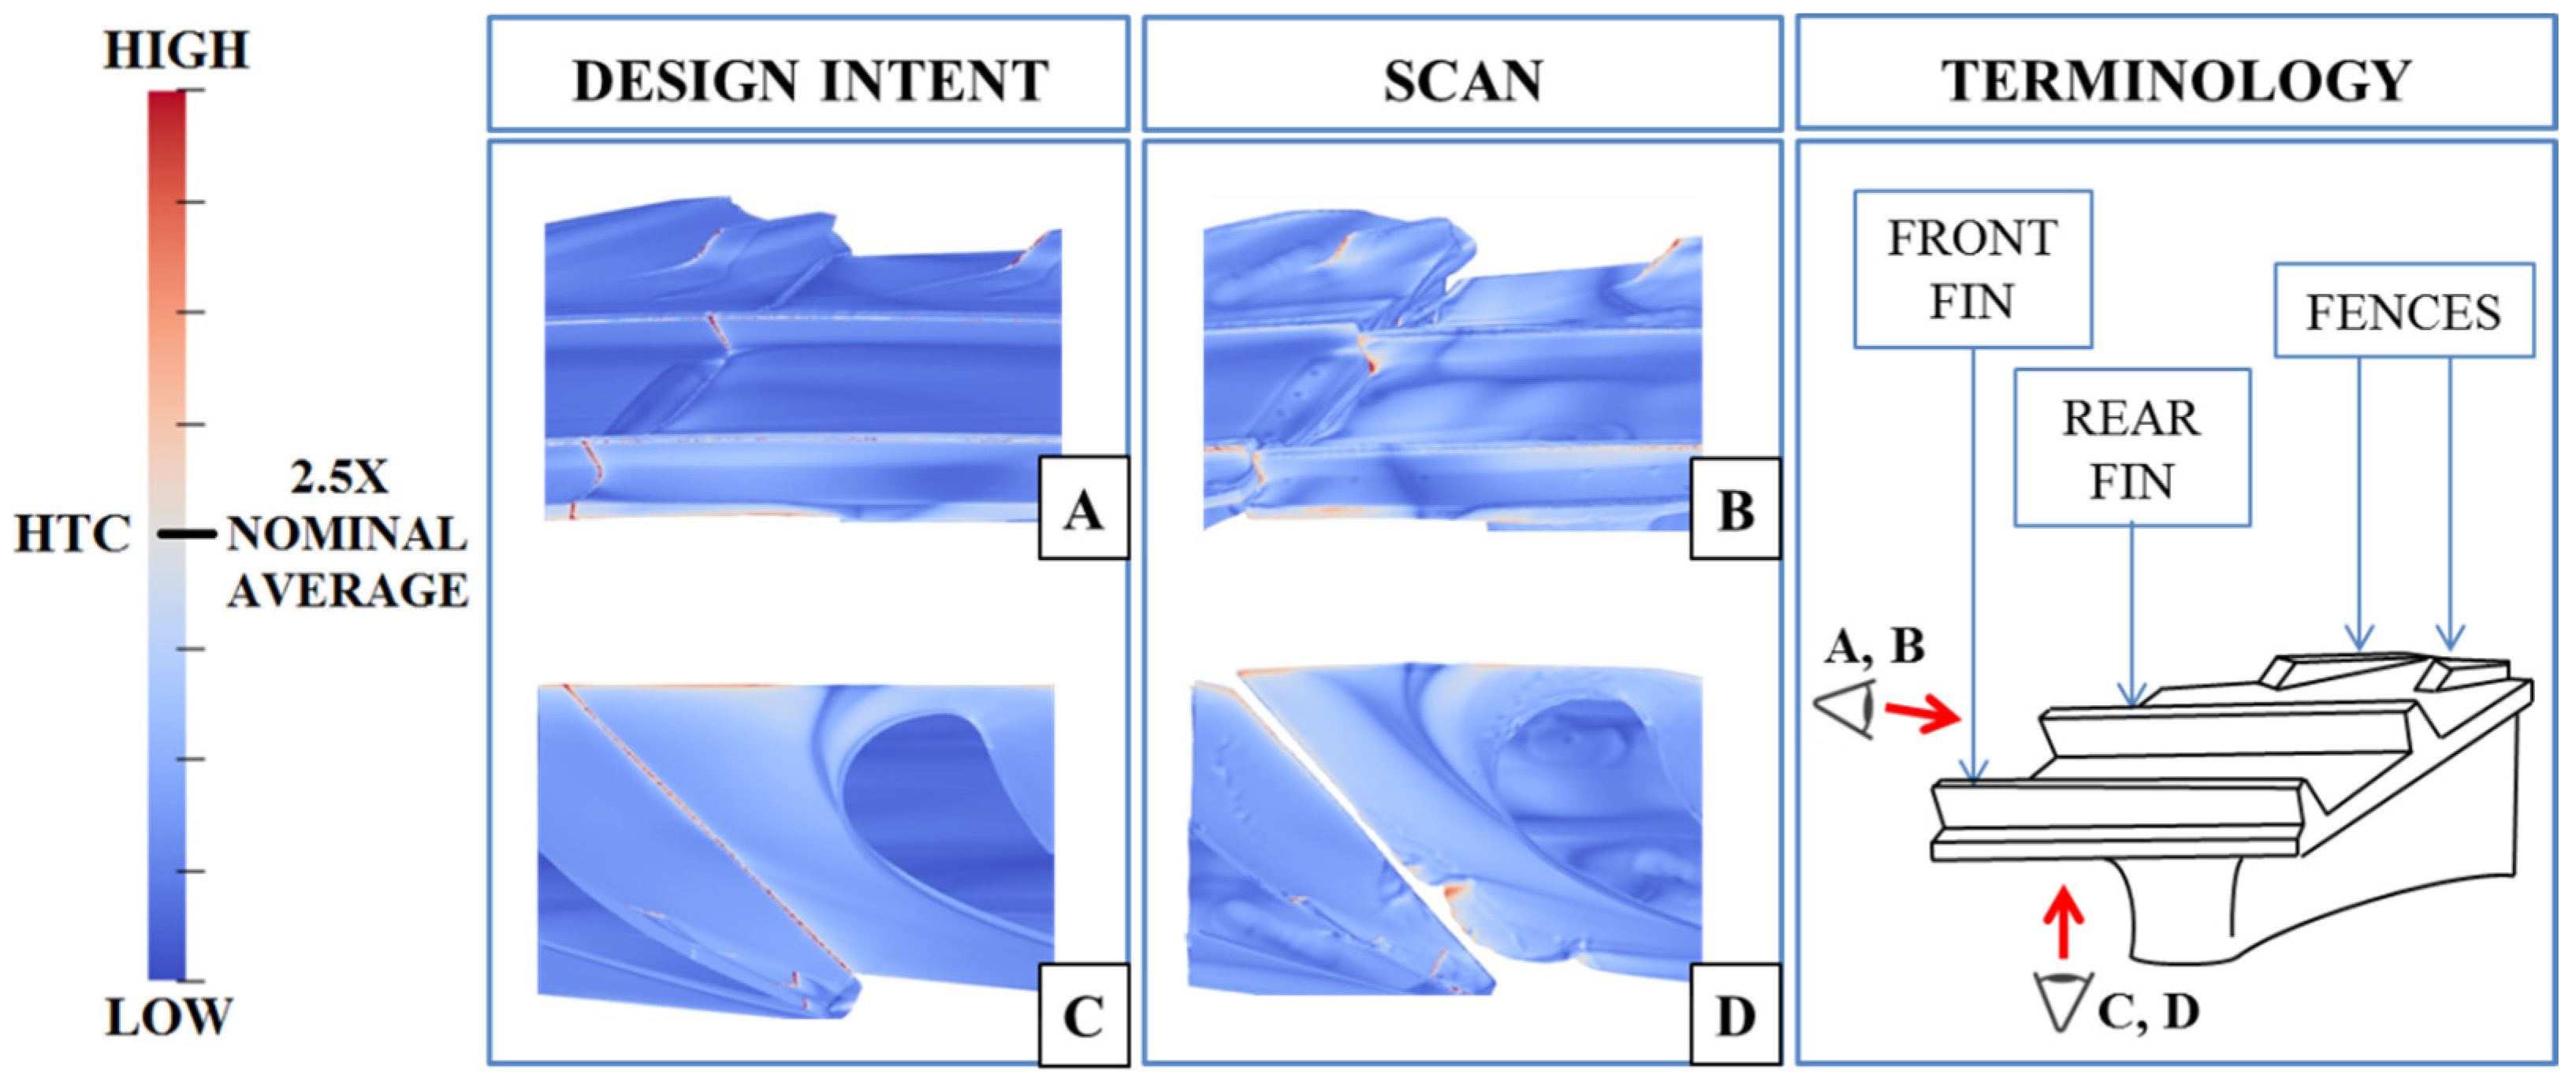
Figure 4 shows a comparison of the heat transfer patterns on the design intent rotor and on a typical in-service scans from the present set. By visual inspection of the HTC results from flow simulations carried out on the scans, it can be seen that higher-than-nominal heat transfer zones formed due to the deterioration and modification of the flow conditions. It can be seen in Figure 4A that the many sharp corners on the design intent geometry are marked as high-HTC areas, which is expected since heat transfer is usually higher in stagnation and sharp-turning points. The same corners appear to have been rounded off by erosion in the in-service component. In the baseline design, the inter-platform shroud gap is near zero, and there is no significant amount of flow passing through it.
The figures show that there was a notable overall increase in shroud HTC due to damage. It was found that the overall shroud HTC (calculated as the average HTC on the whole shroud region) on the scanned blades was approximately 11% higher than the corresponding nominal value. The damaged geometry shown in Figure 4B,D also displays a high-HTC patch in the rear part of the shroud gap, where erosion has carved the aforementioned V-shaped opening in the suction-side platform. This patch is clearly visible when looking at the shroud from below (Figure 4D). The contours of Figure 5 show the near-wall gas static temperatures for the same blades used in Figure 4. In the scanned rotor case (Figure 5B,D), the gas that comes in contact with the upper face of the shroud platform is 25 K to 50 K hotter with respect to the nominal case.
By looking at the contours on the lower face (Figure 5A,C), it can be seen that a stream of high-temperature gas from the main passage reaches and crosses the aft portion of the inter-platform shroud gap, where most of the erosion is taking place. This is confirmed by the streamline visualization of Figure 5E,F, showing the trajectories of the stream particles passing through the rear shroud gap opening. This particular region of the shroud sees a combination of high HTC and high near-wall gas temperatures, which can accelerate the erosion process.
The progressive erosion and formation of the opening can be seen from the views of the bottom face of the shroud displayed in Figure 6, where HTC contours are shown for three in-service blades named “A”, “B”, and “C”, representing the low, medium, and high HTC levels of the set, respectively. HTC levels increasingly worsen with damage, as the amount of hot passage flow that is able to cross the opening in the gap increases. This, for the current set of blades and flow conditions, indicates a degenerative process.
A linear correlation analysis was conducted to determine the effect of the parameters listed in Table 1 on shroud heat transfer. The metric used to quantify the level of HTC on the shroud platforms of the in-service blades is the fraction of surface area with an HTC value exceeding 2.5 times the average value on the nominal shroud. A linear correlation between this metric and the parameters in Table 1 was sought through multiple runs of a random-search algorithm. A linear combination variable was formulated with the set of coefficients achieving the best R2. The resulting best-fit linear combination called “SDVHTC” (shroud damage variable for HTC correlation) achieved good correlation (R2 = 0.8706) and is reported in Equation (5), where the terms that ended up having a near-zero (<0.01) coefficient are removed.
S D V H T C = 0.2 · S 1 + 0.39 · S 3 m a x + 0.04 · T 2 + 0.13 · R 1 + 0.24 · V
The results shown in Figure 7 indicate that there is significant linear correlation between the combination variable SDVHTC and the shroud surface area with high HTC. The values of the coefficients also indicate which parameters are more associated with the formation of high-HTC regions on the shroud surface. The maximum shroud gap amplitude in the rear half of the platform (S3max) and the volume loss (V) are the most important parameters with coefficients equal to 0.33 and 0.2, respectively. This is in agreement with what can be seen from the contours of Figure 6, where the highest HTC levels are associated with large amounts of erosion in the rear portion of the inter-platform shroud gap, both in terms of depth of the V-shaped opening and metal volume loss.
The scanned geometries used in the present analysis also suffered from different degrees of aerodynamic performance loss. Isentropic stage efficiency (Equation (1)) for the present set of blades was correlated against the shroud damage, employing the same parametrization used in the previous section for the HTC analysis. Likewise, a linear combination variable was constructed through a combination of the damage parameters with a set of best-fit coefficients, as reported in Equation (6).
S D V E T A = 0.04 · S 1 + 0.27 · S 2 + 0.03 · S 3 m a x + 0.03 · T 1 + 0.2 · T 2 + 0.01 · α +     0.08 · R 1 + 0.06 · R 2 + 0.24 · R 3 + 0.04 · V
Figure 8 presents the distribution of isentropic stage efficiency for the scanned geometries as a function of the “SDVETA” variable. Similarly to what was observed with the HTC correlation study, there was significant correlation between the variable SDVETA and the isentropic stage efficiency loss with respect to the nominal, with an R2 of 0.754. In this case, however, the most relevant parameter to aerodynamic performance is the mid-chord shroud gap “S2”. This finding is in line with that observed in previous work conducted by the authors: a large pressure differential can be found at that particular position between the passage and top cavity flows. This creates a large amount of leakage through the inter-platform shroud gap, which is severely detrimental to aerodynamic performance. A more detailed description of this loss mechanism can be found in [9].
The trailing edge elongation, R3, and rear fin tip gap are also associated with a relatively high impact on efficiency for this set of blades. In contrast with what was presented in the previous section for heat transfer, it appears that the depth of the V-shaped opening (S3max parameter) has a low impact when looking at aerodynamic performance. In Figure 8, the points pertaining to the three blades, “A”, “B”, and “C”, shown in Figure 6 are also highlighted. It is interesting to note that the SDV combination variables (Figure 7 and Figure 8) rank these blades in the same order in terms of parametric damage vs. performance, indicating that a low aerodynamic performance is also associated with high heat transfer. It is hypothesized that the twisting of the blades is what causes the initial rotation of the shrouds, which, in turn, results in a wider inter-platform shroud gap. At that point, the blades that display the highest values of the heat transfer coefficient (HTC) are those where flow leaking through the gap was able to carve an opening in the sides of the platforms, through progressive erosion of the metal. The impact of blade twist, and its effect on the component’s aerodynamics, was assessed in a previous study [9]. A parameter expressing the amount of twist measured on the blades was included in the present work under the name of “shroud angle”. This represents the angle formed by the shroud platform with the machine axis, and this parameter is directly affected by the rotation (twisting) of the blade sections below the shroud. In the present study, it was found that the twist itself has a negligible impact on the HTC on the blade shroud, as demonstrated by the fact that the corresponding correlation coefficient was near-zero and was thus omitted in Equation (5).

4. Conclusions

This work represents the extended version of the paper presented by the authors at the 15th European Turbomachinery Conference (ETC15) in Budapest, Hungary [18].
A series of CFD simulations was conducted on a set of blue-light optical scans of in-service HP turbine rotor geometries from a modern jet engine, with the objective of identifying the damage modes that are associated with increased heat transfer in the shroud region. All the blades belonging to this set display overall higher (+11%) HTC values on the shroud when compared with the average value measured on the nominal shroud region. All the sharp corners originally present in the nominal design appear to have been rounded off in the in-service blades, as a result of erosion. Furthermore, significant HTC increases were observed locally, particularly in the shroud gap region. Shroud damage levels on the present set of blades have been measured in terms of a set of parameters including shroud gaps, tip gaps, elongation, and volumetric loss. A correlation analysis was then conducted to assess the impact of each parameter on HTC levels, intended as the fraction of shroud surface area with an HTC 2.5 times greater than the average value on the nominal shroud surface. A linear correlation between this measure and the set of parameters was sought, obtaining an R2 of 0.871, with the largest coefficients being those pertaining to the amplitude of the shroud gap in the rear platform part, and the metal volume loss due to erosion in the same region. A notable isentropic stage efficiency loss was observed with a 1% variability within the set. A linear correlation study was conducted between efficiency and the set of parameters, achieving an R2 of 0.754, with the highest-ranking coefficient being the S2 inter-platform shroud gap at the mid-chord. This finding is in line with the results of previous work conducted by the authors on a similar set of scanned geometries.
It is interesting to note that the thermal and aerodynamic aspects are markedly sensitive to damage in different areas of the shroud: the mid-chord gap for the aerodynamic performance and maximum rear platform gap for the thermal exchange performance. It is hypothesized that, due to an initial twist of the shroud platforms due to blade turning, the blades experience an increase in inter-platform shroud gap. Consequently, a stream of hot passage gas is able to cross the shroud gap, reaching the top cavity. Over time, the leakage flow through the rear portion of the shroud gap carves a V-shaped opening in the suction side of the shroud platform, exposing a larger surface of the internal alloy to the erosion process. Analysis of the CFD results revealed that an increase in the size of the opening causes higher local HTC values, which further increases heat exchange and can lead to degenerative acceleration of the erosion process. This study focused on a specific industrial case; however, it describes a process that can be found in modern jet engine turbines in general, by virtue of the extremely high turbine entry temperatures that characterize these engines, and the tendency of modern blades to experience a steep loss in performance during real-world operation.
Due to multi-disciplinary interactions between teams within Rolls-Royce plc, the authors have discovered that many HPT blades from different engines were experiencing what can be defined as a “vicious circle”, where deterioration of the HPT blades (deformation and erosion) translates into even faster deterioration rates during the upcoming operation cycles of the engine. For instance, initial geometric deviations from the nominal of the components can cause aerodynamic performance loss (and thus, a thrust deficit), which is compensated by over-throttling the engine to achieve the desired thrust, but this causes higher temperatures on the hot end, which accelerates deterioration rates by causing further damage and geometric deviation. The trigger of this aero-thermal deterioration mechanism was identified to be the initial blade twist below the shroud platform; therefore, it is recommended to periodically monitor this parameter during service. This could be achieved with less-invasive techniques (e.g., borescope analysis). The temperature distribution provided by the combustor also plays a key role in this phenomenon. By shifting the distribution peak towards the inner radii, the temperature of the flow streams that end up crossing the shroud gap may be reduced. This will be the subject of further optimization studies.

Author Contributions

Conceptualization, M.C., S.S. and T.G.; methodology, M.C., S.S. and T.G.; software, S.S.; validation, M.C., S.S. and T.G.; formal analysis, M.C., S.S. and T.G.; investigation, M.C.; resources, S.S. and T.G.; data curation, M.C.; writing—original draft preparation, M.C.; writing—review and editing, M.C., S.S. and T.G.; visualization, M.C.; supervision, S.S. and T.G.; project administration, S.S. and T.G.; funding acquisition, S.S. and T.G. All authors have read and agreed to the published version of the manuscript.

Funding

This work was conducted within the framework of the NEXTAIR project. The NEXTAIR project has received funding from the European Union’s Horizon Europe research and innovation programme under grant agreement No 101056732. Views and opinions expressed are however those of the author(s) only and do not necessarily reflect those of the European Union. Neither the European Union nor the granting authority can be held responsible for them.

Data Availability Statement

The data is protected because of the industrial relevance. For inquiries about the data presented in this paper, please contact the corresponding author.

Acknowledgments

The authors would like to thank Rolls-Royce plc for their support and permission to publish this work.

Conflicts of Interest

The authors declare no conflict of interest.

Nomenclature

CSDCasing cooling downstream to rotor blade
CSFCasing cooling upstream to rotor blade
DSHHub cavity inflow downstream to rotor blade
HPRHigh-pressure rotor
HPSHigh-pressure stator
HTECHPS trailing edge cooling slot
IPSIntermediate-pressure stator
ITECIPS trailing edge cooling slot
LE, TELeading edge, trailing edge
PS, SSPressure side, suction side
RANSReynolds-averaged Navier–Stokes
TBCThermal barrier coating
USHHub cavity inflow upstream to the rotor blade

References

  1. Bunker, R.S. Integration of New Aero-Thermal and Combustion Technologies with Long-Term Design Philosophies for Gas Turbine Engines. In Proceedings of the US-Ukrainian Workshop on Innovative Combustion and Aerothermal Technologies in Energy and Power Systems, Kiev, Ukraine, 21–26 May 2001. [Google Scholar]
  2. Harvey, N.W. Aerothermal Implications of shroudless and shrouded blades. In VKI LS 2004-02, Turbine Blade Tip Design and Tip Clearance Treatment; von Karman Institute for Fluid Dynamics: Rhode-St-Genese, Belgium, 2004; ISBN 2-930389-51-6. [Google Scholar]
  3. Colón, S.; Ricklick, M.; Nagy, D.; Lafleur, A. Geometric Effects of Thermal Barrier Coating Damage on Turbine Blade Temperatures. In Proceedings of the ASME Turbo Expo: Turbomachinery Technical Conference and Exposition, Phoenix, AZ, USA, 17–21 June 2019. [Google Scholar]
  4. Jarrett, A.; Erukulla, V.V.; Koul, A.K. Untwist Creep Analysis of Gas Turbine First Stage Blade. In Proceedings of the ASME Turbo Expo: Turbomachinery Technical Conference and Exposition, Phoenix, AZ, USA, 17–21 June 2019. [Google Scholar]
  5. Guo, X.; Zheng, W.; Xiao, C.; Li, L.; Antonov, S.; Zheng, Y.; Feng, Q.C. Evaluation of microstructural degradation in a failed gas turbine blade due to overheating. Eng. Fail. Anal. 2019, 103, 308–318. [Google Scholar] [CrossRef]
  6. Kamenik, J.; Shahpar, S.; Keane, A.J.; Hogner, L.; Meyer, M.; Toal, D.J.J. Modelling and Impact of High-pressure Turbine Blade Trailing Edge Film Cooling Hole Variations. In Proceedings of the AIAA Scitech 2020 Forum, Orlando, FL, USA, 6-10 January 2020. [Google Scholar]
  7. Sidwell, V. On the Impact of Variability and Assembly on Turbine Blade Cooling Flow and Oxidation Life. Ph.D. Thesis, Massachusetts Institute of Technology, Cambridge, MA, USA, 2004. [Google Scholar]
  8. Jean-Roch, J.; Nor, N.A.M. A Methodology and Case Study of Outboard Traverse Flame Detection on Aeroderivative Gas Turbines. In Proceedings of the ASME Turbo Expo: Turbomachinery Technical Conference and Exposition, Phoenix, AZ, USA, 17–21 June 2019. [Google Scholar]
  9. Carta, M.; Ghisu, T.; Shahpar, S. High-Fidelity CFD Analysis of In-Serviced Shrouded High-Pressure Turbine Rotor Blades. J. Turbomach. 2022, 144, 121001. [Google Scholar] [CrossRef]
  10. Glezer, B.; Arts, T. Thermal-mechanical design factors affecting turbine blade tip clearance. In VKI LS 2004-02, Turbine Blade Tip Design and Tip Clearance Treatment; von Karman Institute for Fluid Dynamics: Rhode-St-Genese, Belgium, 2004; pp. 1–23. ISBN 2-930389-51-6. [Google Scholar]
  11. Shahpar, S.; Lapworth, L. PADRAM: Parametric Design and Rapid Meshing System for Turbomachinery Optimisation, GT2003-38698. In Proceedings of the ASME Turbo Expo and International Joint Power Generation Conference, Atlanta, GA, USA, 16–19 June 2003; pp. 579–590. [Google Scholar]
  12. Demargne, A.J.; Evans, R.O.; Tiller, P.J.; Dawes, W.N. Practical and Reliable Mesh Generation for Complex, Real World Geometries. In Proceedings of the AIAA 52nd Aerospace Sciences Meeting, National Harbor, MD, USA, 13–17 January 2014. [Google Scholar]
  13. Lapworth, L. Hydra CFD: A Framework for Collaborative CFD Development. In Proceedings of the International Conference on Scientific and Engineering Computation (IC-SEC), Singapore, 30 June–2 July 2004. [Google Scholar]
  14. Cobell, P.A. Computer Programmers Guide for The BS09/BS29—RRAP Compatible Thermodynamic Subroutines—Issue 7; CUG BS09; Rolls-Royce plc Internal Report; Rolls-Royce plc.: Derby, UK, 1996. [Google Scholar]
  15. Fitt, A.; Forth, C.; Robertson, B.; Jones, T. Temperature Ratio Effects in Compressible Turbulent Boundary Layers. Int. J. Heat Mass Transf. 1986, 29, 159–164. [Google Scholar] [CrossRef]
  16. Kays, W.; Crawford, M. Convective Heat and Mass Transfer, 2nd ed.; Tata Mc Graw Hill Publishing Co., Ltd.: New York City, NY, USA, 1983. [Google Scholar]
  17. Maffulli, R.; He, L. Dependence of External Heat Transfer Coefficient and Aerodynamics on Wall Temperature For 3D Turbine Blade Passage—GT2014-26763. In Proceedings of the Asme Turbo Expo, Dusseldorf, Germany, 16–20 June 2014. [Google Scholar]
  18. Carta, M.; Ghisu, T.; Shahpar, S. Heat Transfer Analysis of Damaged Shrouded High-Pressure Turbine Rotor Blades. In Proceedings of the 15th European Conference on Turbomachinery Fluid Dynamics and Thermodynamics 2023, Budapest, Hungary, 24–28 April 2023; paper n. ETC2023-321. Available online: https://www.euroturbo.eu/publications/conference-proceedings-repository/ (accessed on 7 June 2023).
Figure 1. HP turbine rotor blades: nominal (A) and a blue-light scan (B) (pictures distorted).
Ijtpp 08 00024 g001
Figure 2. Representation of two neighboring shrouds from the front (A) and from the top (B). Measurement points of the shroud gaps. S1, S2, and S3, between the neighboring blades, tip clearances T1 and T2, the shroud angle, α, and the shroud platform radii R1, R2, and R3.
Ijtpp 08 00024 g002
Figure 3. Schematic representation of the 1 ½ stage computational domain with arrows indicating the flow inlets (A) acronyms are defined in the nomenclature section; a spanwise section view of the BOXER rotor mesh (B) (pictures distorted and not to scale).
Ijtpp 08 00024 g003
Figure 4. Comparison of the HTC contours on the design intent case (left) against the same contours on one of the scans (right), displaying the outer (A,B) and inner (C,D) surfaces of the shroud, where the blade has been sectioned off, to attain a full view of the shroud (pictures distorted).
Ijtpp 08 00024 g004
Figure 5. Comparison in terms of near-wall gas static temperatures on the design intent (A,C) and the same scan shown in (B,D)—trajectories of the flow particles crossing the shroud gap in the rear portion of the platform are also shown (E,F) (pictures distorted).
Ijtpp 08 00024 g005
Figure 6. Views of the shroud platform from below in three cases of low (A), medium (B), and high (C) HTC. The surface is colored by HTC value (pictures distorted).
Ijtpp 08 00024 g006
Figure 7. Distribution of the SDV combination variable against the fraction of the high-HTC shroud surface area of the scanned rotors. The trend-line and linearity score are also displayed in the chart. The three blades, A, B, and C, used in Figure 6 are highlighted.
Ijtpp 08 00024 g007
Figure 8. Distribution of the SDVETA combination variable against the isentropic stage efficiency values of the scanned rotors. The trend-line and linearity score are also displayed in the chart. The three blades, A, B, and C, used in Figure 6 are highlighted.
Ijtpp 08 00024 g008
Table 1. Damage parametrization.
ParameterDescription
S1Front inter-platform shroud gap
S2Middle inter-platform shroud gap
S3maxRear inter-platform maximum shroud gap
T1Front fin tip-to-casing clearance
T2Rear fin tip-to-casing clearance
αShroud angle with respect to the machine axis
R1Radius of the shroud platform in the front suction side corner
R2Radius of the shroud platform in the front pressure side corner
R3Radius of the shroud platform above the blade’s trailing edge
VVolume lost due to erosion
Disclaimer/Publisher’s Note: The statements, opinions and data contained in all publications are solely those of the individual author(s) and contributor(s) and not of MDPI and/or the editor(s). MDPI and/or the editor(s) disclaim responsibility for any injury to people or property resulting from any ideas, methods, instructions or products referred to in the content.

