We took the fan design point to be cruise, as this was the typical design condition for low fan pressure ratio commercial aircraft engines [
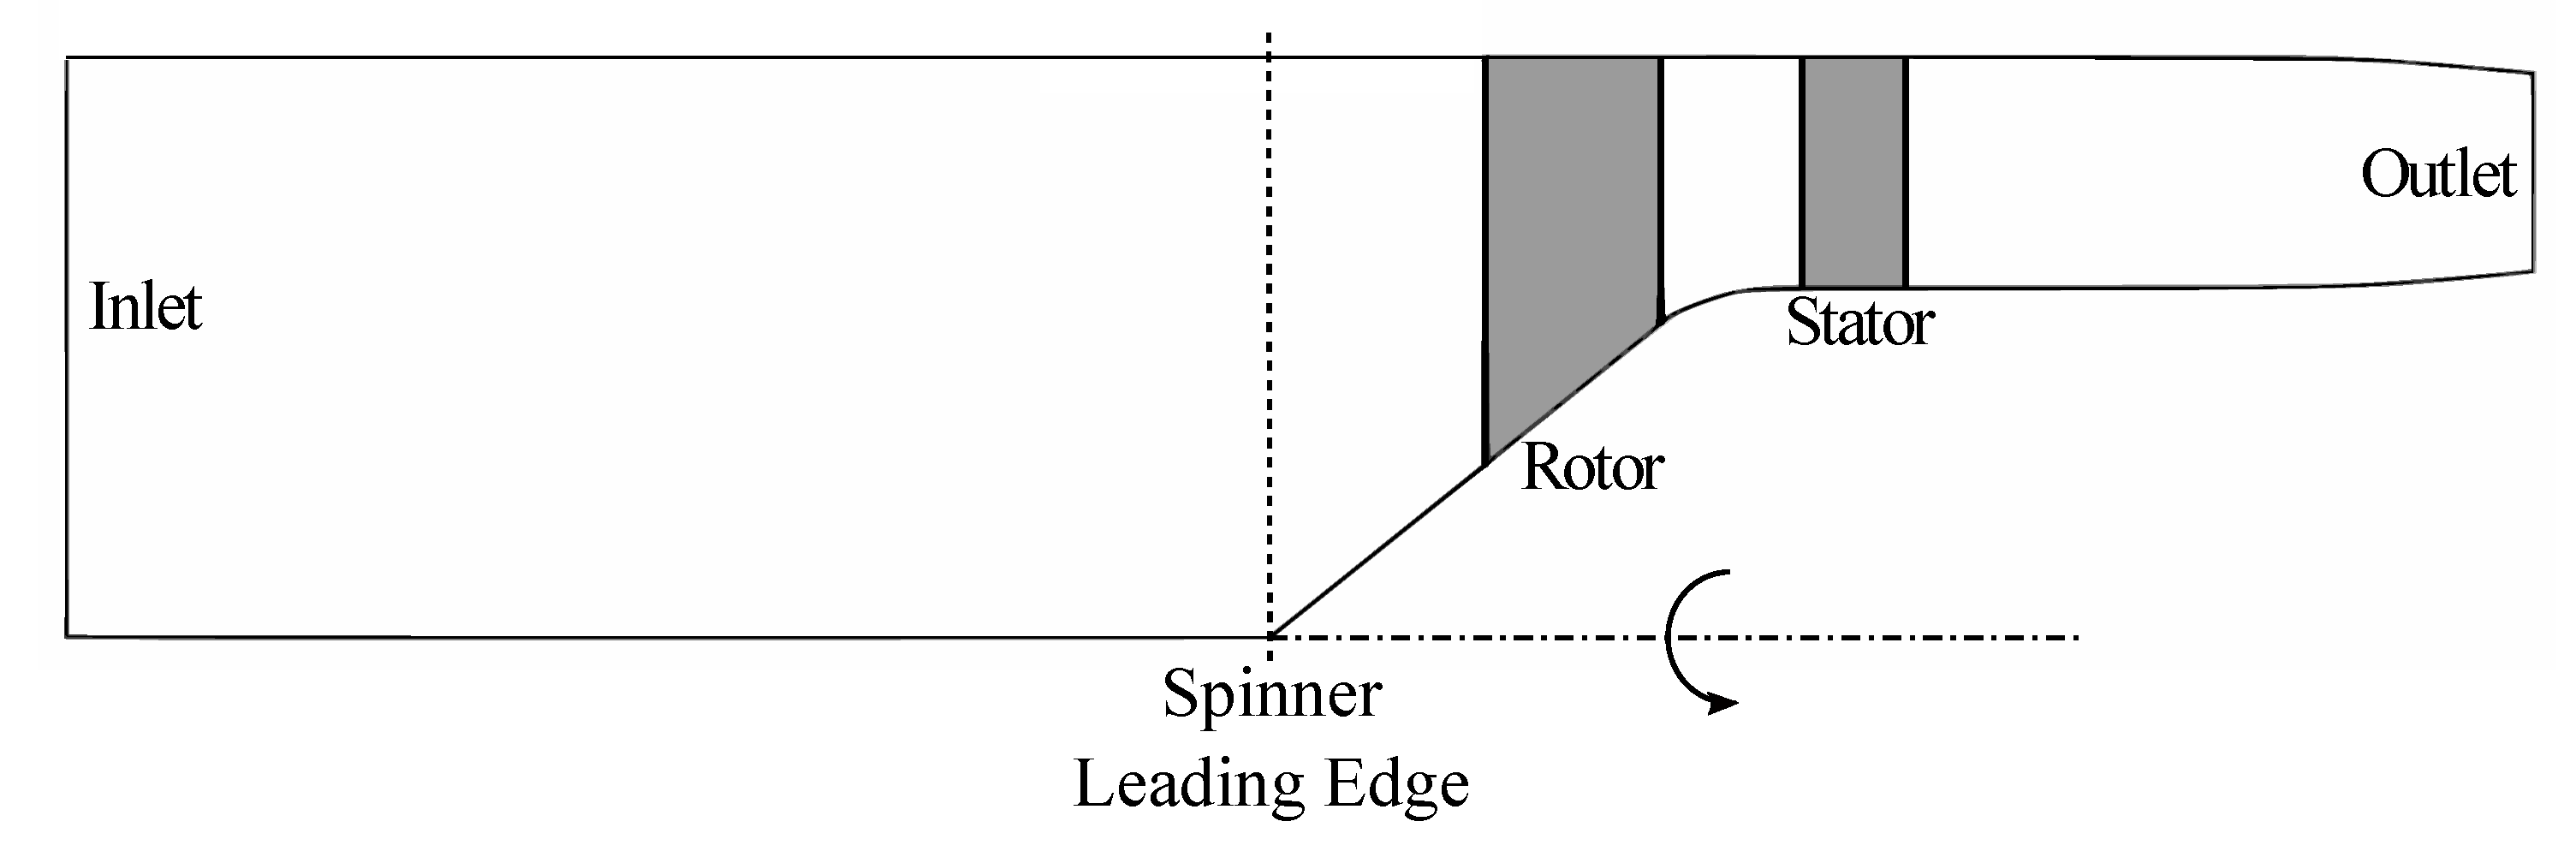
13], which are of increasing interest in modern design. The benefit of selecting this typical design condition was that this is usually where the designer will have the most information about the required performance. This condition requires the specification of a cruise altitude and flight Mach number. These are quantities an airframer would normally know and provide the information needed to find inlet stagnation quantities. We employed 1D analysis to determine the flow properties through the stage to meet the desired performance at cruise. Based on the resulting flow properties, as well as a series of assumptions and geometric constraints, the gas path was defined.
The fan pressure ratio and net thrust were required inputs. The input geometric parameters were the fan blade tip leading edge radius, rotor hub-to-tip ratio (
) at the leading edge, blade aspect ratios (
,
) based on the axial chords, axial distances upstream of, between, and downstream of the blade rows (
,
,
), nozzle contraction length (
), hub curvature length (
), and fractional tip radius change through the rotor (
). A diffusion factor was specified to determine the number of rotor and stator blades, or these can be directly specified. If an elliptical spinner nose was desired, the axial length of the spinner nose,
, was also needed and was specified as a fraction of a linear spinner nose length. The body force model was created to generate a set fan stagnation-to-stagnation pressure ratio at a corrected mass flow, which combined with the gas path geometry, achieved the desired thrust.
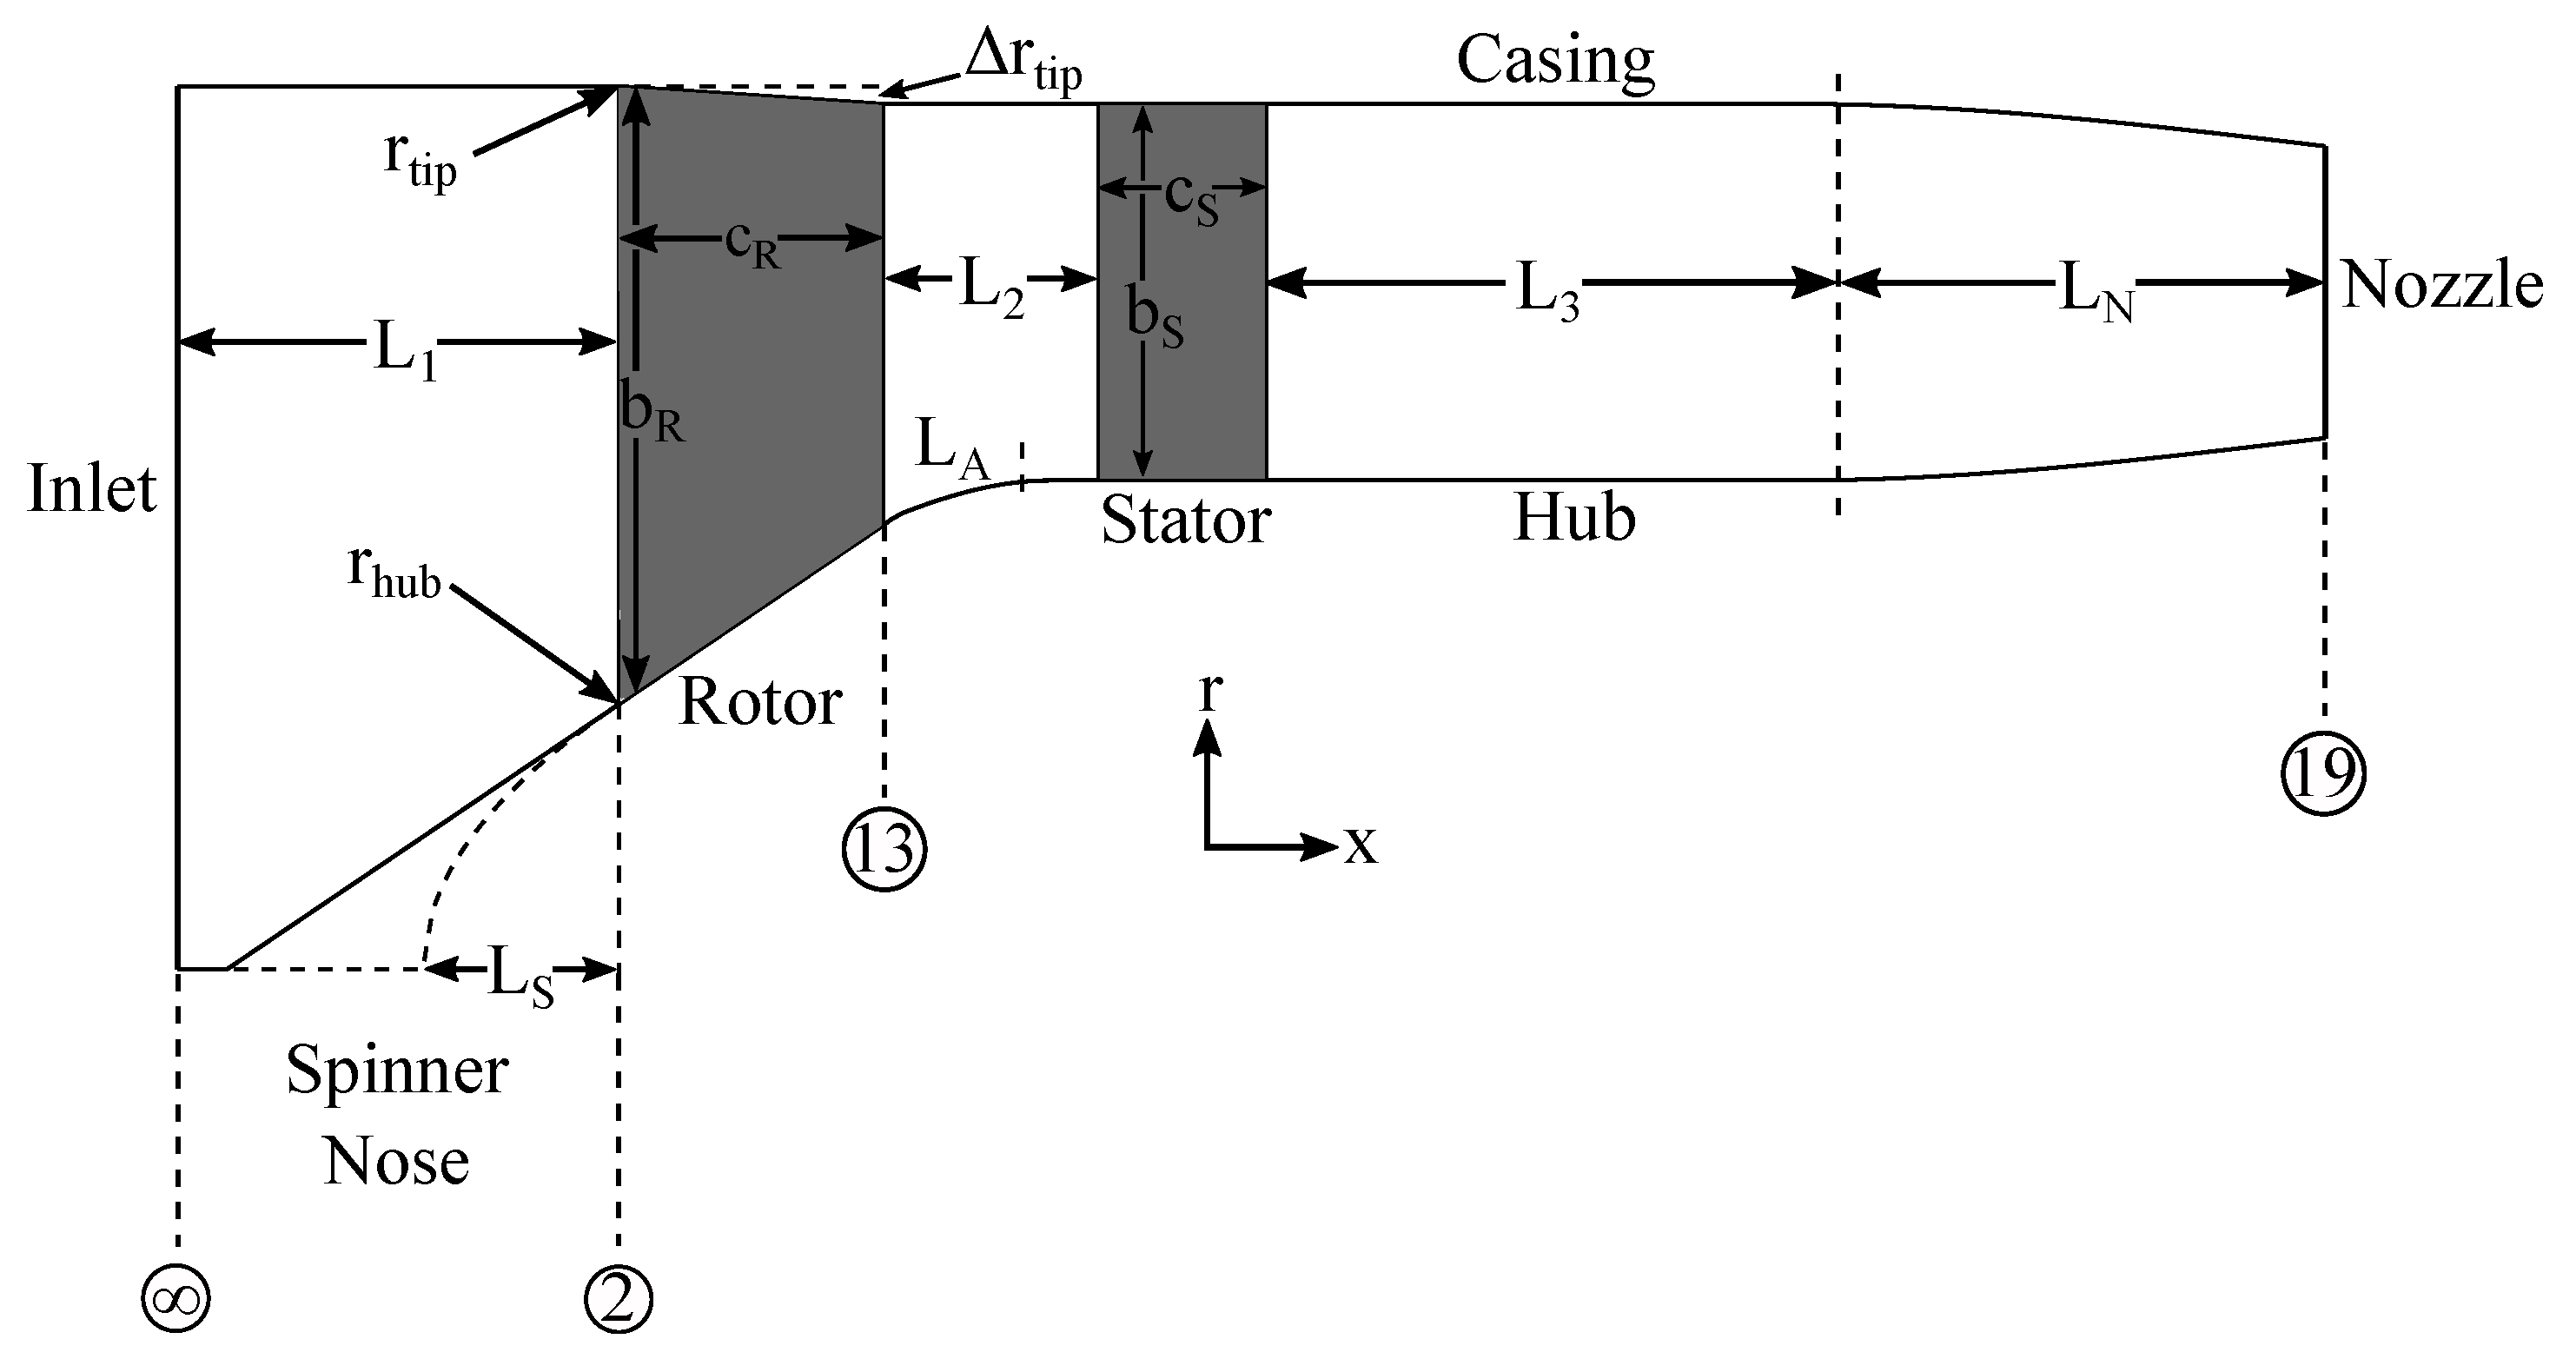
Figure 5 shows the generic meridional profile of the gas path and illustrates the definitions of the geometric parameters.
Assumption (1) is in practice not accurate at the rapidly contracting rotor hub and would also be expected to become less accurate near the tip as the fan pressure ratio and, thus, relative Mach numbers rise. It is later shown that for the fan design space of interest, over most of the span, the variation of axial velocity was less than 10% of the assumed value. From Assumption (2), we did not include a bifurcation into a core duct in the gas path.
At design, hub and casing boundary layers were thin and fully attached due to the high Reynolds numbers in practical engine fans, and thus, we assumed no changes in stagnation quantities up to the fan face; these were then set by the flight condition.
4.1. Stage Performance and Gas Path
Application of control volume analysis to the flow going through the engine yielded the standard expression for thrust:
where
F is thrust,
is the mass flow rate, and
A is the passage area. The thrust, flight velocity, and freestream static pressure were known at the outset, with the other quantities to be determined; this was done using a quasi-1D approach. Two cases could exist, depending on whether the exhaust nozzle was choked or not. The nozzle is choked if:
for air with specific heat ratio
. If the nozzle is choked, the nozzle exit static pressure is:
If the nozzle is not choked, the nozzle exit static pressure is equal to the atmospheric static pressure:
The nozzle velocity, assuming isentropic flow, is:
If the nozzle is choked, then
, and if it is unchoked, it is determined by:
If the flow is choked, the mass flow and nozzle area are then given by the simultaneous solution of Equation (
12) and the corrected flow per unit area equation applied at Station 19,
In Equation (
18), the stagnation quantities are the mass weighted averaged values. To keep the body force model as simple as possible, we designed for uniform spanwise work input so that the local values were everywhere equal to the mass weighted averages.
If the flow was unchoked, the mass flow rate was directly calculated from Equation (
12) since
. This along with the nozzle exit Mach number were used in Equation (
18) to determine the nozzle exit area.
The axial Mach number at the fan face (Station 2) was found from Equation (
18) given the fan inlet area (computed from the tip radius and hub-to-tip ratio) and the now known mass flow rate. This Mach number was then used to determine the static temperature at the fan face.
The assumption of equal leading and trailing edge axial velocities along with the selection of
allowed the rotor trailing edge area to be calculated. In doing so, we neglected the effect of swirl on the required rotor exit area; however, within the design space typically of interest, swirl angles will normally be well under
, and there is only a minor effect on the required passage area [
15].
The gas path shape through the rotor was generated using straight line hub and casing curves. This means that the axial velocity would vary within the blade row, but greatly simplified the generation of the gas path. A parameter, Y, which is the fraction of the fan leading edge span, set the amount of tip radius change through the rotor,
Downstream of the rotor, the casing radius was constant.
The slope of the hub through the rotor was set to meet the required decrease in passage area while keeping the leading and trailing edge axial velocities equal.
Downstream of the rotor trailing edge, the hub radius curved back towards axial over some desired fraction of the distance between rotor and stator (; the default value was ). The stator span was set to be constant along the chord. In reality, the removal of swirl would require a decrease in passage area, but by the same logic applied to the determination of the rotor trailing edge area, this effect is normally small.
The spinner length determined its shape. If the axial length was less than that of a straight line with the rotor hub slope extended to zero radius, then the spinner nose was assumed to be elliptical in shape. It matched the rotor hub slope downstream and extended to zero radius upstream with the tangent to the ellipse at the nose purely radial. Otherwise, a conical spinner was used with the rotor hub line extended directly down to zero radius.
4.2. Blade Performance and Camber
The rotor inlet velocity triangle at the tip, which was determined by the axial Mach number found using Equation (
18) and the relative Mach number found using Equation (
11), determined the rotation speed of the rotor blades.
A camber surface was needed for the body force model. Camber lines were determined at set span fractions; in the current approach, the hub, midspan, and tip were used. The camber surface was generated by fitting a 3D surface, which passed through these lines, as described in detail later in this section.
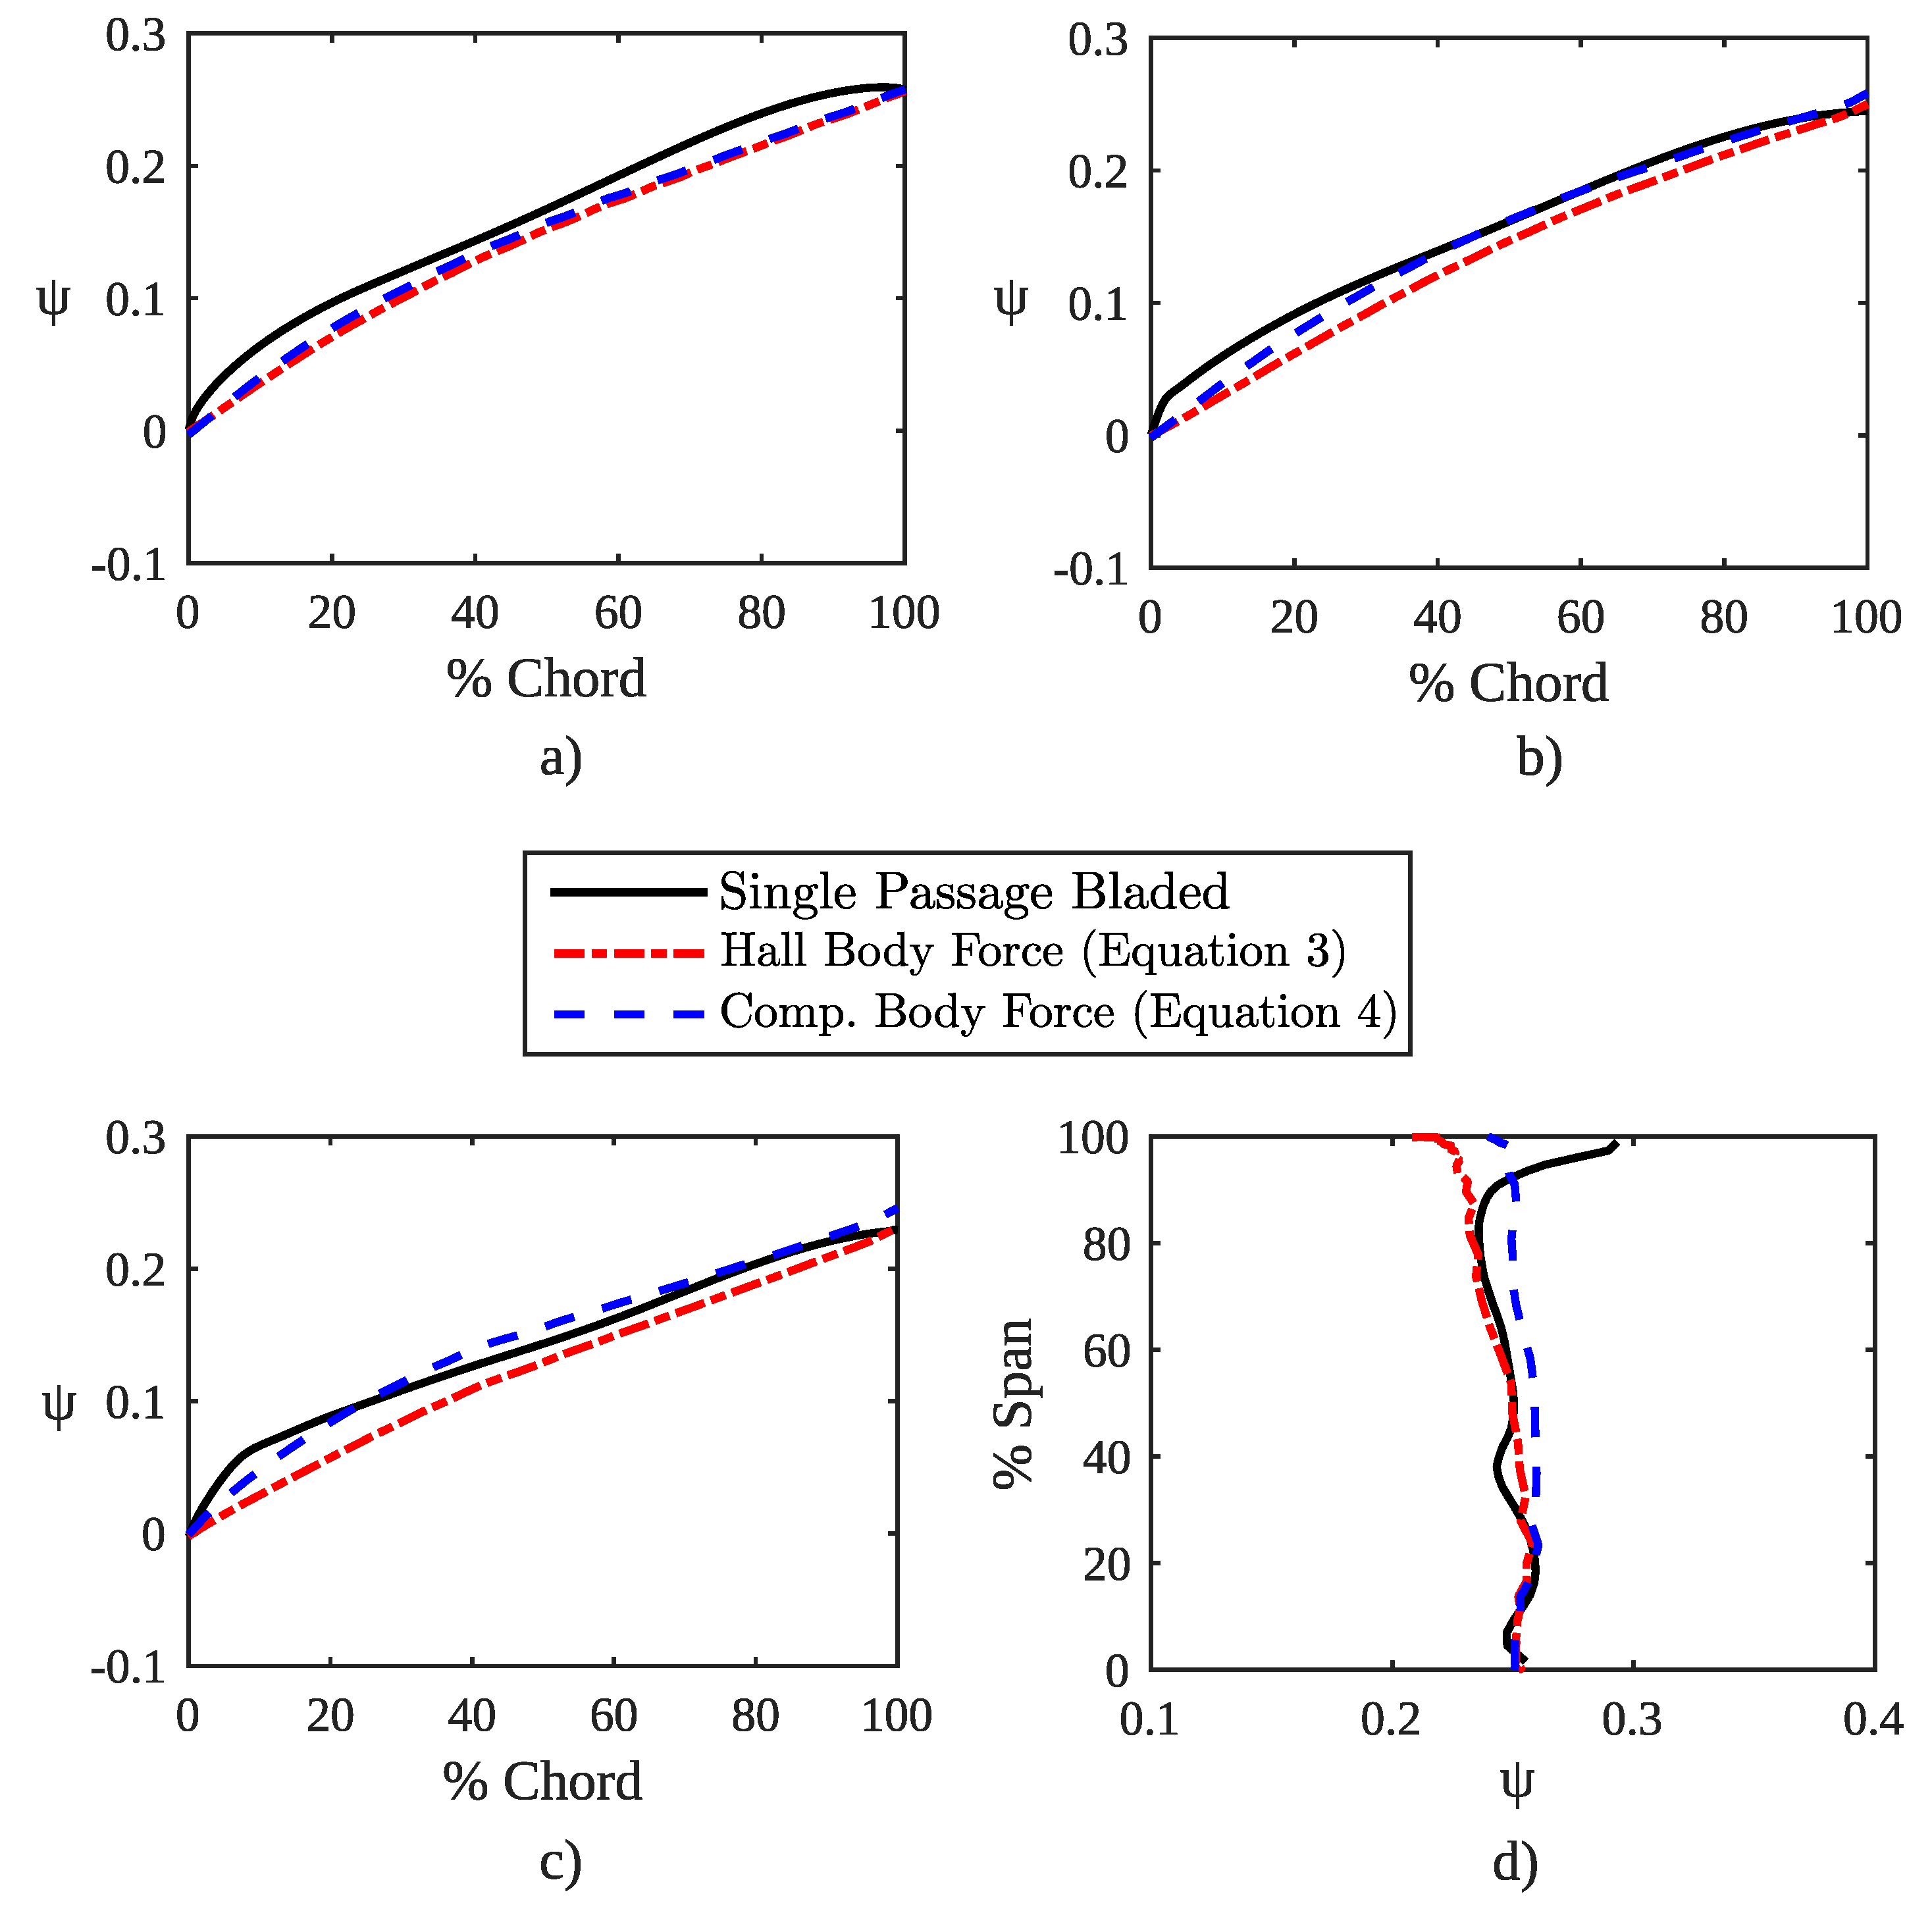
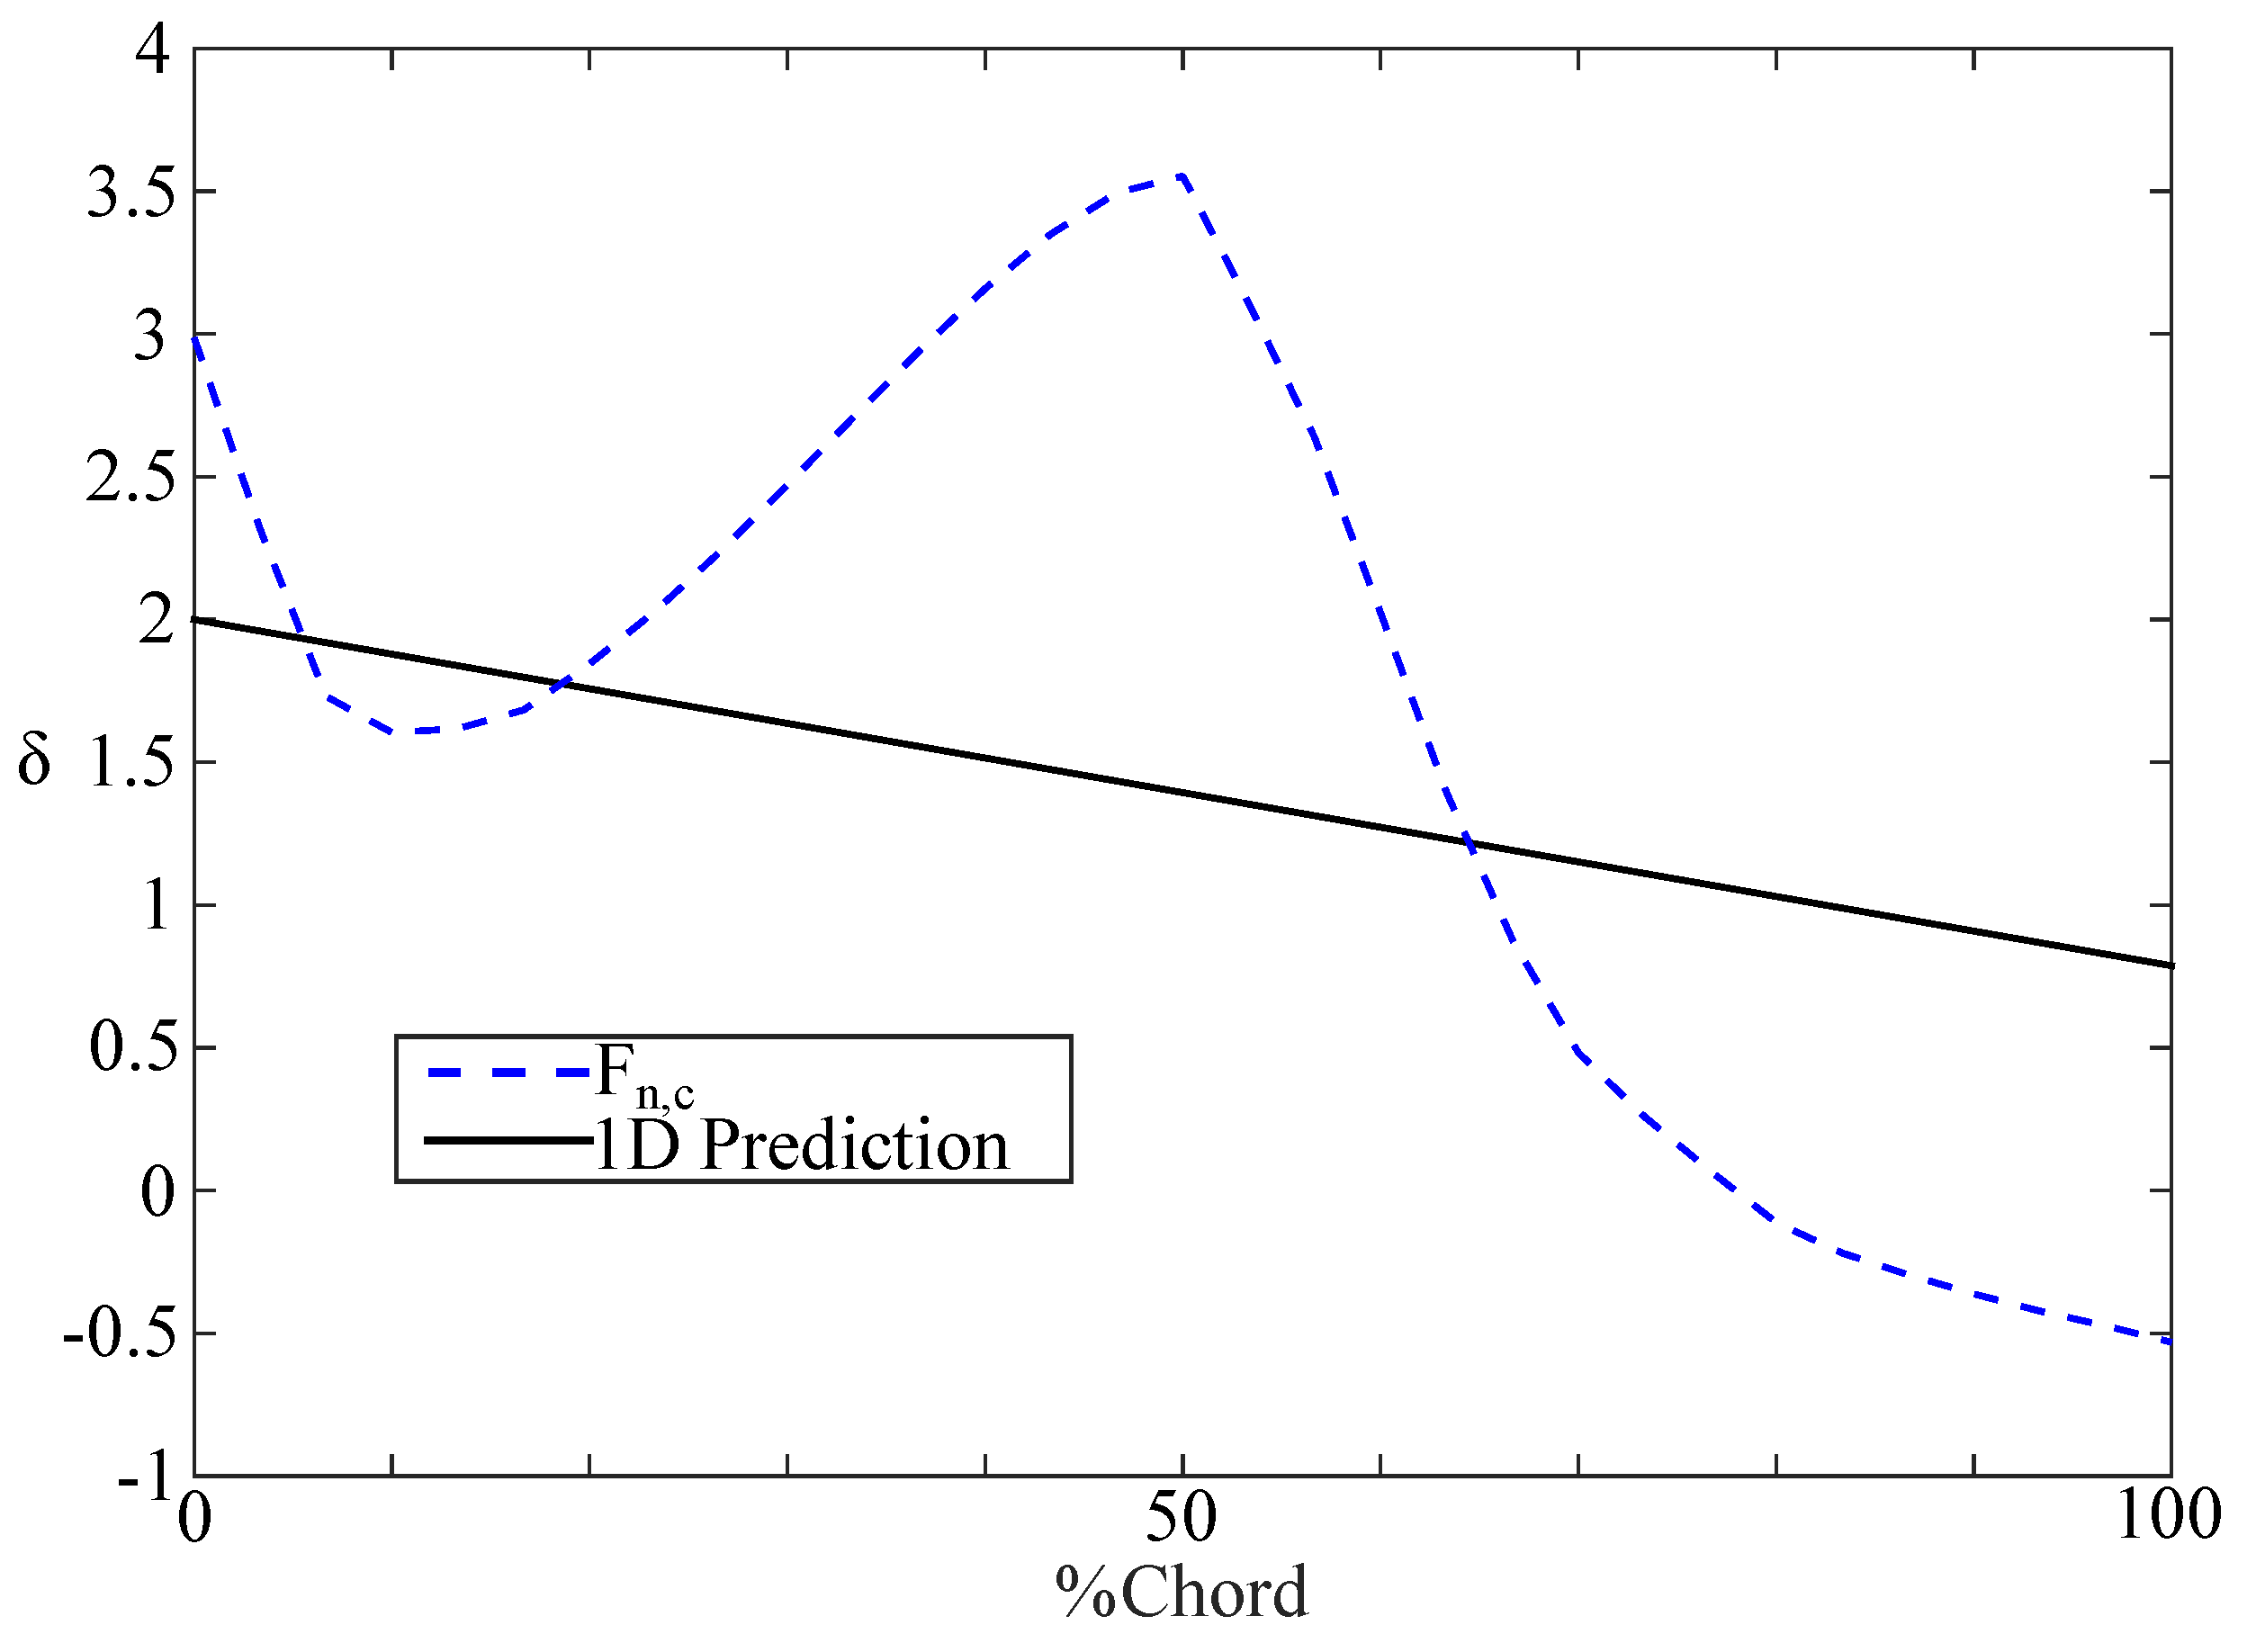
The chordwise loading distribution was shown to have an effect on inlet distortion interaction [
6]; therefore, one of the aims was to generate a body force model with a camber surface that produced realistic chordwise loading distributions, while remaining relatively simple. The solution employed was to use camber shapes defined by a combination of a circular arc and a straight line. An example of this camber shape is shown in
Figure 6. In physical blades, the highest loading tends to be in the leading edge region; however, in the Hall body force model (Equation (
3)), the loading scales with deviation, which tends to increase towards the trailing edge at design. The intent of pushing all camber curvature forward was to combat this effect. The straight line in the rear section of the chord worked to ensure that the required overall flow turning was met as the Hall model acted to reduce the deviation. A range of circular-straight line dividing locations was tested, and it was found that a 50:50 split between circular arc and straight line provided the best combination of guaranteeing the correct flow turning and chordwise loading distribution accuracy, as shown later. It should be noted that the model design approach did not produce realistic blade shapes, but increased the accuracy of the loading distribution of the body force model. This was a significant difference compared to the no blade information process used by Sato, Spotts, and Gao (2019) [
8], as no real attempt was made to capture realistic chordwise loading in that paper.
In the design velocity triangles, the meridional velocity was used as opposed to the axial velocity. This was important because of the significant radial velocities in the rotor, especially near the hub. The consequence was that the velocity triangles and hence camber angles were dependent on the stream surface inclination since the leading and trailing edge axial velocities were assumed constant.
At the rotor leading edge, a small positive incidence of 2
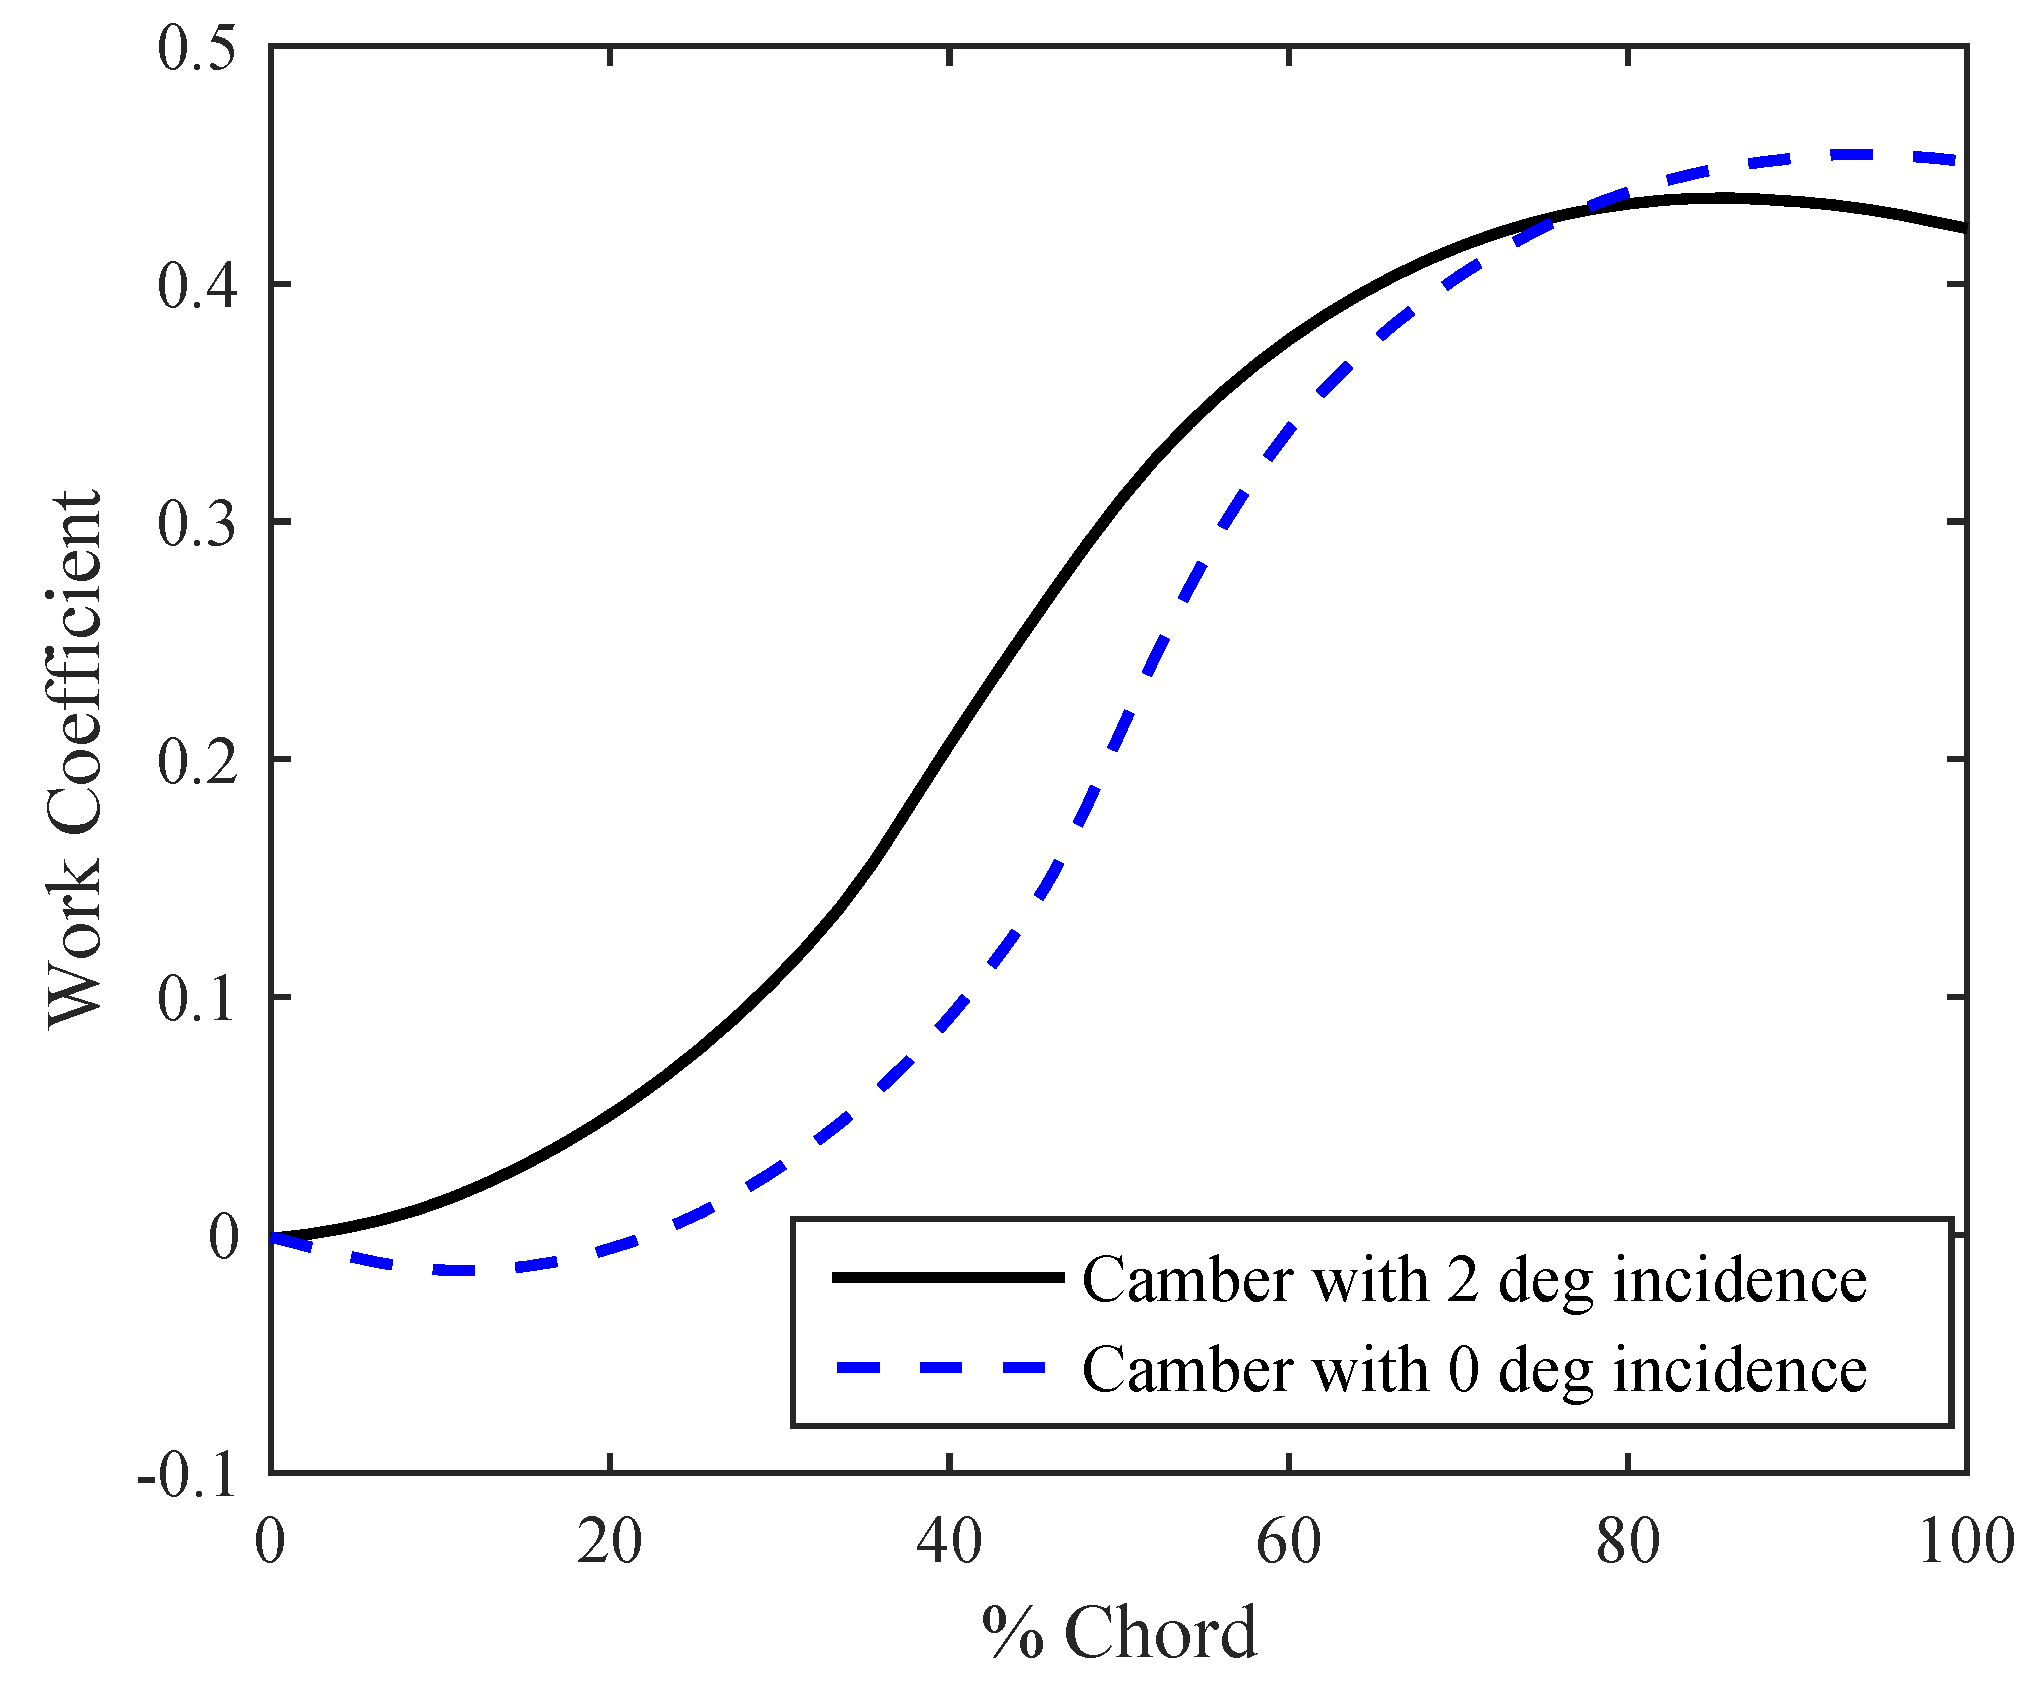
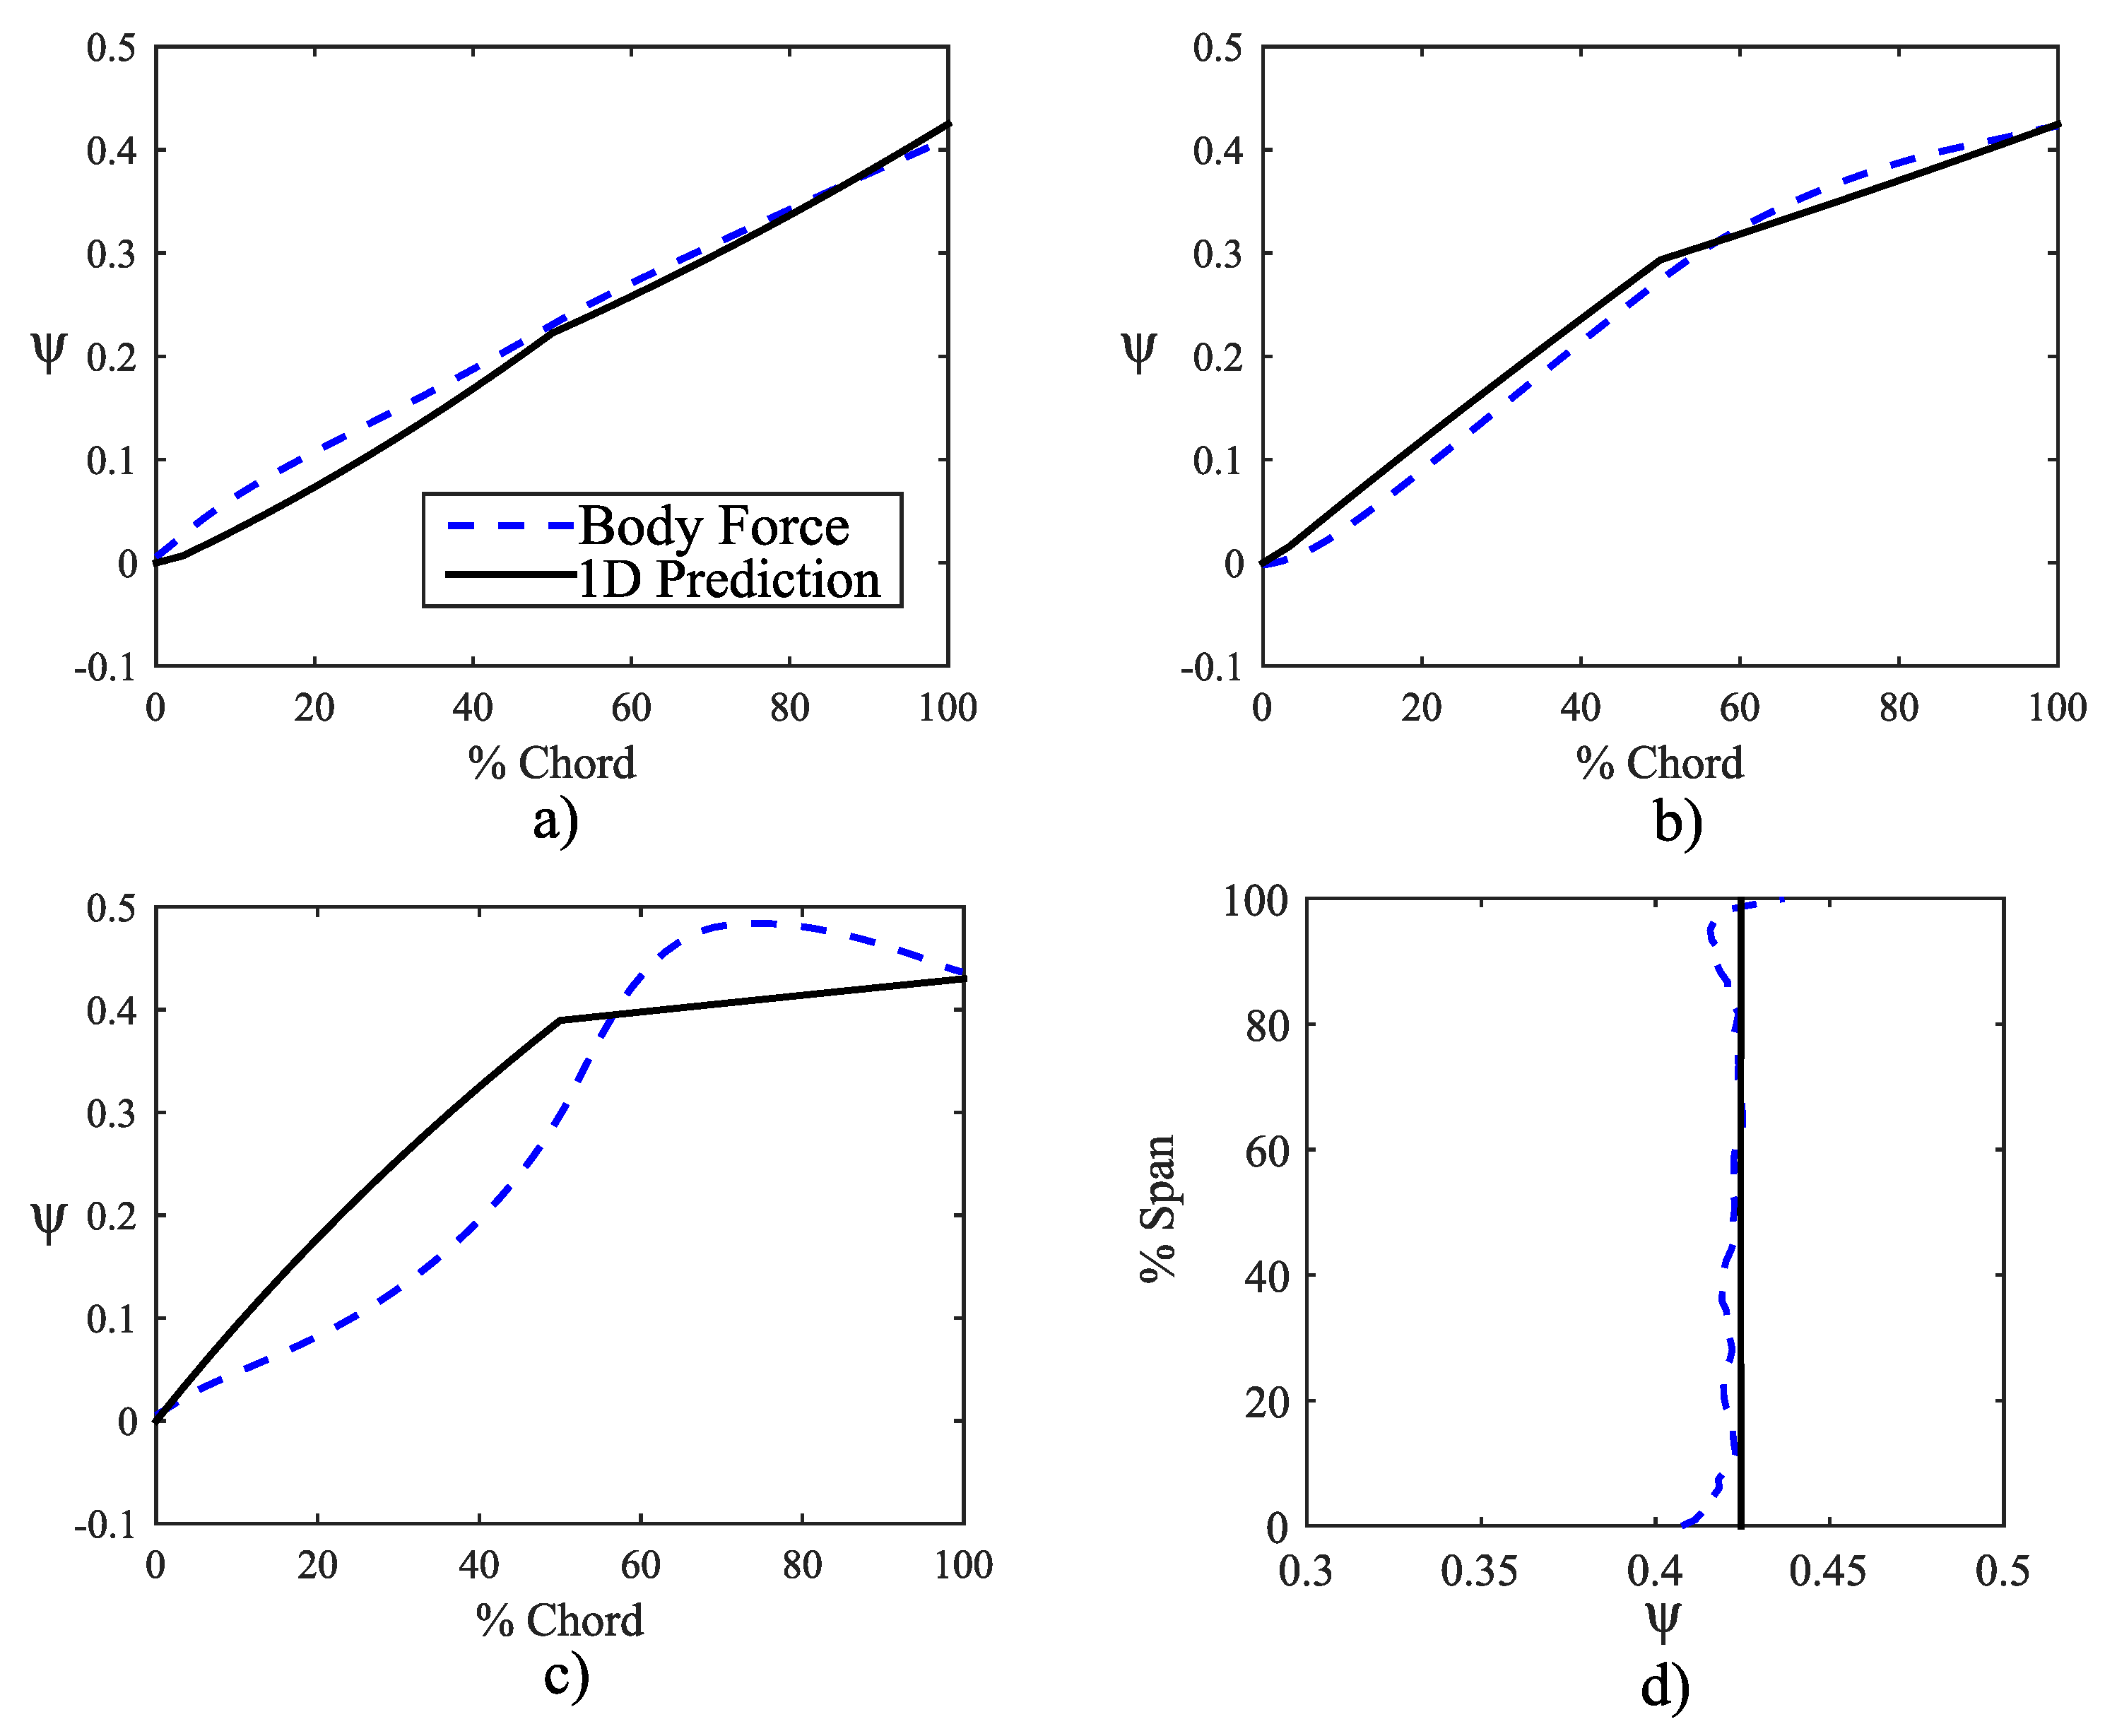
was used; this along with the design velocity triangles set the rotor inlet camber angle. The incidence was added to provide a more realistic chordwise loading. It increased the blade loading and flow deflection in the rotor leading edge region. This also helped ensure that the chordwise loading distributions matched predicted trends when the assumption of constant axial velocity was not realized when employing the model within a CFD simulation; if the axial velocity exceeded the assumed value, it would cause negative incidence at the leading edge, which could result in local work removal. The positive incidence acted to counteract this trend. In
Figure 7, the chordwise loading is shown at 80% rotor span with and without the added incidence from the example design described later to demonstrate the difference in work addition. In the blade with 0
incidence, the stagnation enthalpy in the first 20% chord dropped below the freestream stagnation enthalpy; this could alter the expected distortion interaction behaviour. Adding the incidence eliminated this decrease in the leading edge region. The stator leading edge camber angle was set by assuming zero incidence. Zero incidence was used for the stator leading edge because there was no change in stagnation quantities across the stator, which eliminated the need to add incidence to improve the chordwise loading distribution.
The rotor trailing edge flow angles were set based on the required work input using the Euler turbine equation,
the design choice to have a constant spanwise work input/pressure rise and flow deviation. The stator trailing edge was set to remove the swirl from the flow. The trailing edge angles in both blade rows accounted for the deviation. Trailing edge deviation was estimated using a modified form of Carter’s rule [
13]:
where the maximum camber of the blade was at an axial distance
a from the leading edge,
c is the axial chord length,
is the exit flow angle (
in the rotor),
is the overall change in blade angle, and
s is the pitch (spacing between blades). Carter’s rule is intended for fully circular blade camber shapes; a modification was made to
a to account for the adjustment of the location of maximum camber from the mid point to the new value of 37.5% chord (
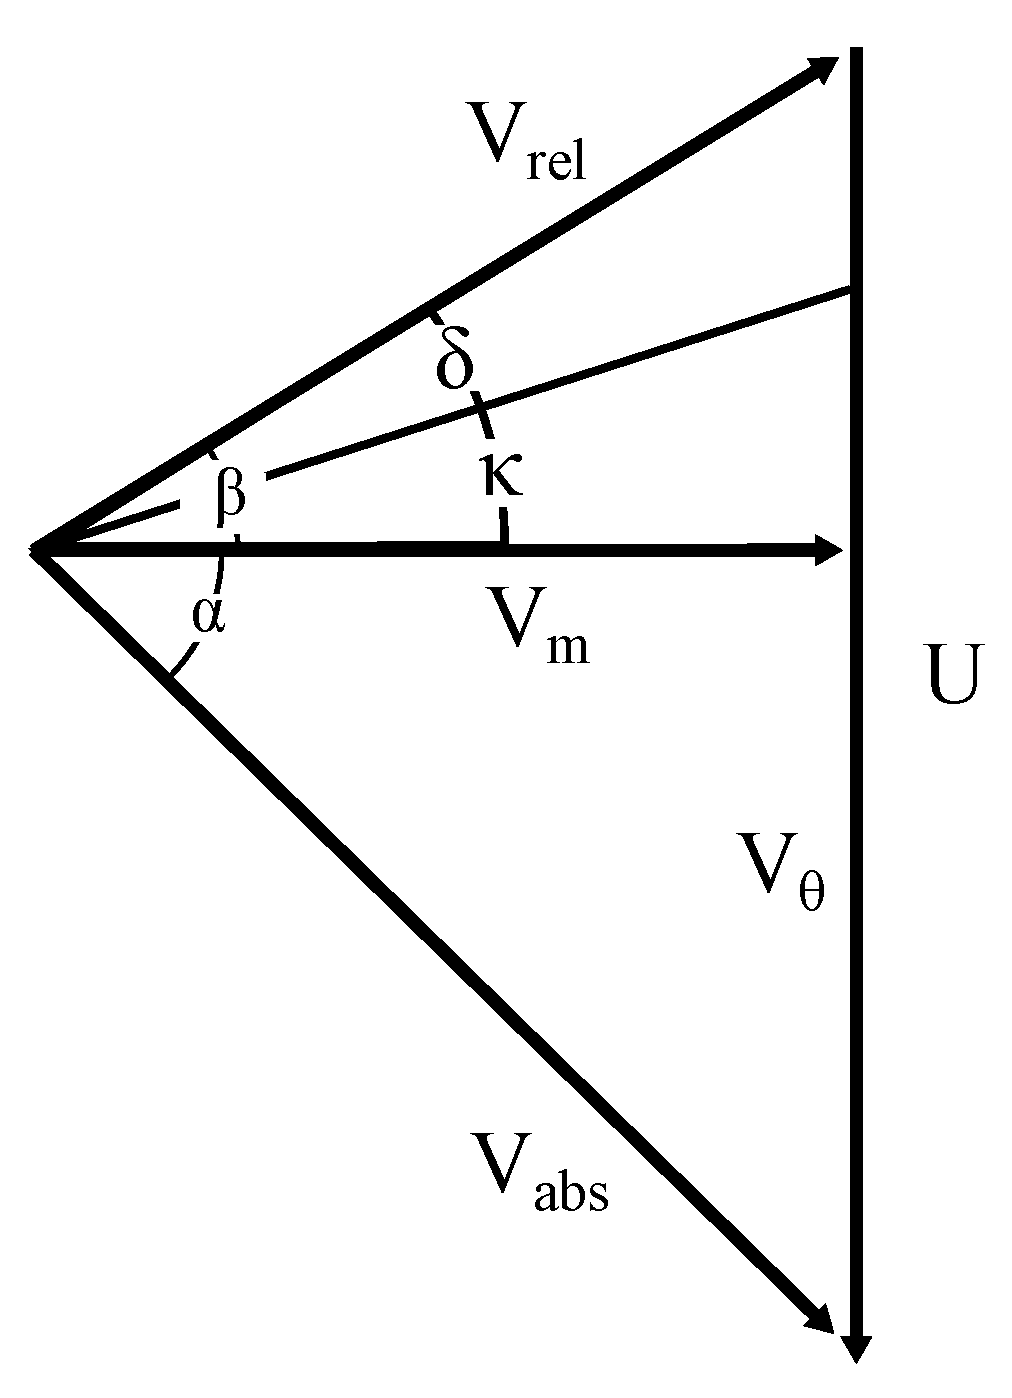
). The relationship between the flow angles (
and
), blade angle (
), and deviation (
) at a rotor trailing edge are illustrated using the generic velocity triangle shown in
Figure 8.
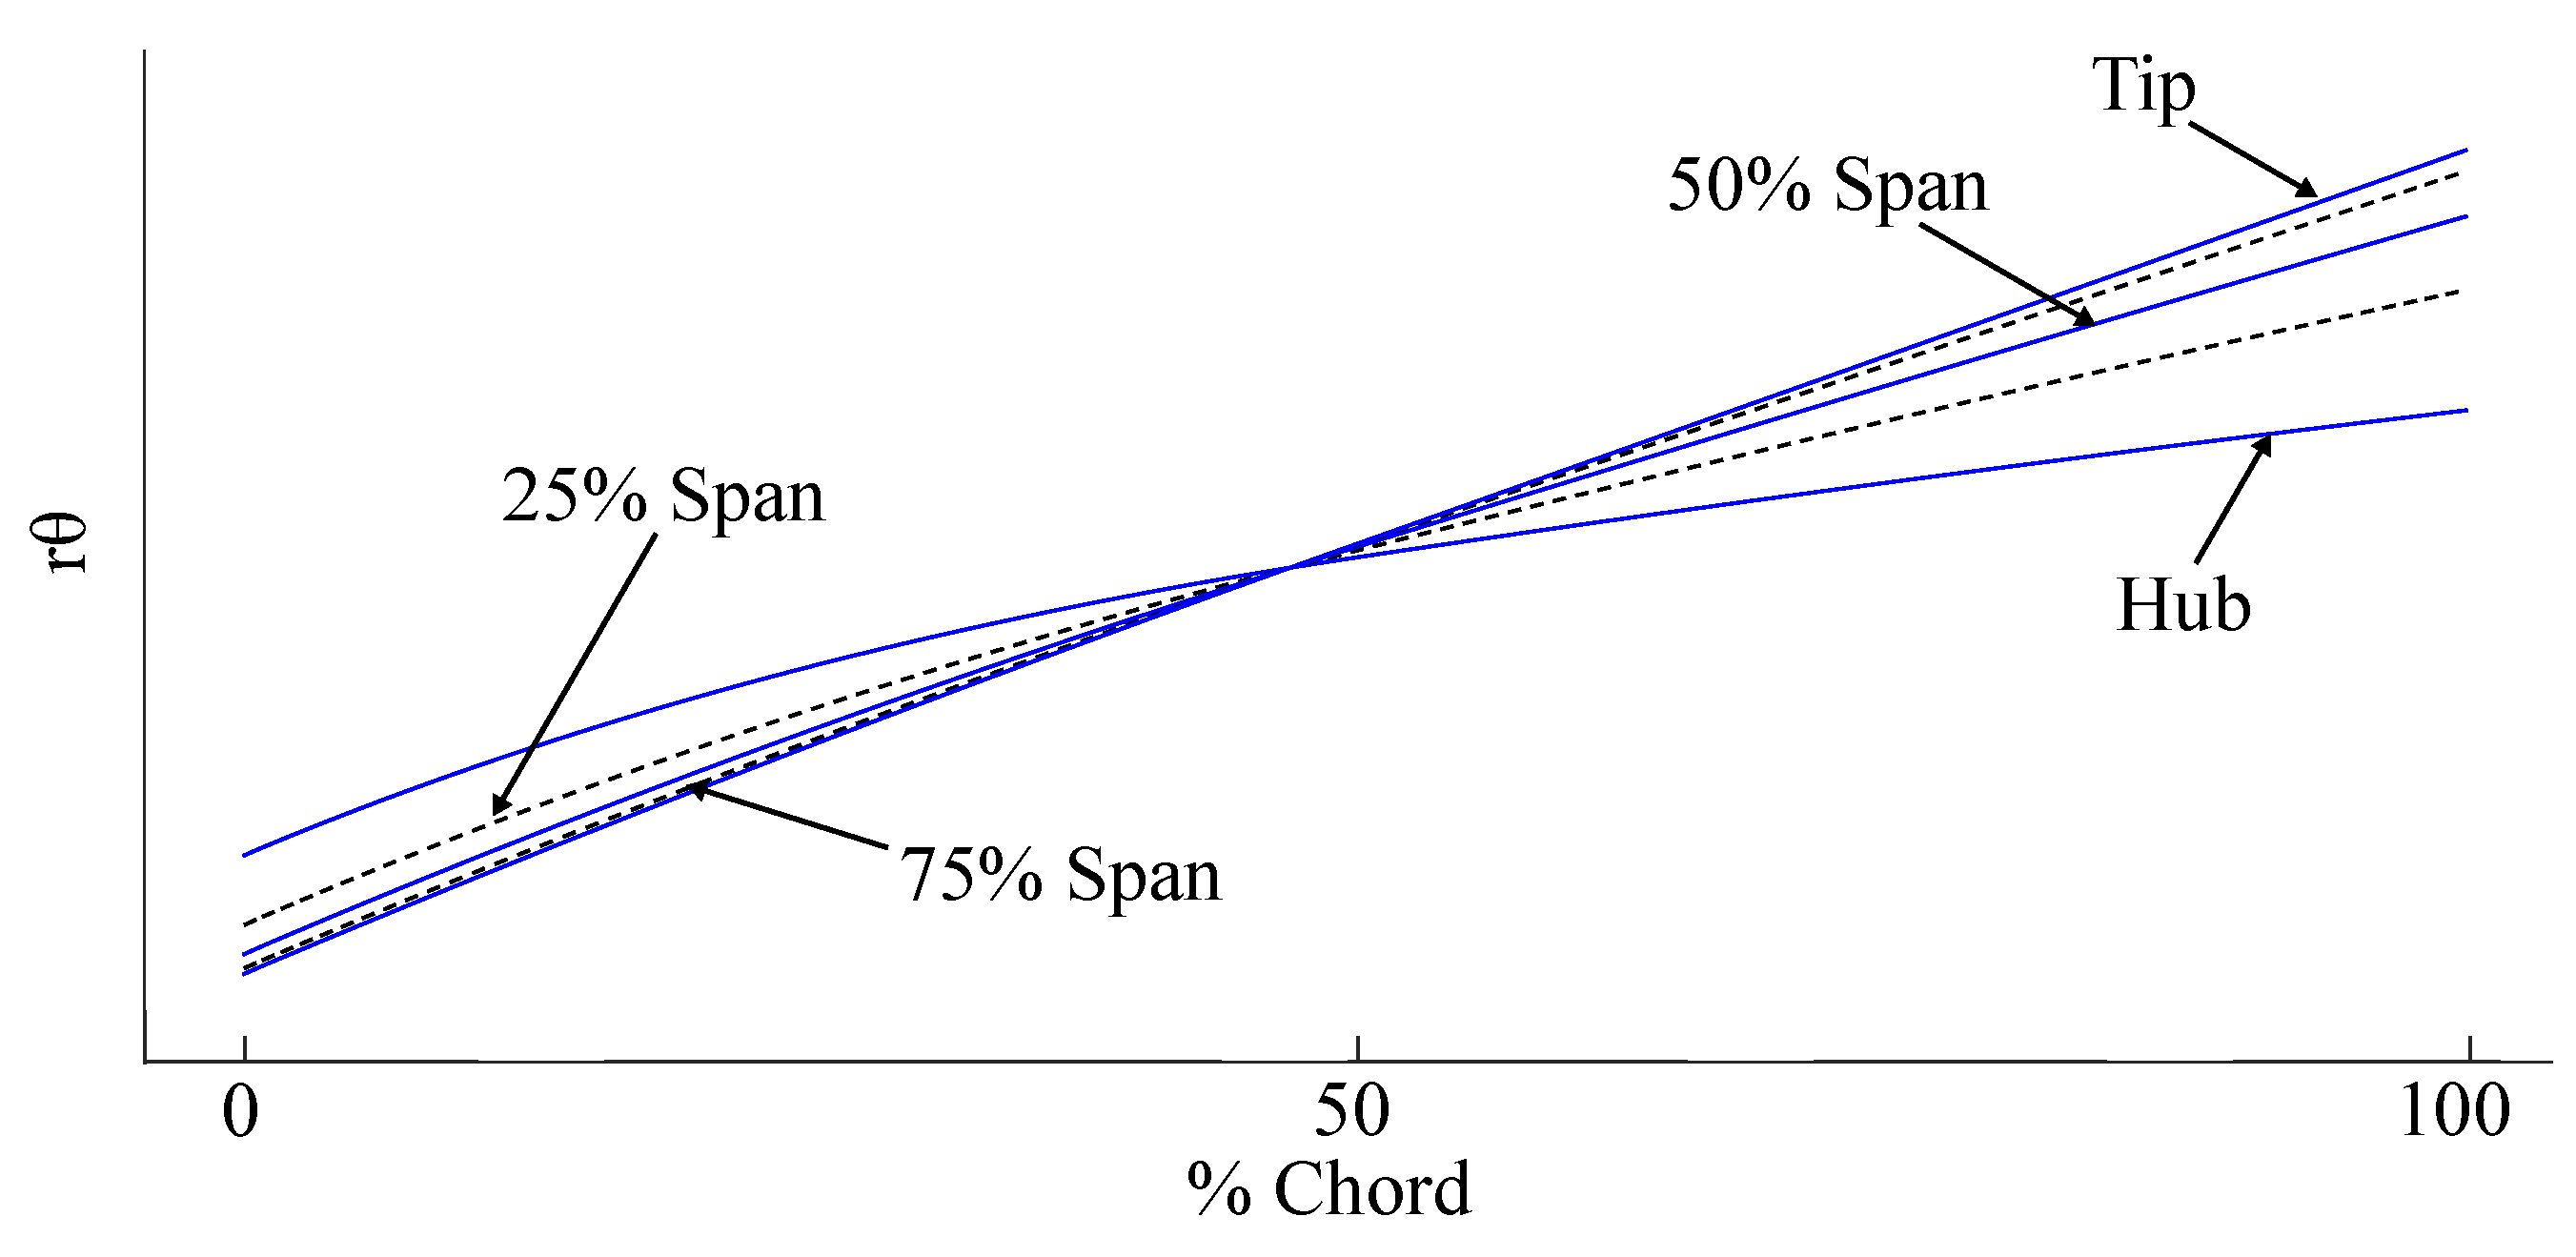
The 2D camber line sections were stacked using the open-source turbomachinery design suite MULTALL’s geometry and the grid generator Stagen. The information required for Stagen was the camber distribution and the corresponding axial and radial coordinates through the gas path at the set span fractions (0% and 100% were required; however, additional span fractions can be supplied to further constrain the design), as well as the leading and trailing edge meridional coordinates. Stagen creates a single passage grid based on the information given; the number of spanwise sections generated was equal to the number of radial grid points requested. The current maximum of 64 points was used here, which was shown to be an adequate number of radial grid points in body force models [
2]. The thickness distribution was set within Stagen to produce blades of negligible thickness such that the maximum thickness was less than 1% of the blade chord. Blade thickness information was not required for the body force model, and therefore, this was done so the camber surface extraction could be simplified. The blade sections were stacked with their centroids lying along a radial line through the centroid of the hub blade section. Shown in
Figure 9 are the camber lines that were produced by Stagen. The grid points on the blade surfaces were then extracted, and this was used to generate the 3D blade shapes. The camber surface was found by extracting the average of the
coordinates of the pressure and suction sides of the 3D blade shapes at each axial location. Finally, the camber surface normal vectors used in the compressibility corrected Hall body force model were calculated using the MATLAB [
16] built-in function “surfnorm”. For more information on how Stagen works, refer to Denton (2017) [
9].


