
The Potential of Surveillance Data for Dengue Risk Mapping: An Evaluation of Different Approaches in Cuba
 , , , ,
Abstract
:1. Introduction
2. Materials and Methods
2.1. Design
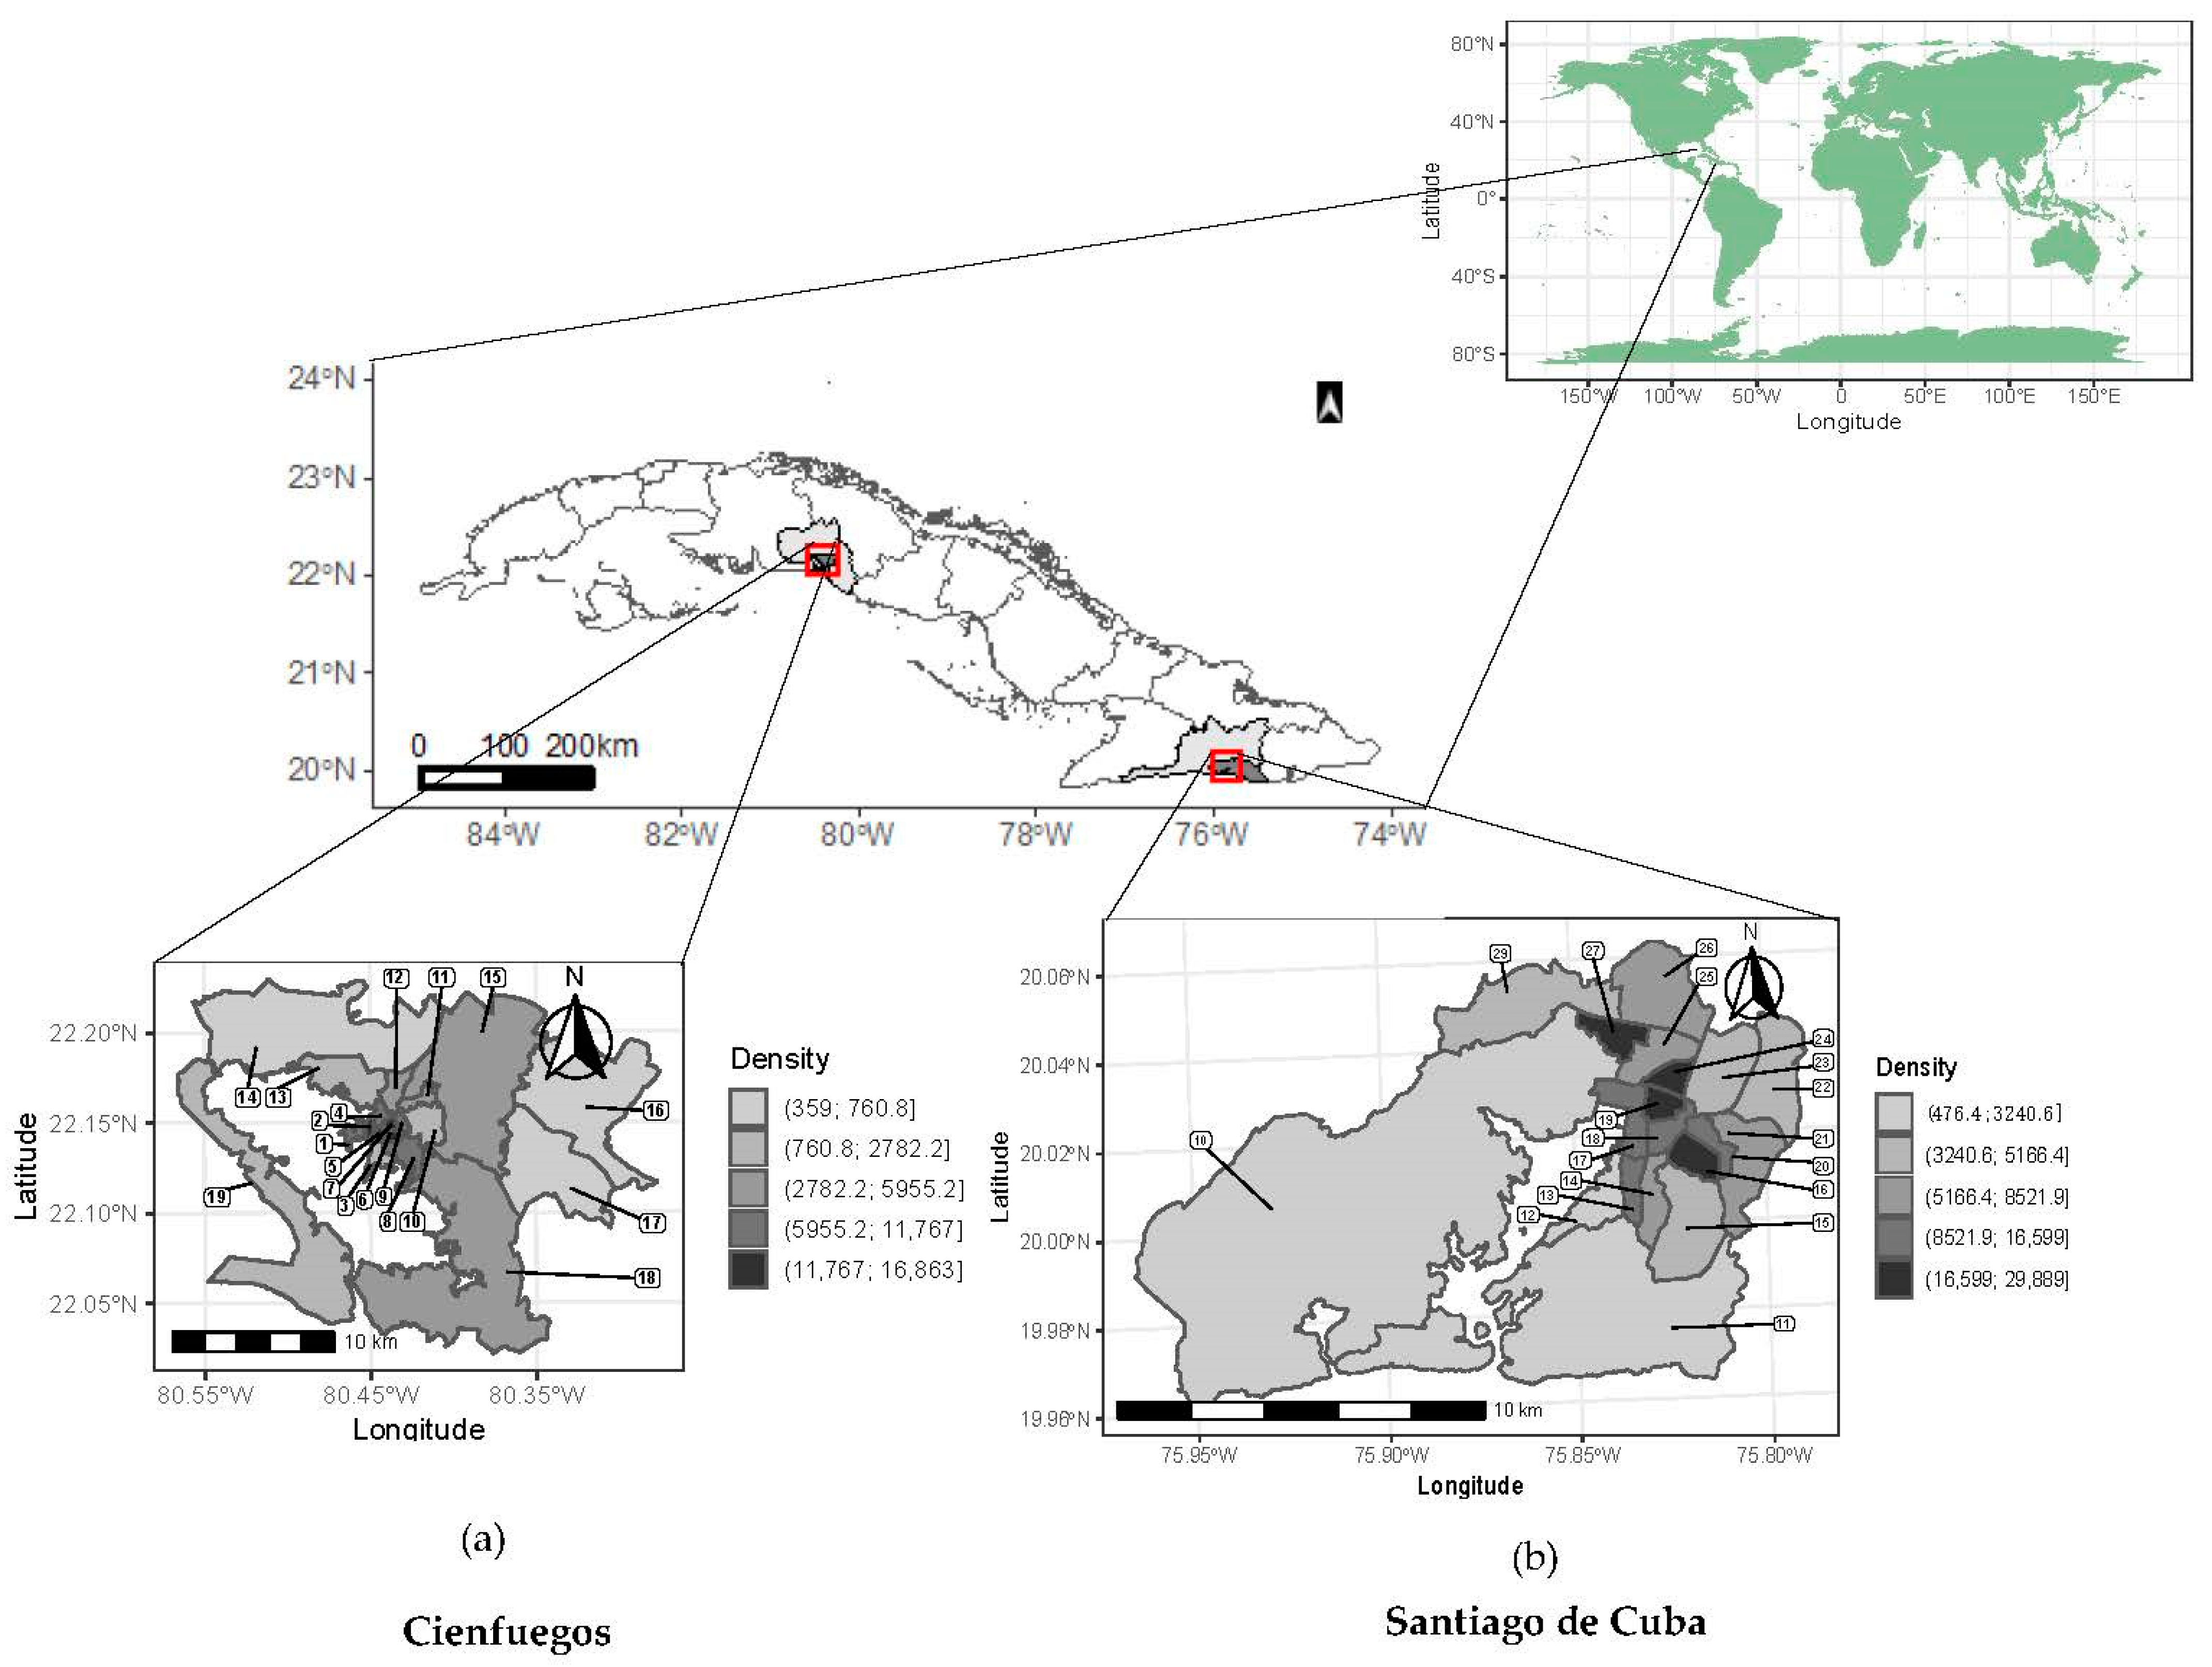
2.2. Settings and Data Collection
2.3. Multicomponent Risk Assessment and Mapping
2.3.1. Preliminary Stage: Knowledge-Based Identification of Components and Indicators
2.3.2. Modeling Stage
- Multicomponent vulnerability index approach
- Generate z-score standardized indicators () with mean 0 and standard deviation 1:where and are, respectively, the mean and standard deviation of indicator j in CP i.
- Calculate an aggregated value for each CP i and component ( aswhere represent the indicators included in component .
- Define a global index as a measure of vulnerability, by averaging the aggregated values of the K components:
- Rank the CPs in increasing order of and classify them using the quantile method into five classes, assigning a rank between 1 and 5, representing the level of vulnerability.
- Data-driven multicomponent modeling
Multicomponent Multivariate Regression Modeling of Disease Incidence
Multicomponent Vulnerability Index
2.3.3. Classification and Mapping
2.4. Comparison with Single-Component Mapping
2.4.1. Single-Component Cumulative Incidence Model
2.4.2. Single-Component Standardized Incidence Ratio Model
3. Results
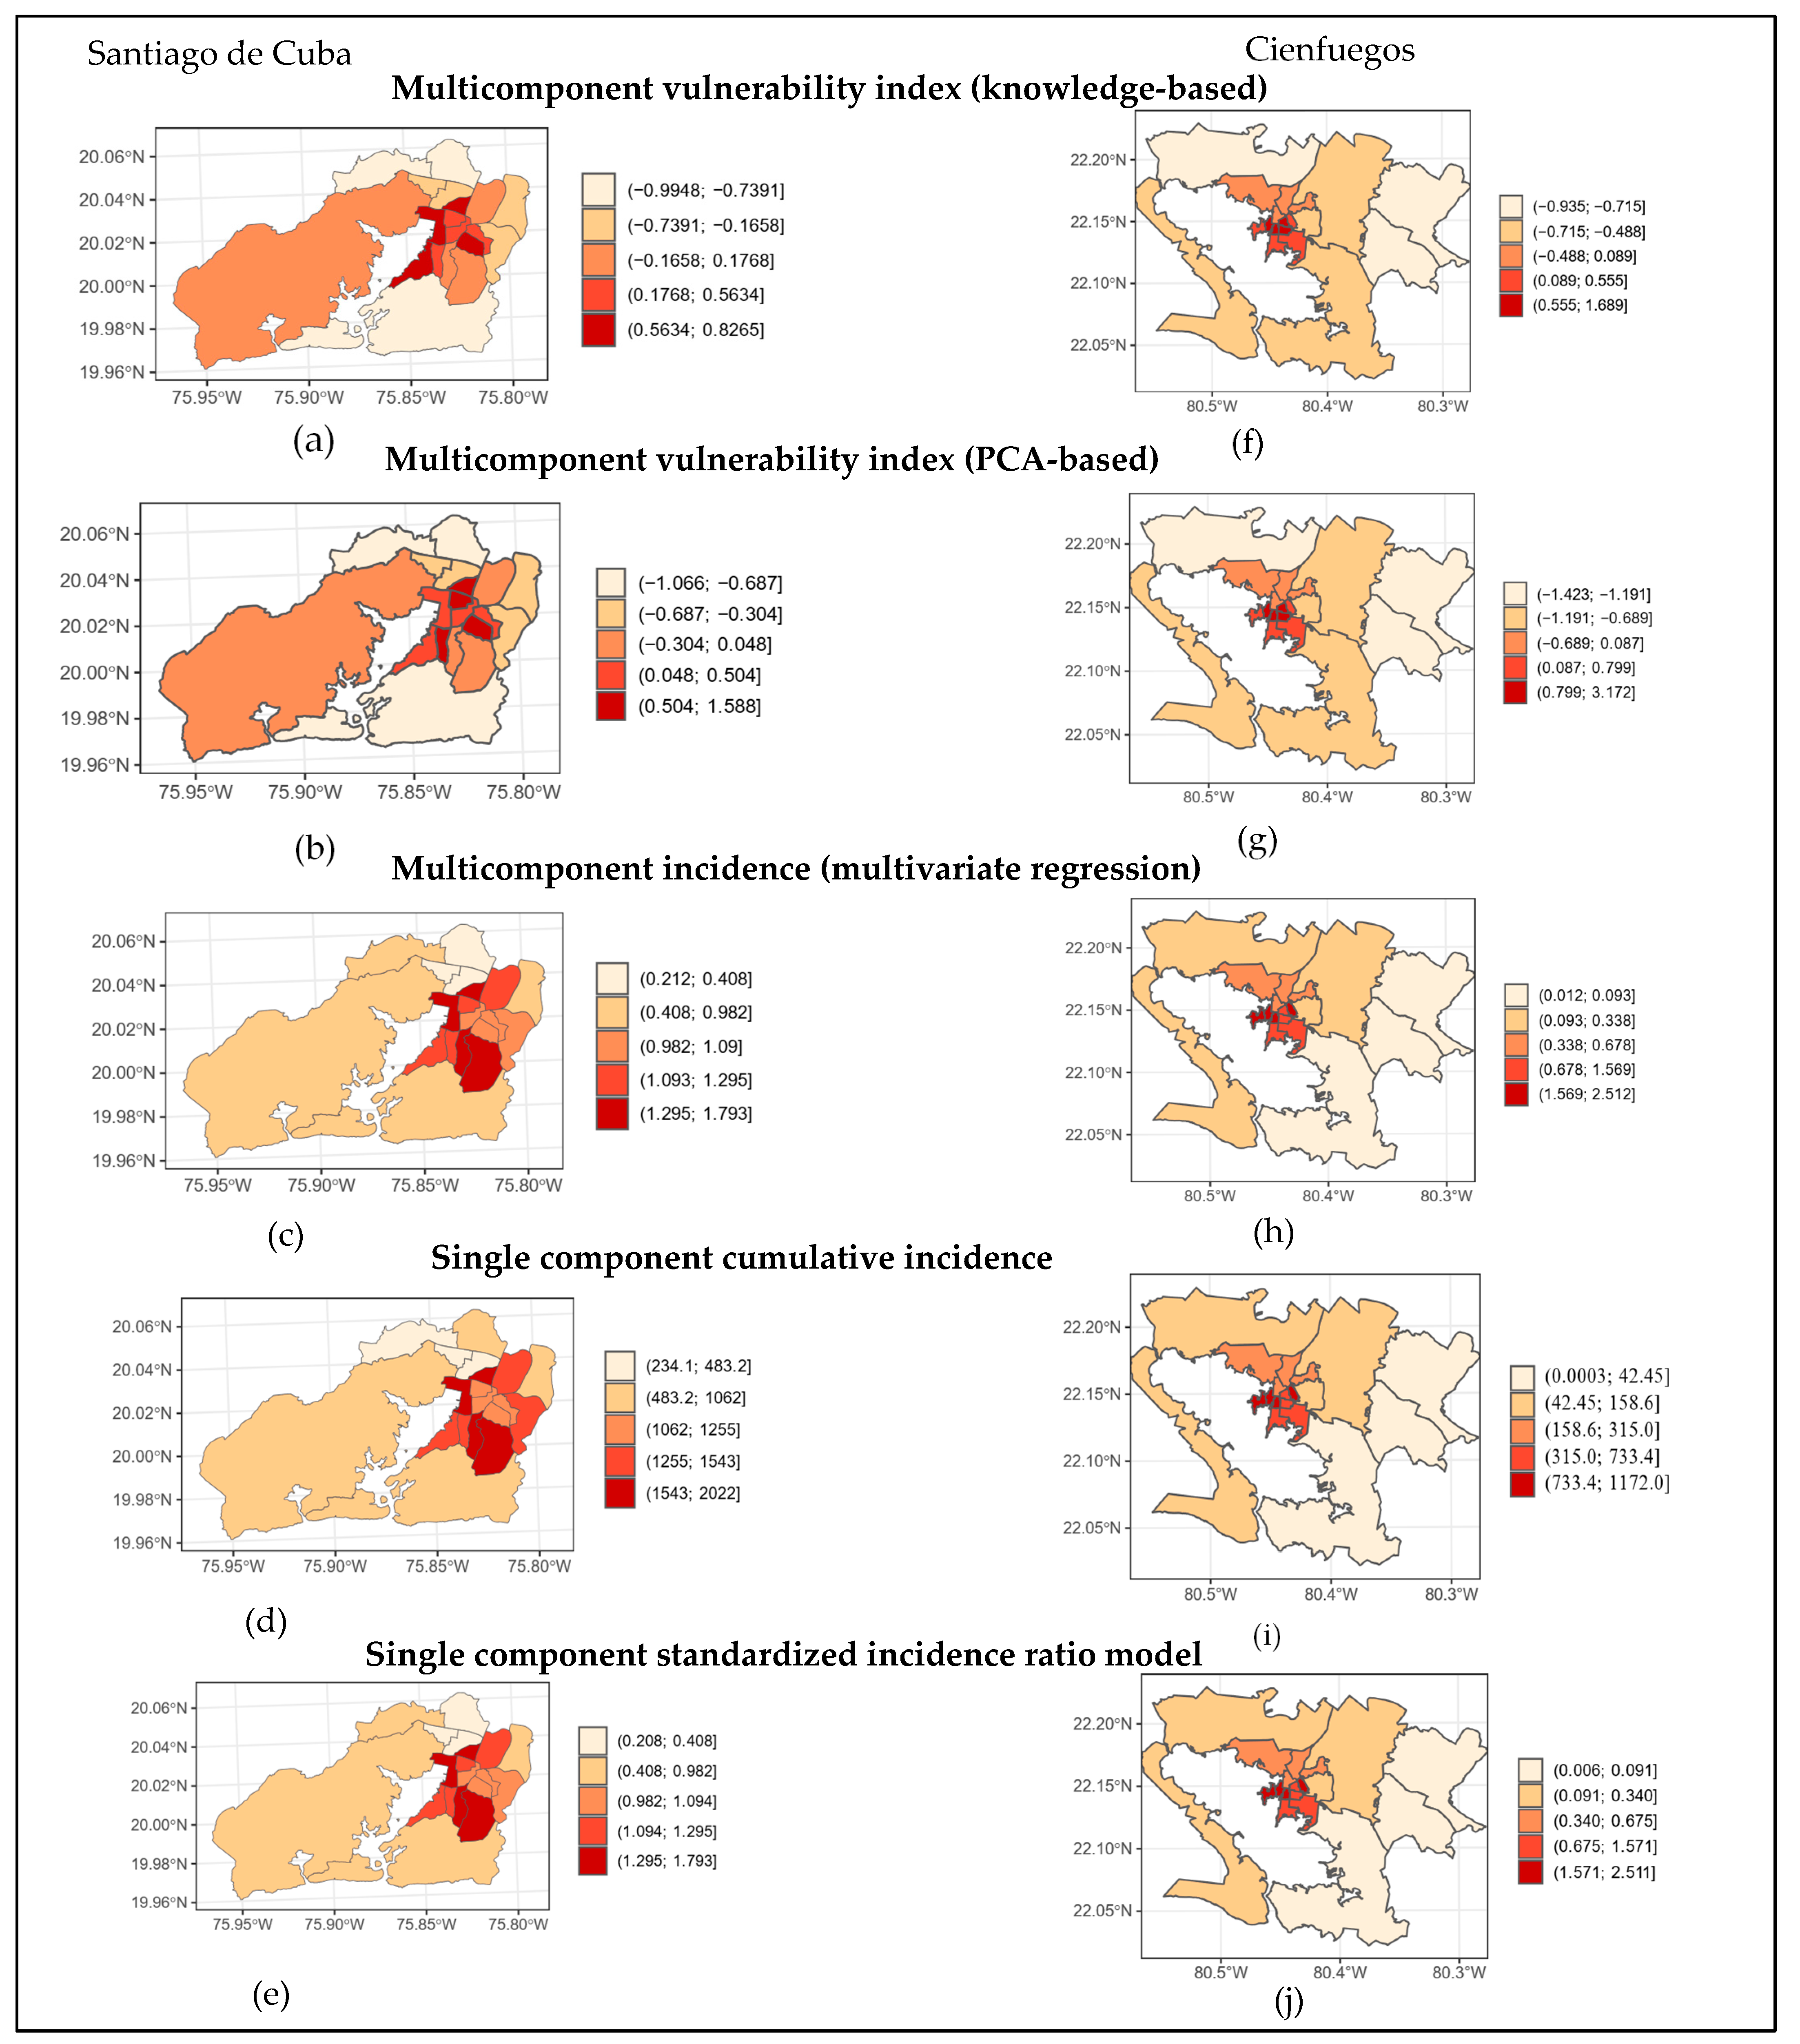
Risk Mapping
4. Discussion
Supplementary Materials
Author Contributions
Funding
Institutional Review Board Statement
Informed Consent Statement
Data Availability Statement
Acknowledgments
Conflicts of Interest
References
- Bhatt, S.; Gething, P.W.; Brady, O.J.; Messina, J.P.; Farlow, A.W.; Moyes, C.L.; Drake, J.M.; Brownstein, J.S.; Hoen, A.G.; Sankoh, O.; et al. The global distribution and burden of dengue. Nature 2013, 496, 504–507. [Google Scholar] [CrossRef] [PubMed]
- World Health Organization. Dengue and Severe Dengue; World Health Organization: Geneva, Switzerland, 2022. [Google Scholar]
- Van den Berg, H.; da Silva Bezerra, H.S.; Al-Eryani, S.; Chanda, E.; Nagpal, B.N.; Knox, T.B.; Velayudhan, R.; Yadav, R.S. Recent trends in global insecticide use for disease vector control and potential implications for resistance management. Sci. Rep. 2021, 11, 23867. [Google Scholar] [CrossRef]
- Morrison, A.C.; Zielinski-Gutierrez, E.; Scott, T.W.; Rosenberg, R. Defining challenges and proposing solutions for control of the virus vector Aedes aegypti. PLoS Med. 2008, 5, e68. [Google Scholar] [CrossRef] [PubMed]
- Singer, M. The spread of Zika and the potential for global arbovirus syndemics. Glob. Public Health 2016, 12, 1–18. [Google Scholar] [CrossRef] [PubMed]
- Reiner, R.C., Jr.; Achee, N.; Barrera, R.; Burkot, T.R.; Chadee, D.D.; Devine, G.J.; Endy, T.; Gubler, D.; Hombach, J.; Kleinschmidt, I.; et al. Quantifying the Epidemiological Impact of Vector Control on Dengue. PLoS Negl. Trop. Dis. 2016, 10, e0004588. [Google Scholar] [CrossRef]
- Morrison, A.C.; Paz-Soldan, V.A.; Vazquez-Prokopec, G.M.; Lambrechts, L.; Elson, W.H.; Barrera, P.; Astete, H.; Briesemeister, V.; Leguia, M.; Jenkins, S.A.; et al. Quantifying heterogeneities in arbovirus transmission: Description of the rationale and methodology for a prospective longitudinal study of dengue and Zika virus transmission in Iquitos, Peru (2014–2019). PLoS ONE 2023, 18, e0273798. [Google Scholar] [CrossRef]
- Reisen, W.K. Landscape epidemiology of vector-borne diseases. Annu. Rev. Entomol. 2010, 55, 461–483. [Google Scholar] [CrossRef]
- WHO/TDR. Technical Handbook for Dengue Surveillance, Dengue Outbreak Prediction/Detection and Outbreak Response; World Health Organization: Geneva, Switzerland, 2016; p. 92. [Google Scholar]
- Runge-Ranzinger, S.; Kroeger, A.; Olliaro, P.; McCall, P.J.; Sanchez Tejeda, G.; Lloyd, L.S.; Hakim, L.; Bowman, L.R.; Horstick, O.; Coelho, G. Dengue Contingency Planning: From Research to Policy and Practice. PLoS Negl. Trop. Dis. 2016, 10, e0004916. [Google Scholar] [CrossRef]
- Scott, T.; Morrison, A.C. Longitudinal field studies will guide a paradigm shift in dengue prevention. In Vector Biology, Ecology and Control; Atkinson, P.W., Ed.; Springer: Berlin/Heidelberg, Germany, 2010; pp. 139–161. [Google Scholar]
- Dehnavieh, R.; Haghdoost, A.; Khosravi, A.; Hoseinabadi, F.; Rahimi, H.; Poursheikhali, A.; Khajehpour, N.; Khajeh, Z.; Mirshekari, N.; Hasani, M.; et al. The District Health Information System (DHIS2): A literature review and meta-synthesis of its strengths and operational challenges based on the experiences of 11 countries. Health Inf. Manag. 2019, 48, 62–75. [Google Scholar] [CrossRef]
- Bousema, T.; Griffin, J.T.; Sauerwein, R.W.; Smith, D.L.; Churcher, T.S.; Takken, W.; Ghani, A.; Drakeley, C.; Gosling, R. Hitting hotspots: Spatial targeting of malaria for control and elimination. PLoS. Med. 2012, 9, e1001165. [Google Scholar] [CrossRef]
- Bousema, T.; Stevenson, J.; Baidjoe, A.; Stresman, G.; Griffin, J.T.; Kleinschmidt, I.; Remarque, E.J.; Vulule, J.; Bayoh, N.; Laserson, K.; et al. The impact of hotspot-targeted interventions on malaria transmission: Study protocol for a cluster-randomized controlled trial. Trials 2013, 14, 36. [Google Scholar] [CrossRef] [PubMed]
- Clements, A.C.; Reid, H.L.; Kelly, G.C.; Hay, S.I. Further shrinking the malaria map: How can geospatial science help to achieve malaria elimination? Lancet Infect. Dis. 2013, 13, 709–718. [Google Scholar] [CrossRef]
- Eisen, L.; Beaty, B.J.; Morrison, A.C.; Scott, T.W. Proactive vector control strategies and improved monitoring and evaluation practices for dengue prevention. J. Med. Entomol. 2009, 46, 1245–1255. [Google Scholar] [CrossRef] [PubMed]
- Stoddard, S.T.; Morrison, A.C.; Vazquez-Prokopec, G.M.; Paz, S.V.; Kochel, T.J.; Kitron, U.; Elder, J.P.; Scott, T.W. The role of human movement in the transmission of vector-borne pathogens. PLoS Negl. Trop. Dis. 2009, 3, e481. [Google Scholar] [CrossRef] [PubMed]
- Vanlerberghe, V.; Gomez-Dantes, H.; Vazquez-Prokopec, G.; Alexander, N.; Manrique-Saide, P.; Coelho, G.E.; Toledo, M.E.; Ocampo, C.B.; Van der Stuyft, P. Changing paradigms in Aedes control: Considering the spatial heterogeneity of dengue transmission. Rev. Panam. Salud Publica 2017, 41, e16. [Google Scholar] [PubMed]
- Gomez-Dantes, H.; San Martin, J.L.; Danis-Lozano, R.; Manrique-Saide, P. La estrategia para la prevención y el control integrado del dengue en Mesoamérica. Salud Publica Mex. 2011, 53, 349–357. [Google Scholar]
- Espinosa, M.; Alvarez Di Fino, E.M.; Abril, M.; Lanfri, M.; Periago, M.V.; Scavuzzo, C.M. Operational satellite-based temporal modelling of Aedes population in Argentina. Geospat. Health 2018, 13, 247–258. [Google Scholar] [CrossRef]
- Laureano-Rosario, A.E.; Garcia-Rejon, J.E.; Gomez-Carro, S.; Farfan-Ale, J.A.; Muller-Karger, F.E. Modelling dengue fever risk in the State of Yucatan, Mexico using regional-scale satellite-derived sea surface temperature. Acta Trop. 2017, 172, 50–57. [Google Scholar] [CrossRef]
- Martinez-Bello, D.A.; Lopez-Quilez, A.; Torres Prieto, A. Relative risk estimation of dengue disease at small spatial scale. Int. J. Health Geogr. 2017, 16, 31. [Google Scholar] [CrossRef]
- Scavuzzo, J.M.; Trucco, F.; Espinosa, M.; Tauro, C.B.; Abril, M.; Scavuzzo, C.M.; Frery, A.C. Modeling Dengue vector population using remotely sensed data and machine learning. Acta Trop. 2018, 185, 167–175. [Google Scholar] [CrossRef]
- Moraga, P. Small Area Disease Risk Estimation and Visualization Using R. R J. 2018, 10, 495. [Google Scholar] [CrossRef]
- Hay, S.I.; Battle, K.E.; Pigott, D.M.; Smith, D.L.; Moyes, C.L.; Bhatt, S.; Brownstein, J.S.; Collier, N.; Myers, M.F.; George, D.B.; et al. Global mapping of infectious disease. Philos. Trans. R. Soc. Lond. B Biol. Sci. 2013, 368, 20120250. [Google Scholar] [CrossRef] [PubMed]
- Bisanzio, D.; Dzul-Manzanilla, F.; Gomez-Dantes, H.; Pavia-Ruz, N.; Hladish, T.J.; Lenhart, A.; Palacio-Vargas, J.; Gonzalez Roldan, J.F.; Correa-Morales, F.; Sanchez-Tejeda, G.; et al. Spatio-temporal coherence of dengue, chikungunya and Zika outbreaks in Merida, Mexico. PLoS Negl. Trop. Dis. 2018, 12, e0006298. [Google Scholar] [CrossRef] [PubMed]
- Guha-Sapir, D.; Schimmer, B. Dengue fever: New paradigms for a changing epidemiology. Emerg. Themes Epidemiol. 2005, 2, 1. [Google Scholar] [CrossRef]
- Sanchez, L.; Cortinas, J.; Pelaez, O.; Gutierrez, H.; Concepcion, D.; Van der, S.P. Breteau Index threshold levels indicating risk for dengue transmission in areas with low Aedes infestation. Trop. Med. Int. Health 2010, 15, 173–175. [Google Scholar] [CrossRef] [PubMed]
- Barbazan, P.; Yoksan, S.; Gonzalez, J.P. Dengue hemorrhagic fever epidemiology in Thailand: Description and forecasting of epidemics. Microbes. Infect. 2002, 4, 699–705. [Google Scholar] [CrossRef]
- Hagenlocher, M.; Delmelle, E.; Casas, I.; Kienberger, S. Assessing socioeconomic vulnerability to dengue fever in Cali, Colombia: Statistical vs expert-based modeling. Int. J. Health Geogr. 2013, 12, 36. [Google Scholar] [CrossRef]
- Vanwambeke, S.O.; Bennett, S.N.; Kapan, D.D. Spatially disaggregated disease transmission risk: Land cover, land use and risk of dengue transmission on the island of Oahu. Trop. Med. Int. Health 2010, 16, 174–185. [Google Scholar] [CrossRef]
- Dickin, S.K.; Schuster-Wallace, C.J.; Elliott, S.J. Developing a vulnerability mapping methodology: Applying the water-associated disease index to dengue in Malaysia. PLoS ONE 2013, 8, e63584. [Google Scholar] [CrossRef]
- Birkmann, J.; Cardona, O.D.; Carreño, M.L.; Barbat, A.H.; Pelling, M.; Schneiderbauer, S.; Kienberger, S.; Keiler, M.; Alexander, D.; Zeil, P. Framing vulnerability, risk and societal responses: The MOVE framework. Nat. Hazards 2013, 67, 193–211. [Google Scholar] [CrossRef]
- Pastrana, M.E.O.; Brito, R.L.; Nicolino, R.R.; de Oliveira, C.S.F.; Haddad, J.P.A. Spatial and statistical methodologies to determine the distribution of dengue in Brazilian municipalities and relate incidence with the Health Vulnerability Index. Spat. Spatio-Temporal Epidemiol. 2014, 11, 143–151. [Google Scholar] [CrossRef] [PubMed]
- Manrique Saide, P.; Vazquez-Prokopec, G.; Clennon, J.; Che-Mendoza, A. Technical Document for the Implementation of Interventions Based on Generic Operational Scenarios for Aedes aegypti Control; PAHO: Washington, DC, USA, 2019. [Google Scholar]
- Moore, M.; Gelfeld, B.; Okunogbe, A.; Paul, C. Identifying Future Disease Hot Spots: Infectious Disease Vulnerability Index. Rand Health Q. 2017, 6, 5. [Google Scholar] [PubMed]
- Dickin, S.K.; Schuster-Wallace, C.J. Assessing changing vulnerability to dengue in northeastern Brazil using a water-associated disease index approach. Glob. Environ. Chang. 2014, 29, 155–164. [Google Scholar] [CrossRef]
- Pham, N.T.T.; Nguyen, C.T.; Vu, H.H. Assessing and modelling vulnerability to dengue in the Mekong Delta of Vietnam by geospatial and time-series approaches. Environ. Res. 2020, 186, 109545. [Google Scholar] [CrossRef] [PubMed]
- Henry, S.; Mendonça, F.d.A. Past, Present, and Future Vulnerability to Dengue in Jamaica: A Spatial Analysis of Monthly Variations. Int. J. Environ. Res. Public Health 2020, 17, 3156. [Google Scholar] [CrossRef]
- Zafar, S.; Shipin, O.; Paul, R.E.; Rocklöv, J.; Haque, U.; Rahman, M.S.; Mayxay, M.; Pientong, C.; Aromseree, S.; Poolphol, P.; et al. Development and Comparison of Dengue Vulnerability Indices Using GIS-Based Multi-Criteria Decision Analysis in Lao PDR and Thailand. Int. J. Environ. Res. Public Health 2021, 18, 9421. [Google Scholar] [CrossRef]
- Barboza, L.A.; Chou-Chen, S.W.; Vásquez, P.; García, Y.E.; Calvo, J.G.; Hidalgo, H.G.; Sanchez, F. Assessing dengue fever risk in Costa Rica by using climate variables and machine learning techniques. PLoS Negl. Trop. Dis. 2023, 17, e0011047. [Google Scholar] [CrossRef]
- Vazquez-Prokopec, G.M.; Spillmann, C.; Zaidenberg, M.; Gürtler, R.E.; Kitron, U. Spatial heterogeneity and risk maps of community infestation by Triatoma infestans in rural northwestern Argentina. PLOS Negl. Trop. Dis. 2012, 6, e1788. [Google Scholar] [CrossRef]
- United Nations Economic Commission for Latin America and the Caribbean. Cuba—Political and Electoral System; ECLAC: Santiago, Chile, 2022. [Google Scholar]
- Oficina Nacional de Estadística e Información. Censo de Población y Viviendas 2012. Informe Nacional. Resultados Definitivos de Indicadores Seleccionados en Cuba, Provincias y Municipios [Online]; Oficina Nacional de Estadística e Información: La Habana, Cuba, 2012; pp. 111–137. [Google Scholar]
- Valdes, L.G.; Mizhrahi, J.V.; Guzman, M.G. Economic impact of dengue 2 epidemic in Santiago de Cuba, 1997. Rev. Cuba. Med. Trop. 2002, 54, 220–227. [Google Scholar]
- Guzman, M.G.; Garcia, G.; Kouri, G. Dengue and dengue hemorrhagic fever: Research priorities. Rev. Panam. Salud Publica 2006, 19, 204–215. [Google Scholar]
- Toledo, M.E.; Rodriguez, A.; Valdes, L.; Carrion, R.; Cabrera, G.; Banderas, D.; Ceballos, E.; Domeqc, M.; Pena, C.; Baly, A.; et al. Evidence on impact of community-based environmental management on dengue transmission in Santiago de Cuba. Trop. Med. Int. Health 2011, 16, 744–747. [Google Scholar] [CrossRef] [PubMed]
- Pan-American-Health-Organization. Annual Cumulative Figures of Dengue Cases, PLISA (Plataforma de Informacion en Salud para las Americas). Available online: http://www.paho.org/data/index.php/es/temas/indicadores-dengue/dengue-nacional/9-dengue-pais-ano.html (accessed on 10 April 2019).
- IPK. Técnicas de Laboratorio Para el Diagnóstico y la Caracterización del Virus Dengue; Instituto de Medicina Tropical Pedro Kourí: La Habana, Cuba, 2001. [Google Scholar]
- World Health Organization. Dengue: Guidelines for Diagnosis, Treatment, Prevention and Control; WHO/HTM/NTD/DEN/2009.1, Ed.; World Health Organization: Geneva, Switzerland, 2009. [Google Scholar]
- MINSAP. Programa Nacional Para la Erradicación del Mosquito Aedes Aegypti; Ministerio de Salud Pública: La Habana, Cuba, 2011. [Google Scholar]
- Iñiguez, L.; Figueroa, E.; Rojas, J. Atlas de la Infancia y la Adolescencia en Cuba: Análisis a Partir del Censo de Población y Viviendas 2012; Universidad de La Habana: Havana, Cuba, 2017. [Google Scholar]
- Morgan, J.; Strode, C.; Salcedo-Sora, J.E. Climatic and socio-economic factors supporting the co-circulation of dengue, Zika and chikungunya in three different ecosystems in Colombia. PLoS Negl. Trop. Dis. 2021, 15, e0009259. [Google Scholar] [CrossRef] [PubMed]
- Whiteman, A.; Loaiza, J.R.; Yee, D.A.; Poh, K.C.; Watkins, A.S.; Lucas, K.J.; Rapp, T.J.; Kline, L.; Ahmed, A.; Chen, S.; et al. Do socioeconomic factors drive Aedes mosquito vectors and their arboviral diseases? A systematic review of dengue, chikungunya, yellow fever, and Zika Virus. One Health 2020, 11, 100188. [Google Scholar] [CrossRef]
- Spangler, K.; Manjourides, J.; Lynch, A.; Wellenius, G. Characterizing spatial variability of climate-relevant hazards and vulnerabilities in the New England Region of the United States. GeoHealth 2019, 3, 104–120. [Google Scholar] [CrossRef] [PubMed]
- WHO; Kuhn, K.; Campbell-Lendrum, D.; Haines, A.; Cox, J. Using climate to predict infectious disease epidemics. In Communicable Diseases Surveillance and Response Protection of the Human Environment Roll Back Malaria; World Health Organization: Geneva, Switzerland, 2005. [Google Scholar]
- Pfeiffer, D.U.; Robinson, T.P.; Stevenson, M.; Stevens, K.B.; Rogers, D.J.; Clements, A.C. Spatial Analysis in Epidemiology; OUP Oxford: Oxford, UK, 2008. [Google Scholar]
- Aswi, A.; Cramb, S.; Duncan, E.; Mengersen, K. Evaluating the impact of a small number of areas on spatial estimation. Int. J. Health Geogr. 2020, 19, 39. [Google Scholar] [CrossRef]
- Aswi, A.; Cramb, S.; Moraga, P.; Mengersen, K. Bayesian spatial and spatio-temporal approaches to modelling dengue fever: A systematic review. Epidemiol. Infect. 2019, 147, E33. [Google Scholar] [CrossRef]
- Best, N.; Richardson, S.; Thomson, A. A comparison of Bayesian spatial models for disease mapping. Stat. Methods Med. Res. 2005, 14, 35–59. [Google Scholar] [CrossRef]
- Cramb, S.M.; Moraga, P.; Mengersen, K.L.; Baade, P.D. Spatial variation in cancer incidence and survival over time across Queensland, Australia. Spat. Spatio-Temporal Epidemiol. 2017, 23, 59–67. [Google Scholar] [CrossRef]
- Lawson, A.B. Bayesian Disease Mapping: Hierarchical Modeling in Spatial Epidemiology; Chapman and Hall/CRC: Boca Raton, FL, USA, 2018. [Google Scholar]
- Lee, D.; Mitchell, R. Locally adaptive spatial smoothing using conditional auto-regressive models. J. R Stat. Soc. Ser. C Appl. Stat. 2013, 62, 593–608. [Google Scholar] [CrossRef]
- Lee, D. A comparison of conditional autoregressive models used in Bayesian disease mapping. Spat. Spatio-Temporal Epidemiol. 2011, 2, 79–89. [Google Scholar] [CrossRef]
- Rue, H.; Martino, S.; Chopin, N. Approximate Bayesian inference for latent Gaussian models by using integrated nested Laplace approximations. J. R Stat. Soc. Ser. B Stat. Methodol. 2009, 71, 319–392. [Google Scholar] [CrossRef]
- Blangiardo, M.; Cameletti, M. Spatial and Spatio-Temporal Bayesian Models with R-INLA; John Wiley & Sons: Hoboken, NJ, USA, 2015. [Google Scholar]
- Spiegelhalter, D.J.; Best, N.G.; Carlin, B.P.; Van Der Linde, A. Bayesian measures of model complexity and fit. J. R Stat. Soc. Ser. B Stat. Methodol. 2002, 64, 583–639. [Google Scholar] [CrossRef]
- Akaike, H. Maximum likelihood identification of Gaussian autoregressive moving average models. Biometrika 1973, 60, 255–265. [Google Scholar] [CrossRef]
- Akaike, H. A new look at the statistical model identification. IEEE Trans. Automat. Control 1974, 19, 716–723. [Google Scholar] [CrossRef]
- Cámara, N.; Tuesta, D. Measuring financial inclusion: A muldimensional index. In BBVA Research Paper; BBVA Research: Madrid, Spain, 2014. [Google Scholar]
- Hanivan, H.; Nasrudin, N. A financial inclusion index for Indonesia. Bull. Monet. Econ. Bank. 2019, 22, 351–366. [Google Scholar] [CrossRef]
- Park, C.-Y.; Mercado, R.V. Financial inclusion: New measurement and cross-country impact assessment. In Financial Inclusion in Asia and Beyond; Routledge: Oxfordshire, UK, 2021; pp. 98–128. [Google Scholar]
- Kanaroglou, P.; Delmelle, E.; Páez, A. Spatial Analysis in Health Geography; Routledge: Oxfordshire, UK, 2016. [Google Scholar]
- Lawson, A.B.; Clark, A. Spatial mixture relative risk models applied to disease mapping. Stat. Med. 2002, 21, 359–370. [Google Scholar] [CrossRef] [PubMed]
- Kendall, M. Rank Correlation Methods, 2nd ed.; Charles Griffin and Co.: London, UK, 1955. [Google Scholar]
- Agresti, A. Categorical Data Analysis; John Wiley & Sons: Hoboken, NJ, USA, 2002. [Google Scholar]
- Rue, H.; Riebler, A.; Sørbye, S.H.; Illian, J.B.; Simpson, D.P.; Lindgren, F.K. Bayesian computing with INLA: A review. Annu. Rev. Stat. Appl. 2017, 4, 395–421. [Google Scholar] [CrossRef]
- Pebesma, E.; Bivand, R.S. S classes and methods for spatial data: The sp package. R News 2005, 5, 9–13. [Google Scholar]
- Pebesma, E.J. Simple features for R: Standardized support for spatial vector data. R J. 2018, 10, 439. [Google Scholar] [CrossRef]
- Wickham, H.; Chang, W.; Wickham, M.H. Package ‘ggplot2’. Create elegant data visualisations using the grammar of graphics. Version 2016, 2, 1–189. [Google Scholar]
- Tennekes, M. tmap: Thematic Maps in R. J. Stat. Softw. 2018, 84, 1–39. [Google Scholar] [CrossRef]
- Ong, J.; Liu, X.; Rajarethinam, J.; Kok, S.Y.; Liang, S.; Tang, C.S.; Cook, A.R.; Ng, L.C.; Yap, G. Mapping dengue risk in Singapore using Random Forest. PLoS Negl. Trop. Dis. 2018, 12, e0006587. [Google Scholar] [CrossRef]
- Louis, V.R.; Phalkey, R.; Horstick, O.; Ratanawong, P.; Wilder-Smith, A.; Tozan, Y.; Dambach, P. Modeling tools for dengue risk mapping—A systematic review. Int. J. Health Geogr. 2014, 13, 50. [Google Scholar] [CrossRef] [PubMed]
- Porcasi, X.; Rotela, C.H.; Introini, M.V.; Frutos, N.; Lanfri, S.; Peralta, G.; De Elia, E.A.; Lanfri, M.A.; Scavuzzo, C.M. An operative dengue risk stratification system in Argentina based on geospatial technology. Geospat. Health 2012, 6, S31–S42. [Google Scholar] [CrossRef]
- Santos, J.P.C.; Honório, N.A.; Barcellos, C.; Nobre, A.A. A Perspective on Inhabited Urban Space: Land Use and Occupation, Heat Islands, and Precarious Urbanization as Determinants of Territorial Receptivity to Dengue in the City of Rio De Janeiro. Int. J. Environ. Res. Public Health 2020, 17, 6537. [Google Scholar] [CrossRef] [PubMed]
- Joint Research Centre-European Commission. Handbook on Constructing Composite Indicators: Methodology and User Guide; OECD Publishing: Paris, France, 2008. [Google Scholar]
- Mauro, V.; Giusti, C.; Marchetti, S.; Pratesi, M. Does uncertainty in single indicators affect the reliability of composite indexes? An application to the measurement of environmental performances of Italian regions. Ecol. Indic. 2021, 127, 107740. [Google Scholar] [CrossRef]
- Deeth, L.E.; Deardon, R.; Gillis, D.J. Model choice using the Deviance Information Criterion for latent conditional individual-level models of infectious disease spread. Epidemiol. Methods 2015, 4, 47–68. [Google Scholar] [CrossRef]
- Stresman, G.H.; Giorgi, E.; Baidjoe, A.; Knight, P.; Odongo, W.; Owaga, C.; Shagari, S.; Makori, E.; Stevenson, J.; Drakeley, C. Impact of metric and sample size on determining malaria hotspot boundaries. Sci. Rep. 2017, 7, 45849. [Google Scholar] [CrossRef]
- Hernandez-Avila, J.E.; Rodriguez, M.H.; Santos-Luna, R.; Sanchez-Castaneda, V.; Roman-Perez, S.; Rios-Salgado, V.H.; Salas-Sarmiento, J.A. Nation-wide, web-based, geographic information system for the integrated surveillance and control of dengue fever in Mexico. PLoS ONE 2013, 8, e70231. [Google Scholar] [CrossRef]
- Stewart-Ibarra, A.M.; Munoz, A.G.; Ryan, S.J.; Ayala, E.B.; Borbor-Cordova, M.J.; Finkelstein, J.L.; Mejia, R.; Ordonez, T.; Recalde-Coronel, G.C.; Rivero, K. Spatiotemporal clustering, climate periodicity, and social-ecological risk factors for dengue during an outbreak in Machala, Ecuador, in 2010. BMC Infect. Dis. 2014, 14, 610. [Google Scholar] [CrossRef]
- Machado-Machado, E.A. Empirical mapping of suitability to dengue fever in Mexico using species distribution modeling. Appl. Geogr. 2012, 33, 82–93. [Google Scholar] [CrossRef]
- Massaro, E.; Kondor, D.; Ratti, C. Assessing the interplay between human mobility and mosquito borne diseases in urban environments. Sci. Rep. 2019, 9, 16911. [Google Scholar] [CrossRef] [PubMed]
- Stoddard, S.T.; Forshey, B.M.; Morrison, A.C.; Paz-Soldan, V.A.; Vazquez-Prokopec, G.M.; Astete, H.; Reiner, R.C.; Vilcarromero, S.; Elder, J.P.; Halsey, E.S.; et al. House-to-house human movement drives dengue virus transmission. Proc. Natl. Acad. Sci. USA 2013, 110, 994–999. [Google Scholar] [CrossRef] [PubMed]
- Ramadona, A.L.; Tozan, Y.; Lazuardi, L.; Rocklöv, J. A combination of incidence data and mobility proxies from social media predicts the intra-urban spread of dengue in Yogyakarta, Indonesia. PLoS Negl. Trop. Dis. 2019, 13, e0007298. [Google Scholar] [CrossRef] [PubMed]
- Barbosa, G.L.; Donalísio, M.R.; Stephan, C.; Lourenço, R.W.; Andrade, V.R.; Arduino Mde, B.; de Lima, V.L. Spatial distribution of the risk of dengue and the entomological indicators in Sumaré, state of São Paulo, Brazil. PLoS Negl. Trop. Dis. 2014, 8, e2873. [Google Scholar] [CrossRef]
- Focks, D.A.; Brenner, R.J.; Hayes, J.; Daniels, E. Transmission thresholds for dengue in terms of Aedes aegypti pupae per person with discussion of their utility in source reduction efforts. Am. J. Trop. Med. Hyg. 2000, 62, 11–18. [Google Scholar] [CrossRef]
- Garjito, T.A.; Hidajat, M.C.; Kinansi, R.R.; Setyaningsih, R.; Anggraeni, Y.M.; Mujiyanto; Trapsilowati, W.; Jastal; Ristiyanto; Satoto, T.B.T.; et al. Stegomyia Indices and Risk of Dengue Transmission: A Lack of Correlation. Front. Public Health 2020, 8, 328. [Google Scholar] [CrossRef]
- Udayanga, L.; Gunathilaka, N.; Iqbal, M.C.M.; Najim, M.M.M.; Pahalagedara, K.; Abeyewickreme, W. Empirical optimization of risk thresholds for dengue: An approach towards entomological management of Aedes mosquitoes based on larval indices in the Kandy District of Sri Lanka. Parasites Vectors 2018, 11, 368. [Google Scholar] [CrossRef]
- Wakefield, J. Disease mapping and spatial regression with count data. Biostatistics 2007, 8, 158–183. [Google Scholar] [CrossRef]
- Yin, S.; Ren, C.; Shi, Y.; Hua, J.; Yuan, H.Y.; Tian, L.W. A Systematic Review on Modeling Methods and Influential Factors for Mapping Dengue-Related Risk in Urban Settings. Int. J. Environ. Res. Public Health 2022, 19, 15265. [Google Scholar] [CrossRef]
- Richards, H. Is the Application of a Vulnerability Framework Effective in Determining Patterns of the Incidence of Dengue Disease on the Island of Dominica? The Water Associated Disease Index (WADI) Model; Lancaster University: Lancaster, UK, 2018. [Google Scholar]
- Tsheten, T.; Clements, A.C.A.; Gray, D.J.; Wangdi, K. Dengue risk assessment using multicriteria decision analysis: A case study of Bhutan. PLoS Negl. Trop. Dis. 2021, 15, e0009021. [Google Scholar] [CrossRef] [PubMed]
- Harsha, G.; Anish, T.S.; Rajaneesh, A.; Prasad, M.K.; Mathew, R.; Mammen, P.C.; Ajin, R.S.; Kuriakose, S.L. Dengue risk zone mapping of Thiruvananthapuram district, India: A comparison of the AHP and F-AHP methods. GeoJournal 2022, 1–22. [Google Scholar] [CrossRef] [PubMed]
- Stresman, G.H.; Mwesigwa, J.; Achan, J.; Giorgi, E.; Worwui, A.; Jawara, M.; Di Tanna, G.L.; Bousema, T.; Van Geertruyden, J.-P.; Drakeley, C.; et al. Do hotspots fuel malaria transmission: A village-scale spatio-temporal analysis of a 2-year cohort study in The Gambia. BMC Med. 2018, 16, 160. [Google Scholar] [CrossRef] [PubMed]


| Component | Indicators | Description | Source * |
|---|---|---|---|
| Epidemiological | Cumulative number of dengue cases | Cumulative number of confirmed dengue cases | Based on retrospective surveillance data from 2010–2015 on dengue cases |
| Cumulative incidence of dengue cases | Cumulative number of confirmed dengue cases per 10,000 inhabitants | ||
| Proportion of severe dengue cases | Proportion of severe cases among confirmed dengue cases | ||
| Times initiating outbreak | Number of times that dengue seasonal increase started in CP | ||
| Dengue case persistence | Number of months with more than five cases per month | ||
| Entomological | Maximum monthly Breteau index averaged over the years of the study period | Breteau index of the month with highest Aedes infestation per year, averaged over time 1 | Based on retrospective entomological surveillance data from 2010–2015 |
| Average monthly Breteau index | Average monthly Breteau index over time | ||
| Pupae per house index | Pupae per house index from the last epidemic year of the study period (2014) 2 | ||
| Demographic | Population density (per square km) | Population divided by the surface in square kilometers | National Statistics Office, Provincial Office of the Ministry of Health |
| Locations with high human concentration and mobility | Number of locations within a CP with intense daytime human mobility and concentration. These locations were identified by local knowledgeable field workers based on their qualitative appraisal of heavy circulation or prolonged presence of persons and selected by consensus. They included, among others, schools, factories, health centers, transportation nodes and markets. |
| CP | Epidemiological Z (R) 1 | Entomological Z (R) 1 | Demographic Z (R) 1 | KBMCvulnerability Index 2, Z (R) 1 |
|---|---|---|---|---|
| Santiago de Cuba | ||||
| Los Olmos | 0.34 (4) | 1.02 (5) | 1.12 (5) | 0.83 (5) |
| Guillermón Moncada | 1.17 (5) | 0.04 (3) | 1.02 (5) | 0.74 (5) |
| Altamira | 1.13 (5) | 1.32 (5) | −0.39 (2) | 0.69 (5) |
| Flores | 0.23 (4) | 1.19 (5) | 0.42 (4) | 0.61 (5) |
| Vista Hermosa | 0.14 (3) | 1.75 (5) | −0.24 (3) | 0.55 (4) |
| J. M. Heredia | −0.12 (3) | −0.36 (2) | 1.75 (5) | 0.42 (4) |
| Los Maceos | 0.41 (4) | −0.21 (3) | 0.65 (5) | 0.28 (4) |
| 30 de Noviembre | −0.06 (3) | 0.43 (4) | 0.19 (4) | 0.19 (4) |
| Chicharrones | 0.76 (5) | 0.35 (4) | −0.6 (2) | 0.17 (3) |
| Veguita de Galo | 0.42 (5) | 0.56 (4) | −0.78 (1) | 0.07 (3) |
| Aguero Mar Verde | 0.26 (4) | 0.17 (4) | −0.54 (2) | −0.04 (3) |
| Sueño | −0.15 (2) | −0.14 (3) | −0.03 (3) | −0.1 (3) |
| Mariana Grajales | −0.5 (2) | −0.1 (3) | −0.18 (3) | −0.26 (2) |
| Santa Bárbara | −0.09 (3) | −0.97 (1) | 0.03 (4) | −0.34 (2) |
| Vista Alegre | −0.62 (2) | −0.48 (2) | −0.06 (3) | −0.39 (2) |
| José Martí Sur | −0.6 (2) | −1.57 (1) | −0.02 (4) | −0.73 (2) |
| Manuel Isla | −0.78 (1) | −0.87 (2) | −0.67 (1) | −0.78 (1) |
| José Martí Norte | −0.83 (1) | −1.38 (1) | −0.54 (2) | −0.92 (1) |
| Ciudamar | −1.12 (1) | −0.75 (2) | −1.12 (1) | −0.99 (1) |
| Cienfuegos | ||||
| La Juanita | 1.34 (5) | 2.28 (5) | 1.45 (5) | 1.69 (5) |
| La Gloria | 1.06 (5) | 2.12 (5) | 0.97 (5) | 1.38 (5) |
| Centro Histórico | 0.93 (5) | 0.2 (4) | 2.3 (5) | 1.15 (5) |
| Juanita 2 | 0.44 (4) | 0.69 (5) | 0.75 (5) | 0.63 (5) |
| Reina | 0.74 (5) | 0.59 (4) | 0.29 (4) | 0.54 (4) |
| Punta Gorda | 0.3 (4) | 0.71 (5) | 0.03 (3) | 0.35 (4) |
| Junco Sur | 0.16 (3) | 0.29 (4) | 0.1 (4) | 0.18 (4) |
| Tulipán | 0.49 (4) | −0.29 (3) | 0.23 (4) | 0.15 (4) |
| San Lázaro | 0.19 (4) | 0.24 (4) | −0.27 (3) | 0.05 (3) |
| Buena Vista | 0.16 (3) | −0.14 (3) | −0.57 (2) | −0.19 (3) |
| Pastorita | −0.22 (3) | −0.56 (3) | −0.36 (3) | −0.38 (3) |
| Pueblo Griffo | −0.44 (2) | −0.2 (3) | −0.74 (2) | −0.46 (3) |
| Caonao | −0.58 (2) | −0.93 (1) | −0.06 (3) | −0.53 (2) |
| La Barrera | −0.12 (3) | −0.63 (2) | −0.85 (2) | −0.53 (2) |
| Rancho Luna | −0.93 (1) | −0.97 (1) | 0.08 (4) | −0.61 (2) |
| Castillo-CEN | −0.89 (2) | −0.66 (2) | −0.48 (2) | −0.67 (2) |
| Paraíso | −0.76 (2) | −0.92 (2) | −0.95 (1) | −0.87 (1) |
| Guaos | −0.93 (1) | −0.92 (1) | −0.95 (1) | −0.93 (1) |
| Pepito Tey | −0.93 (1) | −0.91 (2) | −0.96 (1) | −0.94 (1) |
| Cienfuegos | Santiago de Cuba | |||||
|---|---|---|---|---|---|---|
| Model | DIC | p.eff | WAIC | DIC | p.eff | WAIC |
| FIXED | 1112.03 | −112.87 | 2056.54 | 1399.36 | −129.65 | 2385.63 |
| IID | 164.66 | 18.05 | 160.38 | 202.74 | 18.88 | 197.03 |
| ICAR | 163.38 | 17.86 | 158.29 | 202.82 | 18.88 | 197.22 |
| BYM | 164.67 | 18.08 | 160.35 | 202.74 | 18.88 | 197.03 |
| BYM2 | 163.85 | 17.90 | 159.08 | 202.76 | 18.89 | 197.05 |
| LEROUX | 163.80 | 17.99 | 158.89 | 202.77 | 18.88 | 197.08 |
| SLM | 163.96 | 18.07 | 159.05 | 202.76 | 18.89 | 197.07 |
| Cienfuegos 2 | Santiago de Cuba 3 | |||
|---|---|---|---|---|
| Coefficients 1 | Mean 4 (SD) | (LL; UL) 4 | Mean (SD) | (LL; UL) |
| (Intercept) | 0.36 (0.077) | (0.304; 0.412) | 0.87(0.079) | (0.74; 1.02) |
| Population density | 1.01 (0.483) | (0.372; 2.56) | 1.03 (0.095) | (0.85; 1.25) |
| Locations with high human concentration | 1.22 (0.233) | (0.77; 1.954) | 1.07 (0.087) | (0.90; 1.27) |
| Maximum monthly Breteau index | 0.72 (0.549) | (0.234; 2.108) | 1.17 (0.125) | (0.91; 1.50) |
| Pupae per house index | 1.83 (0.485) | (0.695; 4.843) | 1.05 (0.112) | (0.84; 1.31) |
| Proportion of severe cases | 0.94 (0.249) | (0.572; 1.552) | 0.87 (0.108) | (0.70; 1.07) |
| Times initiating outbreak | 0.78 (0.483) | (0.302; 2.085) | 0.96 (0.099) | (0.79; 1.17) |
| Dengue case persistence | 3.16 (0.6) | (1.022; 11.132) | 1.36 (0.145) | (1.02; 1.82) |
| Vulnerability Models | Risk Models | ||||
|---|---|---|---|---|---|
| CPs | KBMCvulnerability Index | PCAMCvulnerability Index | MCincidence | SCincidence | SCSIR |
| Santiago de Cuba | |||||
| Guillermón Moncada | 5 | 4 | 5 | 5 | 5 |
| Veguita de Galo | 3 | 3 | 5 | 5 | 5 |
| Los Olmos | 5 | 5 | 5 | 5 | 5 |
| Chicharrones | 3 | 3 | 5 | 5 | 5 |
| Sueño | 3 | 3 | 4 | 4 | 4 |
| Altamira | 5 | 4 | 4 | 4 | 4 |
| Vista Hermosa | 4 | 5 | 4 | 4 | 4 |
| Los Maceo | 4 | 5 | 4 | 3 | 4 |
| J. M. Heredia | 4 | 4 | 3 | 3 | 3 |
| Flores | 5 | 5 | 3 | 3 | 3 |
| 30 de Noviembre | 4 | 4 | 3 | 3 | 3 |
| Santa Barbara | 2 | 2 | 3 | 4 | 3 |
| Vista Alegre | 2 | 2 | 2 | 2 | 2 |
| Aguero Mar Verde | 3 | 3 | 2 | 2 | 2 |
| Ciudamar | 1 | 1 | 2 | 2 | 2 |
| Manuel Isla | 1 | 1 | 2 | 1 | 2 |
| José Martí Sur | 2 | 2 | 1 | 1 | 1 |
| José Martí Norte | 1 | 1 | 1 | 2 | 1 |
| Mariana Grajales | 2 | 2 | 1 | 1 | 1 |
| Cienfuegos | |||||
| La Gloria | 5 | 5 | 5 | 5 | 5 |
| Reina | 4 | 4 | 5 | 5 | 5 |
| Centro Histórico | 5 | 5 | 5 | 5 | 5 |
| Tulipán | 4 | 4 | 5 | 5 | 5 |
| La Juanita | 5 | 5 | 4 | 4 | 4 |
| Juanita 2 | 5 | 5 | 4 | 4 | 4 |
| Punta Gorda | 4 | 4 | 4 | 4 | 4 |
| Junco Sur | 4 | 4 | 4 | 4 | 4 |
| San Lázaro | 3 | 3 | 3 | 3 | 3 |
| Pueblo Griffo | 3 | 3 | 3 | 3 | 3 |
| Buena Vista | 3 | 3 | 3 | 3 | 3 |
| Pastorita | 3 | 3 | 3 | 3 | 3 |
| Caonao | 2 | 2 | 2 | 2 | 2 |
| Paraíso | 1 | 1 | 2 | 2 | 2 |
| La Barrera | 2 | 2 | 2 | 2 | 2 |
| Castillo-CEN | 2 | 2 | 2 | 2 | 2 |
| Rancho Luna | 2 | 2 | 1 | 1 | 1 |
| Pepito Tey | 1 | 1 | 1 | 1 | 1 |
| Guaos | 1 | 1 | 1 | 1 | 1 |
| Vulnerability Models | Risk Models | ||||
|---|---|---|---|---|---|
| KBMCvulnerability Index | PCAMCvulnerability Index | MCincidence | SCincidence | SCSIR | |
| Santiago de Cuba | |||||
| KBMCvulnerability index | 1 *** | 0.89 *** | 0.55 * | 0.5 * | 0.55 * |
| PCAMCvulnerability index | 0.89 *** | 1 *** | 0.51 * | 0.43 | 0.51 * |
| MCincidence | 0.55 * | 0.51 * | 1 *** | 0.9 *** | 1 *** |
| SCincidence | 0.5 * | 0.43 | 0.9 *** | 1 *** | 0.9 *** |
| SCSIR | 0.55 * | 0.51 * | 1 *** | 0.9 *** | 1 *** |
| Cienfuegos | |||||
| KBMCvulnerability index | 1 *** | 1 *** | 0.84 *** | 0.84 *** | 0.84 *** |
| PCAMCvulnerability index | 1 *** | 1 *** | 0.84 *** | 0.84 *** | 0.84 *** |
| MCincidence | 0.84 *** | 0.84 *** | 1 *** | 1 *** | 1 *** |
| SCincidence | 0.84 *** | 0.84 *** | 1 *** | 1 *** | 1 *** |
| SCSIR | 0.84 *** | 0.84 *** | 1 *** | 1 *** | 1 *** |
Disclaimer/Publisher’s Note: The statements, opinions and data contained in all publications are solely those of the individual author(s) and contributor(s) and not of MDPI and/or the editor(s). MDPI and/or the editor(s) disclaim responsibility for any injury to people or property resulting from any ideas, methods, instructions or products referred to in the content. |
© 2023 by the authors. Licensee MDPI, Basel, Switzerland. This article is an open access article distributed under the terms and conditions of the Creative Commons Attribution (CC BY) license (https://creativecommons.org/licenses/by/4.0/).
Share and Cite
Baldoquín Rodríguez, W.; Mirabal, M.; Van der Stuyft, P.; Gómez Padrón, T.; Fonseca, V.; Castillo, R.M.; Monteagudo Díaz, S.; Baetens, J.M.; De Baets, B.; Toledo Romaní, M.E.; et al. The Potential of Surveillance Data for Dengue Risk Mapping: An Evaluation of Different Approaches in Cuba. Trop. Med. Infect. Dis. 2023, 8, 230. https://doi.org/10.3390/tropicalmed8040230
Baldoquín Rodríguez W, Mirabal M, Van der Stuyft P, Gómez Padrón T, Fonseca V, Castillo RM, Monteagudo Díaz S, Baetens JM, De Baets B, Toledo Romaní ME, et al. The Potential of Surveillance Data for Dengue Risk Mapping: An Evaluation of Different Approaches in Cuba. Tropical Medicine and Infectious Disease. 2023; 8(4):230. https://doi.org/10.3390/tropicalmed8040230
Chicago/Turabian StyleBaldoquín Rodríguez, Waldemar, Mayelin Mirabal, Patrick Van der Stuyft, Tania Gómez Padrón, Viviana Fonseca, Rosa María Castillo, Sonia Monteagudo Díaz, Jan M. Baetens, Bernard De Baets, Maria Eugenia Toledo Romaní, and et al. 2023. "The Potential of Surveillance Data for Dengue Risk Mapping: An Evaluation of Different Approaches in Cuba" Tropical Medicine and Infectious Disease 8, no. 4: 230. https://doi.org/10.3390/tropicalmed8040230