
Modeling the Climatic Suitability of COVID-19 Cases in Brazil

 ,
,  , ,
, ,
Abstract
:1. Introduction
2. Materials and Methods
2.1. Health Data
2.2. Climate Data
2.3. Data Analysis
3. Results
4. Discussion
5. Conclusions
Author Contributions
Funding
Institutional Review Board Statement
Informed Consent Statement
Data Availability Statement
Conflicts of Interest
Appendix A

References
- Johns Hopkins. COVID-19 Dashboard by the Center for Systems Science and Engineering (CSSE) at Johns Hopkins University (JHU). Available online: https://coronavirus.jhu.edu/map.html (accessed on 23 September 2021).
- Worlddometer: Report Cases an Deaths by Country or Territory. Available online: https://www.worldometers.info/coronavirus/ (accessed on 2 January 2023).
- Brasil, Ministério da Saúde. Boletim Epidemiológico Especial. Doença pelo Coronavírus COVID-19 em 2020. Available online: https://www.gov.br/saude/pt-br/centrais-de-conteudo/publicacoes/boletins/epidemiologicos/covid-19/2020/boletim_epidemiologico_covid_43_final_coe.pdf (accessed on 3 January 2021).
- Auler, A.C.; Cássaro, F.A.M.; da Silva, V.O.; Pires, L.F. Evidence that high temperatures and intermediate relative humidity might favor the spread of COVID-19 in tropical climate: A case study for the most affected Brazilian cities. Sci. Total Environ. 2020, 729, 139090. [Google Scholar] [CrossRef] [PubMed]
- Jones, K.E.; Patel, N.G.; Levy, M.A.; Storeygard, A.; Balk, D.; Gittleman, J.L.; Daszak, P. Global trends in emerging infectious diseases. Nature 2008, 451, 990–993. [Google Scholar] [CrossRef]
- McMichael, A.J.; Woodruff, R.E.; Hales, S. Climate change and human health: Present and future risks. Lancet 2006, 367, 859–869. [Google Scholar] [CrossRef] [PubMed]
- Joung, Y.H.; Jang, T.S.; Kim, J.K. Association among sentinel surveillance, meteorological factors, and infectious disease in Gwangju, Korea. Environ. Sci. Pollut. Res. Int. 2022, 29, 17561–17569. [Google Scholar] [CrossRef] [PubMed]
- Bashir, M.F.; Ma, B.; Bilal; Komal, B.; Bashir, M.A.; Tan, D.; Bashir, M. Correlation between climate indicators and COVID-19 pandemic in New York, USA. Sci. Total Environ. 2020, 728, 138835. [Google Scholar] [CrossRef] [PubMed]
- Holtmann, M.; Jones, M.; Shah, A.; Holtmann, G. Low ambient temperatures are associated with more rapid spread of COVID-19 in the early phase of the endemic. Environ. Res. 2020, 186, 109625. [Google Scholar] [CrossRef]
- Rosario, D.K.A.; Mutz, Y.S.; Bernardes, P.C.; Conte-Junior, C.A. Relationship between COVID-19 and weather: Case study in a tropical country. Int. J. Hyg. Environ. Health 2020, 229, 113587. [Google Scholar] [CrossRef]
- Boufekane, A.; Busico, G.; Maizi, D. Effects of temperature and relative humidity on the COVID-19 pandemic in different climates: A study across some regions in Algeria (North Africa). Environ. Sci. Pollut. Res. Int. 2022, 29, 18077–18102. [Google Scholar] [CrossRef]
- Sangkham, S.; Thongtip, S.; Vongruang, P. Influence of air pollution and meteorological factors on the spread of COVID-19 in the Bangkok Metropolitan Region and air quality during the outbreak. Environ. Res. 2021, 197, 111104. [Google Scholar] [CrossRef]
- Martelletti, L.; Martelletti, P. Air Pollution and the Novel COVID-19 Disease: A Putative Disease Risk Factor. SN Compr. Clin. Med. 2020, 2, 383–387. [Google Scholar] [CrossRef] [Green Version]
- Conticini, E.; Frediani, B.; Caro, D. Can atmospheric pollution be considered a co-factor in extremely high level of SARS-CoV-2 lethality in Northern Italy? Environ. Pollut. 2020, 261, 114465. [Google Scholar] [CrossRef] [PubMed]
- Ahn, D.G.; Shin, H.J.; Kim, M.H.; Lee, S.; Kim, H.S.; Myoung, J.; Kim, B.T.; Kim, S.J. Current Status of Epidemiology, Diagnosis, Therapeutics, and Vaccines for Novel Coronavirus Disease 2019 (COVID-19). J. Microbiol. Biotechnol. 2020, 30, 313–324. [Google Scholar] [CrossRef] [PubMed]
- GitHub-Wcota/COVID-19br: COVID-19 Data in Brazil: Cases, Deaths, and Vaccination at Municipal (City) Level. Available online: https://github.com/wcota/covid19br (accessed on 2 January 2022).
- Fick, S.E.; Hijmans, R.J. WorldClim 2: New 1-km spatial resolution climate surfaces for global land areas. Int. J. Climatol. 2017, 37, 4302–4315. [Google Scholar] [CrossRef]
- Koch, L.K.; Kochmann, J.; Klimpel, S.; Cunze, S. Modeling the climatic suitability of leishmaniasis vector species in Europe. Sci. Rep. 2017, 7, 13325. [Google Scholar] [CrossRef] [Green Version]
- Thuiller, W.; Georges, D.; Engler, R.; Breiner, F.; Georges, M.D.; Thuiller, C.W. Package ‘Biomod2′. Ensemble Platform for Species Distribution Modeling; (R Package Version 4.2.2). Available online: https://cran.r-project.org/package=biomod2 (accessed on 3 January 2022).
- Ford, J.D.; Zavaleta-Cortijo, C.; Ainembabazi, T.; Anza-Ramirez, C.; Arotoma-Rojas, I.; Bezerra, J.; Chicmana-Zapata, V.; Galappaththi, E.K.; Hangula, M.; Kazaana, C.; et al. Interactions between climate and COVID-19. Lancet Planet. Health 2022, 6, e825–e833. [Google Scholar] [CrossRef]
- da Costa Portella, D.A.P.; de Souza Blanco, L.; de Mello Filho, M.E.T.; dos Santos, J.L.A. A importância da amazônia na dinâmica climática do centro-sul brasileiro: Influência nas dinâmicas ambientais e socioeconômicas. Ens. De Geogr. 2022, 9, 66–86. [Google Scholar]
- Zhang, Y.; Bambrick, H.; Mengersen, K.; Tong, S.; Hu, W. Using Google Trends and ambient temperature to predict seasonal influenza outbreaks. Environ. Int. 2018, 117, 284–291. [Google Scholar] [CrossRef]
- Naveca, F.G.; Nascimento, V.; de Souza, V.C.; de Lima Corado, A.; Nascimento, F.; Silva, G.; Costa, Á.; Duarte, D.; Pessoa, K.; Mejía, M.; et al. COVID-19 in Amazonas, Brazil, was driven by the persistence of endemic lineages and P.1 emergence. Nat. Med. 2021, 27, 1230–1238. [Google Scholar] [CrossRef]
- Retel, C.; Märkle, H.; Becks, L.; Feulner, P.G.D. Ecological and Evolutionary Processes Shaping Viral Genetic Diversity. Viruses 2019, 11, 220. [Google Scholar] [CrossRef] [Green Version]
- Cavalieri, H.; Cario, S.A.F.; Fernandes, R.L. Estrutura industrial brasileira e de Santa Catarina: Alguns indícios de desindustrialização. Indic. Econ. FEE 2013, 40, 81–104. [Google Scholar]
- Andretta, I.; Hickmann, F.M.W.; Remus, A.; Franceschi, C.H.; Mariani, A.B.; Orso, C.; Kipper, M.; Létourneau-Montminy, M.P.; Pomar, C. Environmental Impacts of Pig and Poultry Production: Insights From a Systematic Review. Front. Vet. Sci. 2021, 8, 750733. [Google Scholar] [CrossRef]
- Dantas, G.; Gorne, I.; da Silva, C.M.; Arbilla, G. Benzene, Toluene, Ethylbenzene and Xylene (BTEX) Concentrations in Urban Areas Impacted by Chemical and Petrochemical Industrial Emissions. Bull. Environ. Contam. Toxicol. 2022, 108, 204–211. [Google Scholar] [CrossRef]
- Wu, J.T.; Leung, K.; Leung, G.M. Nowcasting and forecasting the potential domestic and international spread of the 2019-nCoV outbreak originating in Wuhan, China: A modelling study. Lancet 2020, 395, 689–697. [Google Scholar] [CrossRef] [PubMed] [Green Version]
- Zanobetti, A.; O’Neill, M.S.; Gronlund, C.J.; Schwartz, J.D. Summer temperature variability and long-term survival among elderly people with chronic disease. Proc. Natl. Acad. Sci. USA 2012, 109, 6608–6613. [Google Scholar] [CrossRef] [Green Version]
- Chen, N.; Zhou, M.; Dong, X.; Qu, J.; Gong, F.; Han, Y.; Qiu, Y.; Wang, J.; Liu, Y.; Wei, Y.; et al. Epidemiological and clinical characteristics of 99 cases of 2019 novel coronavirus pneumonia in Wuhan, China: A descriptive study. Lancet 2020, 395, 507–513. [Google Scholar] [CrossRef] [Green Version]
- Byun, W.S.; Heo, S.W.; Jo, G.; Kim, J.W.; Kim, S.; Lee, S.; Park, H.E.; Baek, J.H. Is coronavirus disease (COVID-19) seasonal? A critical analysis of empirical and epidemiological studies at global and local scales. Environ. Res. 2021, 196, 110972. [Google Scholar] [CrossRef]
- Shi, P.; Dong, Y.; Yan, H.; Zhao, C.; Li, X.; Liu, W.; He, M.; Tang, S.; Xi, S. Impact of temperature on the dynamics of the COVID-19 outbreak in China. Sci. Total Environ. 2020, 728, 138890. [Google Scholar] [CrossRef] [PubMed]
- Zoran, M.A.; Savastru, R.S.; Savastru, D.M.; Tautan, M.N.; Baschir, L.A.; Tenciu, D.V. Assessing the impact of air pollution and climate seasonality on COVID-19 multiwaves in Madrid, Spain. Environ. Res. 2022, 203, 111849. [Google Scholar] [CrossRef]
- Tosepu, R.; Gunawan, J.; Effendy, D.S.; Ahmad, O.A.I.; Lestari, H.; Bahar, H.; Asfian, P. Correlation between weather and COVID-19 pandemic in Jakarta, Indonesia. Sci. Total Environ. 2020, 725, 138436. [Google Scholar] [CrossRef] [PubMed]
- Hoang, T.; Tran, T.T.A. Ambient air pollution, meteorology, and COVID-19 infection in Korea. J. Med. Virol. 2021, 93, 878–885. [Google Scholar] [CrossRef] [PubMed]
- Tchicaya, A.; Lorentz, N.; Omrani, H.; de Lanchy, G.; Leduc, K. Impact of long-term exposure to PM(2.5) and temperature on coronavirus disease mortality: Observed trends in France. Environ. Health 2021, 20, 101. [Google Scholar] [CrossRef] [PubMed]
- Jansson, M.K.; Yamamoto, S. The effect of temperature, humidity, precipitation and cloud coverage on the risk of COVID-19 infection in temperate regions of the USA-A case-crossover study. PLoS ONE 2022, 17, e0273511. [Google Scholar] [CrossRef]
- Prata, D.N.; Rodrigues, W.; Bermejo, P.H. Temperature significantly changes COVID-19 transmission in (sub)tropical cities of Brazil. Sci. Total Environ. 2020, 729, 138862. [Google Scholar] [CrossRef] [PubMed]
- Prata, D.; Rodrigues, W.; De Souza Bermejo, P.H.; Moreira, M.; Camargo, W.; Lisboa, M.; Rossone Reis, G.; de Araujo, H.X. The relationship between (sub)tropical climates and the incidence of COVID-19. PeerJ 2021, 9, e10655. [Google Scholar] [CrossRef] [PubMed]
- Menebo, M.M. Temperature and precipitation associate with COVID-19 new daily cases: A correlation study between weather and COVID-19 pandemic in Oslo, Norway. Sci. Total Environ. 2020, 737, 139659. [Google Scholar] [CrossRef]
- Martinez, M.E. The calendar of epidemics: Seasonal cycles of infectious diseases. PLoS Pathog. 2018, 14, e1007327. [Google Scholar] [CrossRef] [Green Version]
- Hoogeveen, M.J.; Hoogeveen, E.K. Comparable seasonal pattern for COVID-19 and flu-like illnesses. One Health 2021, 13, 100277. [Google Scholar] [CrossRef]
- Jayaweera, M.; Perera, H.; Gunawardana, B.; Manatunge, J. Transmission of COVID-19 virus by droplets and aerosols: A critical review on the unresolved dichotomy. Environ. Res. 2020, 188, 109819. [Google Scholar] [CrossRef]


| Dependent Variables | Bioclimatic Variables | Statistical Algorithms | ||||||
|---|---|---|---|---|---|---|---|---|
| GLM | GAM | CTA | FDA | MARS | RF | MAXENT | ||
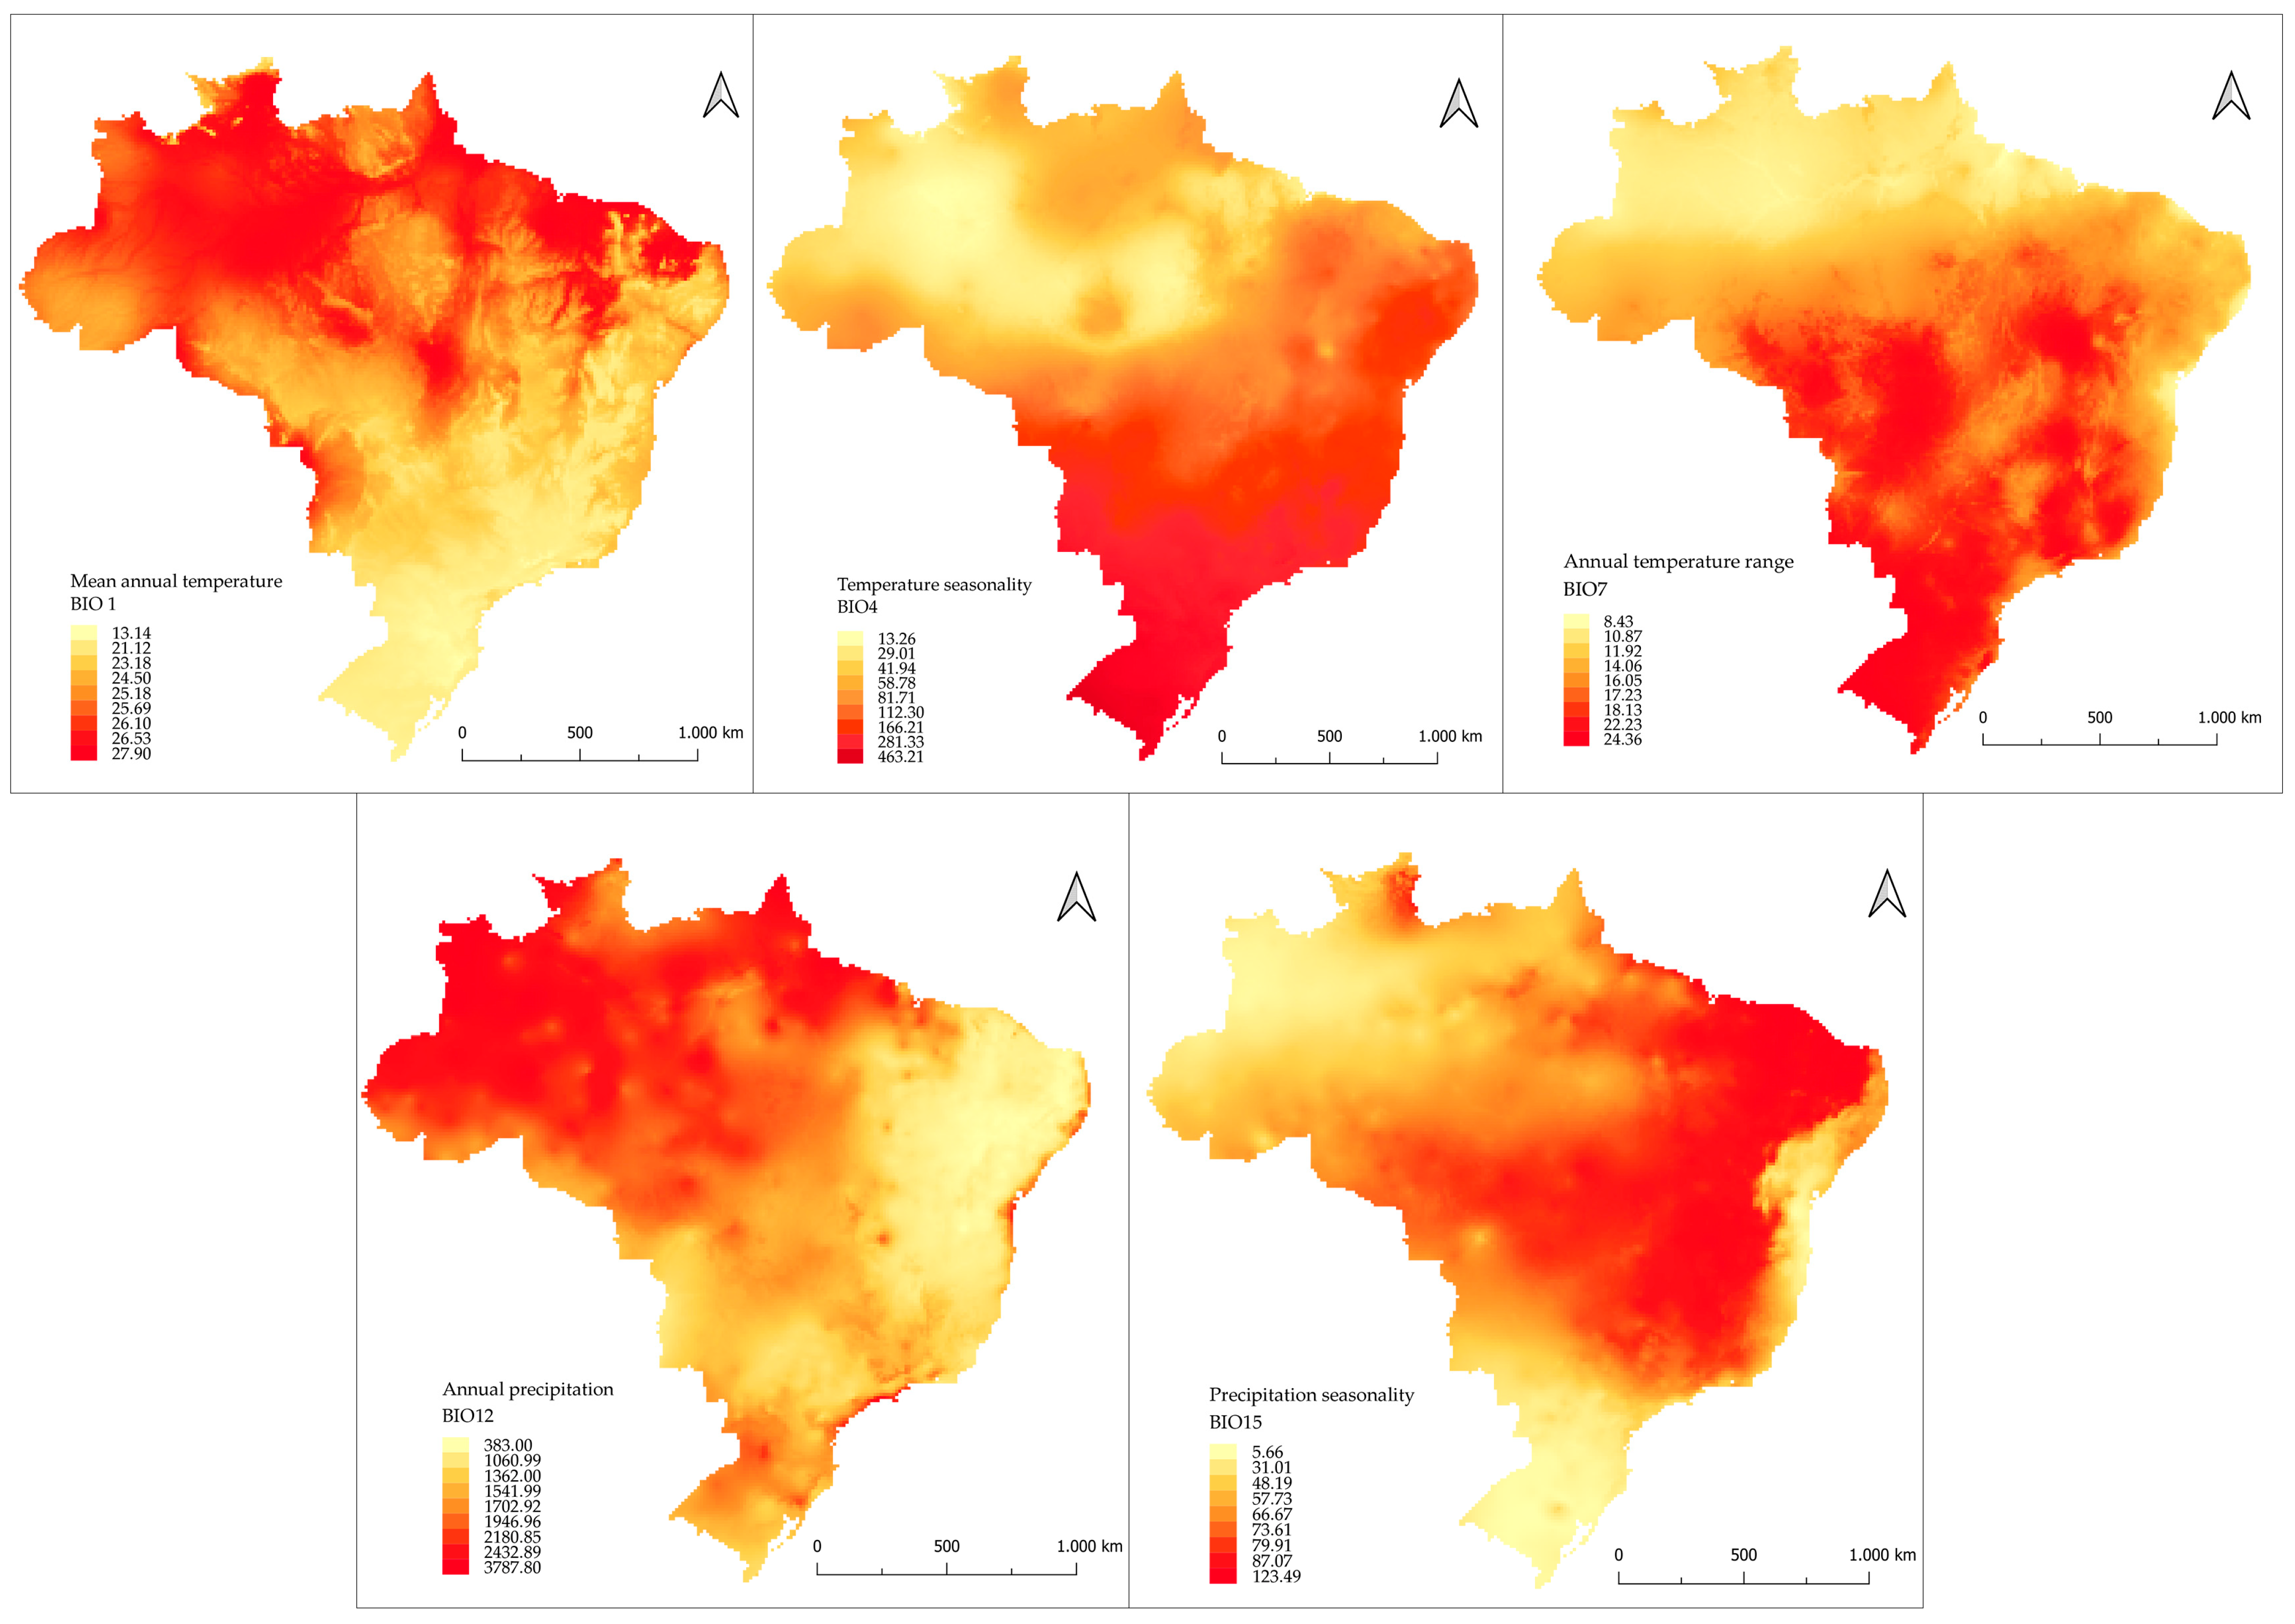
| High incidence (HI) | Annual temperature range (BIO7) | 0.647 | 0.519 | 0.326 | 0.323 | 0.519 | 0.361 | 0.550 |
| Precipitation seasonality (BIO15) | 0.164 | 0.359 | 0.486 | 0.166 | 0.420 | 0.339 | 0.488 | |
| Annual precipitation (BIO12) | 0.206 | 0.303 | 0.436 | 0.141 | 0.390 | 0.272 | 0.448 | |
| Temperature seasonality (BIO4) | 0.010 | 0.177 | 0.524 | 0.629 | 0.087 | 0.280 | 0.045 | |
| Mean annual temperature (BIO1) | 0.081 | 0.118 | 0.510 | 0.128 | 0.120 | 0.202 | 0.097 | |
| Mortality Rate (MR) | Annual temperature range (BIO7) | 0.709 | 0.320 | 0.359 | 0.283 | 0.286 | 0.499 | 0.333 |
| Annual precipitation (BIO12) | 0.119 | 0.418 | 0.458 | 0.219 | 0.474 | 0.501 | 0.436 | |
| Temperature seasonality (BIO4) | 0.011 | 0.146 | 0.607 | 0.460 | 0.142 | 0.639 | 0.078 | |
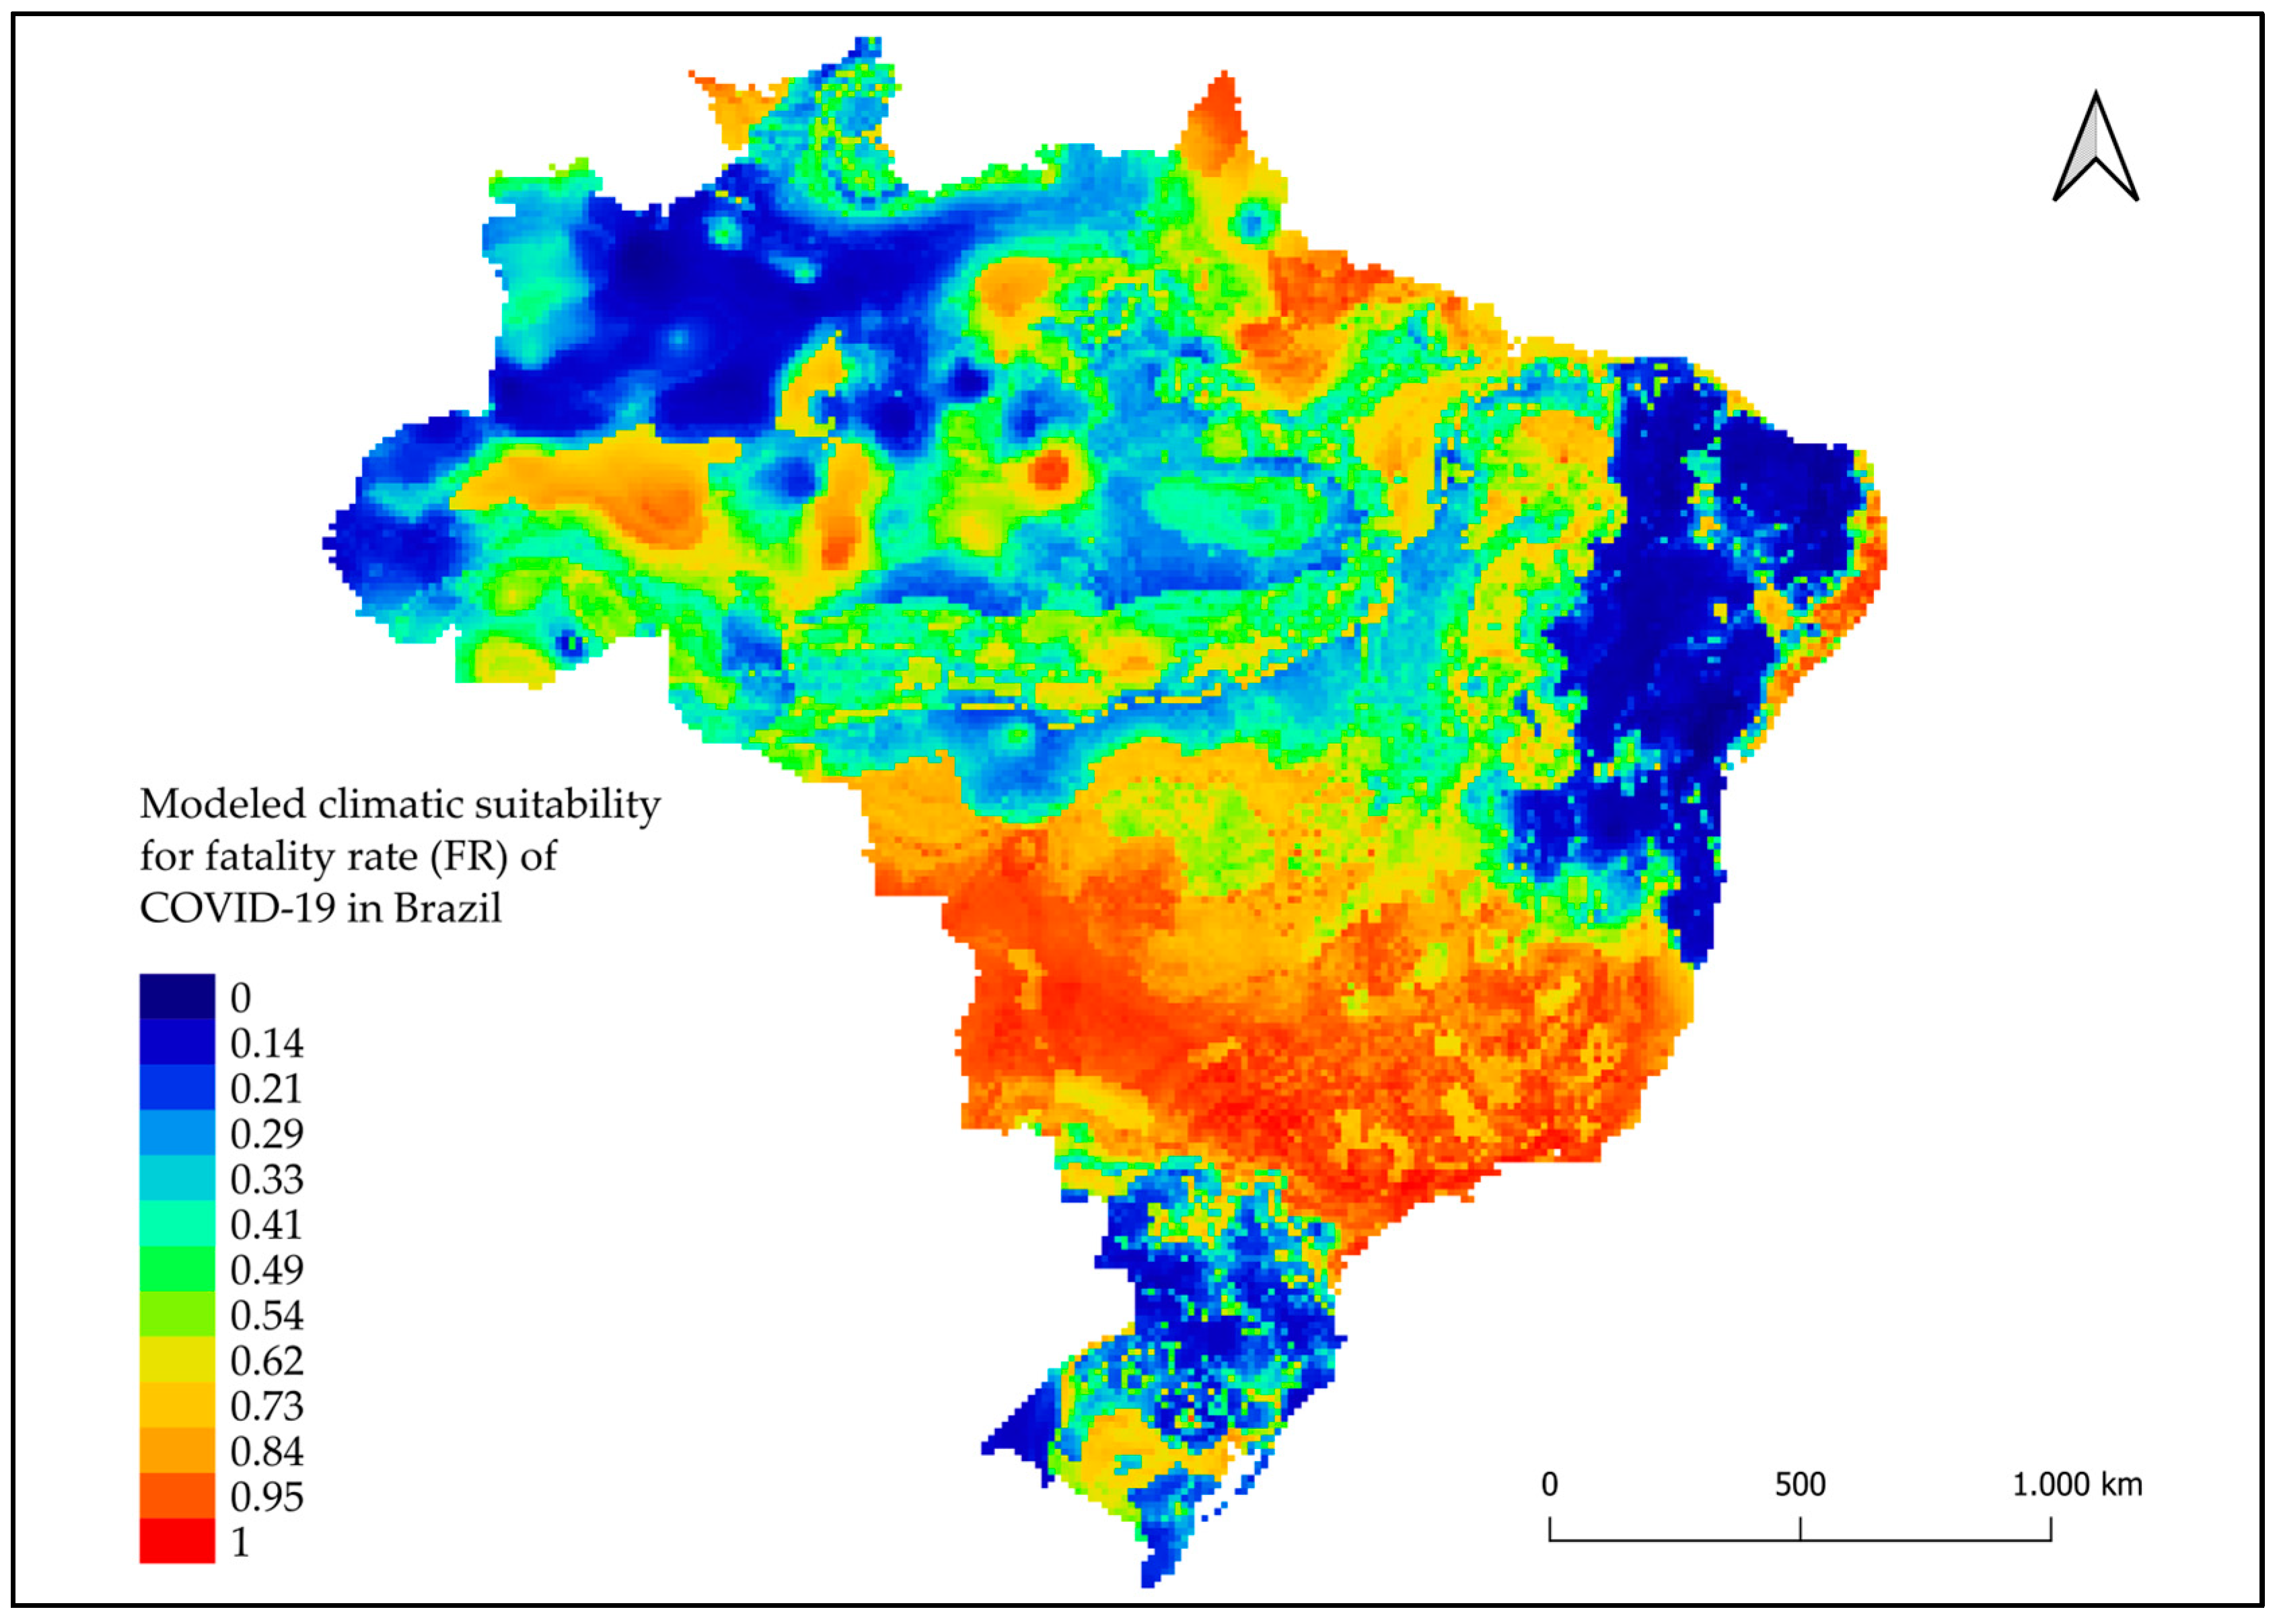
| Fatality Rate (FR) | Precipitation seasonality (BIO15) | 0.760 | 0.366 | 0.744 | 0.636 | 0.597 | 0.591 | 0.550 |
| Temperature seasonality (BIO4) | 0.569 | 0.306 | 0.768 | 0.375 | 0.283 | 0.719 | 0.246 | |
| Annual precipitation (BIO12) | 0.478 | 0.286 | 0.541 | 0.274 | 0.372 | 0.532 | 0.380 | |
| Dependent Variables | Test ROC | Sensitivity | Specificity |
|---|---|---|---|
| High Incidence (HI) | 0.851 | 84.321 | 72.167 |
| Mortality Rate (MR) | 0.881 | 76.723 | 83.490 |
| Fatality Rate (FR) | 0.821 | 83.067 | 63.098 |
Disclaimer/Publisher’s Note: The statements, opinions and data contained in all publications are solely those of the individual author(s) and contributor(s) and not of MDPI and/or the editor(s). MDPI and/or the editor(s) disclaim responsibility for any injury to people or property resulting from any ideas, methods, instructions or products referred to in the content. |
© 2023 by the authors. Licensee MDPI, Basel, Switzerland. This article is an open access article distributed under the terms and conditions of the Creative Commons Attribution (CC BY) license (https://creativecommons.org/licenses/by/4.0/).
Share and Cite
Neves, J.M.M.; Belo, V.S.; Catita, C.M.S.; de Oliveira, B.F.A.; Horta, M.A.P. Modeling the Climatic Suitability of COVID-19 Cases in Brazil. Trop. Med. Infect. Dis. 2023, 8, 198. https://doi.org/10.3390/tropicalmed8040198
Neves JMM, Belo VS, Catita CMS, de Oliveira BFA, Horta MAP. Modeling the Climatic Suitability of COVID-19 Cases in Brazil. Tropical Medicine and Infectious Disease. 2023; 8(4):198. https://doi.org/10.3390/tropicalmed8040198
Chicago/Turabian StyleNeves, Jéssica Milena Moura, Vinicius Silva Belo, Cristina Maria Souza Catita, Beatriz Fátima Alves de Oliveira, and Marco Aurelio Pereira Horta. 2023. "Modeling the Climatic Suitability of COVID-19 Cases in Brazil" Tropical Medicine and Infectious Disease 8, no. 4: 198. https://doi.org/10.3390/tropicalmed8040198