

Spatio-Temporal Pattern and Meteo-Climatic Determinants of Visceral Leishmaniasis in Italy
 , and
, and
Abstract
:
1. Introduction
2. Materials and Methods
2.1. Study Area
2.2. Data Collection and Management
2.2.1. Health Data
2.2.2. Meteo-Climatic Data
2.2.3. Potential Determinants of VL Data
2.3. Statistical Analysis
2.3.1. Descriptive Analysis
2.3.2. Spatial and Spatio-Temporal Analysis
3. Results
3.1. Descriptive Analysis
3.2. Spatial and Spatio-Temporal Analysis
4. Discussion
5. Conclusions
Supplementary Materials
Author Contributions
Funding
Institutional Review Board Statement
Informed Consent Statement
Data Availability Statement
Acknowledgments
Conflicts of Interest
References
- Alvar, J.; Vélez, I.D.; Bern, C.; Herrero, M.; Desjeux, P.; Cano, J.; Jannin, J.; den Boer, M.; The Who Leishmaniasis Control the Team. Leishmaniasis Worldwide and Global Estimates of Its Incidence. PLoS ONE 2012, 7, e35671. [Google Scholar] [CrossRef]
- Van Griensven, J.; Carrillo, E.; López-Vélez, R.; Lynen, L.; Moreno, J. Leishmaniasis in Immunosuppressed Individuals. Clin. Microbiol. Infect. 2014, 20, 286–299. [Google Scholar] [CrossRef] [PubMed] [Green Version]
- Ready, P.D. Epidemiology of Visceral Leishmaniasis. Clin. Epidemiol. 2014, 6, 147–154. [Google Scholar] [CrossRef] [PubMed] [Green Version]
- Ready, P.D. Biology of Phlebotomine Sand Flies as Vectors of Disease Agents. Annu. Rev. Entomol. 2013, 58, 227–250. [Google Scholar] [CrossRef] [PubMed]
- Steverding, D. The History of Leishmaniasis. Parasites Vectors 2017, 10, 1–10. [Google Scholar] [CrossRef] [PubMed] [Green Version]
- Ready, P.D. Leishmaniasis Emergence in Europe. Eurosurveillance 2010, 15, 29–39. [Google Scholar] [CrossRef]
- Signorini, M.; Cassini, R.; Drigo, M.; di Regalbono, A.F.; Pietrobelli, M.; Montarsi, F.; Stensgaard, A.S. Ecological Niche Model of Phlebotomus Perniciosus, the Main Vector of Canine Leishmaniasis in North-Eastern Italy. Geospat. Health 2014, 9, 193–201. [Google Scholar] [CrossRef] [Green Version]
- Koch, L.K.; Kochmann, J.; Klimpel, S.; Cunze, S. Modeling the Climatic Suitability of Leishmaniasis Vector Species in Europe. Sci. Rep. 2017, 7, 13325. [Google Scholar] [CrossRef] [Green Version]
- Alexander, B. Sampling Methods for Phlebotomine Sandflies. Med. Vet. Entomol. 2000, 14, 109–122. [Google Scholar] [CrossRef]
- Medlock, J.M.; Hansford, K.M.; Van Bortel, W.; Zeller, H.; Alten, B. A Summary of the Evidence for the Change in European Distribution of Phlebotomine Sand Flies (Diptera: Psychodidae) of Public Health Importance. J. Vector Ecol. 2014, 39, 72–77. [Google Scholar] [CrossRef]
- Alten, B.; Maia, C.; Afonso, M.O.; Campino, L.; Jiménez, M.; González, E.; Molina, R.; Bañuls, A.L.; Prudhomme, J.; Vergnes, B.; et al. Seasonal Dynamics of Phlebotomine Sand Fly Species Proven Vectors of Mediterranean Leishmaniasis Caused by Leishmania Infantum. PLoS Negl. Trop. Dis. 2016, 10, e0004458. [Google Scholar] [CrossRef] [PubMed]
- Risueño, J.; Muñoz, C.; Pérez-Cutillas, P.; Goyena, E.; Gonzálvez, M.; Ortuño, M.; Bernal, L.J.; Ortiz, J.; Alten, B.; Berriatua, E. Understanding Phlebotomus Perniciosus Abundance in South-East Spain: Assessing the Role of Environmental and Anthropic Factors. Parasites Vectors 2017, 10, 189. [Google Scholar] [CrossRef] [Green Version]
- Mohammadbeigi, A.; Khazaei, S.; Heidari, H.; Asgarian, A.; Arsangjang, S.; Saghafipour, A.; Mohammadsalehi, N.; Ansari, H. An Investigation of the Effects of Environmental and Ecologic Factors on Cutaneous Leishmaniasis in the Old World: A Systematic Review Study. Rev. Environ. Health 2020, 36, 117–128. [Google Scholar] [CrossRef] [PubMed]
- Ready, P.D. Leishmaniasis Emergence and Climate Change. Rev. Sci. Tech. 2008, 27, 399–412. [Google Scholar] [CrossRef] [PubMed]
- Aspöck, H.; Gerersdorfer, T.; Formayer, H.; Walochnik, J. Sandflies and Sandfly-Borne Infections of Humans in Central Europe in the Light of Climate Change. Wien. Klin. Wochenschr. 2008, 120, 24–29. [Google Scholar] [CrossRef] [PubMed]
- Oerther, S.; Jöst, H.; Heitmann, A.; Lühken, R.; Krüger, A.; Steinhausen, I.; Brinker, C.; Lorentz, S.; Marx, M.; Schmidt-Chanasit, J.; et al. Phlebotomine Sand Flies in Southwest Germany: An Update with Records in New Locations. Parasites Vectors 2020, 13, 173. [Google Scholar] [CrossRef] [PubMed] [Green Version]
- Moirano, G.; Zanet, S.; Giorgi, E.; Battisti, E.; Falzoi, S.; Acquaotta, F.; Fratianni, S.; Richiardi, L.; Ferroglio, E.; Maule, M. Integrating Environmental, Entomological, Animal, and Human Data to Model the Leishmania Infantum Transmission Risk in a Newly Endemic Area in Northern Italy. One Health 2020, 10, 100159. [Google Scholar] [CrossRef] [PubMed]
- Ferroglio, E.; Battisti, E.; Zanet, S.; Bolla, C.; Concialdi, E.; Trisciuoglio, A.; Khalili, S.; Biglino, A. Epidemiological Evaluation of Leishmania Infantum Zoonotic Transmission Risk in the Recently Established Endemic Area of Northwestern Italy. Zoonoses Public Health 2018, 65, 675–682. [Google Scholar] [CrossRef] [PubMed]
- Fratianni, S.; Acquaotta, F. The Climate of Italy. In World Geomorphological Landscapes; Springer: Berlin/Heidelberg, Germany, 2017; pp. 29–38. [Google Scholar]
- Raffa, M.; Reder, A.; Marras, G.F.; Mancini, M.; Scipione, G.; Santini, M.; Mercogliano, P. VHR-REA_IT Dataset: Very High Resolution Dynamical Downscaling of ERA5 Reanalysis over Italy by COSMO-CLM. Data 2021, 6, 88. [Google Scholar] [CrossRef]
- Spano, D.; Mereu, V.; Bacciu, V.; Marras, S.; Trabucco, A.; Adinolf, M.; Barbato, G.; Bosello, F.; Breil, M.; Chiriacò, M.V.; et al. Analisi Del Rischio. I Cambiamenti Climatici in Italia: Evidenze, Vulnerabilità e Impatti; Fondazione CMCC: Lecce, Italy, 2020. [Google Scholar]
- Burza, S.; Croft, S.L.; Boelaert, M. Leishmaniasis. Lancet 2018, 392, 951–970. [Google Scholar] [CrossRef]
- Demo-Geodemo. Mappe, Popolazione, Statistiche Demografiche Dell’ISTAT. Available online: http://demo.istat.it/ (accessed on 1 January 2021).
- Muñoz-Sabater, J.; Dutra, E.; Agustí-Panareda, A.; Albergel, C.; Arduini, G.; Balsamo, G.; Boussetta, S.; Choulga, M.; Harrigan, S.; Hersbach, H.; et al. ERA5-Land: A State-of-the-Art Global Reanalysis Dataset for Land Applications. Earth Syst. Sci. Data 2021, 13, 4349–4383. [Google Scholar] [CrossRef]
- Stevens, F.R.; Gaughan, A.E.; Linard, C.; Tatem, A.J. Disaggregating Census Data for Population Mapping Using Random Forests with Remotely-Sensed and Ancillary Data. PLoS ONE 2015, 10, e0107042. [Google Scholar] [CrossRef] [PubMed] [Green Version]
- Monge-Maillo, B.; Norman, F.F.; Cruz, I.; Alvar, J.; López-Vélez, R. Visceral Leishmaniasis and HIV Coinfection in the Mediterranean Region. PLoS Negl. Trop. Dis. 2014, 8, e3021. [Google Scholar] [CrossRef]
- WHO. European Health for All Database (HFA-DB) Data Source–European Health Information Gateway. Available online: https://gateway.euro.who.int/en/datasets/european-health-for-all-database/ (accessed on 15 June 2022).
- Prudhomme, J.; Rahola, N.; Toty, C.; Cassan, C.; Roiz, D.; Vergnes, B.; Thierry, M.; Rioux, J.A.; Alten, B.; Sereno, D.; et al. Ecology and Spatiotemporal Dynamics of Sandflies in the Mediterranean Languedoc Region (Roquedur Area, Gard, France). Parasites Vectors 2015, 8, 642. [Google Scholar] [CrossRef] [PubMed] [Green Version]
- Leroux, B.G.; Lei, X.; Breslow, N. Estimation of Disease Rates in Small Areas: A New Mixed Model for Spatial Dependence. In Statistical Models in Epidemiology, the Environment, and Clinical Trials; The IMA Volumes in Mathematics and Its Applications; Springer: New York, NY, USA, 2000; pp. 179–191. [Google Scholar] [CrossRef]
- Aswi, A.; Cramb, S.; Duncan, E.; Mengersen, K. Evaluating the Impact of a Small Number of Areas on Spatial Estimation. Int. J. Health Geogr. 2020, 19, 39. [Google Scholar] [CrossRef] [PubMed]
- Lee, D. CARBayes: An R Package for Bayesian Spatial Modeling with Conditional Autoregressive Priors. J. Stat. Softw. 2013, 55, 1–24. [Google Scholar] [CrossRef] [Green Version]
- Lee, D.; Rushworth, A.; Napier, G. Spatio-Temporal Areal Unit Modeling in R with Conditional Autoregressive Priors Using the CARBayesST Package. J. Stat. Softw. 2018, 84, 1–39. [Google Scholar] [CrossRef] [Green Version]
- Gil-Prieto, R.; Walter, S.; Alvar, J.; De Miguel, A.G. Epidemiology of Leishmaniasis in Spain Based on Hospitalization Records (1997–2008). Am. J. Trop. Med. Hyg. 2011, 85, 820–825. [Google Scholar] [CrossRef] [PubMed]
- Valcárcel, Y.; Bastero, R.; Anegón, M.; González, S.; Gil, Á. The Epidemiology of Hospital Admissions Due to Leishmaniasis in Spain (1999–2003). Enferm. Infecc. Microbiol. Clin. 2008, 26, 278–281. [Google Scholar] [CrossRef] [PubMed]
- Tzani, M.; Barrasa, A.; Vakali, A.; Georgakopoulou, T.; Mellou, K.; Pervanidou, D. Surveillance Data for Human Leishmaniasis Indicate the Need for a Sustainable Action Plan for Its Management and Control, Greece, 2004 to 2018. Eurosurveillance 2021, 26, 2000159. [Google Scholar] [CrossRef]
- Marty, P.; Pomares, C.; Michel, G.; Delaunay, P.; Ferrua, B.; Rosenthal, É. Mediterranean Visceral Leishmaniasis. Bull. Acad. Natl. Med. 2011, 195, 181–188. [Google Scholar] [CrossRef] [PubMed]
- Gradoni, L.; Ferroglio, E.; Zanet, S.; Mignone, W.; Venco, L.; Bongiorno, G.; Fiorentino, E.; Cassini, R.; Grillini, M.; Simonato, G.; et al. Monitoring and Detection of New Endemic Foci of Canine Leishmaniosis in Northern Continental Italy: An Update from a Study Involving Five Regions (2018-2019). Vet. Parasitol. Reg. Stud. Rep. 2021, 27, 100676. [Google Scholar] [CrossRef] [PubMed]
- Rugna, G.; Carra, E.; Bergamini, F.; Calzolari, M.; Salvatore, D.; Corpus, F.; Gennari, W.; Baldelli, R.; Fabbi, M.; Natalini, S.; et al. Multilocus Microsatellite Typing (MLMT) Reveals Host-Related Population Structure in Leishmania Infantum from Northeastern Italy. PLoS Negl. Trop. Dis. 2018, 12, e0006595. [Google Scholar] [CrossRef] [PubMed] [Green Version]
- Michelutti, A.; Toniolo, F.; Bertola, M.; Grillini, M.; Simonato, G.; Ravagnan, S.; Montarsi, F. Occurrence of Phlebotomine Sand Flies (Diptera: Psychodidae) in the Northeastern Plain of Italy. Parasites Vectors 2021, 14, 164. [Google Scholar] [CrossRef] [PubMed]
- Maroli, M.; Rossi, L.; Baldelli, R.; Capelli, G.; Ferroglio, E.; Genchi, C.; Gramiccia, M.; Mortarino, M.; Pietrobelli, M.; Gradoni, L. The Northward Spread of Leishmaniasis in Italy: Evidence from Retrospective and Ongoing Studies on the Canine Reservoir and Phlebotomine Vectors. Trop. Med. Int. Health 2008, 13, 256–264. [Google Scholar] [CrossRef] [PubMed]
- Maroli, M.; Fiorentino, S.; Guandalini, E. Biology of a Laboratory Colony of Phlebotomus Perniciosus (Diptera: Psychodidae). J. Med. Entomol. 1987, 24, 547–551. [Google Scholar] [CrossRef]
- Hlavacova, J.; Votypka, J.; Volf, P. The Effect of Temperature on Leishmania (Kinetoplastida: Trypanosomatidae) Development in Sand Flies. J. Med. Entomol. 2013, 50, 955–958. [Google Scholar] [CrossRef] [PubMed] [Green Version]
- Karagiannis-Voules, D.A.; Scholte, R.G.C.; Guimarães, L.H.; Utzinger, J.; Vounatsou, P. Bayesian Geostatistical Modeling of Leishmaniasis Incidence in Brazil. PLoS Negl. Trop. Dis. 2013, 7, e2213. [Google Scholar] [CrossRef] [Green Version]
- Li, Y.; Zheng, C. Associations between Meteorological Factors and Visceral Leishmaniasis Outbreaks in Jiashi County, Xinjiang Uygur Autonomous Region, China, 2005–2015. Int. J. Environ. Res. Public Health 2019, 16, 1775. [Google Scholar] [CrossRef] [PubMed]
- Tsegaw, T.; Gadisa, E.; Seid, A.; Abera, A.; Teshome, A.; Mulugeta, A.; Herrero, M.; Argaw, D.; Jorge, A.; Aseffa, A. Identification of Environmental Parameters and Risk Mapping of Visceral Leishmaniasis in Ethiopia by Using Geographical Information Systems and a Statistical Approach. Geospat. Health 2013, 7, 299–308. [Google Scholar] [CrossRef] [Green Version]
- Giannakopoulos, A.; Tsokana, C.N.; Pervanidou, D.; Papadopoulos, E.; Papaspyropoulos, K.; Spyrou, V.; Burriel, A.R.; Vakali, A.; Hadjichristodoulou, C.; Billinis, C. Environmental Parameters as Risk Factors for Human and Canine Leishmania Infection in Thessaly, Central Greece. Parasitology 2016, 143, 1179–1186. [Google Scholar] [CrossRef] [PubMed]
- Zheng, C.; Fu, J.; Li, Z.; Lin, G.; Jiang, D.; Zhou, X.N. Spatiotemporal Variation and Hot Spot Detection of Visceral Leishmaniasis Disease in Kashi Prefecture, China. Int. J. Environ. Res. Public Health 2018, 15, 2784. [Google Scholar] [CrossRef] [PubMed] [Green Version]
- Gubler, D.J.; Reiter, P.; Ebi, K.L.; Yap, W.; Nasci, R.; Patz, J.A. Climate Variability and Change in the United States: Potential Impacts on Vector- and Rodent-Borne Diseases. Environ. Health Perspect. 2001, 109, 223–233. [Google Scholar] [CrossRef] [Green Version]
- Elnaiem, D.E.A.; Schorscher, J.; Bendall, A.; Obsomer, V.; Osman, M.E.; Mekkawi, A.M.; Connor, S.J.; Ashford, R.W.; Thomson, M.C. Risk Mapping of Visceral Leishmaniasis: The Role of Local Variation in Rainfall and Altitude on The Presence and Incidence of Kala-Azar in Eastern Sudan. Am. J. Trop. Med. Hyg. 2003, 68, 10–17. [Google Scholar] [CrossRef] [PubMed]
- Sevá, A.D.P.; Mao, L.; Galvis-Ovallos, F.; Tucker Lima, J.M.; Valle, D. Risk Analysis and Prediction of Visceral Leishmaniasis Dispersion in São Paulo State, Brazil. PLoS Negl. Trop. Dis. 2017, 11, e0005353. [Google Scholar] [CrossRef] [Green Version]
- Oliveira, A.M.; López, R.V.M.; Dibo, M.R.; Rodas, L.A.C.; Guirado, M.M.; Chiaravalloti-Neto, F. Dispersion of Lutzomyia Longipalpis and Expansion of Visceral Leishmaniasis in São Paulo State, Brazil: Identification of Associated Factors through Survival Analysis. Parasites Vectors 2018, 11, 503. [Google Scholar] [CrossRef] [PubMed] [Green Version]
- Cecílio, P.; Cordeiro-da-Silva, A.; Oliveira, F. Sand Flies: Basic Information on the Vectors of Leishmaniasis and Their Interactions with Leishmania Parasites. Commun. Biol. 2022, 5, 305. [Google Scholar] [CrossRef] [PubMed]
- Kasap, O.E.; Alten, B. Laboratory Estimation of Degree-Day Developmental Requirements of Phlebotomus Papatasi (Diptera: Psychodidae). J. Vector Ecol. 2005, 30, 328–333. [Google Scholar] [PubMed]
- Franco, A.O.; Davies, C.R.; Mylne, A.; Dedet, J.P.; Gllego, M.; Ballart, C.; Gramiccia, M.; Gradoni, L.; Molina, R.; Glvez, R.; et al. Predicting the Distribution of Canine Leishmaniasis in Western Europe Based on Environmental Variables. Parasitology 2011, 138, 1878–1891. [Google Scholar] [CrossRef]
- Chamaillé, L.; Tran, A.; Meunier, A.; Bourdoiseau, G.; Ready, P.; Dedet, J.P. Environmental Risk Mapping of Canine Leishmaniasis in France. Parasites Vectors 2010, 3, 31. [Google Scholar] [CrossRef]


| Model 1 | Model 2 | ||||
|---|---|---|---|---|---|
| (95% CrI) | (95% CrI) | (95% CrI) | (95% CrI) | (95% CrI) | |
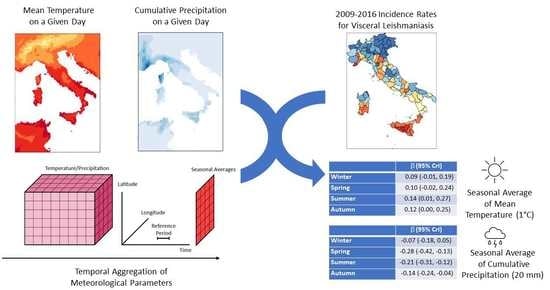
| Mean Temperature (1 °C increase) | |||||
| Winter | 0.17 (0.09, 0.25) | 0.52 (0.36, 0.77) | 0.09 (−0.01, 0.19) | 1.01 (0.66, 1.55) | 0.75 (0.33, 0.95) |
| Spring | 0.23 (0.12, 0.36) | 0.53 (0.36, 0.79) | 0.10 (−0.02, 0.24) | 1.02 (0.67, 1.56) | 0.81 (0.43, 0.96) |
| Summer | 0.24 (0.14, 0.37) | 0.50 (0.34, 0.75) | 0.14 (0.01, 0.27) | 0.97 (0.63, 1.50) | 0.77 (0.37, 0.96) |
| Autumn | 0.22 (0.13, 0.33) | 0.50 (0.34, 0.74) | 0.12 (0.00, 0.25) | 0.97 (0.62, 1.51) | 0.75 (0.27, 0.95) |
| Cumulative precipitation (20 mm increase) | |||||
| Winter | −0.06 (−0.18, 0.05) | 0.64 (0.44, 0.95) | −0.07 (−0.18, 0.05) | 1.06 (0.69, 1.63) | 0.85 (0.60, 0.97) |
| Spring | −0.34 (−0.47, −0.23) | 0.44 (0.30, 0.66) | −0.28 (−0.42, −0.13) | 0.88 (0.55, 1.36) | 0.66 (0.25, 0.92) |
| Summer | −0.23 (−0.30, −0.16) | 0.39 (0.26, 0.59) | −0.21 (−0.31, −0.12) | 0.74 (0.45, 1.20) | 0.53 (0.15, 0.87) |
| Autumn | −0.19 (−0.28, −0.11) | 0.50 (0.34, 0.75) | −0.14 (−0.24, −0.04) | 0.94 (0.62, 1.46) | 0.76 (0.41, 0.95) |
| Season-Year Anomaly | Spatial Random Effect | Temporal Random Effect | Spatio-Temporal Interaction | |||
|---|---|---|---|---|---|---|
| (95% CrI) | (95% CrI) | (95% CrI) | (95% CrI) | (95% CrI) | (95% CrI) | |
| Mean Temperature (1 °C increase) | ||||||
| Winter | −0–04 (−0.13, 0.08) | 0.96 (0.61, 1.50) | 0.77 (0.34, 0.96) | 0.01 (0.00, 0.04) | 0.51 (0.03, 0.95) | 0.10 (0.02,0.18) |
| Spring | 0.01 (−0.12, 0.14) | 0.98 (0.62, 1.52) | 0.82 (0.46, 0.96) | 0.01 (0.00, 0.04) | 0.58 (0.04, 0.96) | 0.09 (0.01,0.18) |
| Summer | 0.01 (−0.10, 0.12) | 0.92 (0.59, 1.44) | 0.78 (0.36, 0.96) | 0.01 (0.00, 0.04) | 0.56 (0.03, 0.95) | 0.09 (0.01,0.18) |
| Autumn | −0.06 (−0.21, 0.09) | 0.93 (0.59, 1.46) | 0.75 (0.29, 0.95) | 0.01 (0.00, 0.04) | 0.51 (0.03, 0.95) | 0.09 (0.02,0.18) |
| Cumulative Precipitation (20 mm Increase) | ||||||
| Winter | 0.02 (−0.01, 0.06) | 1.02 (0.65, 1.58) | 0.86 (0.61, 0.97) | 0.01 (0.00, 0.04) | 0.51 (0.03, 0.95) | 0.09 (0.01, 0.18) |
| Spring | −0.01 (−0.06, 0.4) | 0.83 (0.52,1.33) | 0.69 (0.27, 0.93) | 0.01 (0.00, 0.04) | 0.57 (0.04, 0.96) | 0.10 (0.03, 0.18) |
| Summer | 0.03 (−0.03, 0.08) | 0.71 (0.43,1.16) | 0.56 (0.16,0.89) | 0.01 (0.00, 0.05) | 0.57 (0.04, 0.96) | 0.09 (0.02,0.18) |
| Autumn | 0.01 (−0.02, 0.04) | 0.95 (0.61, 0.97) | 0.78 (0.43,0.95) | 0.01 (0.00, 0.04) | 0.56 (0.04, 0.96) | 0.09 (0.01, 0.18) |
Publisher’s Note: MDPI stays neutral with regard to jurisdictional claims in published maps and institutional affiliations. |
© 2022 by the authors. Licensee MDPI, Basel, Switzerland. This article is an open access article distributed under the terms and conditions of the Creative Commons Attribution (CC BY) license (https://creativecommons.org/licenses/by/4.0/).
Share and Cite
Moirano, G.; Ellena, M.; Mercogliano, P.; Richiardi, L.; Maule, M. Spatio-Temporal Pattern and Meteo-Climatic Determinants of Visceral Leishmaniasis in Italy. Trop. Med. Infect. Dis. 2022, 7, 337. https://doi.org/10.3390/tropicalmed7110337
Moirano G, Ellena M, Mercogliano P, Richiardi L, Maule M. Spatio-Temporal Pattern and Meteo-Climatic Determinants of Visceral Leishmaniasis in Italy. Tropical Medicine and Infectious Disease. 2022; 7(11):337. https://doi.org/10.3390/tropicalmed7110337
Chicago/Turabian StyleMoirano, Giovenale, Marta Ellena, Paola Mercogliano, Lorenzo Richiardi, and Milena Maule. 2022. "Spatio-Temporal Pattern and Meteo-Climatic Determinants of Visceral Leishmaniasis in Italy" Tropical Medicine and Infectious Disease 7, no. 11: 337. https://doi.org/10.3390/tropicalmed7110337