Systematic Review

Transforming Growth Factor-β Concerning Malarial Infection and Severity: A Systematic Review and Meta-Analysis

by
Kwuntida Uthaisar Kotepui
1,†,
Pattamaporn Kwankaew
1,2,†,
Frederick Ramirez Masangkay
3,
Aongart Mahittikorn
4,* and
Manas Kotepui
1,*
1
Medical Technology, School of Allied Health Sciences, Walailak University, Tha Sala 80160, Thailand
2
Research Excellence Center for Innovation and Health Product, Walailak University, Tha Sala 80161, Thailand
3
Department of Medical Technology, Faculty of Pharmacy, University of Santo Tomas, Manila 1008, Philippines
4
Department of Protozoology, Faculty of Tropical Medicine, Mahidol University, Bangkok 10400, Thailand
*
Authors to whom correspondence should be addressed.
These authors contributed equally to this work.
Trop. Med. Infect. Dis. 2022, 7(10), 299; https://doi.org/10.3390/tropicalmed7100299
Submission received: 9 September 2022 / Revised: 7 October 2022 / Accepted: 8 October 2022 / Published: 13 October 2022
(This article belongs to the Special Issue Advances in Malaria Treatment and Prevention)

Abstract

:
Transforming growth factor-β (TGF-β) is important in the pathophysiology of malaria, but its role in acute and severe malaria is largely unknown. As a result, this study used a meta-analysis approach to investigate the difference in TGF-β levels between several groups of malaria patients and healthy controls. The systematic review protocol was registered at PROSPERO (ID: CRD42022318864). From inception to 7 March 2022, studies that reported TGF-β levels in patients with uncomplicated and healthy controls and patients with severe and uncomplicated malaria were searched in PubMed, Scopus and Embase. The assessment of the quality of the included studies was conducted according to the Strengthening the Reporting of Observational Studies in Epidemiology guidelines. Qualitative and quantitative syntheses were performed to narratively describe and quantitatively pool the mean difference (MD) in TGF-β levels between uncomplicated malaria and healthy controls, and between severe and uncomplicated malaria, using a random-effects model. A total of 1027 relevant articles were identified, and 13 studies were included for syntheses. The meta-analysis results show 233 patients with uncomplicated malaria and 239 healthy controls. Patients with uncomplicated malaria (233 cases) had lower mean TGF-β levels than healthy controls (239 cases; p < 0.01, pooled MD = −14.72 pg/mL, 95% confidence interval (95% CI) = −20.46 to 8.99 pg/mL, I2 = 98.82%, seven studies). The meta-analysis found no difference in mean TGF-β levels between patients with severe malaria (367 cases) and patients with uncomplicated malaria (180 cases; p = 0.11, pooled MD = −6.07 pg/mL, 95% CI = −13.48 to 1.35 pg/mL, I2 = 97.73%, six studies). The meta-analysis demonstrated decreased TGF-β levels in patients with uncomplicated malaria compared to healthy controls. In addition, no difference in TGF-β levels was found between patients with severe and uncomplicated malaria. More research is needed to determine whether TGF-β levels could be a candidate marker for malarial infection or disease severity.

1. Introduction

Malaria is one of the world’s most serious public health issues. According to the 2021 World Malaria Report, nearly half of the world’s population lives in malaria-prone areas across 87 countries and territories [1]. In addition, malaria is expected to cause 241 million clinical episodes and 627,000 fatalities by 2020; the World Health Organization’s African Region is expected to account for 95% of all fatalities [1]. Plasmodium falciparum is the most common cause of malaria-related deaths, according to current evidence; however, Plasmodium vivax, Plasmodium ovale and Plasmodium knowlesi can also cause malaria-related deaths in a small number of cases [2,3,4,5].
The modulation of pro- and anti-inflammatory cytokines has been linked to various clinical presentations of malaria. During the acute phase of infection, a pro-inflammatory immune response suppresses parasite proliferation, with interferon-γ (IFN-γ) playing a key role [6]. Anti-inflammatory immune responses with interleukin (IL)-10 and transforming growth factor-β (TGF-β) play an important role in malaria pathophysiology [7]. TGF-β is a tissue-specific cytokine secreted by various cell types, including fibroblasts, epithelial cells, macrophages and other immune cells; it has several context-dependent immunomodulatory effects [8,9,10]. Controlling apoptosis, angiogenesis, wound healing, cancer growth and immunological modulation are all important functions of this protein [11,12,13,14,15]. TGF-β exists in three isoforms in mammals (TGF-β1, -β2 and -β3), with TGF-β1 being the most abundant isoform expressed in immune cells [16,17,18]. TGF-β regulates the development and activity of many immune cells. It promotes the differentiation of T helper 17 and 9, T follicular helper cells and regulatory T cells (Tregs), which function in immunosuppression [19]. In contrast, TGF-β signaling negatively affects the number of effector T cells that stimulate cellular and humoral immune responses. TGF-β signaling inhibits the development of Th1, T helper 2 and CD8+ T cells. TGF-β also inhibits B-cell growth, B cell survival and IgG class switching. It also inhibits the activity of natural killer cells [19].
TGF-β activity worsens several protozoal infections, including Leishmania braziliensis [20] and a helminth worm, Heligmosomoides polygyrus [21]. In contrast, TGF-β has been approved as a critical anti-inflammatory immunomodulator that aids in reducing inflammation and pathology during Plasmodium infection [9]. Previous research has shown that patients with acute malaria have higher TGF-β levels than the normal limit [22,23,24]. Lower TGF-β levels have previously been reported in patients with severe malaria [25,26,27]. Nevertheless, the role of TGF-β in acute malaria and the prevention of severe malaria are mostly unknown. Furthermore, studies on the role of TGF-β in various malarial types have relied on a small number of participants, which increased statistical error. As a result, this study used a meta-analysis approach to investigate the difference in TGF-β levels between several groups of malaria patients and healthy controls. This study would provide evidence-based information on TGF-β levels and malaria for future immunological research.

2. Methods

2.1. Protocol and Registration

The systematic review protocol was registered at PROSPERO (ID: CRD42022318864). The systematic review followed the Preferred Reporting Items for Systematic Reviews and Meta-Analyses checklist [28].

2.2. PICO Questions

The research questions were developed using the P (participants), I (intervention), C (comparator) and O (outcome) framework. P denotes malaria patients (severe or uncomplicated), I denotes not applicable (none), C denotes uncomplicated malaria or healthy controls and O denotes TGF-β levels in participants.

2.3. Eligibility Criteria

Inclusion criteria were studies that reported TGF-β levels in uncomplicated and healthy controls and TGF-β levels in severe and uncomplicated malaria patients. Eligible study designs included cross-sectional, cohort, case–control or observational studies. Exclusion criteria included in vivo and in vitro studies, TGF-β gene/protein expression, mosquito experiments, reviews, TGF-β in pregnancy/cord blood malaria, TGF-β in uncomplicated malaria only, TGF-β gene polymorphism, conference abstracts and TGF-β in co-infection. Cases where TGF-β data in malaria could not be extracted, and the presence of TGF-β only in severe malaria, full-text unavailability and systematic reviews were grounds for exclusion.

2.4. Information Sources

A comprehensive search was performed in three databases, including PubMed, Scopus and Embase, from 1 to 7 March 2022. The search terms (‘Milk Growth Factor’ OR ‘TGF-beta’ OR TGFbeta OR ‘Platelet Transforming Growth Factor’ OR ‘Bone-Derived Transforming Growth Factor’ OR ‘Bone Derived Transforming Growth Factor’ OR ‘transforming growth factor’) AND (‘malaria OR Plasmodium’) were used to search the potentially relevant studies. The details of the search strategy are found in Table S1. Searches of reference lists of the included studies and Google Scholar were also performed to ensure that the relevant studies were not missed during study selection.

2.5. Study Selection

Study selection was performed as follows: (i) duplicates that were identified from three databases were excluded; (ii) screening of titles and abstracts, and non-relevant studies were excluded, and (iii) the remaining studies were examined against the eligibility criteria and studies that did not meet the criteria were excluded for specific reasons. Studies were selected by two authors independently (MK and AM). Disagreements between authors during study selection were resolved by discussion and reaching a consensus.

2.6. Definitions

Severe malaria is characterised by the presence of malaria parasites in the blood of patients with one or more of the following complications: impaired consciousness, prostration, multiple convulsions, acidosis, hypoglycaemia, severe malarial anaemia, renal impairment, jaundice, pulmonary oedema, significant bleeding, shock and hyperparasitemia [29]. Uncomplicated malaria is characterised by the presence of malaria parasites in the blood of patients without the complications above. Healthy controls were participants residing in the same area who tested negative for malaria parasites and showed no signs or symptoms of malaria.

2.7. Data Extraction

Each study’s first author’s name, year of publication, study location, year of study conduction, TGF-β levels, Plasmodium spp., age groups, number of patients in each group, the method for malaria detection and method for TGF-β quantification were extracted. Data extraction was performed by two authors (MK and PK). Disagreements between authors during data extraction were resolved by discussion and reaching a consensus.

2.8. Quality of the Included Studies

The assessment of the quality of the included studies followed the Strengthening the Reporting of Observational Studies in Epidemiology statement [30]. Overall, 22 scores were given to judge the quality of each study. The quality of each study was categorised as high, moderate or low quality if they scored >75, 50 to 75 or <50 percentiles, respectively.

2.9. Outcomes

There were two outcomes in the meta-analysis: (1) pooled mean difference (MD) and 95% confidence interval (95% CI) of TGF-β levels between patients with uncomplicated malaria and healthy controls, and (2) pooled MD and 95% CI of TGF-β levels between patients who had severe malaria and uncomplicated malaria.

2.10. Data Syntheses

Data syntheses included qualitative and quantitative syntheses. To describe the difference in TGF-β levels across several groups of participants from all included studies that reported the same outcome, a qualitative synthesis was performed. Using a random-effects model, the quantitative synthesis was used to pool the MD of TGF-β levels (pg/mL) between uncomplicated malaria and healthy controls and between severe and uncomplicated malaria [31]. In the case of the median, rather than mean TGF-β levels reported in the included study, the mean and 95% CI were calculated using the median and interquartile range, as suggested previously [32]. The heterogeneity of the MD among the included studies was determined using Cochrane χ2 and I2 statistics for inconsistency. The Cochrane χ2 with p < 0.10 or an I2 of >25% indicated heterogeneity of MDs among the included studies. A meta-regression analysis was performed to determine the effect of covariates on the pooled MD. Subgroup analysis was further performed in the event of covariates confounding the pooled MD. Further sensitivity analysis using the leave-one-out method was undertaken to determine the robustness of the meta-analysis results. The publication bias was assessed using the funnel plot, Egger’s test and contour-enhanced funnel plot to determine the reporting bias across publications. All analyses, including forest plots, funnel plots and contour-enhanced funnel plots, were performed using Stata version 17.0 (StataCorp, College Station, TX, USA).

3. Results

3.1. Search Results

A total of 1027 articles were retrieved from PubMed (201 articles), Scopus (397 articles) and Embase (429 articles). After 576 articles were excluded, 451 articles were screened for titles and abstracts. After 310 non-related articles were excluded, 141 articles were examined for full texts. For specific reasons, after the screening of full texts, the following articles were excluded: 42 were TGF-β in vivo studies, 33 were TGF-β in vitro studies, 10 were TGF-β gene/protein expression studies, 7 were mosquito experiments, 7 were reviews, 6 were TGF-β in pregnancy/cord blood, 6 were TGF-β in uncomplicated malaria only, 6 were TGF-β gene polymorphism studies, 3 were conference abstracts, 2 were TGF-β in co-infection, 1 was about TGF- β in severe malaria only, 1 had no full-text available, 1 was a systematic review, and 1 was a duplicate study. Finally, 13 studies were included [26,27,33,34,35,36,37,38,39,40,41,42,43]: 7 studies [33,34,35,36,37,38,39] comparing TGF-β levels between uncomplicated malaria and healthy controls and 6 studies [26,27,40,41,42,43] comparing TGF-β levels between severe and uncomplicated malaria (Figure 1).

3.2. Characteristics and Quality of the Included Studies

The characteristics of the included studies are shown in Table 1. The included studies were published between 1995 and 2021. These studies were prospective observational studies (six studies; 46.2%) [33,39,40,41,42,43], case–control studies (three studies; 23.1%) [27,35,37], cross-sectional studies (three studies; 23.1%) [34,36,38] and a cohort study (one study; 7.69%) [26]. The included studies were conducted in Africa (53.8%; Uganda [26,35,37], Gabon [33], Burkina Faso [40], Kenya and Uganda [41] and Gabon [42]), Asia (30.8%; Thailand [27,39], Indonesia [34], India [43]) and South America (15.4%; Brazil [36,38]). Most included studies (10 studies; 76.9%) enrolled patients with P. falciparum [26,27,33,35,37,39,40,41,42,43]. Six studies enrolled children (46.2%) [26,33,34,40,41,42], four enrolled adults (30.8%) [36,37,38,39] and three studies enrolled all age groups (23.1%) [27,34,43]. Thirteen studies enrolled 367 patients with severe malaria, 362 uncomplicated malaria and 358 healthy controls. Most included studies (9 studies; 69.2%) [26,27,33,35,38,39,40,42,43] used microscopic examination for the detection of malaria parasites and used enzyme-linked immunosorbent assays (ELISA) for the quantification of TGF-β levels (11 studies; 84.6%) [26,27,33,34,35,37,39,40,41,42,43]. Details of the included studies are shown in Table S2. All 13 studies included in the systematic review were of high quality (Table S3). No study was excluded from the meta-analysis.

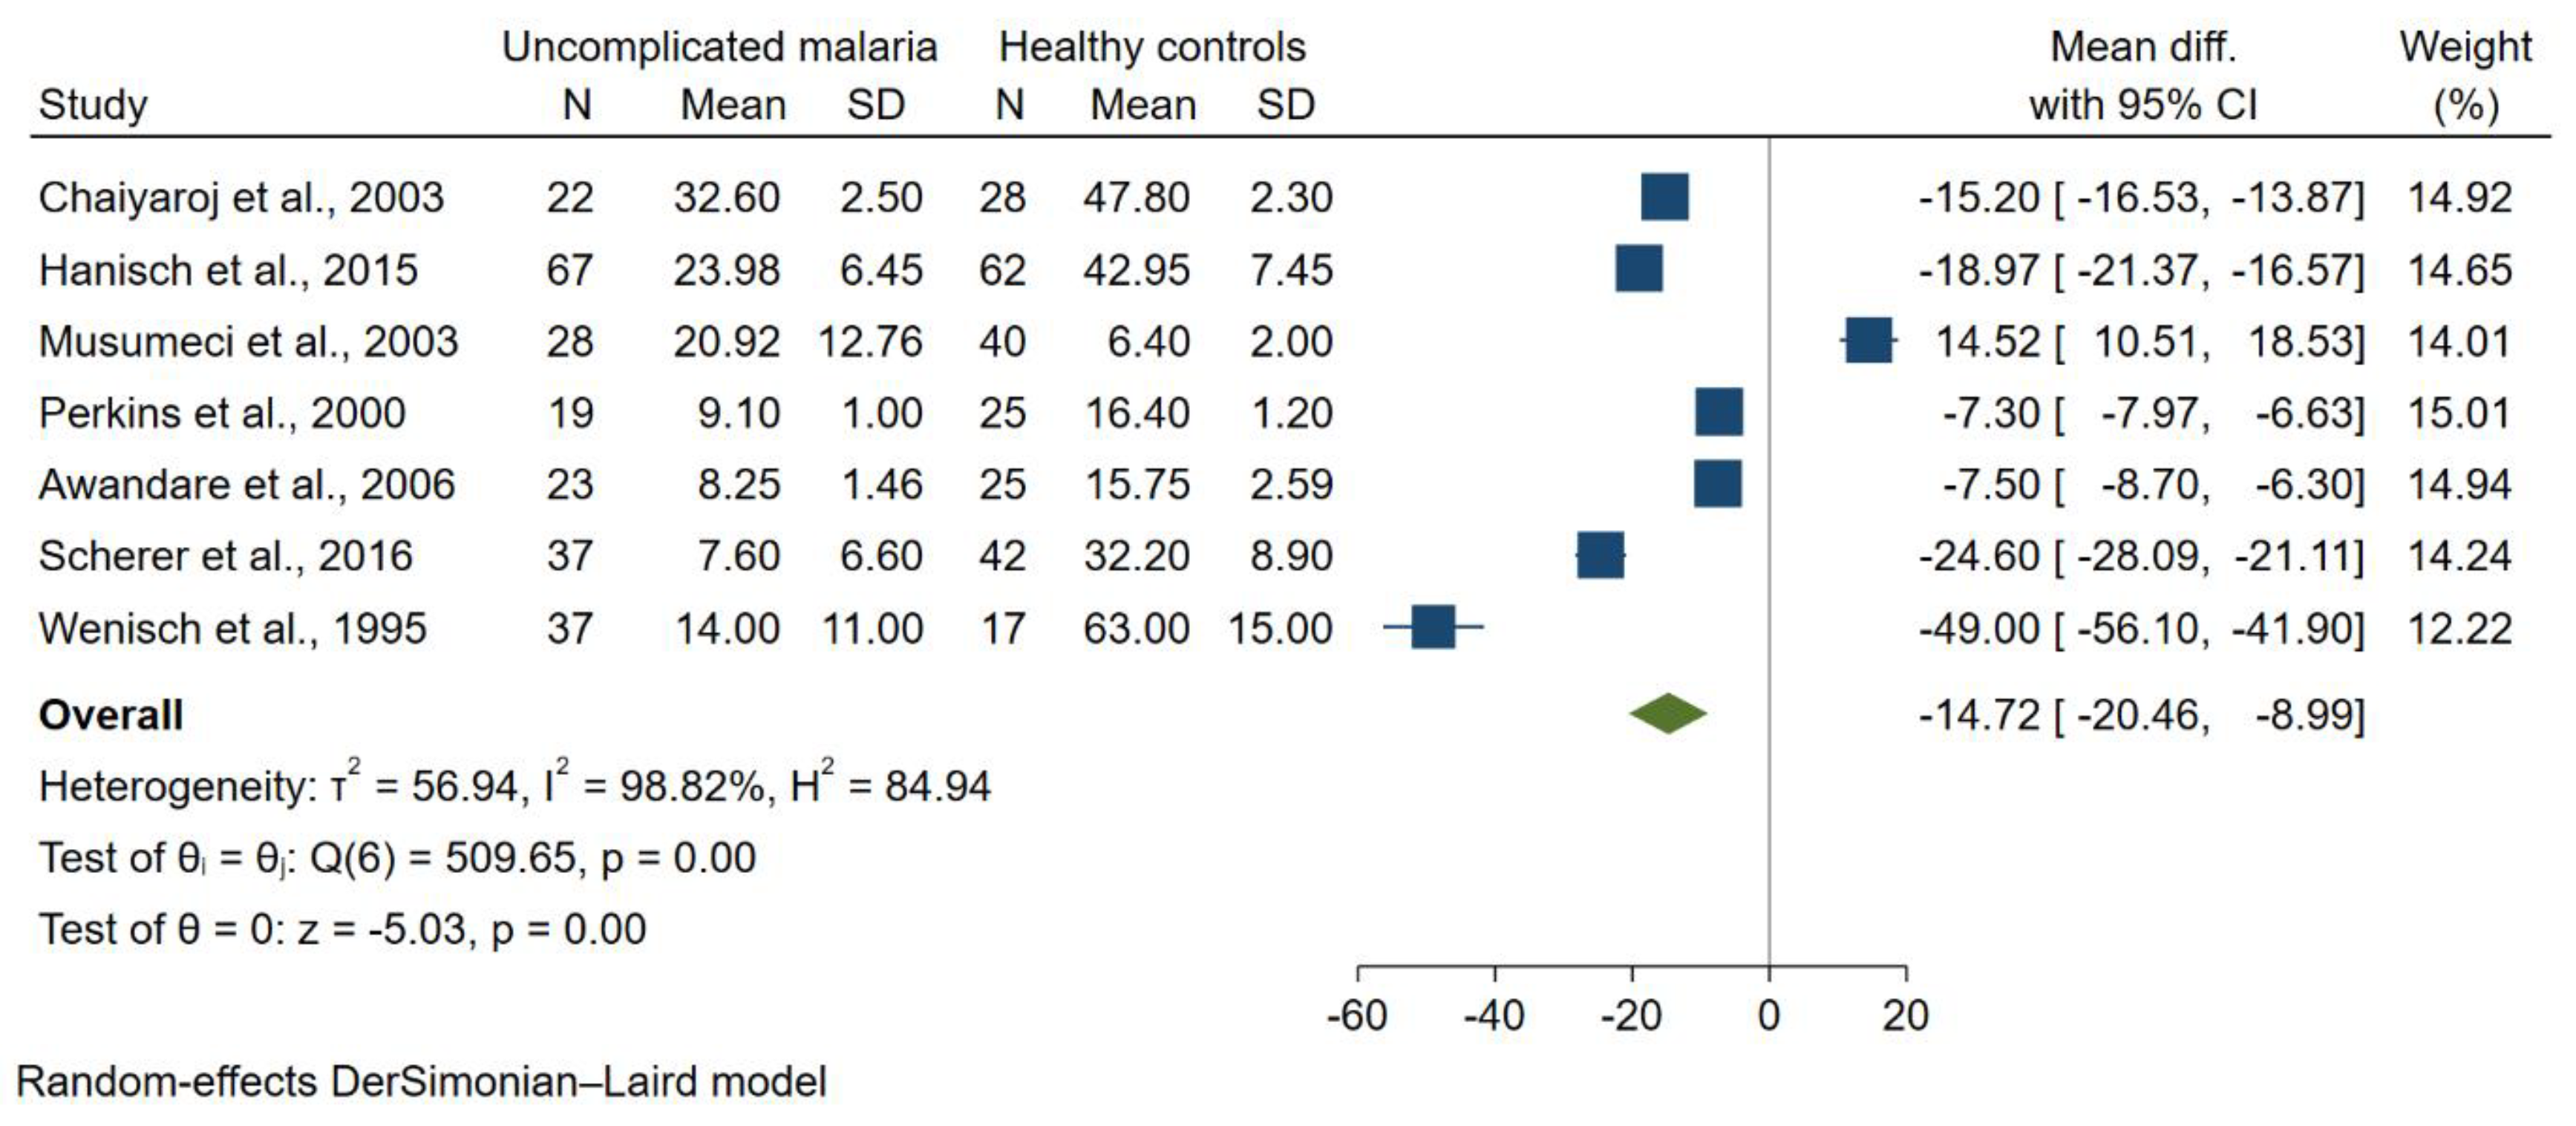
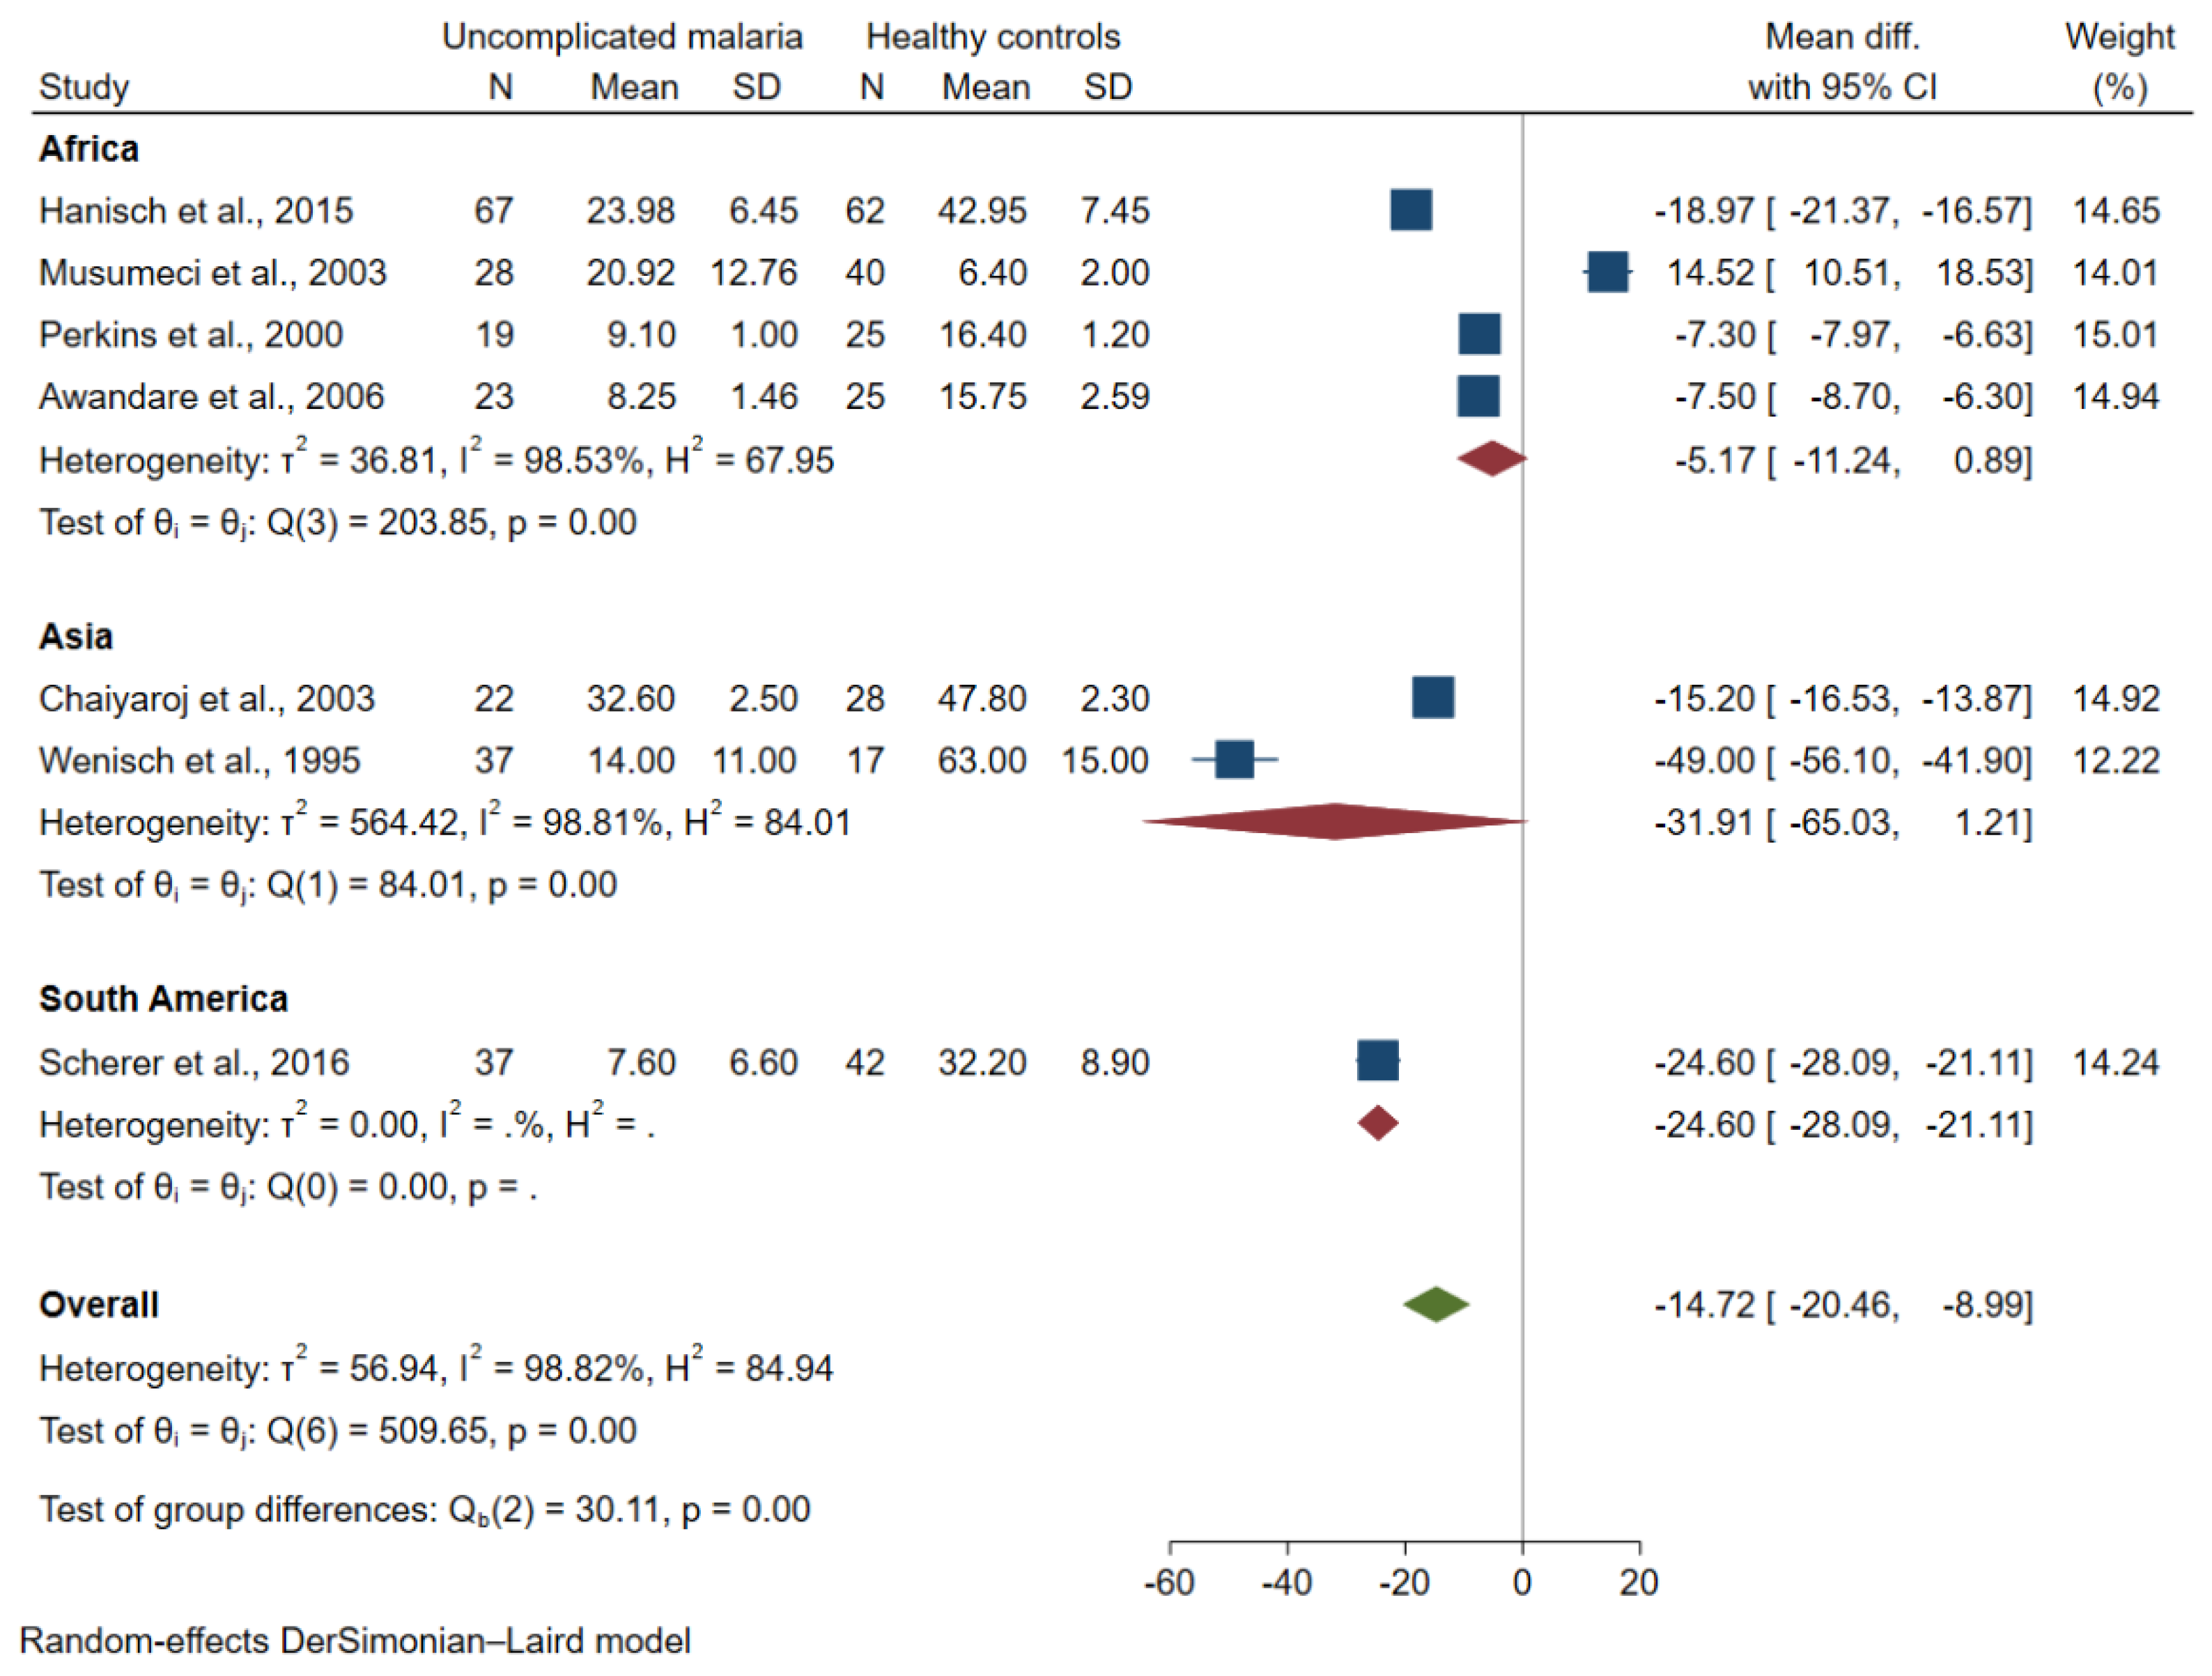
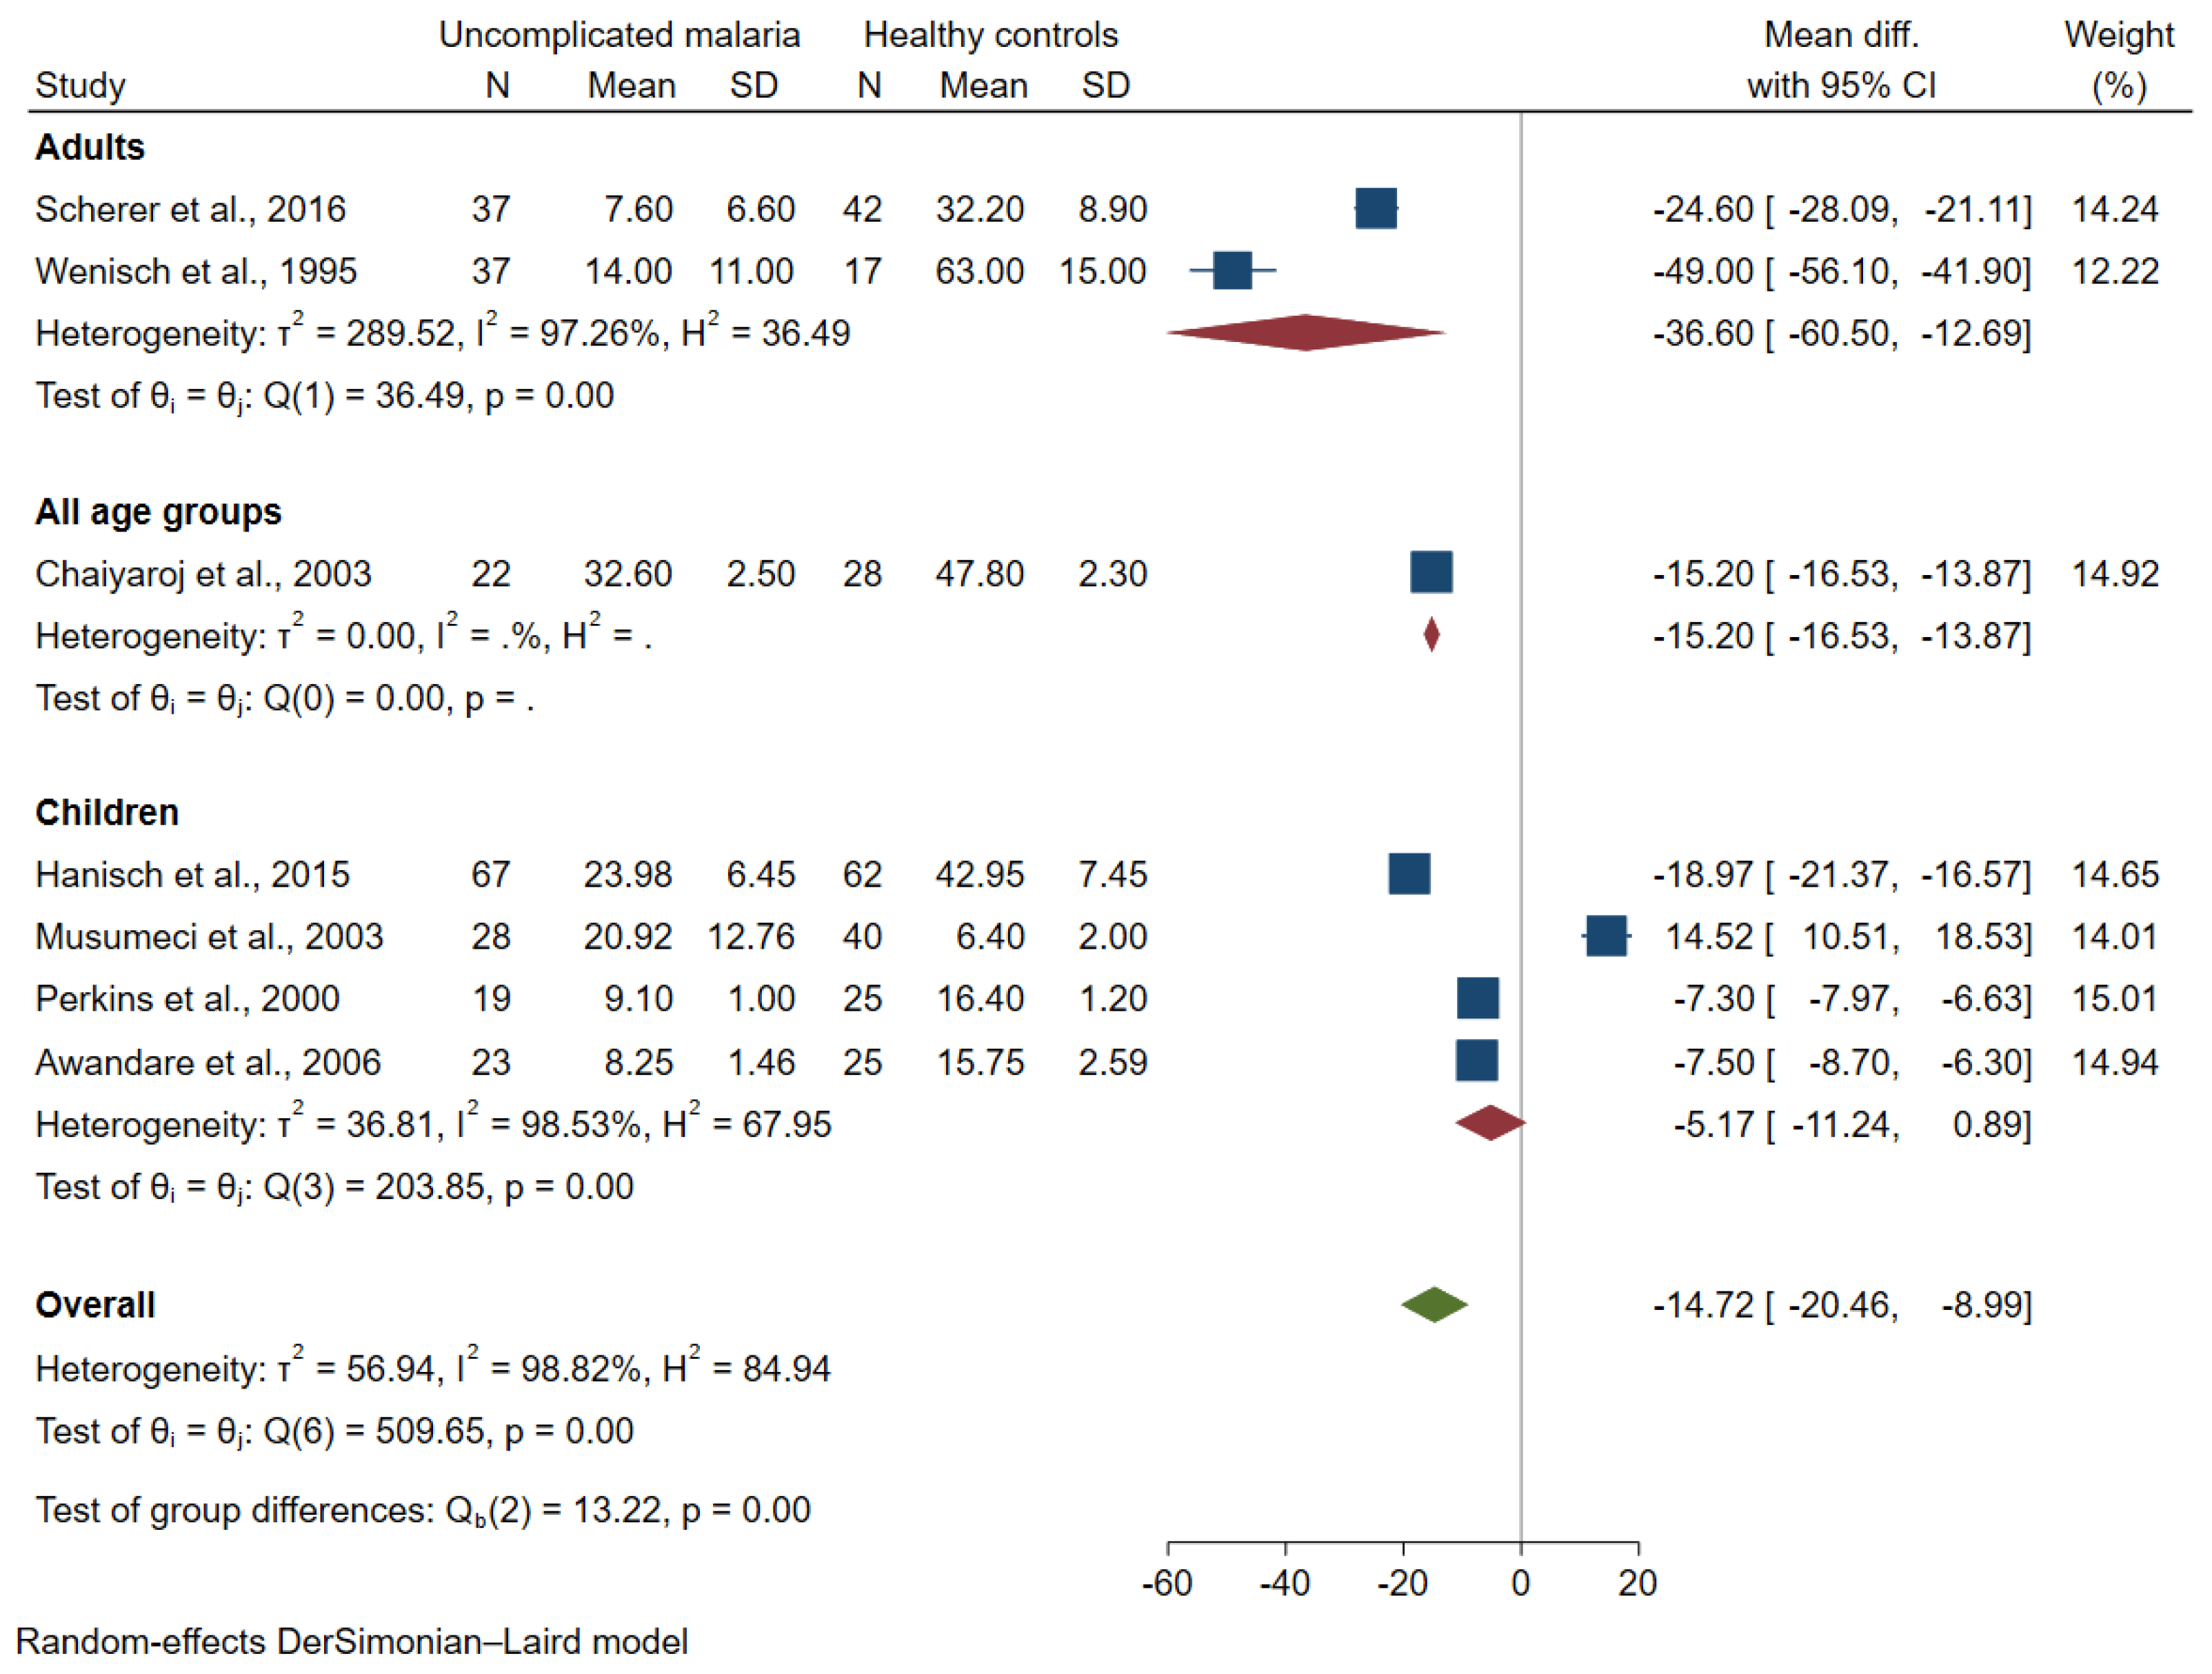
3.3. TGF-β Levels between Uncomplicated Malaria and Healthy Controls

Among the seven studies that enrolled patients with severe and uncomplicated malaria [33,34,35,36,37,38,39], six studies demonstrated lower mean TGF-β levels in patients with uncomplicated malaria than in healthy controls [26,27,33,38,39,42]. A study in Burkina Faso [40] demonstrated no difference in mean TGF-β levels between the two groups. Another study in Indonesia [34] demonstrated that TGF-β levels were higher in P. falciparum monoinfection and mixed P. falciparum/P. vivax infections than those in healthy controls; there was no difference in TGF-β levels between patients with P. vivax monoinfection and healthy controls. Two studies in Uganda [35,37] demonstrated that patients with malaria had higher median TGF-β levels than healthy controls. Another study in Brazil [35] demonstrated patients with uncomplicated malaria had higher TGF-β levels than healthy controls, but the median TGF-β levels were similar to endemic controls.
The difference in TGF-β levels between patients with uncomplicated malaria and healthy controls was estimated using available data from seven studies [26,27,33,38,39,40,42] that enrolled 233 patients with uncomplicated malaria and 239 healthy controls. The meta-analysis showed lower mean TGF-β levels in patients with uncomplicated malaria than healthy controls (p < 0.01, pooled MD = −14.72 pg/mL, 95% CI = −20.46 to 8.99 pg/mL, I2 = 98.82%; seven studies; Figure 2). The meta-regression analysis using study design, continent, age group, Plasmodium spp., method for malaria detection and method for TGF-β quantification as covariates demonstrated that continent and age group confounded the pooled MD (p < 0.01 from each analysis); therefore, subgroup analyses of continent and age group were further performed.
The subgroup analysis of continent demonstrated that no difference in mean TGF-β levels between the two groups was found among studies in Africa (pooled MD = −5.17 pg/mL, 95% CI = −11.24 to 0.89 pg/mL, I2 = 98.53%; four studies) and Asia (pooled MD = −31.91 pg/mL, 95% CI = −65.03 to 1.21 pg/mL, I2 = 98.81%; two studies; Figure 3). The subgroup analysis of age group demonstrated lower mean TGF-β levels in patients with uncomplicated malaria than healthy controls among studies that enrolled adults (pooled MD = −36.6 pg/mL, 95% CI = −60.5 to −12.69 pg/mL, I2 = 97.26%; two studies). No difference in mean TGF-β levels between the two groups was found among studies that enrolled children (pooled MD = −5.17 pg/mL, 95% CI = −11.24 to 0.89 pg/mL, I2 = 98.53%; four studies; Figure 4).
The difference in TGF-β levels between children with uncomplicated P. falciparum malaria and healthy controls was estimated using available data from four studies [26,33,40,42]. The meta-analysis demonstrated no difference in mean TGF-β levels between the two groups (p = 0.09, pooled MD = −5.17 pg/mL, 95% CI = −11.24 to 0.89 pg/mL, I2 = 98.53%; four studies; Supplementary Figure S1). The difference in TGF-β levels between adults with uncomplicated P. vivax malaria and healthy controls was estimated using available data from three studies [27,33,39]. The meta-analysis demonstrated lower mean TGF-β levels in adults with uncomplicated P. vivax malaria than healthy controls (p < 0.01, pooled MD = −22.57 pg/mL, 95% CI = −32.38 to −12.75 pg/mL, I2 = 98.88%; three studies; Supplementary Figure S2).

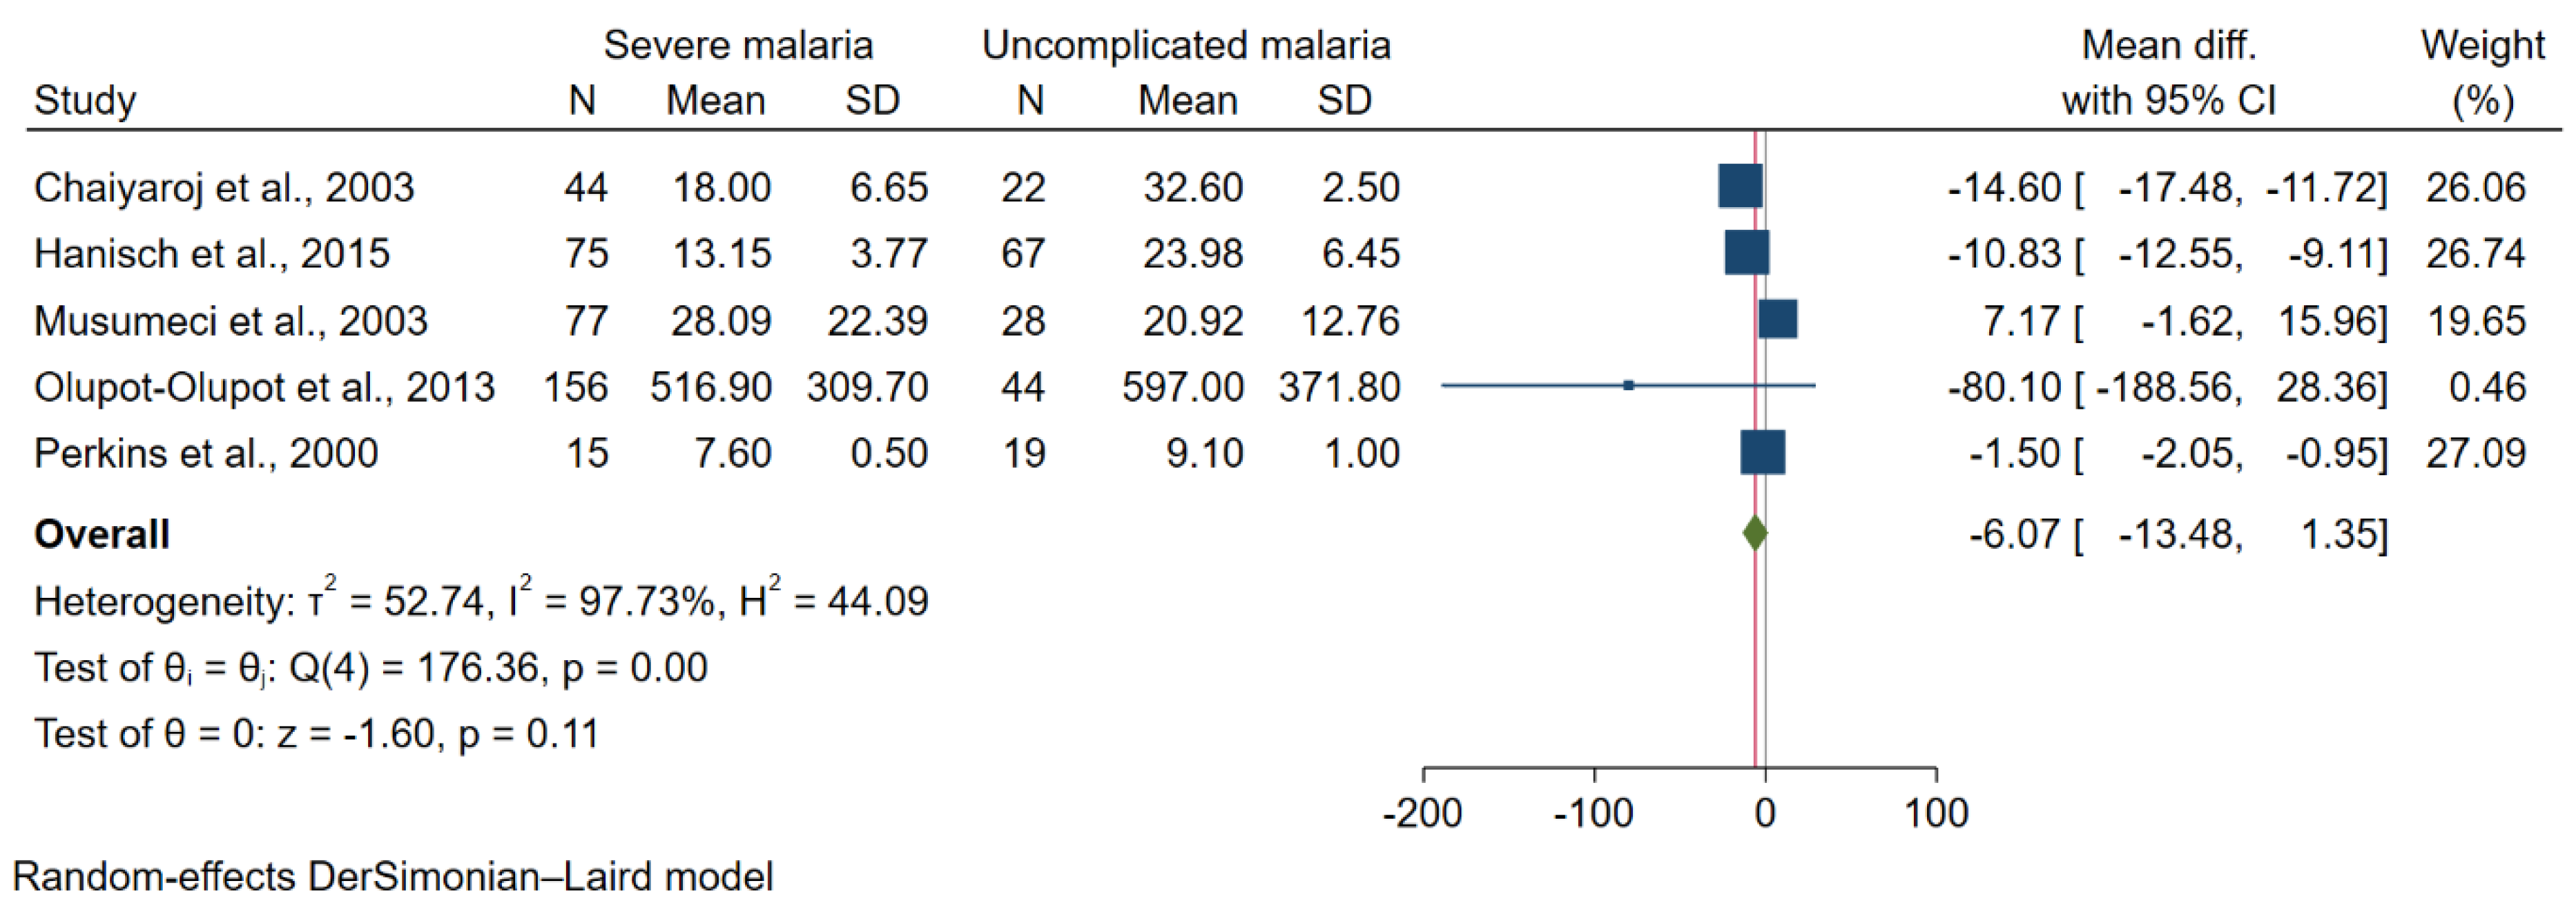
3.4. TGF-β Levels between Severe and Uncomplicated Malaria

Among the six studies that enrolled patients with severe and uncomplicated malaria [26,27,40,41,42,43], three studies demonstrated lower mean TGF-β levels in patients with severe malaria than those with uncomplicated malaria [26,27,42]. Two studies demonstrated no difference in mean TGF-β levels between the two groups [40,41]. A study in India demonstrated higher median TGF-β levels in patients with severe malaria than those with uncomplicated malaria [43].
The difference in TGF-β levels between severe and uncomplicated malaria was estimated using available data from six studies that enrolled 367 patients with severe malaria and 180 patients with uncomplicated malaria [26,27,40,41,42]. The meta-analysis results show no difference in mean TGF-β levels between the two groups (p = 0.11, pooled MD = −6.07 pg/mL, 95% CI = −13.48 to 1.35 pg/mL, I2 = 97.73%; five studies; Figure 5). The meta-regression analysis using study design, continent, age group, Plasmodium spp., method for malaria detection, and method for TGF-β quantification as covariates demonstrated that these covariates did not confound the pooled MD (p > 0.05 from each analysis); therefore, subgroup analysis was not further performed. The difference in TGF-β levels between children with severe and uncomplicated P. falciparum malaria was estimated using available data from four studies [26,40,41,42]. The meta-analysis results show no difference in mean TGF-β levels between the two groups (p = 0.44, pooled MD = −3.12 pg/mL, 95% CI = −11.01 to 4.76 pg/mL, I2 = 97.26%; four studies; Supplementary Figure S3).

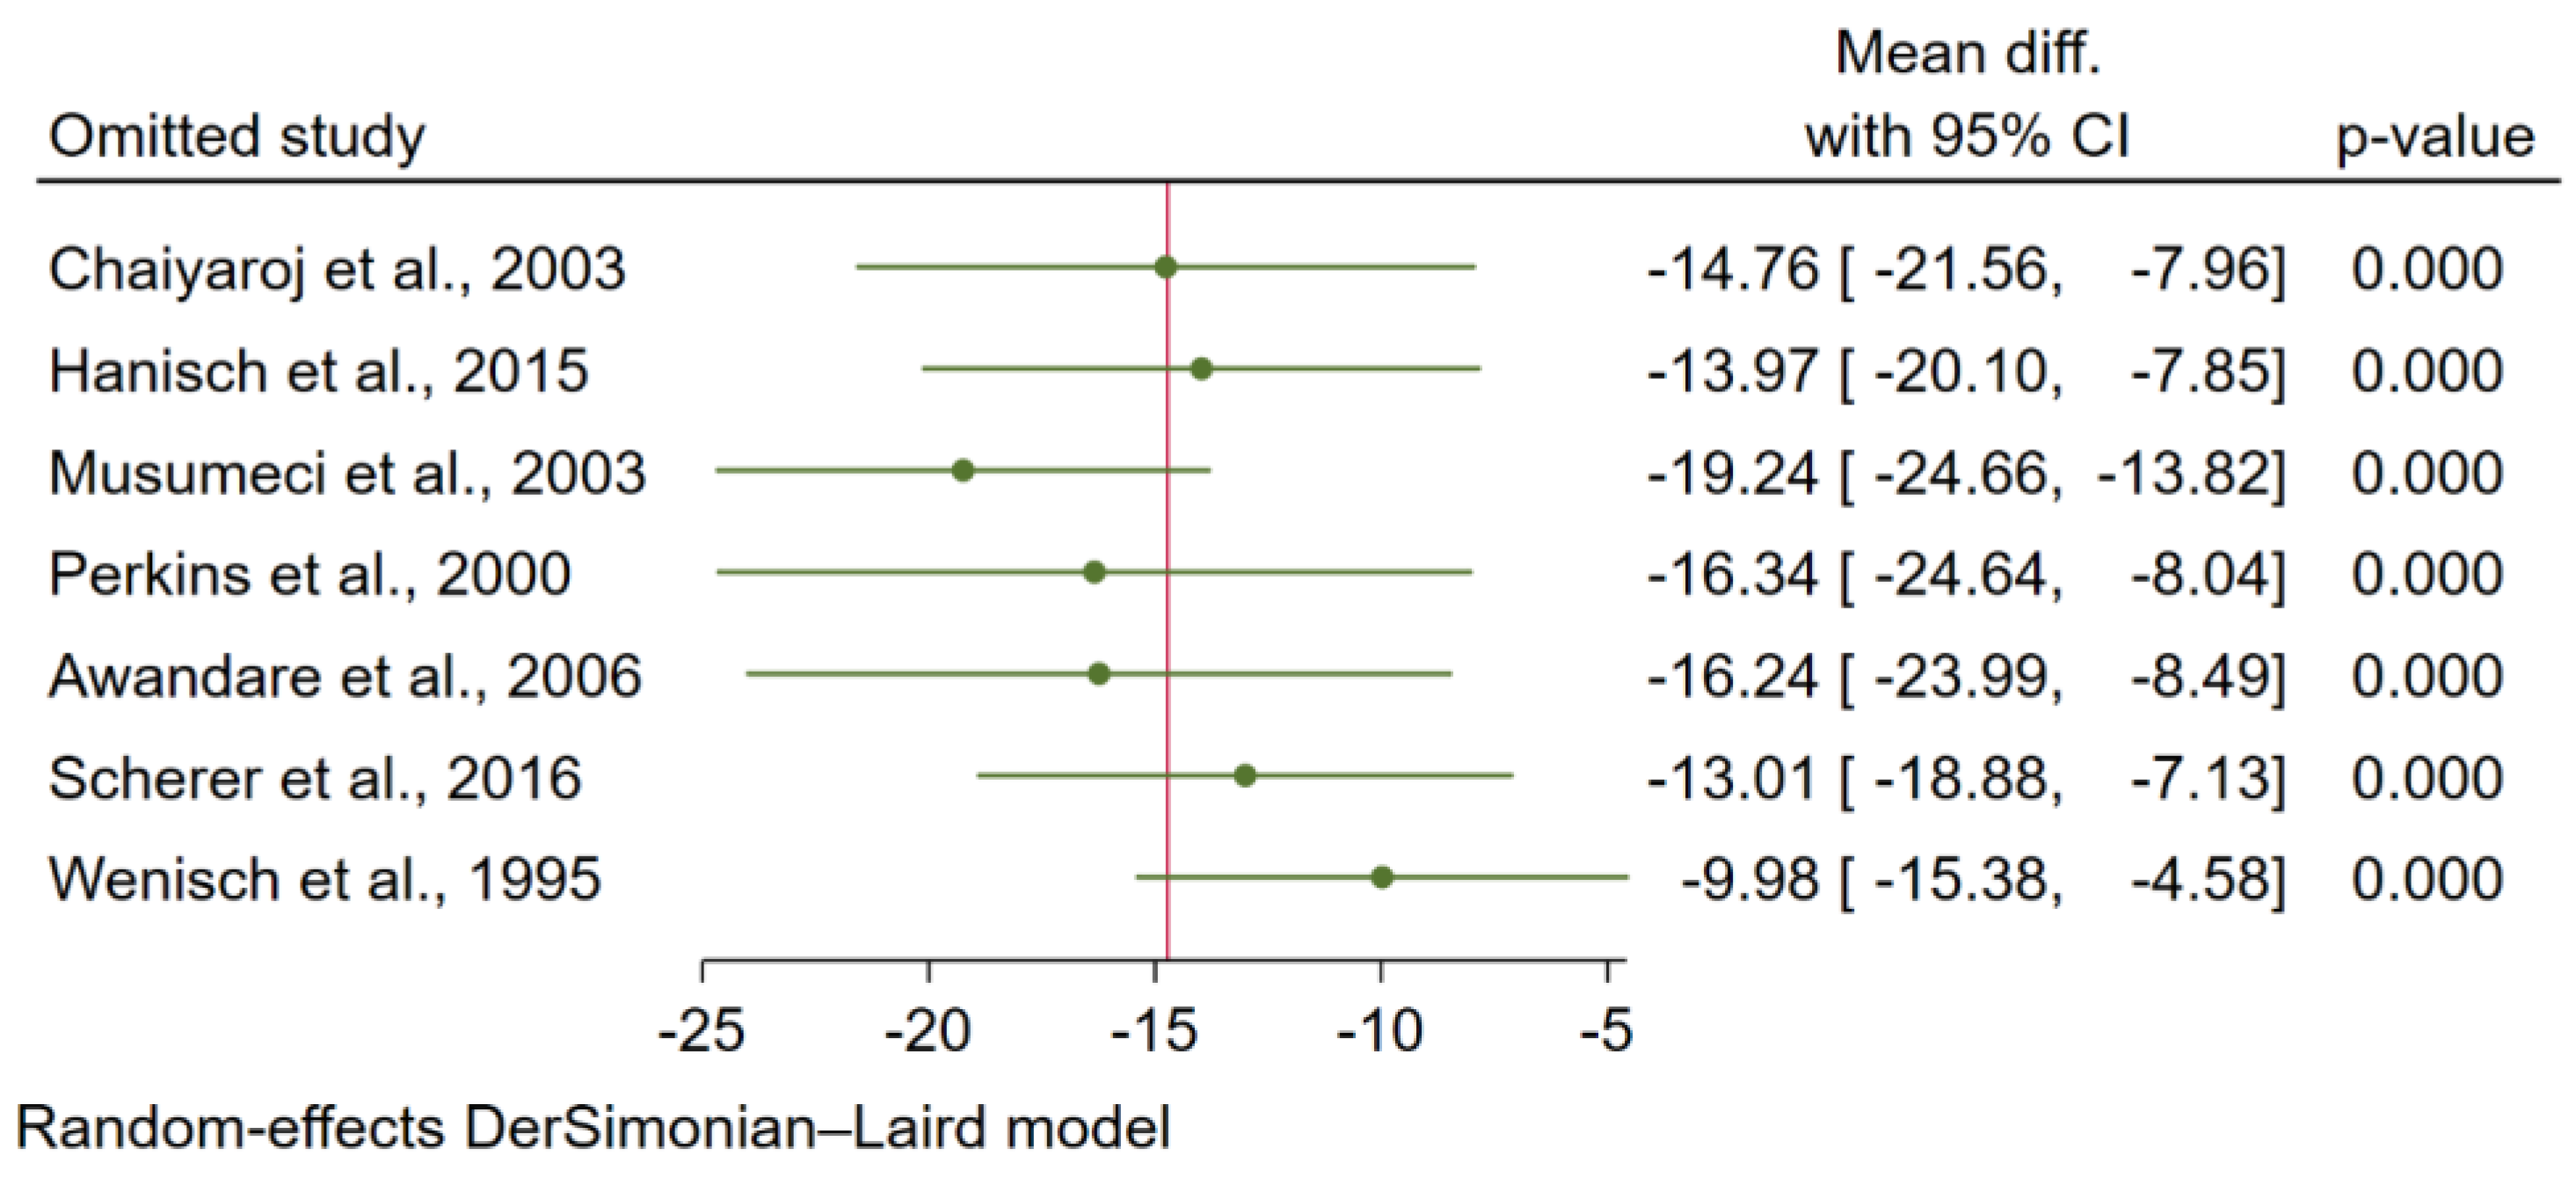
3.5. Sensitivity Analysis

Sensitivity analysis was performed to determine the robustness of the meta-analysis results. When each study was excluded from the meta-analysis of the difference in TGF-β levels between patients with uncomplicated malaria and healthy controls, the re-run analysis showed robust meta-analysis results (p < 0.05 in each analysis; Figure 6). In addition, when each study was excluded from the meta-analysis of the difference in TGF-β levels between patients with severe and uncomplicated malaria, the re-run analysis showed that the meta-analysis results were not robust (p < 0.05 in two analyses and p > 0.05 in three analyses; Figure 7).

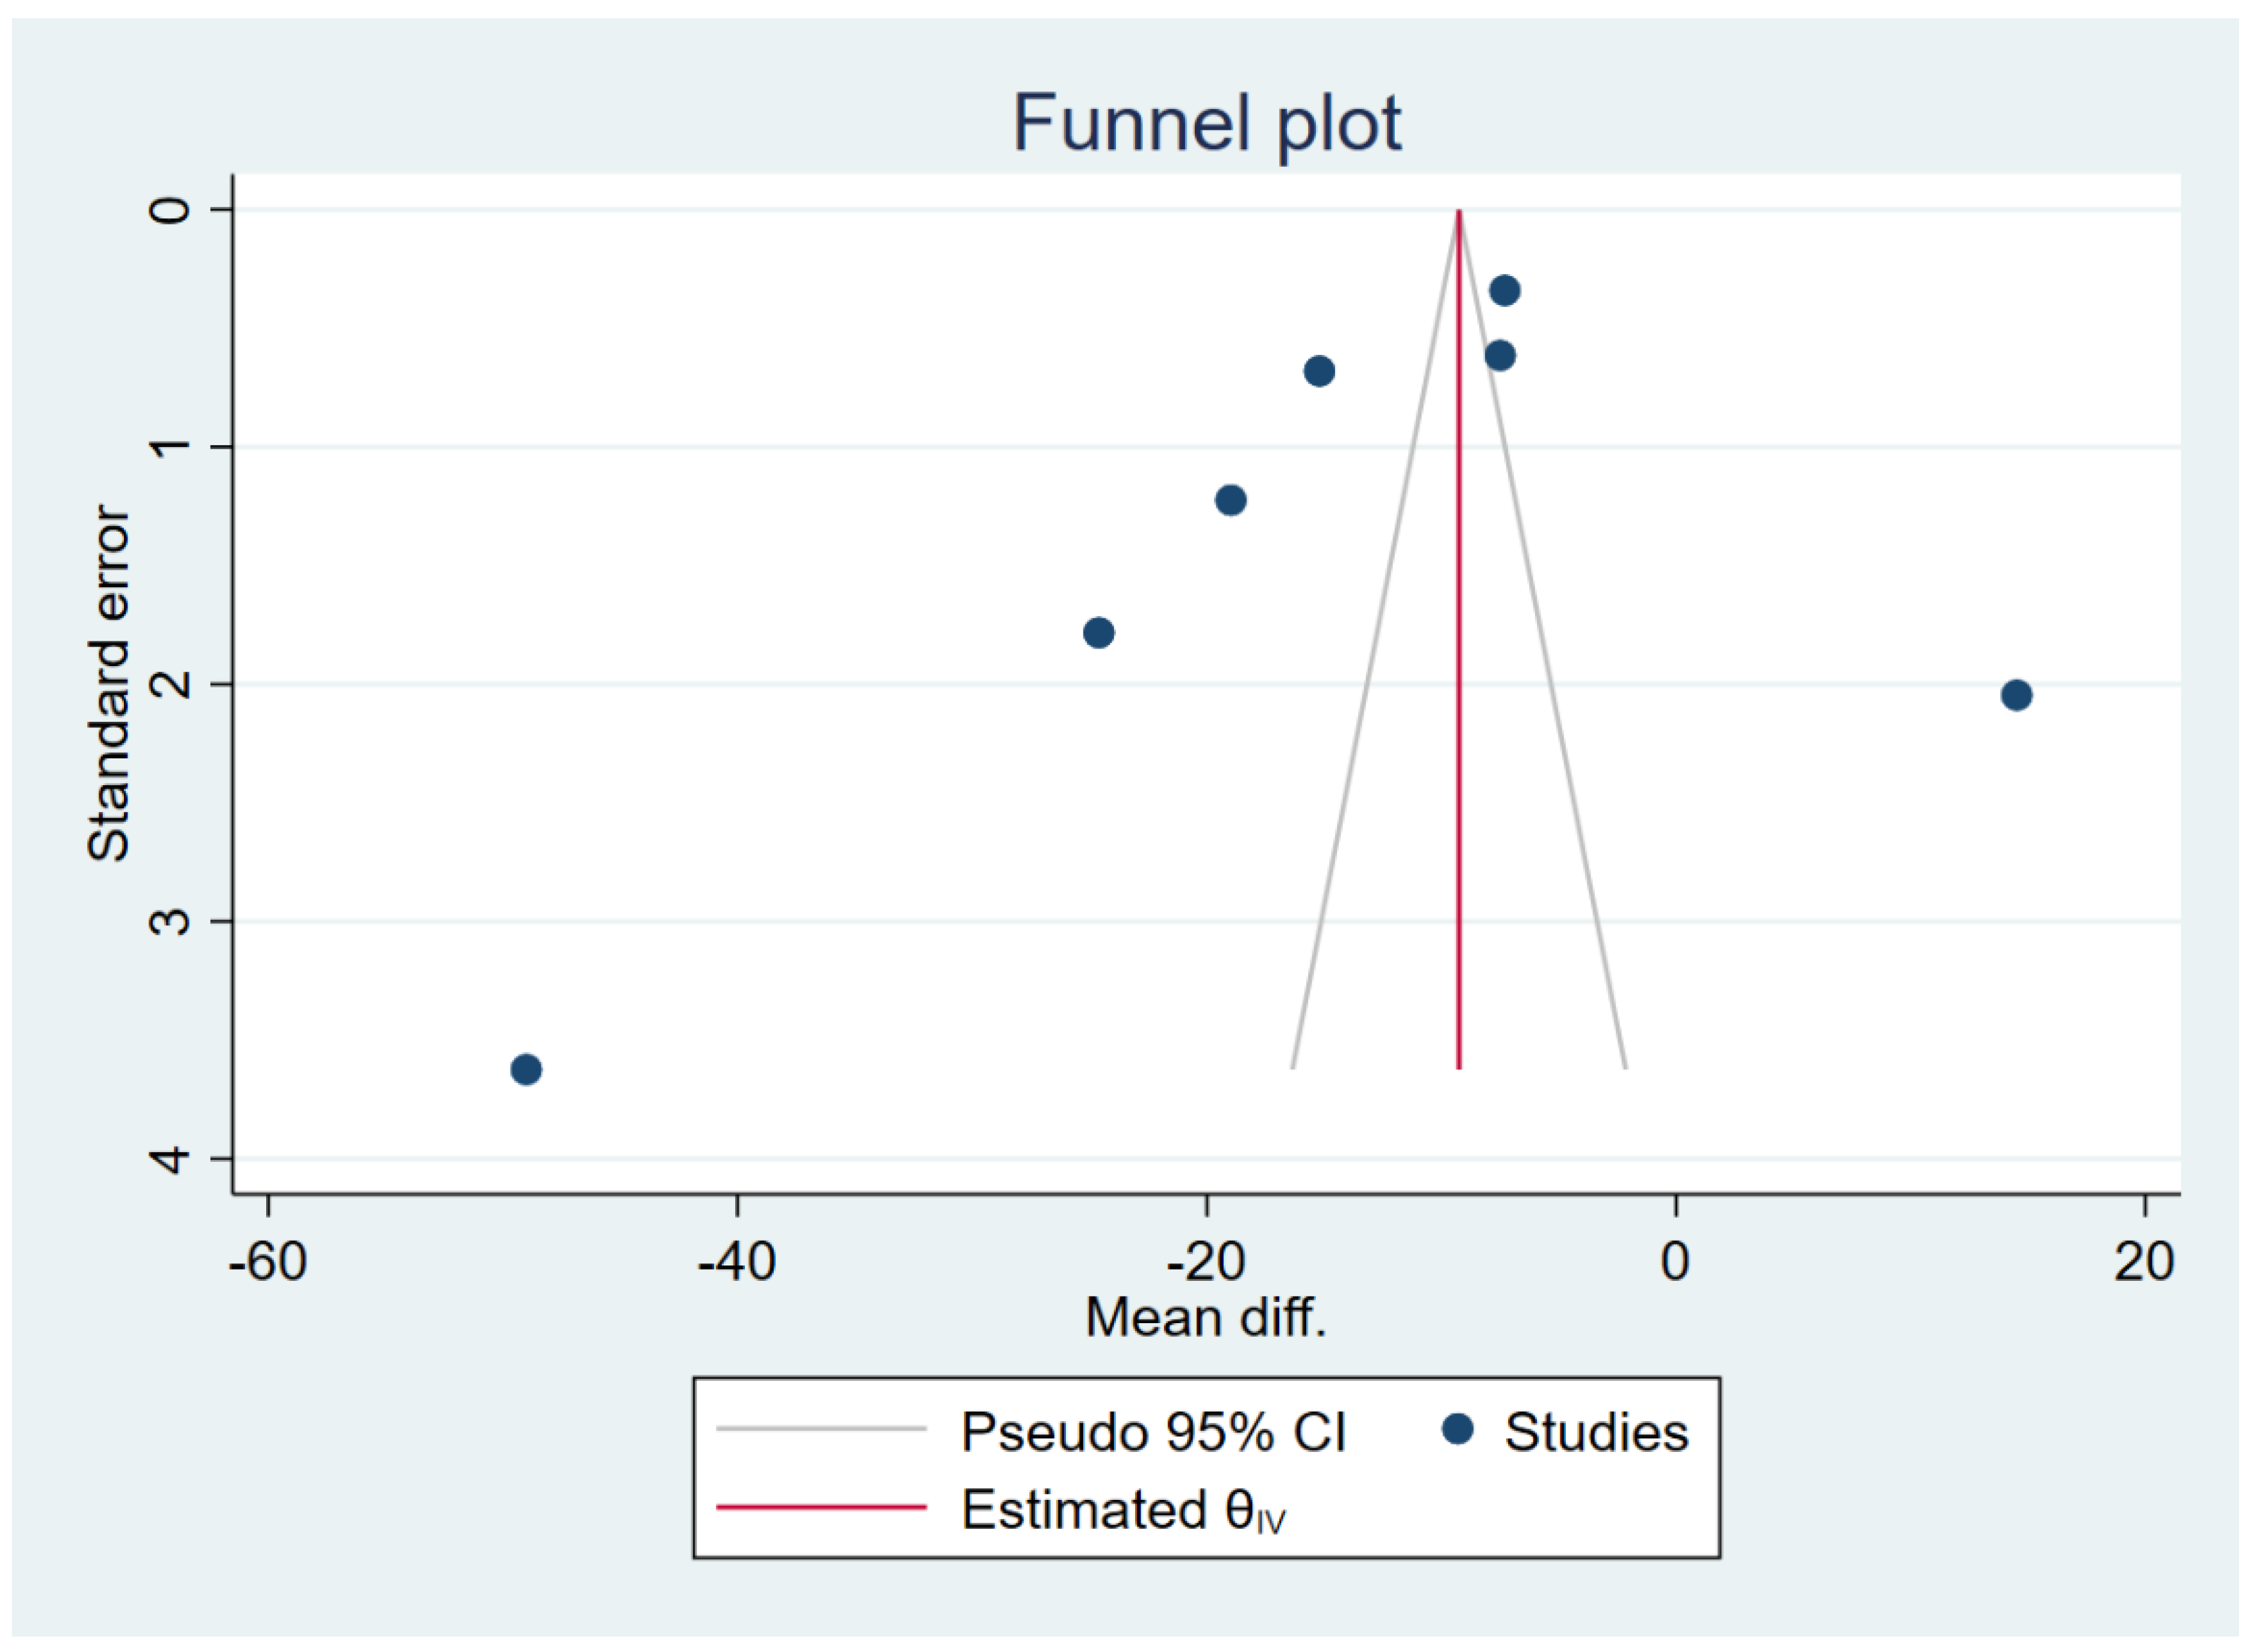
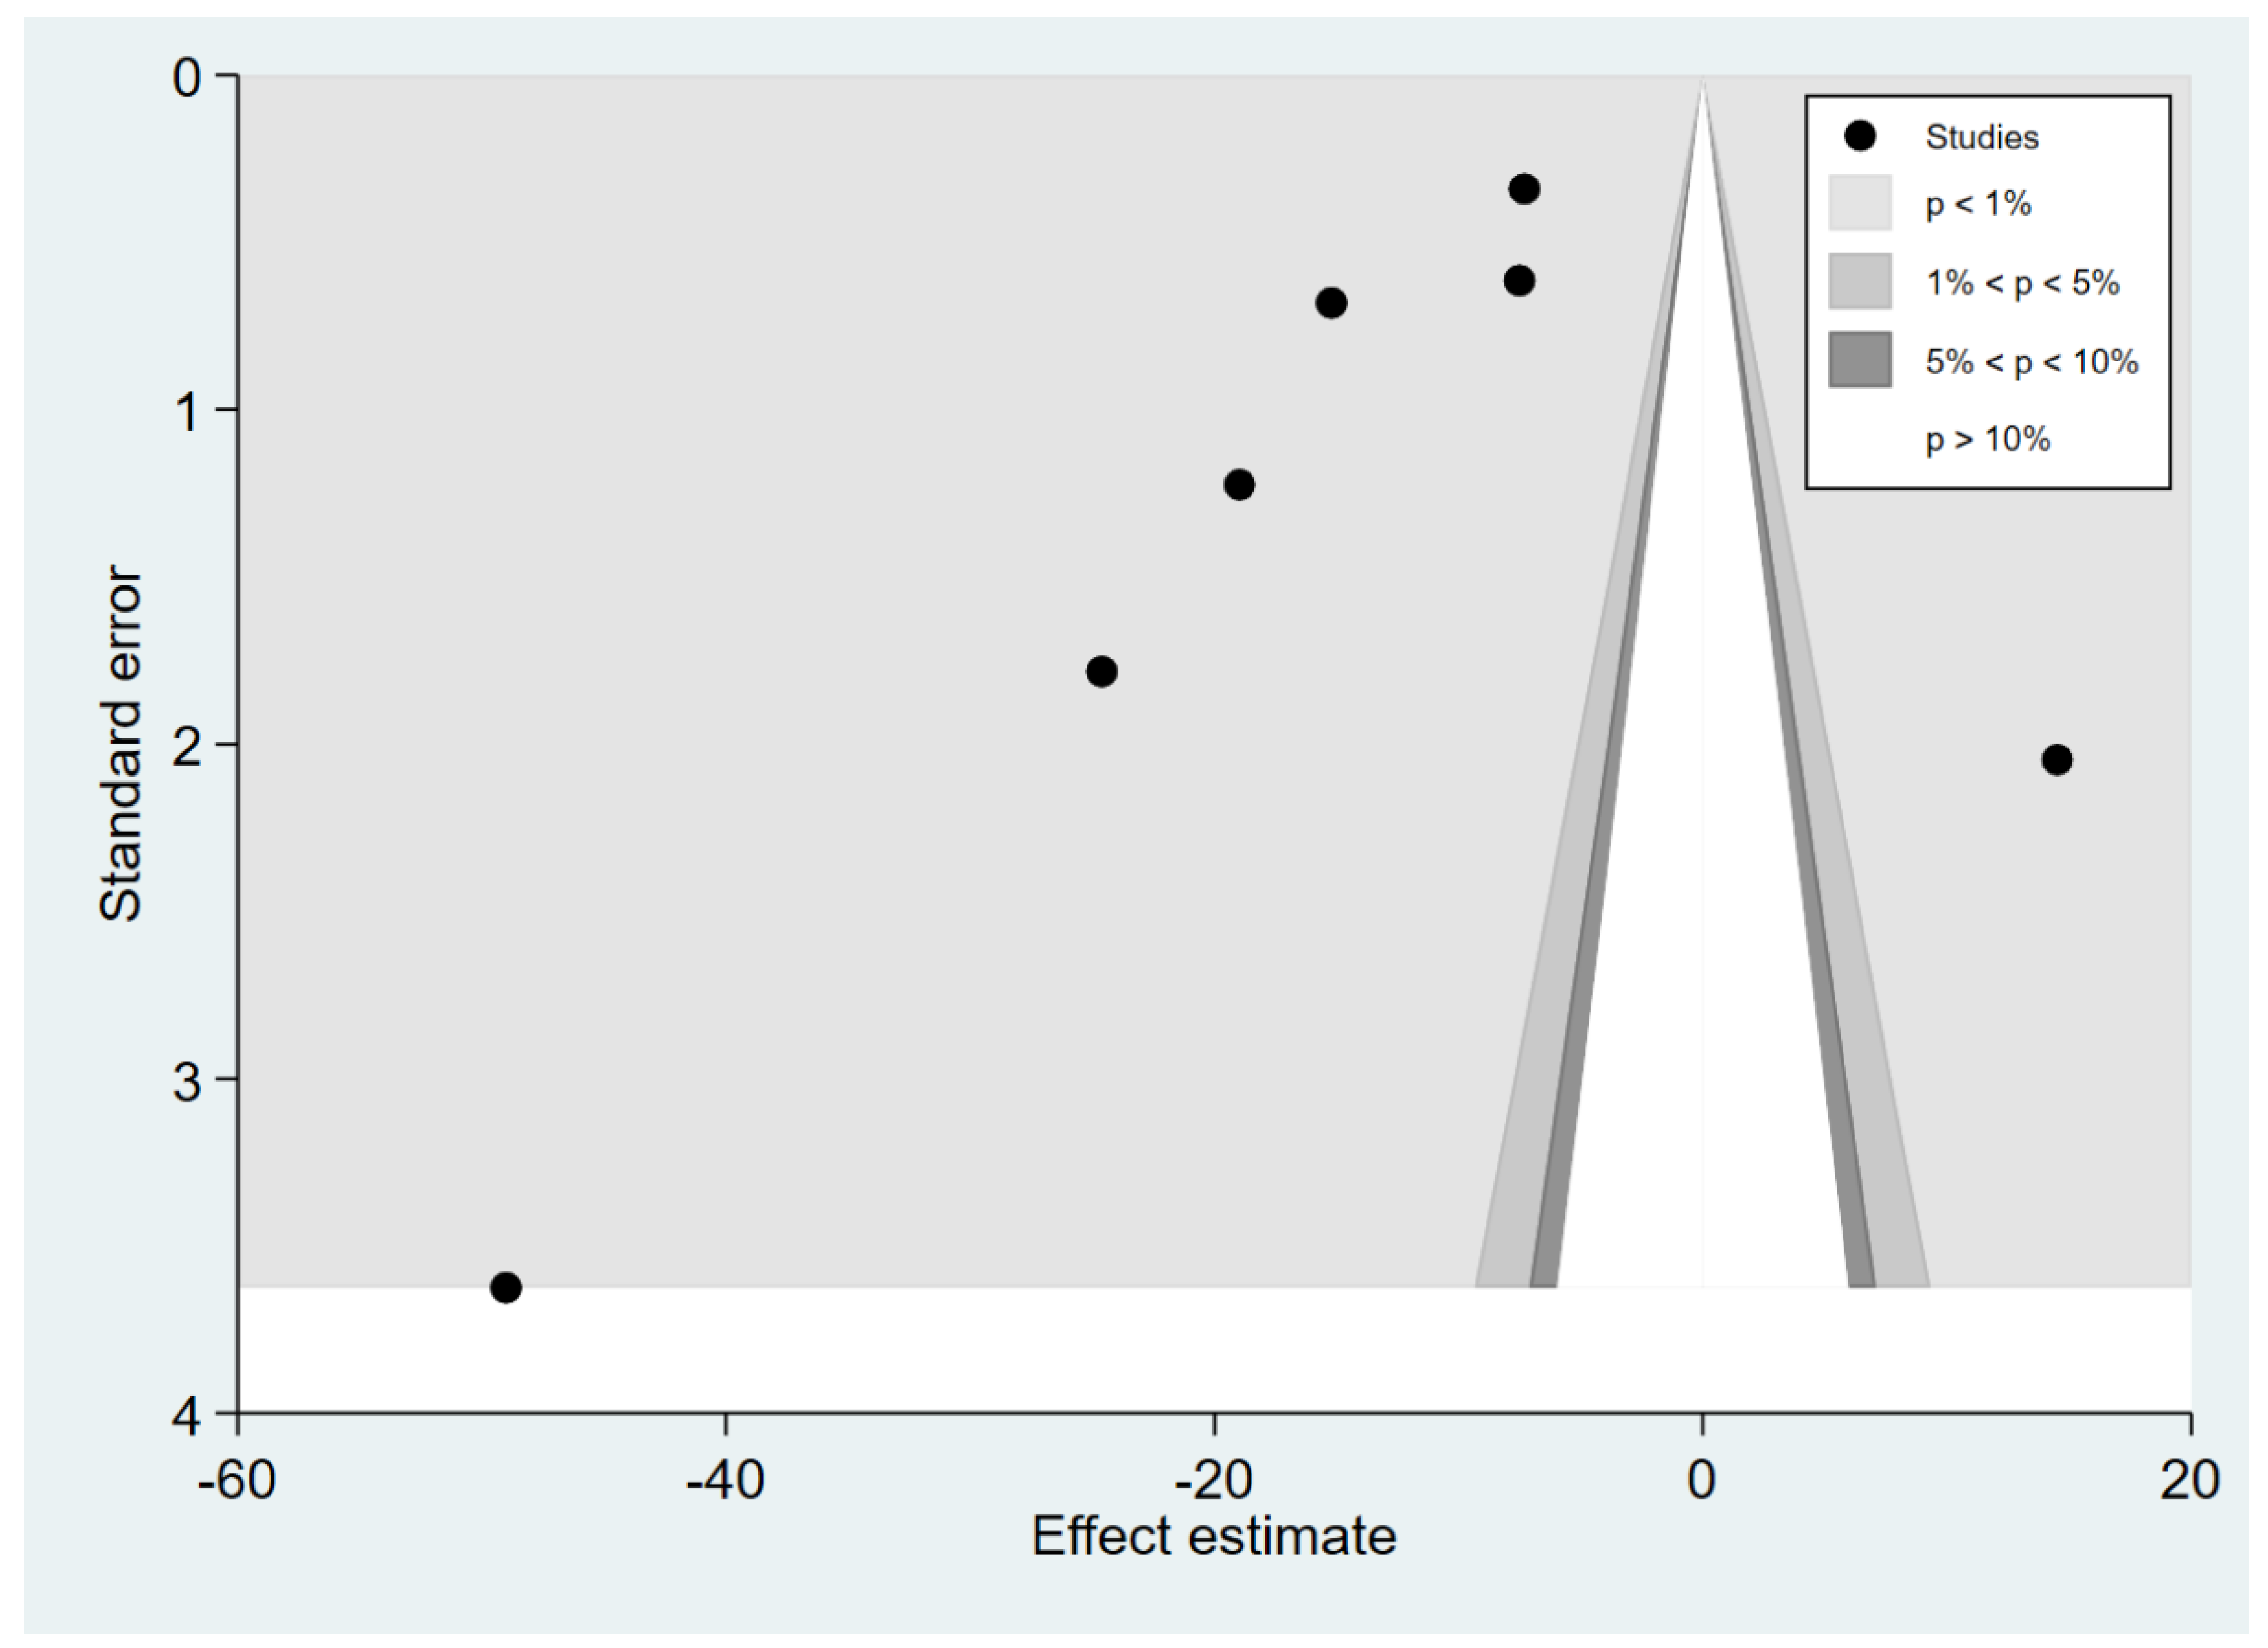
3.6. Publication Bias

The publication bias was assessed by the visualisation of the funnel plot, Egger’s test and contour-enhanced funnel plot. The meta-analysis results of the difference in TGF-β levels between patients with uncomplicated malaria and healthy controls reveal funnel plot asymmetry (Figure 8). The Egger’s test demonstrated a small-study effect (p = 0.002). The contour-enhanced funnel plot revealed that MDs were only distributed in a significant area (p = 0.01; Figure 9), indicating that the meta-analysis of the difference in TGF-β levels between patients with uncomplicated malaria and healthy controls had a publication bias. The trim and fill method has been applied to correct the pooled MD in the presence of a publication bias. After the publication was adjusted, the meta-analysis results showed that patients with uncomplicated malaria had lower mean TGF-β levels than healthy controls (pooled MD = −9.25 pg/mL, 95% CI = −9.76 to 8.74 pg/mL; 13 studies).
The meta-analysis results of the difference in TGF-β levels between patients with severe and uncomplicated malaria reveal funnel plot asymmetry (Figure 10). The Egger’s test demonstrated no small-study effect (p = 0.45). The contour-enhanced funnel plot revealed that the MDs were distributed in both significant (p = 0.01) and non-significant (p > 0.05, Figure 11) areas, implying that the meta-analysis of the difference in TGF-β levels between patients with severe and uncomplicated malaria may have been influenced by the publication bias. The trim and fill method has been applied to correct the pooled MD in the presence of the publication bias. After the publication was adjusted, the meta-analysis results show that patients with severe malaria had lower mean TGF-β levels than those with uncomplicated malaria (pooled MD = −2.75 pg/mL, 95% CI = −3.27 to −2.23 pg/mL; 13 studies).

4. Discussion

In this study, the meta-analysis results show that TGF-β levels were significantly lower in malaria patients than in healthy controls, suggesting that lower TGF-β levels might be a candidate marker for acute malaria. The certainty of the evidence was confirmed by the sensitivity analysis. Only Musumeci et al. [40] found higher TGF-β levels than healthy controls, implying that TGF-β has two different functions in malarial infection depending on the stage of infection. TGF-β stimulates Th1-mediated pathways that limit parasite development early in the infection. In contrast, TGF-β suppresses the Th1 response, limiting inflammation-related diseases [40].
In a previous study, despite increased parasitemia levels, high TGF-β levels were associated with lower clinical states of malaria [9]. TGF-β was elevated in malaria co-infection, and might be used to differentiate malaria monoinfection from malaria co-infections [35,37]. Nevertheless, TGF-β levels were lower in patients with uncomplicated malaria than in healthy controls in subgroup analyses of adults enrolled in studies [38,39]. No difference in mean TGF-β levels was found between the two groups in studies that included children [26,33,40,42]. Comparing similar age groups and Plasmodium spp., no difference in TGF-β levels in children with uncomplicated P. falciparum malaria and healthy controls was found based on the meta-analysis results. The trend for TGF-β levels in children presenting with P. falciparum malaria during the acute phase of the infection was lower than in healthy controls, because 75% of the studies included in the meta-analysis demonstrated lower TGF-β levels in children. Nevertheless, the high heterogeneity of the meta-analysis results raises the question of whether higher or lower TGF-β levels could be a candidate marker for P. falciparum malaria in children. In healthy children 0–14 years old, there were significantly higher serum TGF-β levels than adults >15 years old [44]. It is possible that, after acute malarial infection in children, regulatory and pro-inflammatory cytokine responses might be suppressed in younger children; compared to healthy children, there might be lower serum TGF-β levels in children infected with malaria, as shown by the meta-analysis results. For P. vivax infection in adults, the meta-analysis results show significantly lower TGF-β levels in adults with P. vivax malaria than healthy controls. There was a strong trend towards TGF-β levels in adults presenting with P. vivax malaria during the acute phase of the infection, as all studies included in the meta-analysis demonstrated lower TGF-β levels in children [27,33,39]. Therefore, lower TGF-β levels might be a candidate marker for P. vivax malaria in adults. There is a possible explanation for the lower TGF-β levels among adults infected with malaria. TGF-β levels might be suppressed by repeated malarial exposure, age-related variations in the immune response, or both [45]. Nonetheless, a comparison of TGF-β levels in children from a low transmission area versus a high transmission area revealed a significant difference in TGF-β levels, with children from the low transmission area having higher TGF-β levels [23]. As a result, differences in malaria endemicity could be another source of TGF-β heterogeneity among the included studies. This continent subgroup analysis revealed no subgroup differences in TGF-β levels between studies in Africa and Asia, indicating a need for additional research.
The meta-analysis results confirm no difference in mean TGF-β levels between severe and uncomplicated malaria. Considering the same age groups and Plasmodium spp., no difference in TGF-β levels in children with severe and uncomplicated P. falciparum malaria was found based on the meta-analysis results. With the high heterogeneity of TGF-β levels in the included studies, it raises the question of whether higher or lower TGF-β levels could be a candidate marker for severe P. falciparum malaria in children. According to Musumeci et al. [40], higher TGF-β levels downregulate IL-12, modulating the immune response to P. falciparum and thus decreasing susceptibility to severe malaria. Chaiyaroj et al. [27] found that TGF-β levels were significantly lower in all malaria groups compared to controls, with the lowest levels of TGF-β detected in patients with cerebral malaria. Hanisch et al. showed that decreased TGF-β was associated with cytokine/chemokine changes associated with disease severity and death; however, no link between parasitemia and TGF-β was discovered [26]. TGF-β was inversely related to infection severity in the Plasmodium berghei-infected mouse model, and is critical for controlling cytokine expression by significantly lowering TGF-β plasma levels [46]. Furthermore, the low TGF-β/tumour necrosis factor-α (TNF-α) ratio implies that a lack of TGF-β response in children with severe malaria may result in TNF-α overproduction [43]. In patients with severe malaria, TNF-α production was higher than those with uncomplicated malaria [47]. TGF-β administration prevents mortality during lethal infections in mice by neutralising the IFN-γ pathway and downregulating TNF-α production [48]. TGF-β levels were also highest in cerebral malaria, followed by severe malaria, then non-severe malaria [43]. Increased TGF-β production, the presence of CD4+CD25+FOXP3+ Tregs, and a reduction in pro-inflammatory cytokine production have all been linked to higher parasite development rates in P. falciparum-infected volunteers [49]. TGF-β levels may be comparable in patients with severe and uncomplicated malaria because this cytokine may follow a pattern dictated by other factors rather than directly influencing the pathogenic process.
This study has certain limitations. First, although the meta-regression revealed that patient age confounds the pooled effect measure between patients with uncomplicated malaria and healthy controls, heterogeneity within each subgroup remained considerable. Other factors that could alter the pooled effect measure were discovered as a result of these findings, and they were examined further. Second, there are few studies on TGF-β levels in severe and uncomplicated malaria. As a result, the meta-analysis results revealed a diverse set of results with publication bias. If more papers were included in the meta-analysis, TGF-β levels might be lower in patients with severe malaria than in those with uncomplicated malaria, according to publication bias adjustment.

5. Conclusions

This meta-analysis showed decreased TGF-β levels in patients with uncomplicated malaria compared to healthy controls. There was no difference in TGF-β levels in children with uncomplicated P. falciparum malaria compared to healthy controls, but a significant decrease in TGF-β levels was observed among adults with uncomplicated P. vivax malaria compared to healthy controls. In addition, there was no difference in TGF-β levels between patients with severe and uncomplicated malaria. More research is needed to determine the TGF-β levels as a candidate marker for malarial infection and severity.

Supplementary Materials

The following supporting information can be downloaded at: https://www.mdpi.com/article/10.3390/tropicalmed7100299/s1, Figure S1: Uncomplicated Pf children vs controls; Figure S2: Uncomplicated Pv adults vs controls; Figure S3: Severe vs uncomplicated Pf children; Table S1: Search term; Table S2: Details of the included studies; Table S3: Quality of the included studies.

Author Contributions

Conceptualisation, K.U.K., A.M., P.K. and M.K.; methodology, K.U.K., A.M., P.K. and M.K.; software, M.K.; validation, F.R.M. and K.U.K.; formal analysis, M.K.; investigation, K.U.K., M.K. and P.K.; resources, A.M.; data curation, A.M. and M.K.; writing—original draft preparation, K.U.K., A.M., P.K. and M.K.; writing—review and editing, F.R.M. and K.U.K.; visualisation, M.K.; supervision, M.K.; project administration, M.K.; funding acquisition, M.K. and A.M. All authors have read and agreed to the published version of the manuscript.

Funding

This research received no external funding.

Institutional Review Board Statement

Not applicable.

Informed Consent Statement

Not applicable.

Data Availability Statement

All data related to the manuscript were available in the main manuscript its supplementary files.

Acknowledgments

This research was financially supported by the new strategic research project (P2P) fiscal year 2022, Walailak University, Thailand.

Conflicts of Interest

The authors declare no conflict of interest.

References

  1. World Health Organization. World Malaria Report 2021; World Health Organization: Geneva, Switzerland, 2022. [Google Scholar]
  2. Kotepui, M.; Kotepui, K.U.; Milanez, G.J.; Masangkay, F.R. Prevalence and risk factors related to poor outcome of patients with severe Plasmodium vivax infection: A systematic review, meta-analysis, and analysis of case reports. BMC Infect. Dis. 2020, 20, 363. [Google Scholar] [CrossRef] [PubMed]
  3. Kotepui, M.; Kotepui, K.U.; Milanez, G.D.; Masangkay, F.R. Severity and mortality of severe Plasmodium ovale infection: A systematic review and meta-analysis. PLoS ONE 2020, 15, e0235014. [Google Scholar] [CrossRef] [PubMed]
  4. Kotepui, M.; Kotepui, K.U.; Milanez, G.D.; Masangkay, F.R. Prevalence of severe Plasmodium knowlesi infection and risk factors related to severe complications compared with non-severe P. knowlesi and severe P. falciparum malaria: A systematic review and meta-analysis. Infect. Dis. Poverty 2020, 9, 106. [Google Scholar] [CrossRef] [PubMed]
  5. Kotepui, M.; Kotepui, K.U.; Milanez, G.D.; Masangkay, F.R. Global prevalence and mortality of severe Plasmodium malariae infection: A systematic review and meta-analysis. Malar J. 2020, 19, 274. [Google Scholar] [CrossRef]
  6. McCall, M.B.; Sauerwein, R.W. Interferon-gamma-central mediator of protective immune responses against the pre-erythrocytic and blood stage of malaria. J. Leukoc. Biol. 2010, 88, 1131–1143. [Google Scholar] [CrossRef] [Green Version]
  7. Torre, D.; Speranza, F.; Martegani, R. Role of proinflammatory and anti-inflammatory cytokines in the immune response to Plasmodium falciparum malaria. Lancet Infect. Dis. 2002, 2, 719–720. [Google Scholar] [CrossRef]
  8. Sporn, M.B. TGF-beta: 20 years and counting. Microbes Infect. 1999, 1, 1251–1253. [Google Scholar] [CrossRef]
  9. Drewry, L.L.; Harty, J.T. Balancing in a black box: Potential immunomodulatory roles for TGF-β signaling during blood-stage malaria. Virulence 2020, 11, 159–169. [Google Scholar] [CrossRef] [Green Version]
  10. de Larco, J.E.; Todaro, G.J. Growth factors from murine sarcoma virus-transformed cells. Proc. Natl. Acad. Sci. USA 1978, 75, 4001–4005. [Google Scholar] [CrossRef] [Green Version]
  11. Prud’homme, G.J. Pathobiology of transforming growth factor beta in cancer, fibrosis and immunologic disease, and therapeutic considerations. Lab. Investig. J. Tech. Methods Pathol. 2007, 87, 1077–1091. [Google Scholar] [CrossRef]
  12. Moustakas, A.; Heldin, C.H. Non-Smad TGF-beta signals. J. Cell Sci. 2005, 118, 3573–3584. [Google Scholar] [CrossRef] [PubMed]
  13. Segarini, P.R.; Rosen, D.M.; Seyedin, S.M. Binding of transforming growth factor-β to cell surface proteins varies with cell type. Mol. Endocrinol. 1989, 3, 261–272. [Google Scholar] [CrossRef] [PubMed] [Green Version]
  14. Gougos, A.; Letarte, M. Primary structure of endoglin, an RGD-containing glycoprotein of human endothelial cells. J. Biol. Chem. 1990, 265, 8361–8364. [Google Scholar] [CrossRef]
  15. Tian, M.; Neil, J.R.; Schiemann, W.P. Transforming growth factor-β and the hallmarks of cancer. Cell. Signal. 2011, 23, 951–962. [Google Scholar] [CrossRef] [PubMed] [Green Version]
  16. Oh, S.A.; Li, M.O. TGF-β: Guardian of T cell function. J. Immunol. 2013, 191, 3973–3979. [Google Scholar] [CrossRef] [Green Version]
  17. Li, M.O.; Wan, Y.Y.; Sanjabi, S.; Robertson, A.K.; Flavell, R.A. Transforming growth factor-beta regulation of immune responses. Annu. Rev. Immunol. 2006, 24, 99–146. [Google Scholar] [CrossRef] [PubMed]
  18. Thomson, A.W.; Lotze, M.T. The Cytokine Handbook, Two-Volume Set; Elsevier: Amsterdam, The Netherlands, 2003. [Google Scholar]
  19. Sanjabi, S.; Oh, S.A.; Li, M.O. Regulation of the immune response by tgf-beta: From conception to autoimmunity and infection. Cold Spring Harb. Perspect. Biol. 2017, 9, a022236. [Google Scholar] [CrossRef] [Green Version]
  20. Barral, A.; Barral-Netto, M.; Yong, E.C.; Brownell, C.E.; Twardzik, D.R.; Reed, S.G. Transforming growth factor beta as a virulence mechanism for Leishmania braziliensis. Proc. Natl. Acad. Sci. USA 1993, 90, 3442–3446. [Google Scholar] [CrossRef] [Green Version]
  21. Grainger, J.R.; Smith, K.A.; Hewitson, J.P.; McSorley, H.J.; Harcus, Y.; Filbey, K.J.; Finney, C.A.; Greenwood, E.J.; Knox, D.P.; Wilson, M.S.; et al. Helminth secretions induce de novo T cell Foxp3 expression and regulatory function through the TGF-β pathway. J. Exp. Med. 2010, 207, 2331–2341. [Google Scholar] [CrossRef]
  22. Halsey, E.S.; Baldeviano, G.C.; Edgel, K.A.; Vilcarromero, S.; Sihuincha, M.; Lescano, A.G. Symptoms and Immune Markers in Plasmodium/Dengue Virus Co-infection Compared with Mono-infection with Either in Peru. PLoS Negl. Trop. Dis. 2016, 10, e0004646. [Google Scholar] [CrossRef]
  23. Nyirenda, T.S.; Molyneux, M.E.; Kenefeck, R.; Walker, L.S.; MacLennan, C.A.; Heyderman, R.S.; Mandala, W.L. T-Regulatory cells and inflammatory and inhibitory cytokines in malawian children residing in an area of high and an area of low malaria transmission during acute uncomplicated malaria and in convalescence. J. Pediatric Infect. Dis. Soc. 2015, 4, 232–241. [Google Scholar] [CrossRef] [PubMed] [Green Version]
  24. Baker, V.S.; Imade, G.E.; Molta, N.B.; Tawde, P.; Pam, S.D.; Obadofin, M.O.; Sagay, S.A.; Egah, D.Z.; Iya, D.; Afolabi, B.B.; et al. Cytokine-associated neutrophil extracellular traps and antinuclear antibodies in Plasmodium falciparum infected children under six years of age. Malar J. 2008, 7, 41. [Google Scholar] [CrossRef] [PubMed] [Green Version]
  25. Esamai, F.; Ernerudh, J.; Janols, H.; Welin, S.; Ekerfelt, C.; Mining, S.; Forsberg, P. Cerebral malaria in children: Serum and cerebrospinal fluid TNF-α and TGF-β levels and their relationship to clinical outcome. J. Trop. Pediatrics 2003, 49, 216–223. [Google Scholar] [CrossRef] [PubMed] [Green Version]
  26. Hanisch, B.R.; Bangirana, P.; Opoka, R.O.; Park, G.S.; John, C.C. Thrombocytopenia may mediate disease severity in Plasmodium falciparum malaria through reduced transforming growth factor beta-1 regulation of proinflammatory and anti-inflammatory cytokines. Pediatric Infect. Dis. J. 2015, 34, 783–788. [Google Scholar] [CrossRef] [Green Version]
  27. Chaiyaroj, S.C.; Rutta, A.S.; Muenthaisong, K.; Watkins, P.; Na Ubol, M.; Looareesuwan, S. Reduced levels of transforming growth factor-beta1, interleukin-12 and increased migration inhibitory factor are associated with severe malaria. Acta Trop. 2004, 89, 319–327. [Google Scholar] [CrossRef]
  28. Page, M.J.; McKenzie, J.E.; Bossuyt, P.M.; Boutron, I.; Hoffmann, T.C.; Mulrow, C.D.; Shamseer, L.; Tetzlaff, J.M.; Moher, D. Updating guidance for reporting systematic reviews: Development of the PRISMA 2020 statement. J. Clin. Epidemiol. 2021, 134, 103–112. [Google Scholar] [CrossRef] [PubMed]
  29. World Health Organization. WHO Guidelines for Malaria; World Health Organization: Geneva, Switzerland, 2021. [Google Scholar]
  30. von Elm, E.; Altman, D.G.; Egger, M.; Pocock, S.J.; Gotzsche, P.C.; Vandenbroucke, J.P.; Initiative, S. The Strengthening the Reporting of Observational Studies in Epidemiology (STROBE) statement: Guidelines for reporting observational studies. PLoS Med. 2007, 4, e296. [Google Scholar] [CrossRef] [PubMed] [Green Version]
  31. DerSimonian, R.; Kacker, R. Random-effects model for meta-analysis of clinical trials: An update. Contemp. Clin. Trials. 2007, 28, 105–114. [Google Scholar] [CrossRef]
  32. Hozo, S.P.; Djulbegovic, B.; Hozo, I. Estimating the mean and variance from the median, range, and the size of a sample. BMC Med. Res. Methodol. 2005, 5, 13. [Google Scholar] [CrossRef] [PubMed] [Green Version]
  33. Awandare, G.A.; Hittner, J.B.; Kremsner, P.G.; Ochiel, D.O.; Keller, C.C.; Weinberg, J.B.; Clark, I.A.; Perkins, D.J. Decreased circulating macrophage migration inhibitory factor (MIF) protein and blood mononuclear cell MIF transcripts in children with Plasmodium falciparum malaria. Clin. Immunol. 2006, 119, 219–225. [Google Scholar] [CrossRef] [PubMed]
  34. Budiningsih, I.; Dachlan, Y.P.; Hadi, U.; Middeldorp, J.M. Quantitative cytokine level of TNF-α, IFN-γ, IL-10, TGF-β and circulating Epstein-Barr virus DNA load in individuals with acute Malaria due to P. falciparum or P. vivax or double infection in a Malaria endemic region in Indonesia. PLoS ONE 2021, 16, e0261923. [Google Scholar] [CrossRef] [PubMed]
  35. Bwanika, R.; Kato, C.D.; Welishe, J.; Mwandah, D.C. Cytokine profiles among patients co-infected with Plasmodium falciparum malaria and soil borne helminths attending Kampala International University Teaching Hospital, in Uganda. Allergy Asthma Clin. Immunol. 2018, 14, 10. [Google Scholar] [CrossRef]
  36. Hojo-Souza, N.S.; Pereira, D.B.; de Souza, F.S.; de Oliveira Mendes, T.A.; Cardoso, M.S.; Tada, M.S.; Zanini, G.M.; Bartholomeu, D.C.; Fujiwara, R.T.; Bueno, L.L. On the cytokine/chemokine network during Plasmodium vivax malaria: New insights to understand the disease. Malar J. 2017, 16, 42. [Google Scholar] [CrossRef] [Green Version]
  37. Nsubuga, J.; Kato, C.D.; Nanteza, A.; Matovu, E.; Alibu, V.P. Plasma cytokine profiles associated with rhodesiense sleeping sickness and falciparum malaria co-infection in North Eastern Uganda. Allergy Asthma Clin. Immunol. 2019, 15, 63. [Google Scholar] [CrossRef] [PubMed]
  38. Scherer, E.F.; Cantarini, D.G.; Siqueira, R.; Ribeiro, E.B.; Braga, É.M.; Honório-França, A.C.; França, E.L. Cytokine modulation of human blood viscosity from vivax malaria patients. Acta Trop. 2016, 158, 139–147. [Google Scholar] [CrossRef]
  39. Wenisch, C.; Parschalk, B.; Burgmann, H.; Looareesuwan, S.; Graninger, W. Decreased serum levels of TGF-β in patients with acute Plasmodium falciparum malaria. J. Clin. Immunol. 1995, 15, 69–73. [Google Scholar] [CrossRef]
  40. Musumeci, M.; Malaguarnera, L.; Simporè, J.; Messina, A.; Musumeci, S. Modulation of immune response in Plasmodium falciparum malaria: Role of IL-12, IL-18 and TGF-β. Cytokine 2003, 21, 172–178. [Google Scholar] [CrossRef]
  41. Olupot-Olupot, P.; Urban, B.C.; Jemutai, J.; Nteziyaremye, J.; Fanjo, H.M.; Karanja, H.; Karisa, J.; Ongodia, P.; Bwonyo, P.; Gitau, E.N.; et al. Endotoxaemia is common in children with Plasmodium falciparum malaria. BMC Infect. Dis. 2013, 13, 117. [Google Scholar] [CrossRef] [PubMed] [Green Version]
  42. Perkins, D.J.; Weinberg, J.B.; Kremsner, P.G. Reduced interleukin-12 and transforming growth factor-beta1 in severe childhood malaria: Relationship of cytokine balance with disease severity. J. Infect. Dis. 2000, 182, 988–992. [Google Scholar] [CrossRef]
  43. Prakash, D.; Fesel, C.; Jain, R.; Cazenave, P.A.; Mishra, G.C.; Pied, S. Clusters of cytokines determine malaria severity in Plasmodium falciparum-infected patients from endemic areas of central India. J. Infect. Dis. 2006, 194, 198–207. [Google Scholar] [CrossRef] [PubMed]
  44. Okamoto, Y.; Gotoh, Y.; Uemura, O.; Tanaka, S.; Ando, T.; Nishida, M. Age-dependent decrease in serum transforming growth factor (TGF)-beta 1 in healthy Japanese individuals; population study of serum TGF-beta 1 level in Japanese. Dis. Markers 2005, 21, 71–74. [Google Scholar] [CrossRef] [PubMed] [Green Version]
  45. Farrington, L.; Vance, H.; Rek, J.; Prahl, M.; Jagannathan, P.; Katureebe, A.; Arinaitwe, E.; Kamya, M.R.; Dorsey, G.; Feeney, M.E. Both inflammatory and regulatory cytokine responses to malaria are blunted with increasing age in highly exposed children. Malar J. 2017, 16, 499. [Google Scholar] [CrossRef] [PubMed] [Green Version]
  46. Omer, F.M.; Kurtzhals, J.A.; Riley, E.M. Maintaining the immunological balance in parasitic infections: A role for TGF-beta? Parasitol. Today 2000, 16, 18–23. [Google Scholar] [CrossRef]
  47. Mahittikorn, A.; Mala, W.; Srisuphanunt, M.; Masangkay, F.R.; Kotepui, K.U.; Wilairatana, P.; Kotepui, M. Tumour necrosis factor-alpha as a prognostic biomarker of severe malaria: A systematic review and meta-analysis. J. Travel. Med. 2022, 29, taac053. [Google Scholar] [CrossRef]
  48. Diallo, T.O.; Remoue, F.; Schacht, A.M.; Charrier, N.; Dompnier, J.P.; Pillet, S.; Garraud, O.; N’Diaye, A.A.; Capron, A.; Capron, M.; et al. Schistosomiasis co-infection in humans influences inflammatory markers in uncomplicated Plasmodium falciparum malaria. Parasite Immunol. 2004, 26, 365–369. [Google Scholar] [CrossRef] [PubMed]
  49. Walther, M.; Tongren, J.E.; Andrews, L.; Korbel, D.; King, E.; Fletcher, H.; Andersen, R.F.; Bejon, P.; Thompson, F.; Dunachie, S.J.; et al. Upregulation of TGF-beta, FOXP3, and CD4+CD25+ regulatory T cells correlates with more rapid parasite growth in human malaria infection. Immunity 2005, 23, 287–296. [Google Scholar] [CrossRef] [PubMed]
Figure 1. Study flow diagram.
Tropicalmed 07 00299 g001
Figure 2. Funnel plot demonstrating a difference in mean TGF-β levels (pg/mL) in uncomplicated malaria and healthy controls [26,27,33,38,39,40,42]. Grey y-axis line, line of no effect size; blue square boxes, mean TGF-β levels from each study; line on the left and right of blue square boxes, 95% CI; green diamond; overall effect size; I2, H2 and τb2, heterogeneity measures; test of θ, overall effect size. Abbreviation: SD, standard deviation.
Tropicalmed 07 00299 g002
Figure 3. Forest plot demonstrating a difference in mean TGF-β levels (pg/mL) in uncomplicated malaria and healthy controls by continents [26,27,33,38,39,40,42]. Grey y-axis line, line of no effect size; blue square boxes, mean TGF-β levels from each study; line on the left and right of blue square boxes, 95% CI; green diamond; overall effect size; crimson diamond, overall effect size in each subgroup; I2, H2 and τb2, heterogeneity measures.
Tropicalmed 07 00299 g003
Figure 4. Forest plot demonstrating a difference in mean TGF-β levels (pg/mL) in uncomplicated malaria and healthy controls by age groups [26,27,33,38,39,40,42]. Grey y-axis line, line of no effect size; blue square boxes, mean TGF-β levels from each study; line on the left and right of blue square boxes, 95% CI; green diamond; overall effect size; crimson diamond, overall effect size in each subgroup; I2, H2 and τb2, heterogeneity measures.
Tropicalmed 07 00299 g004
Figure 5. Forest plot demonstrating a difference in mean TGF-β levels (pg/mL) in severe and uncomplicated malaria [26,27,40,41,42]. Grey y-axis line, line of no effect size; blue square boxes, mean TGF-β levels from each study; line on the left and right of blue square boxes, 95% CI; green diamond; overall effect size; I2, H2 and τb2, heterogeneity measures; test of θ, overall effect size.
Tropicalmed 07 00299 g005
Figure 6. Sensitivity analysis determining the robustness of the meta-analysis results of the difference in TGF-β levels (pg/mL) between uncomplicated malaria and healthy controls [26,27,33,38,39,40,42].
Tropicalmed 07 00299 g006
Figure 7. Sensitivity analysis determining the robustness of the meta-analysis results of the difference in TGF-β levels (pg/mL) between severe and uncomplicated malaria [26,27,40,41,42].
Tropicalmed 07 00299 g007
Figure 8. Funnel plot demonstrating the MD in TGF-β levels between uncomplicated malaria and healthy controls (pg/mL). The plot shows an asymmetrical distribution of the effect estimates (blue dots) from the middle line (red line). Abbreviations: Mean diff., MD; Estimated θIV, overall effect size.
Tropicalmed 07 00299 g008
Figure 9. Contour-enhanced funnel plot demonstrating the MD in TGF-β levels between uncomplicated malaria and healthy controls (pg/mL) in the significant area (pale grey area), indicating that the cause of funnel plot asymmetry was the publication bias.
Tropicalmed 07 00299 g009
Figure 10. Funnel plot demonstrating the MD in TGF-β levels between severe and uncomplicated malaria (pg/mL). The plot shows an asymmetrical distribution of the effect estimates (blue dots) from the middle line (red line).
Tropicalmed 07 00299 g010
Figure 11. Contour-enhanced funnel plot demonstrating the MD in TGF-β levels between severe and uncomplicated malaria (pg/mL) in the significant area (pale grey area) and non-significant areas (white and dark grey colours), indicating that the cause of funnel plot asymmetry was the heterogeneity of the effect estimates and the publication bias.
Tropicalmed 07 00299 g011
Table 1. Characteristics of the included studies.
Characteristicsn%
Study designs
Prospective observational studies646.2
Case–control studies323.1
Cross-sectional studies323.1
Cohort study17.69
Study areas
Africa753.8
Asia430.8
South America215.4
Plasmodium spp.
P. falciparum1076.9
P. vivax215.4
P. falciparum/P. vivax/mixed infection17.69
Participants
Children646.2
Adults430.8
All age groups323.1
Methods for malaria detection
Microscopy969.2
Microscopy/RDT215.4
Microscopy/PCR215.4
Methods for TGF-β quantification
ELISA1184.6
Bead-based assay215.4
Abbreviations: PCR, polymerase chain reaction; RDT, rapid diagnostic tests.
Publisher’s Note: MDPI stays neutral with regard to jurisdictional claims in published maps and institutional affiliations.

