1. Introduction
Guaranteeing equal access to information and education is one of today’s societies’ imperatives. In particular, with more than 245 million visually impaired people in the world, including 39 million people with no or low vision, there is a need to provide them with better digital tools to access a larger range of educational and informational resources and, in the long term, facilitate social and professional insertion. For example, in terms of education, Beck-Winchatz and Riccobono [
1] commented upon how the inaccessibility of curriculum materials might explain why people with vision impairments do not pursue careers in a number of disciplines, especially in science, technology, engineering and mathematics. The lack of accessible resources can also prevent people with vision impairments from fully engaging in cultural activities such as visits to museums [
2,
3] or with leisure activities such as video games [
4] or board games [
5].
There is a long history of accessible materials for visually impaired students—the earliest materials being documented during the 18th century—with some adaptation techniques still being very commonly used. These traditional techniques result in a large diversity of materials, including tactile graphics, small-scale models, jigsaw puzzles, collage maps, etc. [
6]. Although they are very useful and help people with vision impairments to access material that would otherwise remain inaccessible, they also suffer from several limitations. The main one is the use of Braille labels that take up space and force users to switch back and forth between the tactile document and the Braille key, which disrupts the exploration and reading processes. Another drawback is that some of these materials cannot be accessed independently, i.e., users must rely on a sighted peer (e.g., their teacher) to explore or understand the document.
One way to tackle these issues is to digitally augment these tactile graphics with multimodal interactions [
7]. In fact, with interactivity, Braille labels can be replaced by audio labels, and advanced functionalities can be implemented (e.g., [
8,
9]). Interactive tactile graphics are the most common type of interactive graphics: they most often consist in a tactile graphic that is placed over a touch-screen device that can detect the user’s touch inputs and provides audio and vibratory feedback accordingly. The usefulness and usability of these interactive tactile graphics have been demonstrated in several publications, and they are nowadays used in some education centers [
8,
10] as well as in other contexts such as museums (e.g., [
11]). In parallel, other technologies have been investigated, such as touch-enabled devices that use sounds and vibrations as feedback modalities, refreshable Braille displays [
12] and tangible interfaces, which rely on the use of physical objects to interact with digital content (e.g., [
13,
14]).
Both types of tools (interactive tactile graphics and tangible interfaces) proved to be useful and usable, which led us to reflect upon (i) how to augment tactile graphics with tangible elements to make them updatable and (ii) how to augment tangible interfaces with tactile graphics to make them convey a larger amount of information. This process resulted in the development of the FlexiBoard, a tool that augments tactile graphics with tangible elements, supports a wide range of activities and empowers the visually impaired by providing them with access to graphical information independently.
In this paper, we first review the techniques and tools for the adaptation of graphics, discussing the pros and cons of each approach. We then describe the design process that led us to the development of the FlexiBoard and identify several considerations for the design of tangible and tactile graphics. We illustrate the main features of the FlexiBoard with the Talking Clock, a proof-of-concept app that we developed. We thereafter describe the implementation of the prototype. We then present the results of a brainstorming session that enabled us to explore the application space of the FlexiBoard. Finally, we present a case study illustrating how the system was used in a challenging task, adapting an existing board game into an accessible and multimodal board game that can be played by sighted, low-vision and blind people at the same time.
The main contributions of this article are (1) a detailed description of the design process and solution that could help practitioners and researchers build their own tangible interfaces for a variety of purposes (education, leisure, gaming, etc.); (2) an innovative approach called FlexiBoard to render tactile graphics interactive and tangible; (3) the exploration of the application space of tactile and tangible graphics; (4) a case study illustrating how the FlexiBoard can be used to design multimodal board games accessible to both sighted and visually impaired people.
2. Related Work
In this section, we give an overview of existing techniques for the adaptation of graphics for people with vision impairments. We distinguish between non-interactive and interactive materials. Within this latter category, we focus on interactive tactile graphics and tangible graphics. We use the term “graphic” to refer to any type of representation that is used to convey information using graphical symbols.
2.1. Non-Interactive Graphics
The adaptation of visual graphics for people with vision impairments is a costly and time-consuming process. As a result, tactile graphics are rarely available outside of special education centers. Within these centers, the most common approach is the use of raised-line and thermoformed graphics, i.e., graphics with relief that a visually impaired person can touch. These graphics are “static”, i.e., once they have been created, they cannot be modified or updated. Other materials allow visually impaired users to construct and then reconfigure their own graphics [
13,
15]. For example, during mathematics lessons, students often use a corkboard into which they insert pins that are linked together with rubber bands to create line graphs or geometric shapes [
14]. During orientation and mobility lessons, magnets are often used [
13]: the teacher or the students place them on a magnetic board to quickly build a path or a floor plan. Other techniques include the use of 3D-printed graphics and German film [
6]. The latter is a transparent plastic sheet that must be placed on a rubber mat before being drawn on using a stylus or a pen—when drawing, a raised-line graphic is created that users can immediately feel.
Outside of education centers, similar techniques are being used to make information accessible. For example, inside museums or other public institutions, small-scale models can be used to help users navigate or to present a historical building [
11]. Libraries also provide books printed in Braille. Books can also be enhanced with hand-crafted illustrations made of felt, cardboard, etc. (see “Les doigts qui rêvent” (
https://ldqr.org/ (accessed on 1 December 2023)) for example). Traditional board games can also be made accessible by redesigning the elements of the game using various textures and objects or Braille labels (e.g., in a Braille Monopoly (
https://www.maxiaids.com/braille-and-low-vision-monopoly (accessed on 1 December 2023))). Da Rocha Tomé Filho et al. [
16] reviewed a number of techniques used to make board games accessible, such as enhancing cards with tactile elements, using different shapes and textures, adding Braille labels, changing the size and color of labels, enlarging game components, etc. The Meeple Like Us (
https://www.meeplelikeus.co.uk/ (accessed on 1 December 2023)) project regularly discusses the accessibility of board games to provide general guidelines for the adaptation of games [
5].
The main advantage of static tactile graphics is that they can be used to convey relatively complex information (e.g., a map, a line graph with different series, a board game made of tiles, etc.). However, they cannot be updated, which constrains the range of activities that they can be used for. On the other hand, graphics based on cork and magnetic boards can be updated but they are mainly used to construct simple representations (mainly for mathematics or geometry) and cannot be accessed independently. In fact, the student must be guided to place the pins or magnets, and, because no Braille legend can be provided (as the graphic is constructed dynamically), students cannot retrieve the names of the elements on their own.
2.2. Interactive Graphics
2.2.1. Benefits of Interactivity
Enhancing traditional graphics with interactivity is an efficient way to compensate for their limitations. Firstly, Braille labels can be replaced by audio labels: not only is this beneficial in terms of content—because Braille labels can be removed—but it also facilitates the exploration process as users do not have to switch back and forth between the tactile document and the Braille key. It is also very helpful to make graphics accessible to people with vision impairments who do not read Braille (a large majority).
More generally, interactive graphics can offer a variety of features that can facilitate and enrich the exploration process, such as interacting with the data representation (e.g., panning and zooming), selecting which data to display (e.g., filtering) [
17] or offering additional content when required by the user (e.g., adding details). For example, in educational contexts, interactivity can be used to provide students with timely feedback and explanations. For games, interactivity can be used to enhance the players’ experience with additional sounds or audio-based descriptions of the board and gameplay. Da Rocha Tomé Filho et al. [
16] discussed potential uses of accessible technologies for board games: identify and read aloud game elements as well as computerize some game mechanics (e.g., reading dice). Thevin et al. [
18] show that multimodal interactions can advantageously augment or replace handcrafted adaptations to make board games accessible to players with vision impairments.
2.2.2. Digital Interactive Graphics
There are several ways of making graphics for the visually impaired interactive (see [
7] for a detailed review). One common approach is to display the content on a touch-enabled screen and to provide audio feedback when the user touches graphic elements. This approach has been used for different applications, such as the exploration of maps and diagrams. For example, TouchOverMap [
19] provided a basic overview of a street map displayed on a smartphone, by giving vibrational and vocal feedback when the finger passed over a map element (e.g., streets or buildings). Giudice et al. [
20] combined gestural input with audio and vibrational feedback to support the exploration and understanding of bar charts, or letters.
This approach provides many benefits: for example, the graphics can be instantly updated, and they are very affordable when they rely on tablets or smartphones. However, they also constrain the user to explore the document with one point of contact only (e.g., finger or pointing device), which can make the exploration slow and tedious [
21]. This also constrains the amount of information that can be conveyed as well as the type of information (cf. [
21] for a discussion on cognitive challenges associated with such devices). For example, inferring the orientation of “virtual” lines is a challenging task.
2.2.3. Hybrid Interactive Graphics
Interactive Tactile Graphics
As an alternative, it is possible to create physical interactive graphics. Interactive tactile graphics consist of a tactile document placed above a touch-sensitive surface such as a tablet: students can explore the tactile document, but they can also interact with it, for example by performing double taps to retrieve the names of the elements [
8]. A similar approach relies on a 3D printer to print spatial content “on-the-fly” [
22]. These interactive tactile graphics have been successfully used to support the exploration of maps. For example, Brock et al. [
8] investigated the usability of interactive tactile maps, and so did Weir et al. [
9]. Both studies showed the benefits of using a tactile map to support efficient exploration strategies.
The main advantage of these graphics is that they provide tactile feedback and that they can convey relatively detailed content. However, they are difficult to update and cannot be used for hands-on activities that require users to manipulate, reconfigure or (re)construct a graphic such as a bar chart or a map.
Refreshable Graphics
It is also possible to use self-actuated robots that can move on a flat surface and whose configuration can be used to display various graphical representations. For example, Ducasse et al. [
23] used a fleet of minirobots that could move independently in order to enable people with vision impairment to access panning and zooming functions on maps. Guinness et al. [
24] also used minirobots on a tablet for several proof-of-concept applications such as an interactive clock, a bar chart or a Braille assistant. Although very promising, these solutions are less affordable and limited in terms of content because robots take up space and can only represent points (and not lines or areas). Refreshable displays and shape-changing displays could also be used to make graphics accessible, but at the moment, they remain too expensive [
25].
Tangible Graphics
Tangible interfaces have also been investigated, as they can provide visually impaired users with an access to interactive, physical and updatable information. Tangible graphics are made of a set of objects that are being placed by the users to (re)construct a graph, following audio instructions or feedback. Once the graph is constructed, users can interact with the objects to retrieve their name, thanks to various technologies (e.g., touch-enabled devices or finger tracking using cameras). Besides their updatability, tangible interfaces for visually impaired users are particularly promising for several reasons:
- 1.
As they rely on physical objects, they inherently provide tactile feedback and multiple points of contact. In contrast, interactive graphics that rely on touch-enabled devices usually provide only a single point of contact.
- 2.
They have a strong potential to enhance learning, by making the participants more engaged, fostering collaboration [
26,
27] or supporting learning-by-doing and hands-on activities [
28].
- 3.
They are affordable, especially as compared to braille refreshable displays.
Although the use of tangible interfaces has been less investigated than other approaches, several prototypes have been developed, mostly to support educational activities (mathematics and orientation and mobility). For example, McGookin et al. [
14] used a combination of cubes and straws placed on top of a surface to enable users to explore bar charts and line graphs. Jafri et al. [
29] used interactive 3D objects to teach students spatial concepts (name of geometric shapes, rotation, etc.). Similarly, the tool developed by Manshad et al. relies on a set of cubes that students can move along a surface (following audio instructions) to reconstruct diagrams [
30] or itineraries [
31].
While the previous examples provide tools that can be used for diverse graphical representations (maps, diagrams, charts, etc.), some tangible interfaces are specific to one domain. Sabuncuoglu [
32] designed a set of tangible objects of different shapes that students can place into a dedicated rack: each object represents an instruction (e.g., executing the code), which enables students to create melodies. Similarly, StoryBlocks [
33] enables blind people to learn the basics of programming: tangible blocks can be attached to each other to create instructions to generate audio stories. Baldwin et al. [
34] proposed a tangible interface as an alternative to standard audio-only screen readers. The interface was composed of two stand-alone objects: the first one (the Tangible Taskbar) enabled users to launch/close applications or to switch between them by manipulating tangible icons; the second one (the Tangible Scrollbar) enabled users to navigate web pages by scrolling and clicking on navigable elements.
McGookin et al. [
14] proposed four guidelines for the design of tangible interfaces for visually impaired users: (1) tangible objects should be physically stable; (2) tangible objects should have irregular forms; (3) participants should be aware of the tangible objects’ status (e.g., when a tangible object is misplaced or is not detected by the system); (4) functionality should be appropriately divided. This fourth guideline refers to the notion of “division of functionality”, which can help designers decide how to make a graphic tangible. Based on previous work, the authors made the distinction between three types of data: data that are fixed, which must be rendered with objects that cannot be moved; data that are frequently and directly changed by the user, which must be rendered with objects that can be moved; data that are frequently and indirectly changed by the user, which must be rendered with intangible representations.
One important point to consider is that because tangible displays rely on physical objects, they cannot convey a lot of information. To compensate for the lack of visual feedback and increase the expressiveness of the tangible representation, different solutions have been proposed. For example, Ducasse et al. [
13] proposed to use retractable strings to represent lines in addition to points. The Digitizer Auditory Graph [
35] relied on tangible lines that were built with Wikki Stix while the Tangible Itinerary prototype used rectangular tangible objects of varying lengths. The Invisible Tangible Geometry [
36] supports the construction of length-adjustable lines, using narrow rods that can be inserted inside wider rods. McGookin et al. used a grid made out of straws to represent a Cartesian plan [
14].
2.3. Towards Interactive Graphics That Are Both Tactile and Tangible
Although interactive tactile graphics and tangible graphics have been studied separately, their combination could address their respective limitations. On the one hand, the amount of information conveyed by tangible graphics could be increased if, according to the “division of functionality” principle, some pieces of information were displayed on tactile graphics and others with tangible objects. On the other hand, the lack of updatability of tactile graphics could be balanced by the use of movable physical objects, leading to a more diverse range of supported tasks and educational learning activities.
Interestingly, the use of tangible objects on top of a tactile graphic has been successfully investigated in [
10]. A set of fourteen tangible objects was provided. Some represented a car, a monument, a flag, etc.; others could be filled with scents, such as olive oil or honey. The children’s impressions were very positive. However, they could not use several objects simultaneously. Also, in parallel with the development of the FlexiBoard, Suzuki et al. [
37] proposed a solution for the design of tangible, tactile and self-updatable graphics for visually impaired users, called FluxMarker. It uses movable magnetic tactile markers that are moved by electromagnetic coil arrays. FluxMarker enables visually impaired users to annotate graphics and can be useful for finding locations on a map, analyzing data, guiding users when drawing, etc. We discuss in more detail in
Section 7 how the FlexiBoard and FluxMarker differ from and complement each other.
To efficiently combine tangible and tactile graphics, some aspects of the design should be carefully considered. For example, using too many tangible objects could result in a cluttered surface and could hinder users’ hand movements required to explore the tactile graphic. Similarly, techniques used to ensure the stability of the objects could also hinder the readability of tactile graphics, e.g., if the objects take up too much space. On the other hand, tactile graphics could impose too many restrictions on the tangible objects. Therefore, the usability of such a device is dependent on thoughtful design choices informed by experts or users as well as an appropriate “division of functionality”. In
Section 6, we explain in detail how a participatory design approach enabled us to take into account the characteristics of the tangible and tactile components to design an accessible board game.
3. Design Process and Rationale
The FlexiBoard is the result of a long design process that built on existing work as well as discussions with special education teachers, tactile graphics specialists and people with vision impairments. Each of these sources of information provided different insights for the design of the system. In this section, we document this design process and describe the design and technical requirements that were gradually identified.
3.1. Insights Gained from Observations and Discussions at the Special Education Center
Our research group is working closely with a special education center. As we explained in
Section 2.1, education centers are of particular interest because of the diversity of learning materials that they produce using the same tools and methods as other non-educational institutions (centers for adaptation of books, museums, etc.). Hence, insights gained from observations and discussions at education centers are also relevant to other contexts.
The special education center we work with has accommodated visually impaired people from early childhood to adulthood since 1866. A multidisciplinary team of teachers, educators, re-educators and care personnel currently provides support to around 150–200 people with vision impairments. This center focuses on the evolution of tools (including new technologies) and practices, such as inclusion, to provide the best possible care.
Throughout the years, we conducted several observation sessions, and we very frequently discussed with teachers, tactile document makers, students, people with vision impairments, etc. Recurrent issues concerning the use of tactile graphics were reported. The first one concerned the time needed to make tactile graphics. In the special education center that we collaborate with, four people are fully devoted to this task and create about 400–600 documents per year.
Another recurrent issue was the fact that tactile graphics are static, which limits the range of activities that they can be used for. Similar observations were made by Suzuki et al. [
37], who conducted a formative evaluation and concluded “a static tactile graphic lacks the ability to represent changes and can be overly complex, whereas a dynamic tactile graphic is costly and too small”.
Another recurrent point raised by the teachers was related to the notion of “bi-graphism”. Tactile diagrams are intended to be read by visually impaired users, each of whom being able to perceive visual elements and/or colors depending on their visual capacities. For users with low vision, it is important for the graphic to be tactile but also visual to take full advantage of remaining visual capacities. Another advantage of making visual and tactile graphics is that they can be used together by a visually impaired and a sighted user (e.g., a sighted teacher and a blind student). In addition, as discussed earlier, different types of tactile graphics exist and can be particularly suited for one topic (e.g., German film and mathematics). When building the first prototype, we therefore aimed to design a system that should be usable with different types of graphics and by people with different visual abilities. This concept of “bi-graphism” also motivated us to develop an application that could support collaboration between sighted and visually impaired users, which we present as a case study (development of an accessible board game,
Section 6).
3.2. First Low-Fidelity Prototype
During the initial phase of the design of the FlexiBoard, we started to investigate how tangible objects could be used in combination with a tactile graphic. The goal of this initial phase was threefold: (i) validate the technical feasibility of combining tangible and tactile graphics; (ii) confirm that combining tangible and tactile graphics could lead to new uses regarding access to graphical content; (iii) develop proof-of-concept applications to demonstrate technical feasibility and potential uses.
3.2.1. Design Considerations for the Use of Tangible Objects
The stability of the tangible objects is essential when designing TUIs for visually impaired users, so that they can feel free to explore and interact with the graphic without being afraid of knocking the objects over [
13,
14]. In [
14], the objects were weighted and could be placed onto a grid, which further increased their stability. In [
13], a novel type of objects were designed, named Tangible Reels. They were composed of a sucker pad or a cylinder filled with lead. Although both types were stable, these objects were relatively large, which resulted in a quite bulky prototype. The markers used with FluxMarker [
37] were magnets in contact with the tactile graphics, the level of which was sometimes insufficient to maintain the objects in place.
Inspired by existing techniques (the use of magnets to draw itineraries), we further explored the idea of using magnets. The tangible objects that we designed were made of two magnets: one was placed above the graphic and could be manipulated by the user; the other was magnetically linked to the first one, on the other side of the interaction surface, i.e., below the graphic (
Figure 1A,B). Whenever the user moved the upper magnet, the lower magnet moved with it. Although one could use a magnetic board and magnets only, it would require the objects to be tracked using a camera placed above the graphic, which could result in lighting and occlusion issues.
The main advantage of these objects is that they are very stable. In addition, they are low-cost (the magnets we used cost EUR 0.30 each) and very easy to assemble. In addition, if carefully chosen, the magnets can be used with graphics of different thicknesses such as regular paper or raised-line graphics. The main drawback is that once an object is placed on the table, it cannot be lifted and must be slid over the surface to stay connected with its paired magnet. Although this obviously restricts the design space of interaction, it ensures the stability of the tangible representation while making it possible to easily move the objects. We explored the usability of such tangible objects through the design of a first low-fidelity prototype.
3.2.2. Description of the Prototype and Development of Two Applications
This first prototype was similar to a table lectern: it was composed of a wooden frame, a tactile graphic and several tangible objects (
Figure 1C). A camera was placed behind the tactile graphic to track the objects and provide appropriate feedback. This prototype was first presented to a blind colleague, who validated the concept.
In order to further demonstrate the feasibility and to start exploring potential uses, two applications were developed. The first one aimed at helping visually impaired users to learn the location of major cities in a country (
Figure 1C). The application asked the users to move one tangible object over one city and then provided vocal feedback whenever the object was correctly placed. This application was inspired by [
13] and a workshop that we conducted with visually impaired students: the pedagogical scenario (constructing and exploring a geographical map) was defined in collaboration with a teacher from the education center. The second application enabled users to retrieve different pieces of information depending on the objects that they placed over one landmark of a tactile map. For example, if a rectangular object was placed on top of a city, the name of the administrative region was given; if a circular object was used, the name of the city was given. This application was inspired by [
10] which enabled users to access different categories of content. Building on [
13], we also investigated whether retractable reels could be used on top of tactile graphics to display line graphs, bar charts, etc. (
Figure 1D).
3.2.3. Interview with a Specialized Math Teacher
In order to get some feedback about the prototype and the idea of combining tactile graphics with tangible objects, we interviewed one mathematics teacher with more than 10 years of experience in teaching. Indeed, the prototype and the applications were not yet usable with young people with vision impairment. Due to the limited availability of practitioners, we also decided to interview one teacher only and to contact others when a more advanced version of the prototype would be ready (see
Section 5).
We showed the teacher the initial prototype and asked him to comment on it. We also showed him some videos illustrating how the two applications worked. The teacher gave positive feedback: he appreciated the fact that students could interact with the FlexiBoard on their own; he highlighted that providing timely feedback opened up perspectives for the design of educational activities; he valued the fact that the FlexiBoard could be used with different types of tactile graphics and was satisfied with the design of the tangible objects. He imagined different examples of usage scenarios that illustrated these features:
The student is guided to reproduce a graph presented in a textbook, using vocal instructions (e.g., “go left, go right”) and can thereafter answer the set of questions concerning the graph.
A raised-line Cartesian frame of reference is placed on the surface and students are asked to place tangible objects at specific coordinates (e.g., ). Depending on the level of complexity, students can be (partially) guided or not guided at all, and feedback is provided if the objects are incorrectly placed (e.g., “x must be positive”). Then, students can check their answer with the system and if the tangible objects are incorrectly placed, try again.
The system helps the student to draw lines of different lengths and orientations on a sheet of German paper, by providing verbal instructions (e.g., “draw a point”, “put your rule with the 0 below the point”, etc.). At the end of the session, the student can take the sheet home or hand it in to the teacher.
3.2.4. Design Outcomes/Requirements
Overall, this first prototype was used to start exploring the application space and showed that the system could indeed support several types of tactile graphics (i.e., raised-line graphics and German sheets). The scenarios proposed by the teacher also confirmed that the system should support audio feedback and should enable students to interact with the system; for example, to select the level of complexity or to switch between different applications. Finally, the system should be able to support different tasks (e.g., construction vs. exploration). Consequently, the second usage scenario proposed by the teacher was implemented, and the prototype was improved.
3.3. Second Prototype: The FlexiBoard
For the design of the second prototype, we considered additional factors (portability, ease of setup and scalability). During this step, we were assisted by an R&D engineer working for the special education center and worked together with a blind colleague. The R&D engineer oversaw the knowledge transfer between the research center and the education center and was therefore closely working with practitioners. We also received feedback during weekly meetings with the research group to discuss technical issues and regular project progress meetings with the teachers.
The resulting prototype is shown in
Figure 2.
3.3.1. Technical Considerations
At that point, the requirements for the system were the following:
The system should be low-cost or at least affordable.
The system should be portable and easy to set up.
The object tracking should be able to detect multiple objects simultaneously.
The object tracking should be compliant with the use of magnets.
The object tracking should not be affected by users’ hand occluding the objects.
These requirements were identified based on the observations that we conducted at the education center and from the literature. The questions of affordability, portability and ease of setup arose during the design sessions and discussions, which showed that these aspects were crucial to ensure the tools would be used outside of the research lab. In addition, at the education center, each teacher occupies his/her own classroom. Therefore, unless there is a dedicated room for such a prototype, portability is essential to ensure that several teachers can use the prototype inside their own classroom.
The importance of being able to detect multiple objects simultaneously was illustrated in various prototypes in the literature (e.g., [
13,
32,
33]) and was later confirmed by our interview with the mathematics teacher who imagined scenarios with multiple objects. We tried various ways to manipulate objects on top of tactile graphics, and we confirmed that the object tracking was compliant with the use of magnets. We also noted that it was important to continue tracking objects even if users’ hands occluded them. This observation was confirmed by the literature. Indeed, ref. [
28] highlighted the importance of providing timely feedback regarding the status of the system in a tangible interface, and ref. [
23] mentioned that interruptions of object tracking sometimes led to a delay in the delivery of feedback, which could affect the user experience.
Accurate Object Tracking
Placing a camera above the surface to track objects and/or fingers may result in occlusions that the user is not aware of, especially when the system is intended to be used by blind users. Different tracking technologies exist for tangible interfaces. Camera-based setups are usually affordable: the camera is often placed below (e.g., [
38]) or above the surface (e.g., [
27]) but can also be placed on its side [
39]. However, in these last two cases, the field of view of the camera can be occluded by the user’s hands and/or heads. Placing a camera below the surface often results in bulky setups as their height must be adapted to the projector throw and/or to the camera’s focal length [
40]. Nevertheless, it is possible to limit the height of the setup using a set of mirrors. In all cases, systems that rely on computer vision algorithms are usually dependent on lighting conditions and may consequently be difficult to calibrate. Other approaches include interactive tabletops composed of several cameras or RFID antennas [
41], which are expensive. Multitouch-screens are an interesting alternative but do not natively support object tracking; therefore, dedicated tangible objects must be designed (e.g., [
42]), which are usually relatively large. Moreover, in that case, it is impossible to use magnets to ensure the stability of the objects. Similarly, passive magnets can be used on top of a touch-screen, but the issue of stability remains. The technology used for the FluxMarker [
37] is very promising, but at the time of the study, it did not support the tracking of objects.
We found that the use of a wide-angle camera placed below the surface was a good option: it does not require the system to be too high, and it remains a low-cost solution while being compliant with the use of magnets. In fact, by affixing a tag under the lower magnet, a camera placed below the tabletop can track it and indirectly track the upper magnet.
To further ensure the portability of the system, we decided to connect the camera to a Raspberry Pi, which is a small, lightweight and affordable single-board computer. This makes it possible to embed it together with the other pieces of hardware into a single self-contained box (see
Figure 2 and
Figure 3).
Making the System Easy to Set Up
Another important point was designing an easy-to-set-up system. This is mandatory if the system is to be used by different teachers and in different classrooms, or by people with vision impairments independently. To fulfill this criterion, the camera was sealed in the box; hence, the calibration parameters are always the same. In addition, to avoid any issues with lighting conditions, the box is opaque, and a LED string light was placed inside the box (see
Figure 3). This ensures that the entire surface is evenly and sufficiently illuminated, which facilitates object tracking. Altogether, this makes the FlexiBoard easy to install and store. In fact, to set it up, it is enough to plug it in, and wait for the Raspberry Pi to boot up.
Supporting Different Topics, Activities and Users
As mentioned earlier, we aimed to design a system that could use different materials, including regular paper (for low-vision users) and different types of tactile graphics. To do so, we built a fastening system that enables users to work with tactile graphics of different thicknesses. The system can be used with a large range of materials such as thermoformed tactile graphics, German film, thin 3D-printed graphics or regular paper. In order to support various activities that may rely on audio feedback and that may require users to switch between different applications (or different learning activities and questions), the system is also composed of one speaker and one numeric keypad. Finally, we included one USB port and one HDMI port in case the system should be used with a microphone or a screen. This is compliant with the idea of making the system useful for users with different visual capacities.
3.3.2. Proof of Concept: The Talking Clock
Once the prototype was built, we developed a proof-of-concept application that we used to communicate on the project and to elicit ideas for other applications (see
Section 5 and
Section 6). We chose the Talking Clock for several reasons. Firstly, the mathematics teacher had limited time to spend on the project and we wanted to develop a more generic application. Secondly, learning how to tell time is a standard activity that is part of the curriculum for children with VI. Teachers at the education center mainly conduct this activity using a wooden clock (the hands of which can be manipulated), which appeared to be an interesting tool to adapt relying on the FlexiBoard to make it interactive. Finally, telling time is cross-cutting knowledge. Therefore, the Talking Clock could illustrate the generic and various features of the FlexiBoard.
The tactile graphic and the tangible objects used for the Talking Clock are shown in
Figure 2. The Talking Clock application supports two types of exercises: in the first case, the system reads aloud the time, and the user must move the clock hands accordingly (the user can press one key to get feedback about the clock hands’ positions); in the second case, the user moves the clock hands and the system reads the time aloud. Three additional objects can be used to interact with three menus: the first menu enables users to switch between a.m. and p.m. times; the second, to switch between French and English; the third, to switch between digital and analog ways of telling time.
The Talking Clock showcased various features of the FlexiBoard: (1) the use of stable tangible objects over raised-line graphics with Braille labels; (2) the use of objects to represent information (clock hands) or to interact with menus; (3) the manipulation of objects to receive immediate feedback; (4) the customization of objects for the purpose of the app (in that case, 3D-printed hands were attached to the objects). Hence, the Talking Clock illustrated how the FlexiBoard could be used to enhance tactile graphics with tangible objects. In
Section 5 and
Section 6, we illustrate how this approach proved to be relevant for educational purposes as well as for the design of an accessible board game.
4. Implementation
In this section, we describe both the hardware and software of the FlexiBoard.
4.1. Hardware
4.1.1. Tangible Objects
Each tangible object is composed of two neodymium circular magnets, 8 mm in diameter, 4 mm high and with a magnetic strength of ∼2 kg. The 3D-printed hats were made with an Ultimaker 2+ printer. One issue with the use of paired magnets is that if the user lifts the upper magnet, the lower magnet falls in the box. To prevent this from happening, a magnetic sheet was glued under the surface: therefore, even if an upper magnet is removed, the corresponding lower magnet is held by the magnetic sheet. In addition, to prevent two magnets under the surface from sticking to each other, each lower magnet was embedded into a 3D-printed circular object, 25 mm in diameter and 7 mm high.
4.1.2. Box
To ensure the strength, lightness and affordability of the FlexiBoard, the box was made out of a 1 mm thick aluminum plate. The FlexiBoard is composed of two parts, the base and the lid, making it possible to easily access the elements inside the box for maintenance purposes. The lid is composed of two slots, for the speaker and the numeric keypad. On one side of the box, notches allow access to the USB and HDMI ports. Overall, the FlexiBoard is 60 cm long, 35 cm wide and 21 cm high.
4.1.3. Inside and on Top of the Box
A circular speaker was placed on top of the box, as well as a numeric keyboard. Inside the box, the following elements were placed (
Figure 3, left): (a) a Raspberry PI into which the PiCamera, keyboard and router were plugged, as well as two USB extenders and one HDMI/VGA extender; (b) a PiCamera (fisheye lens—FOV 170°); (c) a WiFi router; (d) a LED string light. Several supports were 3D-printed to hold the components in place (
Figure 3, right).
4.1.4. Fastening System
The fastening system was designed to maintain documents of different sizes and thicknesses. It is composed of eight holding elements placed at the periphery of the interactive surface (
Figure 2d). These elements are composed of a screw that holds in place a spring-loaded metal plate that applies pressure on the support. To change the support, all elements are lifted off and rotated; once the support is in place, the four appropriate elements are rotated to hold it.
4.2. Software
Because the PiCamera is a wide-angle camera, there is a fisheye distortion in the image. To correct the image, the intrinsic and extrinsic parameters of the camera were first computed using Python, OpenCV library and other libraries like MyPiVideoStream (for the Raspberry Pi camera), FishEye and ShapeDetection. Due to these rectifications, the efficient resolution was limited and was not enough to track fiducials. We therefore chose to track tags of different colors, taking advantage of the fact that the inside of the box was evenly illuminated by the LEDs and was not sensitive to external lighting conditions. Audio feedback was provided with the Pico TTS engine and the Pico2Wave library. Applications were developed with Python.
5. Exploration of the Application Space
In order to gain a more comprehensive overview of which applications would be worth developing, we conducted a participatory design session with specialized teachers. In this section, we report the main findings of this session.
5.1. Objectives
The first prototype was used to start exploring the application space of the FlexiBoard with one teacher. Yet, we wanted to provide other professionals with the opportunity to reflect upon how they could use the FlexiBoard. The aim was twofold: (1) to identify potential applications for future development; (2) to better understand the type of activities that teachers would like to offer to their students, and what the benefits of using tangible and tactile graphics would be in those cases.
5.2. Procedure and Participants
We invited four (two females and two males) teachers to participate in a one-hour focus-group session. They were between 35 and 50 years old. They all had between 10 and 20 years of experience teaching students with vision impairment. One teacher (T1) was exclusively working with primary school children and taught all topics. The three other participants (T2, T3 and T4) were working with high school students: T2 and T3 mainly taught mathematics; T4 taught English. At the beginning of the session, we explained how the FlexiBoard works and what types of materials can be used. We then presented the Talking Clock. Although T1 showed us the wooden clock that inspired the Talking Clock, she was not involved in the design of the Talking Clock and had not seen the prototype before the focus group.
After playing with this application, teachers were given 15 min to come up with various educational activities with the FlexiBoard, individually. In the second part of the session, teachers were asked to describe their ideas to the other participants, who were free to comment or to suggest new activities.
5.3. Summary of Proposed Activities with the FlexiBoard
In this section, we provide a summary of the proposed activities. A full description of the scenarios is given in
Appendix A.
5.3.1. Topics
The middle school teachers initially focused on their main teaching subject: T2 and T3 proposed several activities related to mathematics (and more precisely to trigonometry and Thales’ theorem), and T4 proposed one activity to help students discover and learn the boroughs of New York. The primary school teacher covered a larger range of subjects, including mathematics (algebra, graphs, metric units of mass, length, volume, etc.), geometry, history, geography and biology. Other participants found these ideas relevant, although they were not directly related to their own topic, and thereafter proposed additional ideas or improvements.
5.3.2. Scenarios
Two large categories of scenarios were proposed. Some relied on the use of a single tangible object that stood as a cursor and that students could move above the graphical representation to explore its different parts (e.g., the boroughs of New York, the chambers of the heart). The student could move the tangible object freely or could be guided to follow a route, to trace the flow of blood, etc. The student could also be asked to follow a particular path and audio feedback was given if the student moved in the wrong direction (different types of guidance techniques were envisaged, based on more or less detailed verbal instructions or on sounds).
Other scenarios mainly relied on several tangible objects that represented a token that the student had to put at the right location (e.g., a city on a map, a historical figure on a timeline, an organ on a body part chart, a point in the Cartesian plane). In that case, the system asked the students to place a particular object and indicated whether the object was correctly placed or not. Once again, different levels of feedback were envisioned, depending on how “good” the answer was or on the student’s age or abilities.
5.3.3. Other Comments
All teachers planned to customize the tangible objects, although this feature had not been described in detail during the introduction of the session (the 3D-printed hands for the clock were shown but the tangible objects for the menus were very simple and were all similar). For example, T4 envisaged using a mini yellow cab for his activity on the boroughs of New York; T3 suggested fixing Braille numbers on top of the tangible objects; T1 proposed to 3D-print customized “hats” that would help students recognize historical figures.
In addition, three out of the four teachers spontaneously mentioned how physically moving objects could help students memorize their location, thanks to proprioceptive feedback provided by the physical displacement of the tangible objects. They also appreciated the possibility of placing several objects on a graphic before asking for the system to check the representation, because the system could then give feedback on the correctness of the whole configuration instead of providing feedback about a single element.
5.4. Type of Activities
Based on the discussions with the teachers, we identified several types of activities that included (the list is not exhaustive):
Exploratory activity: the aim of the activity is to let the student freely explore an existing representation by “carrying out manipulations or experiments and observing the results” [
43].
Expressive activity: the aim of the activity is to let the student “create an external representation of a domain, often on their own ideas and understanding” [
43].
Customization: the aim of the activity is to enable the student to customize an existing map or diagram, by editing or annotating it.
Trial and error activity: In this type of activity, the student is asked to do something (e.g., move a tangible object to its right location). If it is not done properly, feedback is given and the student must repeat the procedure (until the task is correctly performed, or until the number of possible attempts is reached, etc.).
Evaluation: In this type of activity, the student is again asked to do something, but the system does not indicate whether the student is doing well or not. This type of activity can be useful for self-assessment, homework or tests.
6. Case Study: Design of a Tangible and Tactile Board Game
As illustrated in the previous sections, the FlexiBoard can be used to render various graphics interactive (maps, clocks, timelines, etc.). Although instructional materials are important, we previously discussed (
Section 2—Related Work) how issues encountered when creating accessible material are shared across a variety of domains (adaption of books, design of communication tools for museums, etc.). Board games also fall into the range of devices that must be adapted in order to be accessible and that could benefit from interactive features.
6.1. Context
At that time, a project was launched in collaboration with Accessijeux, a not-for-profit association which aims to improve the accessibility of board games for people with vision impairments. From a research perspective, this collaboration aimed to investigate how different feedback and interaction techniques could support and foster collaboration (and cooperation) between players with different visual abilities, but also to investigate whether augmenting a traditional game with interactive features could enhance user experience. As such, the FlexiBoard appeared to present several advantages and was chosen as the supporting device for the development of the game. In this section, we highlight how the different characteristics of the FlexiBoard system enabled the design of a cooperative multimodal game for visually impaired and sighted players.
6.2. Description of the Game
The chosen game is called “Little Red Riding Hood” from Purple Brain Editions. It is not only a collaborative game, but also a cooperative game, meaning that the players must decide together which action to take to win. In its original version (for sighted players), the game is composed of several elements (see
Figure 4):
Two pawns: one standing for Little Red Riding Hood, the other standing for the wolf;
One board onto which a path made of about thirty squares is drawn;
A miniboard representing a basket;
Thirteen picking tokens showing on the verso either a flower or a stone;
Thirteen cards numbered from 1 to 13 and indicating how many picking tokens must be placed inside the basket;
Three finish tiles showing a part of the path and one finish tile showing the grandmother’s house;
Two Joker tokens showing a piece of cake and a slab of butter.
The goal of the game is for Little Red Riding Hood to reach her grandmother’s house before the wolf. On every turn, the players can choose to draw a new card. If the number displayed on the card is inferior to the number of cards already drawn, the wolf moves forward and the basket is emptied; otherwise, players put the number of picking tokens indicated by the card on the basket board. Players can also choose to reveal the number of flowers inside the basket by turning the picking tokens upside down. In that case, the Little Red Riding Hood moves forward (one flower = one square), and the wolf moves one square forward.
6.3. Method
The design of the game involved several steps (see
Figure 5). Firstly, an online questionnaire was sent to better understand how people play (how often, with whom, what games, etc.). Then, three focus groups were conducted. These focus groups aimed (1)to gather feedback on three aspects of games (the rules, the visual aesthetic of the game, the tactile feedback); (2) to better understand what people’s expectations are when playing by asking them to sort UX cards; (3) to get feedback about one prototype. Then, qualitative and quantitative measures were collected through the observation of one game with four players (see
Figure 6). Each step involved sighted, low-vision and blind participants, and the initial prototype was gradually improved through these different steps.
Figure 5 summarizes the different steps and the number of people involved.
6.4. Online Questionnaire and Focus Groups: Main Findings
Table 1 and
Table 2 summarize the main findings of the questionnaire and the focus groups. The questionnaire was answered by 63 sighted users (S), 16 low-vision users (LV) and 46 blind users (B). The average age of the respondents was
(
) for sighted users,
(
) for low-vision users and
(
) for blind users.
Overall, conviviality was an aspect of the games rated as important by the three groups of users. Blind users were more interested in strategic games and sighted users by the fun factor of games. Regarding the types of games, blind and sighted users favored board games whereas low-vision users mainly preferred card games.
Three focus groups were organized. Overall, they involved five sighted users, three low-vision users and five blind users.
The focus groups with users showed that sighted users prefer to learn the rules of a game by reading them whereas low-vision and blind users prefer more diverse ways of learning the rules (listening to them or browsing through an HTML version of the rules). As expected, visual elements were moderately important to low-vision users, although contrasted colors could help during play. Tactile elements were essential to blind users as they are mandatory in-game adaptation.
During the focus groups, participants were also asked to rate different UX cards.
Figure 7 illustrates that “pleasure and stimulation” were the most valued qualities of a game for the sighted and blind participants, and that blind participants also valued the ability to play a game independently.
6.5. Towards a Multimodal Accessible Game
6.5.1. Adapting Game Mechanics
One important step was to decide which elements of the game should be made tangible, tactile and/or interactive, while considering the original game, the rules and the current technical limitations of the FlexiBoard. Because at the time, the device could only track seven tangible objects, the following decisions were made:
The two pawns were kept and tracked by the device because they were the most important elements of the game.
The basket board was replaced by a 3D-printed basket, which was tracked by the system too. Players could interact with it to decide to reveal the number of picking tokens showing a flower.
The physical cards were replaced by digital cards only. However, by moving one dedicated tangible object along different cases, the users could select the first card, the second card, etc., and the system described the card. In that way, the cards were accessible to everyone. In addition, because the number of cards that have been drawn is an important piece of information in the game, everyone could infer that number by touching or looking at that object.
The physical picking tokens were kept, but they were not tracked by the system and they were all similar. Therefore, users could still move the tokens from the “draw” pile to the basket, which was similar to the original game. However, instead of turning the tokens upside down to count the number of stones, the system gave that information using audio feedback when the users interacted with the basket.
The four finish tiles were replaced by 3D-printed houses; the system randomly assigned the grandmother’s house to one of the house’s positions.
The two Joker tokens were replaced by one object that could be moved in two different cases (one for the cake, the other for the slab of butter).
In addition, one tangible object was used to enable users to draw a new card. To reveal the content of the basket or to draw a new card, users had to move the basket or the tangible object back and forth within a dedicated space. During the game, different sounds were played when the players performed a particular action, and audio feedback was provided.
Overall, several transformations were made: some elements were changed (from physical to digital or from physical only to physical and digital); others remained similar; others were added to enable users to interact with the system. In the end, these transformations enabled users to play the game without altering the rules of the original game.
6.5.2. Adapting the Game Elements: Board, Tokens and Pawns
To be accessible to sighted, low-vision and blind people, the elements of the game were carefully designed. This was possible because the FlexiBoard supports a large range of materials, and also because the tangible objects can be easily customized.
Design of the Board
For the first iterations of the design process, the board was printed on swell paper, and in black and white (
Figure 8 left). Thereafter, a number of different boards were designed to support a larger variety of tactile textures (for blind users) but also different colors (especially for low-vision users). At the end, the board was made out of a thin wooden laser-cut board (
Figure 8 right). The different squares were engraved, making it easier for the players to know where and how to move the pawns and the tangible objects that trigger specific actions. The squares for the wolf’s path and the Little Red Riding Hood’s path were made with different tactile textures. In addition, the edges of the wolf’s path were not straight but curved, to further help users distinguish it. Yellow stickers surrounded the paths to make them more visible. Finally, additional illustrations from the original game were added; they were edited to present a black outline and make it easier for low-vision players to identify them.
Design of the Tangible Objects
A first set of tangible objects were made out of paper or 3D-printed. Those were gradually improved to make them easy to identify and pleasant to touch and watch, using a variety of shapes, colors and textures. All tangible objects were 3D-printed and painted with contrasted colors. In addition, different textiles were used, such as felt for the Little Red Riding Hood and a furry-like tissue for the wolf. Each tangible object had its own shape, as recommended by McGookin et al. [
14] and suggested by one participant: for example, the tangible object used to draw cards looked like a flower whereas the tangible object used to select a card looked like a mushroom. During the focus groups, participants gave positive feedback, notably concerning the size of the objects, their shape, texture and stability.
6.5.3. Adapting the Rules’ Format
The questionnaire highlighted the need to render the rules accessible. During the first focus group, different types of rules of one game were presented to the participants: paper-based rules; audio rules played at the beginning of the game only; audio rules gradually given as the game goes along; audio rules presented as a tutorial. The third type (audio rules gradually given) was the preferred one and was therefore implemented.
At the very beginning of the game, and as suggested by one participant, the different elements of the game were described, and players were invited to touch and explore the different tangible objects. During the game, whenever a new explanation had to be given, a particular sound was played. Using the numeric keypad, players could decide to start or repeat the explanation.
6.6. Evaluation of the Game Adapted with the FlexiBoard
6.6.1. Procedure
One game was organized with two blind users and two sighted users. The game was videorecorded, and all actions and comments made by the participants were transcribed for later analysis.
6.6.2. Observations and Results
Distribution of Actions and Verbal Interactions among Participants
Table 3 shows the number of words pronounced by each participant, as well as the number of actions performed:
Interestingly, the two blind participants were more verbally active than the two sighted participants, suggesting that the game was sufficiently accessible. In addition, although P1 performed a larger number of actions than the others, all participants interacted with the game and all participants interacted with different areas of the board games. This suggested that the different elements of the game were accessible both to the blind and sighted players, and that the size of the board game was good enough to enable players to reach all the areas.
Analysis of Participants’ Words
The analysis of participants’ words showed that at the beginning of the game, the blind participants helped each other to identify and localize the different elements of the game. Then, the sighted players also helped them to localize the elements with spatial indications (e.g., “I think that you should move back the pawn a little bit”). Also, participants intervened verbally 20 times to indicate that they were performing an action (e.g., “I’m doing it!”) or to ask someone to do it (e.g., “Are you moving it?”). They also used 41 verbal cues to inform the other players that they were performing an action (e.g., “Ok!”, “Hop!”).
AttrakDiff Questionnaire
Table 4 shows the results of the AttrakDiff questionnaire (only relevant items were presented to the participants). Participants found the game simple, creative, pleasant and rather captivating. They also valued the aesthetics of the game (“attractive”) as well as its social dimensions (“integrative” and “brings me closer” items). However, the blind participants did not find the game as practical as the sighted users: they reported they would have appreciated tangible cards instead of virtual ones.
7. Discussion
The design process of the adapted board game focused on three aspects: (1) adapting the game mechanics without changing the rules; (2) designing multimodal game elements; and (3) adapting the rules’ format. Interestingly, we observed that the proposed adaptation triggered collaborative behaviors between sighted and blind participants. Blind players performed even more actions than sighted players.
Making the game interactive was a key factor in ensuring accessibility: audio feedback and instructions enabled players to understand the current state of the game and to retrieve specific information that was otherwise inaccessible (e.g., the number of picking tokens indicated on each card). In addition, thanks to the flexibility of the system, we were able to design a board that provided tactile and visual feedback. Similarly, we built on the ability to customize the tangible objects to design physical elements that could be equally understood and identified by the sighted, low-vision and blind users. The numeric keypad and the speaker were particularly useful to enable users to listen to the different explanations given by the system.
Two aspects were particularly important for the design of the game. Firstly, we carefully chose which elements of the game and which game mechanics should be provided using tactile, visual, audio or tangible elements, by taking into account various users but also by considering the technical limitations of the FlexiBoard. For example, given the limited number of tangible objects, we could not keep all the cards physical. However, the pawns, which are the most important elements of the game, were represented using tangible objects and enhanced with different textures and colors. This follows the principles of “division of functionality” that we presented above (section Related Work). In our case, listing all elements of the game (objects, rules, mechanics) proved to be an essential step for the design of the game. Secondly, we followed a user-centered design approach, which included the design of various prototypes (low- and high-fidelity) as well as the use of personas (based on the online questionnaire) and focus groups. We would recommend a similar approach for the design of accessible board games.
In a recent article (not available at the time of the development of our game), da Rocha Tomé Filho et al. [
16] proposed several guidelines to make board games accessible to people with vision impairments, which they inferred from interviews, the adaptation of two board games and one evaluation with end users. Interestingly, the adaptation techniques that we used are compliant with their guidelines, as illustrated in
Table 5.
Table 5.
Matching our adaptation techniques to some of da Rocha Tomé Filho et al.’s guidelines for accessible board games [
16].
Table 5.
Matching our adaptation techniques to some of da Rocha Tomé Filho et al.’s guidelines for accessible board games [
16].
| Guidelines | Techniques Used for the Little Red Riding Hood |
|---|
| Tactile feedback |
| Use of tactile patterns to delimit pieces | Raised-line paths on the board; laser-cut areas within which tangible objects can be moved; engraved squares; use of straight and curved lines for different paths. |
| Use of pieces with different physical characteristics | Use of pieces with different shapes (e.g., small-scale models for the pawns; rectangular tokens; objects to trigger actions in the shape of a flower and of a mushroom). Use of different textures (e.g., felt). Use different colors. |
| Use of storage compartments | 3D-printed basket for the tokens; delimited area on the side for the tokens (cf. Figure 9, at right) |
| Fix game components to prevent accidental moving | Use of magnets for main objects (pawns, basket). The 3D-printed houses were attached with glue dots. |
| Color and contrast |
| Do not use color alone | Use of various shapes, textures, sizes, colors, etc. |
| Use of color-blind friendly palettes/use of highly contrasted colors | Use of yellow outlines for the paths. Use of thick black outlines for additional illustrations. |
| Information design (no text used in our case) |
| Enlarge game components | Redesign the paths so that they cover the entire area. |
| Highlight important graphics | Use yellow outlines for essential elements, black outlines otherwise. |
| Game rules |
| Provide accessible rulebooks | Design an audio and interactive tutorial to explain the rules. |
| Provide audible feedback about actions and changes in game state | Design of audio messages following users’ actions. Use of sounds when specific actions are performed. |
| Assistive technologies |
| Identify and read aloud game elements | Reading aloud the value of cards. |
| Computerization of analog components and gameplay actions | Reading aloud the number of stones and flowers (instead of players counting them). Random assignment of the grandmother’s house to one of the house’s positions. |
Adapting the game using assistive technologies also opens up interesting perspectives to increase the game’s user experience. We explored these opportunities during a brainstorming session with colleagues (PhD students and researchers). After presenting the original game, people were invited to give ideas on how technology could be used to enhance/adapt the game. Many additional features were proposed. Some dealt with the use of feedback to enrich the user experience with sounds. For example, a particular sound could be played whenever the wolf moved forward to give the players a sense of how close it was to the grandmother’s house. Different sounds could also be played depending on the outcomes within the game (successes and failures, winning or losing). Other features dealt with the game itself and included random traps that could prevent Little Red Riding Hood from moving forward, arbitrary changes of the card’s special power, possibilities to select different levels of complexities, to compute and save each player’s score, etc.
We are convinced that the observations that we made can be generalized to many contexts. Our results already show that the FlexiBoard can be used for instructional purposes (STEM, orientation and mobility, etc.) but also for gaming. It appears that the adaptability of the system mainly depends on the conditions under which stakeholders can create interactive content.
8. Limitations and Future Work
Although we suggest that the FlexiBoard can be used in different contexts and for various purposes, we are aware of some limitations of the system. Firstly, the tangible objects we designed cannot be moved freely: they must be slid along the surface. This constrains how users can interact with them and makes it necessary to design ad hoc interaction techniques that are sometimes unusual. For example, for the game that we designed, participants had to slide the objects back and forth within a dedicated area to “draw” a card, which was not perceived as intuitive by all participants. One way to leverage this issue could be to use additional input modalities such as voice commands. Another solution could be to improve the tracking algorithm so that the system could detect the orientation of the objects; therefore, rotating one object could enable users to select different actions. In any case, we plan to improve the tracking algorithm to increase the number of tangible objects.
Secondly, if one user detaches an object, it can be difficult for him/her to reconnect with the corresponding underlying magnet. Similarly, if several objects are detached from the support, the user might attach the upper magnets to the wrong lower magnets, which would lead to inconsistencies between the digital and physical representations. In those cases, the system could benefit from having a “guidance” feature that would help users to localize the lower magnets.
The technical decisions that we took were mainly driven by the fact that we wanted the device to be easy to store and easy to carry from one place to another (e.g., from the special education center to a mainstream school, or from one classroom to another). Regarding this aspect, future work will address the portability of the FlexiBoard and further improve the weight and size of the device.
In addition, the design of new applications (for education, gaming, etc.) on the FlexiBoard currently requires software development. To solve this problem, we are currently implementing a tool allowing practitioners to edit their own interactive graphics and scenarios. This editor will allow them to define the interaction areas on the graphic/map, and to associate actions with these areas according to the position of the tangible objects. Thus, the practitioners will be able to create their application themselves by (a) drawing the graphic/map with a vector graphics editor and (b) making it interactive using the editor. This will increase the creativity of practitioners who will no longer be limited by technical limitations requiring the help of a third party.
Finally, it will be interesting to compare the FluxMarker and the FlexiBoard systems. Based on similar motivations, their design process resulted in two different approaches that we believe complement each other. FluxMarker relies on actuated tangible objects, greatly opening up the design space of tangible and tactile graphics for visually impaired users. FlexiBoard, on the other hand, enables participants to use the tangible objects as input devices by tracking their position. In addition, by using two paired magnets, we ensure the stability of the objects and support graphics of various thicknesses. We believe that the insights gained from the design and development of these two systems would encourage the development of tangible and tactile graphics that will use tangible objects as input and output, while ensuring their stability and compatibility with different graphics. In addition, both projects were illustrated with several usage scenarios, the implementation of which will help researchers to better understand to what extent tangible and tactile graphics can help visually impaired users, enrich students’ learning experience or even, as we already demonstrated, encourage the development of inclusive games.
9. Conclusions
In this study, we described the design and implementation of the FlexiBoard, a tangible interface that augments tactile documents with interactive objects to create affordable, portable, interactive and updatable graphics for people with vision impairments (in contrast to tactile documents that can be interactive but not updatable). Our results show that the FlexiBoard can be used for educational purposes and for entertainment purposes too.
Throughout this article, we described and discussed a number of activities and tasks, which were mainly identified based on participatory design sessions conducted with specialized teachers. Although they were initially identified to facilitate the design of applications for the FlexiBoard, we believe that they could also be adapted for other tabletop TUIs for visually impaired users.
Figure 10 summarizes the different steps in this design process.
We expect that the detailed description of the design and implementation of the FlexiBoard will encourage professionals and researchers to further investigate the potential of tactile and tangible graphics for educational activities (including O&M) and games including people with vision impairments.
Author Contributions
Conceptualization, J.D., M.R., M.J.-M.M., B.O. and C.J.; Methodology, J.D., M.R., M.J.-M.M., B.O. and C.J.; Software, M.R. and J.D.; Validation, J.D., M.R., M.J.-M.M., B.O. and C.J.; Investigation, J.D.; Resources, C.J.; Data curation, J.D.; Writing—original draft preparation, J.D.; writing—review and editing: M.R., J.D., M.J.-M.M., B.O. and C.J.; visualization: J.D. and M.R.; supervision: M.R., M.J.-M.M., B.O. and C.J.; project administration, C.J.; funding acquisition: C.J. All authors have read and agreed to the published version of the manuscript.
Funding
Partially funded by the Accessimap project (ANR-14-CE17-0018).
Institutional Review Board Statement
Not applicable.
Informed Consent Statement
All participatory sessions were carried out within the framework of a research collaboration agreement between the CNRS, the University of Toulouse and the CESDV-IJA specialized education center, Toulouse, France.
Data Availability Statement
No new data were created or analyzed in this study. Data sharing is not applicable to this article.
Conflicts of Interest
The authors declare no conflicts of interest.
Appendix A
Table A1.
Usage scenarios proposed by the teachers.
Table A1.
Usage scenarios proposed by the teachers.
| Subject | Description |
|---|
| English | A raised-line map with the main boroughs of NYC. A tangible object with a “yellow cab” hat can be moved above the boroughs and their name is given.
Possibility to give instructions (e.g., “go to Manhattan”) and also to guide the student (“go north, through the bridge”). Possibility to have questions: “which bridge is located between A and B?”. The aim would be to learn the boroughs, but also to help students learn directions. |
| Maths | To learn trigonometric ratios. Triangles are drawn on a sheet of German film. Objects are placed on the vertices and/or edges of the triangle. (A) Students can move one object to retrieve the corresponding names (e.g., hypotenuse). (B) Students are asked to place one object near the hypotenuse/opposite side—feedback is given if the answer is incorrect. (C) By moving objects from the triangles to a dedicated “formula” area, students can compute the sine/cosine/tangent of one angle. |
| Biology | A graphic with the heart, the arteries, etc. Students need to move a tangible object along the blood flow. |
| Maths | Conversion tables. One object = one number. Students would need to place the numbers in the right cell of the tables. Possibility to give feedback, or to ask questions such as “how many meters in two kilometers?” and to check the answers. |
| Biology | A body part chart. Students would need to move one tangible object on top of the different parts to retrieve their names and/or to answer questions asked by the system (e.g., “where is the head?”). Possibility to use a menu to select between muscles, bones, organs, etc. |
| History | To check that students have a basic knowledge of historical periods. A raised-line timeline with different periods (e.g., Medieval Age) and a tangible menu (e.g., historical facts vs. writers). (A) Students can move an object on top of the timeline to retrieve information based on the selected item in the menu. (B) Students must place one object representing one person/fact/
invention at the right place. Feedback is given. |
| Geography | A map of France/Europe. One tangible object = one city. Students would need to place all cities in their right place and then the application would give feedback. Another possibility would be for the system to ask the students to place the city one after another, and to give feedback every time. |
| Geography/O&M | A map with different routes (motorway, local road, etc.). A tangible object (with a “car” hat) can be moved along the routes and the application indicates whether it is a motorway or a local road and gives instructions (“take the next exit, you are now on a national road”). |
| Geometry | Students would be guided to reconstruct a geometric shape. |
| Arithmetic operations | Students would be helped (and possibly guided) to write additions, subtractions, etc., e.g., “line up the tens and units”. |
| Tables | Helping students learn how to read tables and notably cross-tabulations. One table is drawn on the graphic, and students are asked to place one object in the right cell. For example, for a table with colors (rows) and shapes (columns), the questions could be: “where is the red circle?”. |
| Tables | Helping students learn how to navigate a table: students would need to move a tangible object by following instructions such as “go 4 cells to the right”. |
References
- Beck-Winchatz, B.; Riccobono, M.A. Advancing participation of blind students in science, technology, engineering, and math. Adv. Space Res. 2008, 42, 1855–1858. [Google Scholar] [CrossRef]
- Mesquita, S.; Carneiro, M.J. Accessibility of European museums to visitors with visual impairments. Disabil. Soc. 2016, 31, 373–388. [Google Scholar] [CrossRef]
- Asakawa, S.; Guerreiro, J.; Ahmetovic, D.; Kitani, K.M.; Asakawa, C. The present and future of museum accessibility for people with visual impairments. In Proceedings of the 20th International ACM SIGACCESS Conference on Computers and Accessibility, Galway, Ireland, 22–24 October 2018; pp. 382–384. [Google Scholar]
- Andrade, R.; Rogerson, M.J.; Waycott, J.; Baker, S.; Vetere, F. Playing Blind: Revealing the World of Gamers with Visual Impairment. In Proceedings of the 2019 CHI Conference on Human Factors in Computing Systems, Glasgow, UK, 4–9 May 2019; pp. 1–14. [Google Scholar]
- Heron, M.J.; Belford, P.H.; Reid, H.; Crabb, M. Eighteen Months of Meeple Like Us: An Exploration into the State of Board Game Accessibility. Comput. Games J. 2018, 7, 75–95. [Google Scholar] [CrossRef]
- Tatham, A.F. Tactile mapping: Yesterday, today and tomorrow. Cartogr. J. 2003, 40, 255–258. [Google Scholar] [CrossRef]
- Ducasse, J.; Brock, A.M.; Jouffrais, C. Accessible interactive maps for visually impaired users. In Mobility of Visually Impaired People; Springer: Berlin/Heidelberg, Germany, 2018; pp. 537–584. [Google Scholar]
- Brock, A.M.; Truillet, P.; Oriola, B.; Picard, D.; Jouffrais, C. Interactivity improves usability of geographic maps for visually impaired people. Hum.-Comput. Interact. 2015, 30, 156–194. [Google Scholar] [CrossRef]
- Weir, R.; Sizemore, B.; Henderson, H.; Chakraborty, S.; Lazar, J. Development and evaluation of sonified weather maps for blind users. In Designing Inclusive Systems; Springer: Berlin/Heidelberg, Germany, 2012; pp. 75–84. [Google Scholar]
- Brule, E.; Bailly, G.; Brock, A.; Valentin, F.; Denis, G.; Jouffrais, C. MapSense: Multi-sensory interactive maps for children living with visual impairments. In Proceedings of the 2016 CHI Conference on Human Factors in Computing Systems, San Jose, CA, USA, 7–12 May 2016; pp. 445–457. [Google Scholar]
- Rossetti, V.; Furfari, F.; Leporini, B.; Pelagatti, S.; Quarta, A. Enabling Access to Cultural Heritage for the visually impaired: An Interactive 3D model of a Cultural Site. Procedia Comput. Sci. 2018, 130, 383–391. [Google Scholar] [CrossRef]
- Zeng, L.; Weber, G. ATMap: Annotated tactile maps for the visually impaired. In Cognitive Behavioural Systems; Springer: Berlin/Heidelberg, Germany, 2012; pp. 290–298. [Google Scholar]
- Ducasse, J.; Macé, M.J.; Serrano, M.; Jouffrais, C. Tangible reels: Construction and exploration of tangible maps by visually impaired users. In Proceedings of the 2016 CHI Conference on Human Factors in Computing Systems, San Jose, CA, USA, 7–12 May 2016; pp. 2186–2197. [Google Scholar]
- McGookin, D.; Robertson, E.; Brewster, S. Clutching at straws: Using tangible interaction to provide non-visual access to graphs. In Proceedings of the SIGCHI Conference on Human Factors in Computing Systems, Atlanta, GA, USA, 10–15 April 2010; pp. 1715–1724. [Google Scholar]
- McGookin, D.K.; Brewster, S.A. Graph builder: Constructing non-visual visualizations. In People and Computers XX—Engage; Springer: Berlin/Heidelberg, Germany, 2007; pp. 263–278. [Google Scholar]
- da Rocha Tomé Filho, F.; Mirza-Babaei, P.; Kapralos, B.; Moreira Mendonça Junior, G. Let’s Play Together: Adaptation Guidelines of Board Games for Players with Visual Impairment. In Proceedings of the 2019 CHI Conference on Human Factors in Computing Systems, Glasgow, UK, 4–9 May 2019; pp. 1–15. [Google Scholar]
- Crampton, J.W. Interactivity types in geographic visualization. Cartogr. Geogr. Inf. Sci. 2002, 29, 85–98. [Google Scholar] [CrossRef]
- Thevin, L.; Rodier, N.; Oriola, B.; Hachet, M.; Jouffrais, C.; Brock, A.M. Inclusive adaptation of existing board games for gamers with and without visual impairments using a spatial augmented reality framework for touch detection and audio feedback. Proc. ACM Hum.-Comput. Interact. 2021, 5, 1–33. [Google Scholar] [CrossRef]
- Poppinga, B.; Magnusson, C.; Pielot, M.; Rassmus-Gröhn, K. TouchOver map: Audio-tactile exploration of interactive maps. In Proceedings of the 13th International Conference on Human Computer Interaction with Mobile Devices and Services, Stockholm, Sweden, 30 August–2 September 2011; pp. 545–550. [Google Scholar]
- Giudice, N.A.; Palani, H.P.; Brenner, E.; Kramer, K.M. Learning non-visual graphical information using a touch-based vibro-audio interface. In Proceedings of the 14th international ACM SIGACCESS Conference on Computers and Accessibility, Boulder, CO, USA, 22–24 October 2012; pp. 103–110. [Google Scholar]
- Klatzky, R.L.; Giudice, N.A.; Bennett, C.R.; Loomis, J.M. Touch-screen technology for the dynamic display of 2D spatial information without vision: Promise and progress. Multisens. Res. 2014, 27, 359–378. [Google Scholar] [CrossRef] [PubMed]
- Swaminathan, S.; Roumen, T.; Kovacs, R.; Stangl, D.; Mueller, S.; Baudisch, P. Linespace: A sensemaking platform for the blind. In Proceedings of the 2016 CHI Conference on Human Factors in Computing Systems, San Jose, CA, USA, 7–12 May 2016; pp. 2175–2185. [Google Scholar]
- Ducasse, J.; Macé, M.; Oriola, B.; Jouffrais, C. BotMap: Non-visual panning and zooming with an actuated tabletop tangible interface. ACM Trans. Comput.-Hum. Interact. (TOCHI) 2018, 25, 1–42. [Google Scholar] [CrossRef]
- Guinness, D.; Muehlbradt, A.; Szafir, D.; Kane, S.K. RoboGraphics: Dynamic Tactile Graphics Powered by Mobile Robots. In Proceedings of the 21st International ACM SIGACCESS Conference on Computers and Accessibility, Pittsburgh, PA, USA, 28–30 October 2019; pp. 318–328. [Google Scholar]
- Vidal-Verdú, F.; Hafez, M. Graphical tactile displays for visually-impaired people. IEEE Trans. Neural Syst. Rehabil. Eng. 2007, 15, 119–130. [Google Scholar] [CrossRef] [PubMed]
- Hornecker, E. A design theme for tangible interaction: Embodied facilitation. In ECSCW 2005, Proceedings of the Ninth European Conference on Computer-Supported Cooperative Work, Paris, France, 18–22 September 2005; Springer: Dordrecht, The Netherlands, 2005; pp. 23–43. [Google Scholar]
- Schneider, B.; Jermann, P.; Zufferey, G.; Dillenbourg, P. Benefits of a tangible interface for collaborative learning and interaction. IEEE Trans. Learn. Technol. 2010, 4, 222–232. [Google Scholar] [CrossRef]
- Shaer, O.; Hornecker, E. Tangible User Interfaces: Past, Present, and Future Directions; Now Publishers Inc.: Boston, MA, USA, 2010. [Google Scholar]
- Jafri, R.; Aljuhani, A.M.; Ali, S.A. A tangible interface-based application for teaching tactual shape perception and spatial awareness sub-concepts to visually impaired children. Procedia Manuf. 2015, 3, 5562–5569. [Google Scholar] [CrossRef]
- Manshad, M.S.; Pontelli, E.; Manshad, S.J. Trackable interactive multimodal manipulatives: Towards a tangible user environment for the blind. In Computers Helping People with Special Needs, Proceedings of the 13th International Conference, ICCHP 2012, Linz, Austria, 11–13 July 2012; Springer: Berlin/Heidelberg, Germany, 2012; pp. 664–671. [Google Scholar]
- Sharlin, E.; Watson, B.; Kitamura, Y.; Rorabeck, D.; Lederer, R.; Sutphen, S.; Takimoto, M.; Kishino, F. The Tangible Pathfinder Design of a Wayfinding Trainer for the Visually Impaired. In Proc. Graphics Interface; Citeseer: State College, PA, USA, 2004; pp. 2–3. [Google Scholar]
- Sabuncuoglu, A. Tangible Music Programming Blocks for Visually Impaired Children. In Proceedings of the Fourteenth International Conference on Tangible, Embedded, and Embodied Interaction, Sydney, NSW, Australia, 9–12 February 2020; pp. 423–429. [Google Scholar]
- Koushik, V.; Guinness, D.; Kane, S.K. Storyblocks: A tangible programming game to create accessible audio stories. In Proceedings of the 2019 CHI Conference on Human Factors in Computing Systems, Glasgow, UK, 4–9 May 2019; pp. 1–12. [Google Scholar]
- Baldwin, M.S.; Hayes, G.R.; Haimson, O.L.; Mankoff, J.; Hudson, S.E. The tangible desktop: A multimodal approach to nonvisual computing. ACM Trans. Access. Comput. (TACCESS) 2017, 10, 1–28. [Google Scholar] [CrossRef]
- Choi, S.H.; Walker, B.N. Digitizer auditory graph: Making graphs accessible to the visually impaired. In Proceedings of the CHI’10 Extended Abstracts on Human Factors in Computing Systems, Atlanta, GA, USA, 10–15 April 2010; pp. 3445–3450. [Google Scholar]
- Rühmann, L.M.; Otero, N.; Oakley, I. A Tangible Tool for Visual Impaired Users to Learn Geometry. In Proceedings of the TEI’16: Tenth International Conference on Tangible, Embedded, and Embodied Interaction, Eindhoven, The Netherlands, 14–17 February 2016; pp. 577–583. [Google Scholar]
- Suzuki, R.; Stangl, A.; Gross, M.D.; Yeh, T. FluxMarker: Enhancing Tactile Graphics with Dynamic Tactile Markers. In Proceedings of the 19th International ACM SIGACCESS Conference on Computers and Accessibility, Baltimore, MD, USA, 29 October–1 November 2017; pp. 190–199. [Google Scholar]
- Jordà, S.; Geiger, G.; Alonso, M.; Kaltenbrunner, M. The reacTable: Exploring the synergy between live music performance and tabletop tangible interfaces. In Proceedings of the 1st International Conference on Tangible and Embedded Interaction, Baton Rouge, LA, USA, 15–17 February 2007; pp. 139–146. [Google Scholar]
- Wilson, A.D. PlayAnywhere: A compact interactive tabletop projection-vision system. In Proceedings of the 18th Annual ACM Symposium on User Interface Software and Technology, Seattle, WA, USA, 23–26 October 2005; pp. 83–92. [Google Scholar]
- Schöning, J.; Brandl, P.; Daiber, F.; Echtler, F.; Hilliges, O.; Hook, J.; Löchtefeld, M.; Motamedi, N.; Muller, L.; Olivier, P.; et al. Multi-Touch Surfaces: A Technical Guide; Technical Report TUM-I0833; Institute for Geoinformatics, University of Münster: Münster, Germany, 2008. [Google Scholar]
- Kubicki, S.; Lepreux, S.; Lebrun, Y.; Dos Santos, P.; Kolski, C.; Caelen, J. New human-computer interactions using tangible objects: Application on a digital tabletop with rfid technology. In Human-Computer Interaction. Ambient, Ubiquitous and Intelligent Interaction, Proceedings of the 13th International Conference, HCI International 2009, San Diego, CA, USA, 19–24 July 2009; Springer: Berlin/Heidelberg, Germany, 2009; pp. 446–455. [Google Scholar]
- Morales González, R.; Appert, C.; Bailly, G.; Pietriga, E. Touchtokens: Guiding touch patterns with passive tokens. In Proceedings of the 2016 CHI Conference on Human Factors in Computing Systems, San Jose, CA, USA, 7–12 May 2016; pp. 4189–4202. [Google Scholar]
- Marshall, P. Do tangible interfaces enhance learning? In Proceedings of the 1st International Conference on Tangible and Embedded Interaction, Baton Rouge, LA, USA, 15–17 February 2007; pp. 163–170. [Google Scholar]
| Disclaimer/Publisher’s Note: The statements, opinions and data contained in all publications are solely those of the individual author(s) and contributor(s) and not of MDPI and/or the editor(s). MDPI and/or the editor(s) disclaim responsibility for any injury to people or property resulting from any ideas, methods, instructions or products referred to in the content. |
© 2024 by the authors. Licensee MDPI, Basel, Switzerland. This article is an open access article distributed under the terms and conditions of the Creative Commons Attribution (CC BY) license (https://creativecommons.org/licenses/by/4.0/).


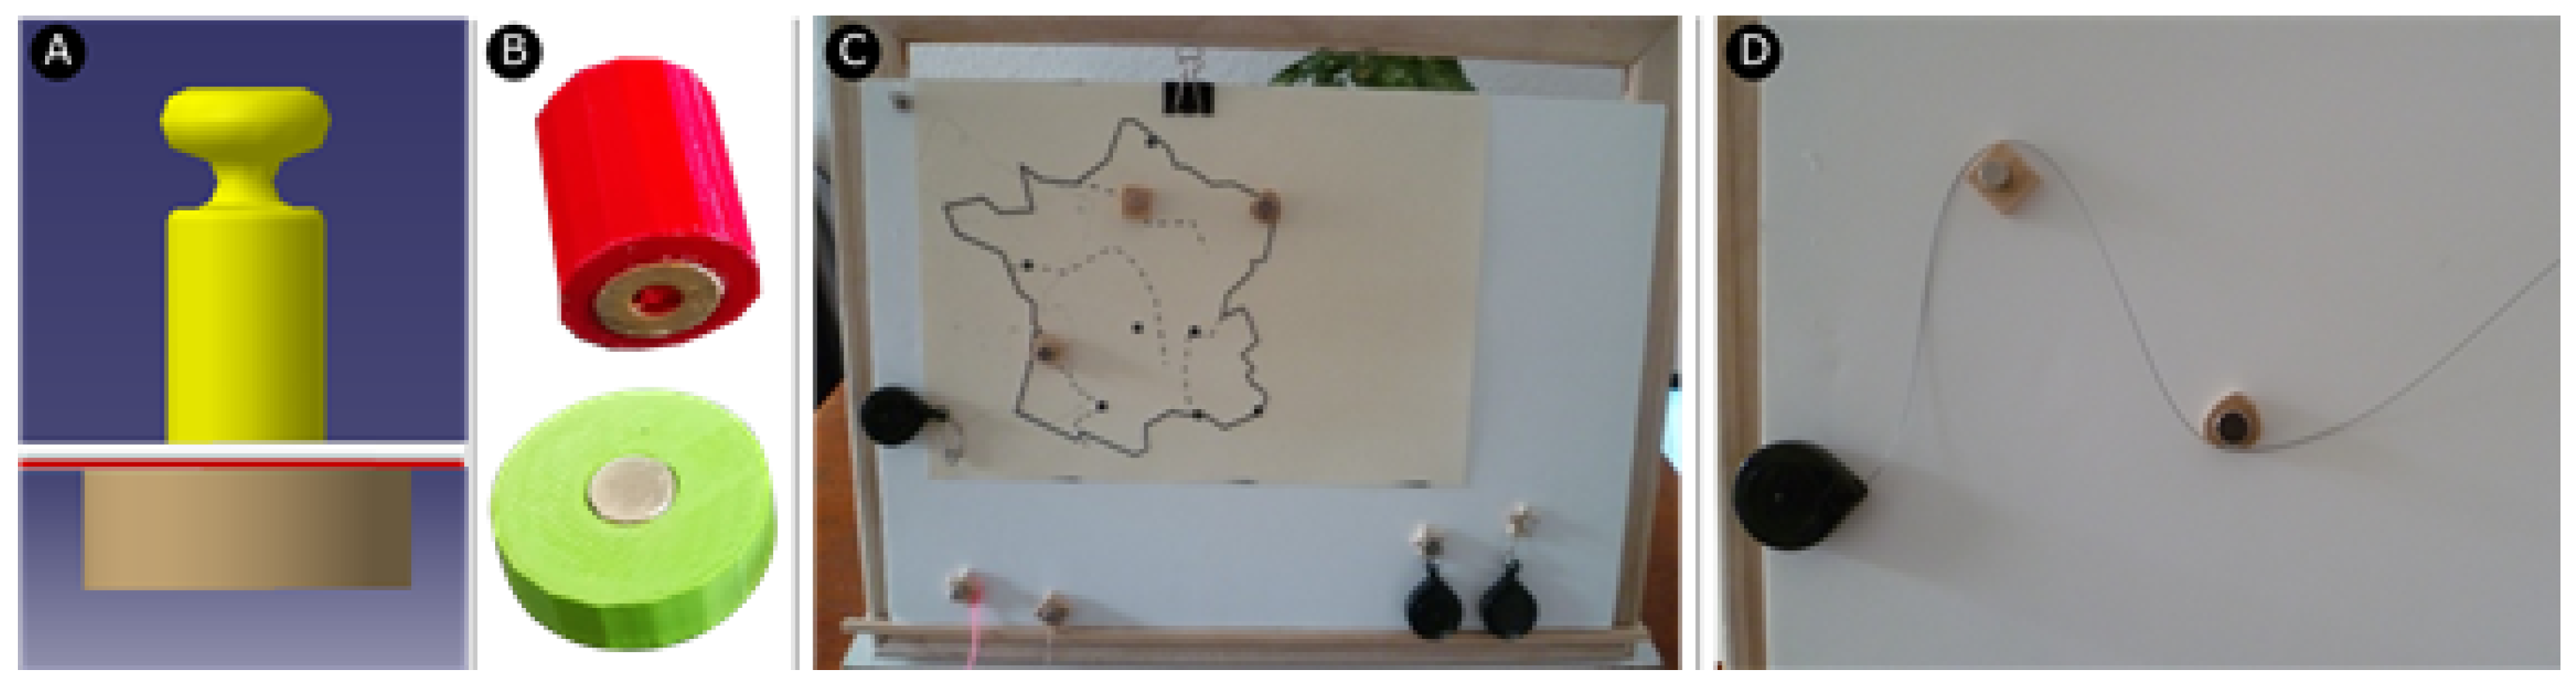
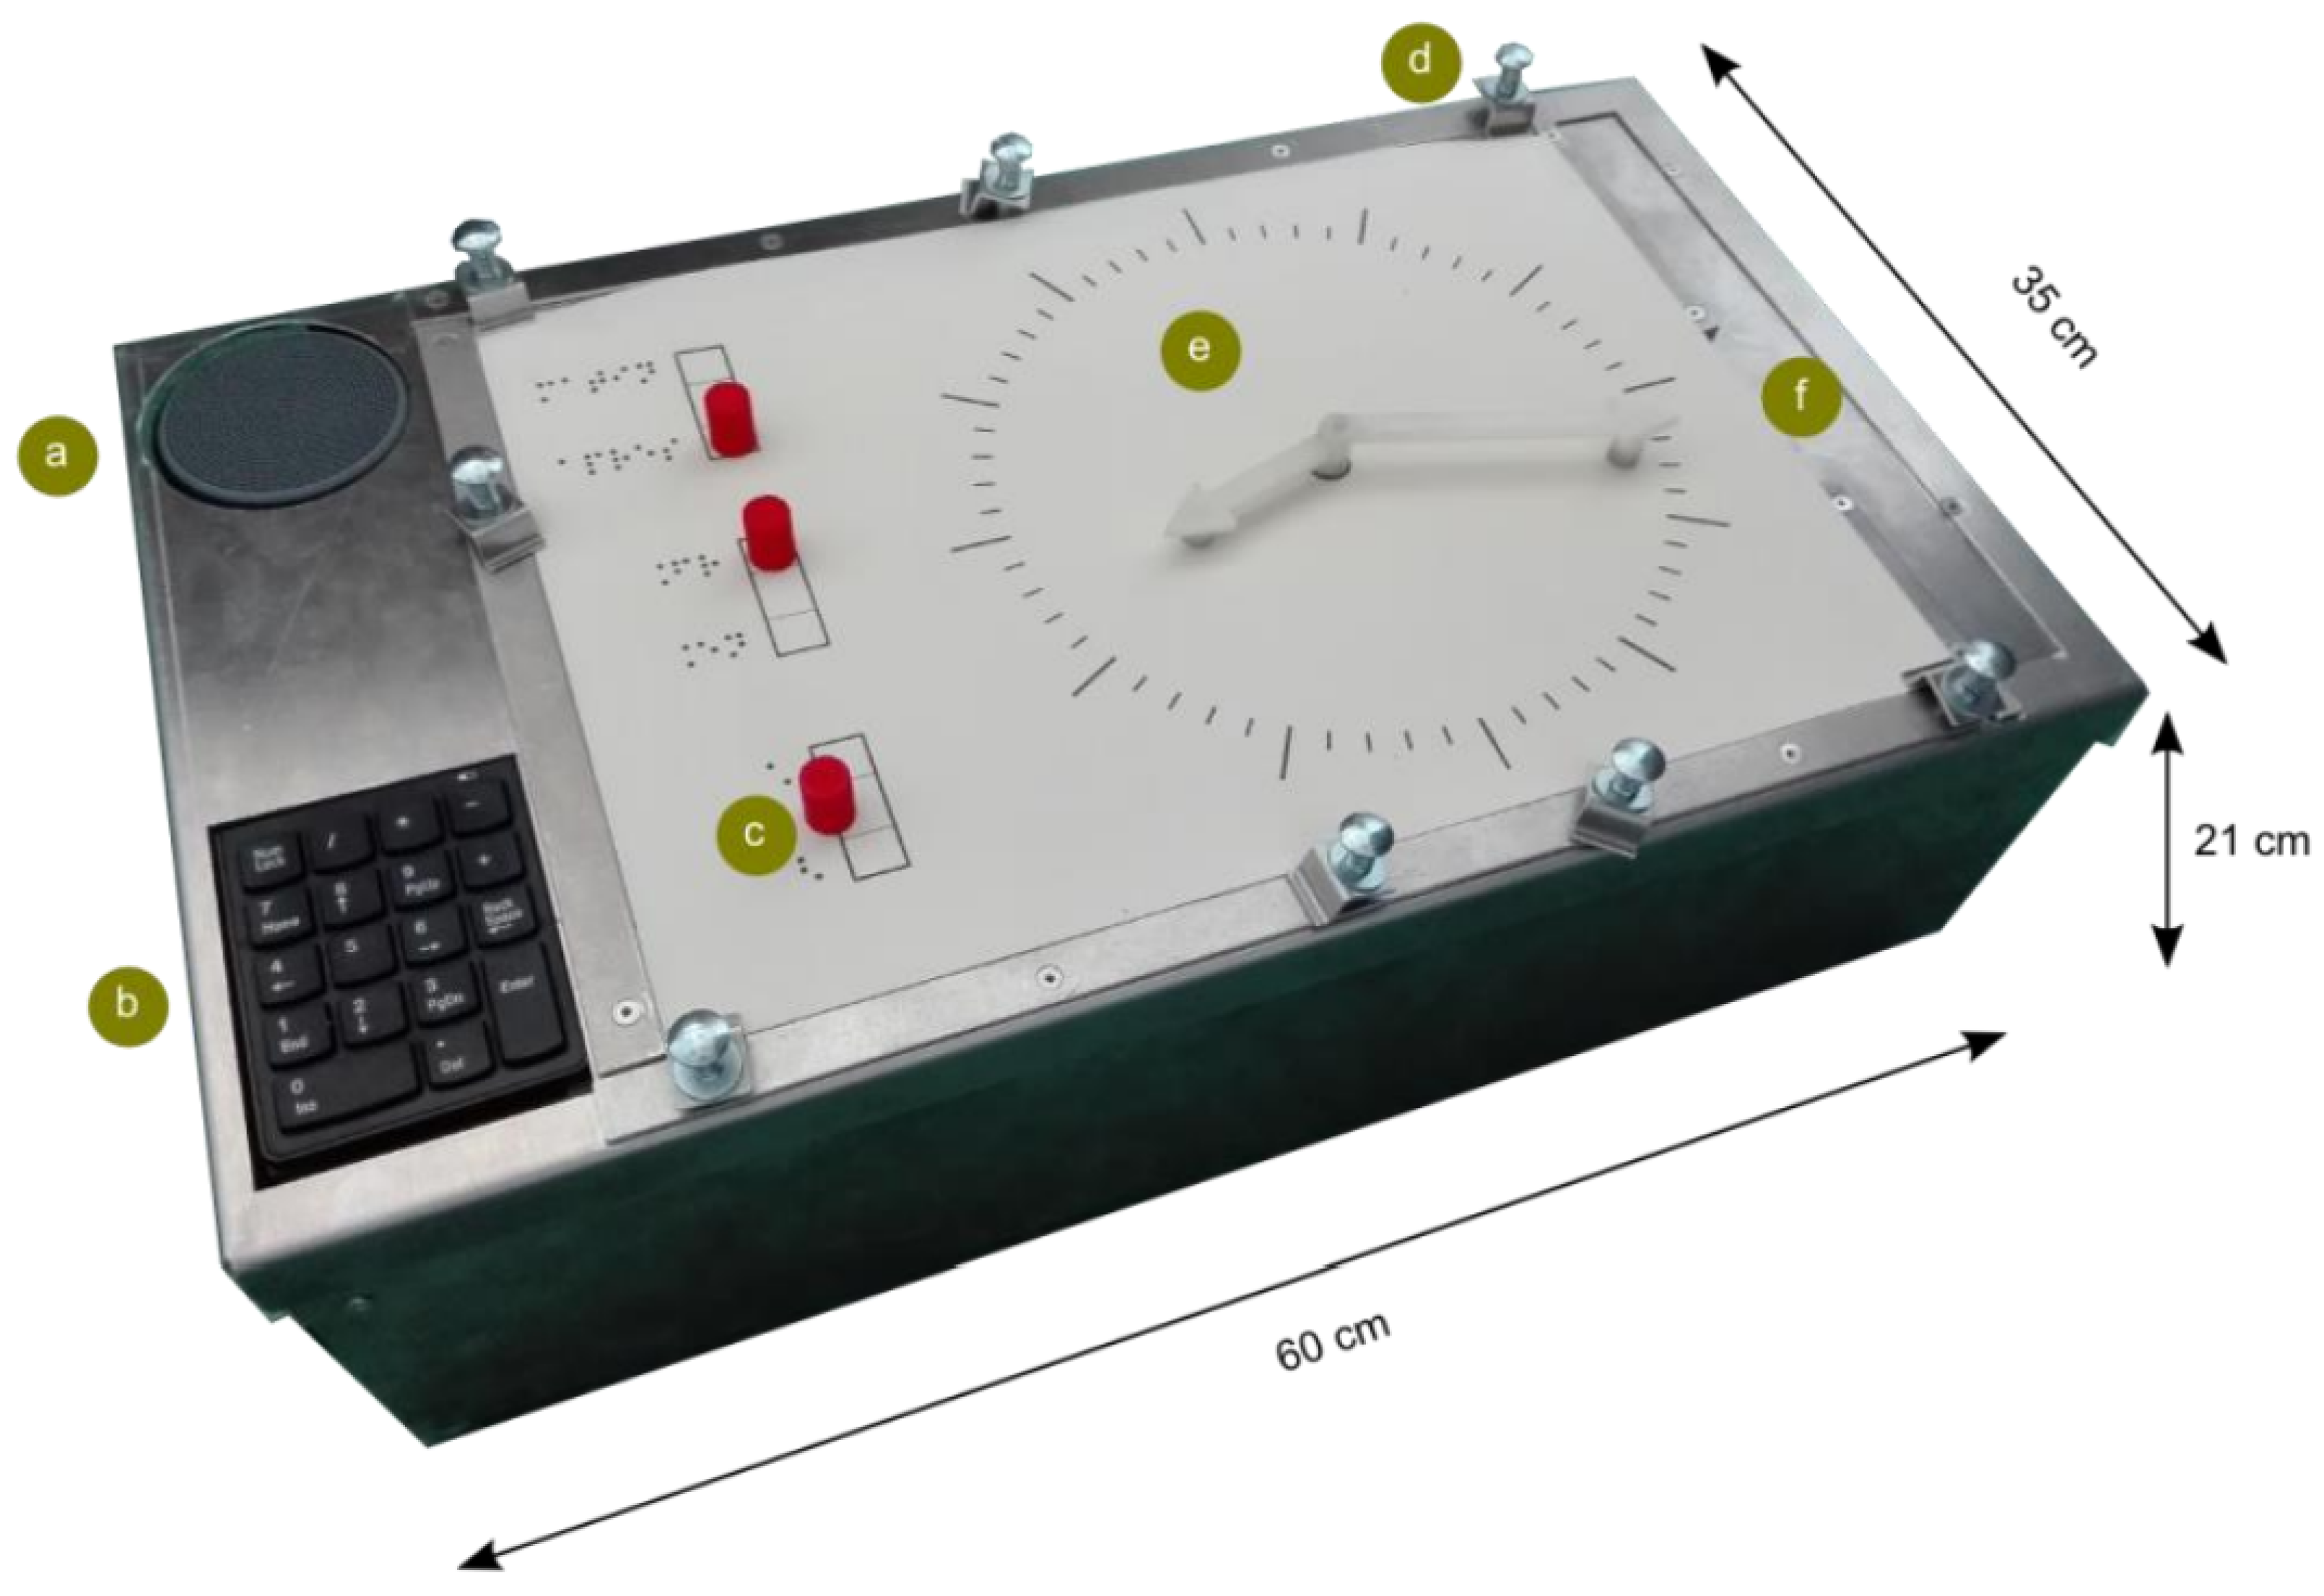
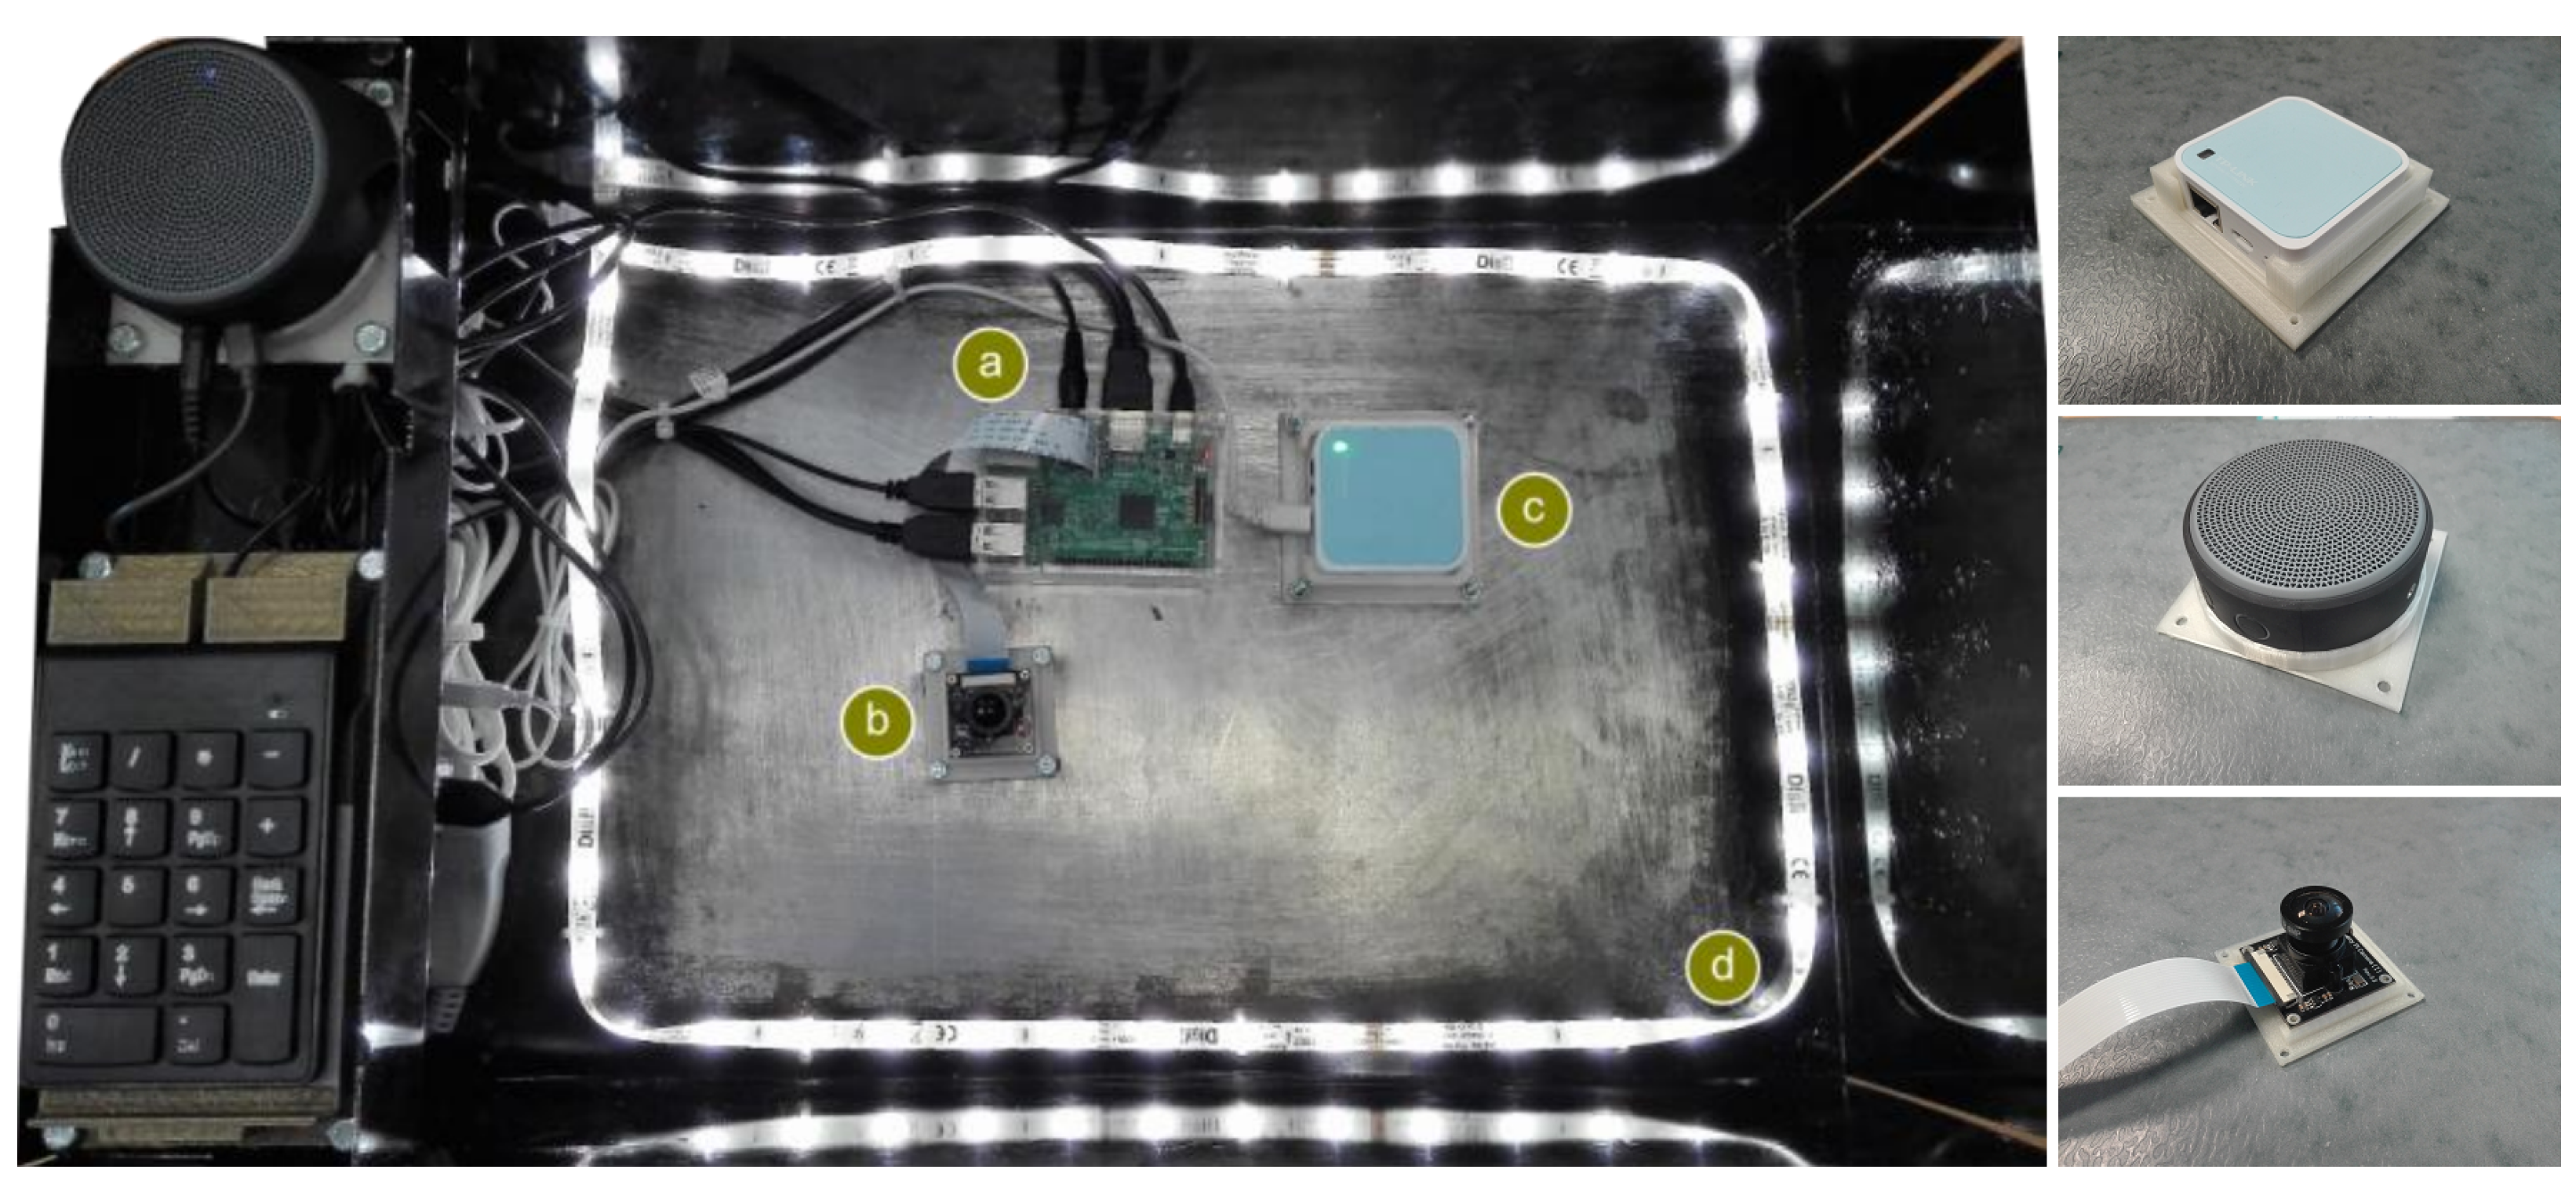
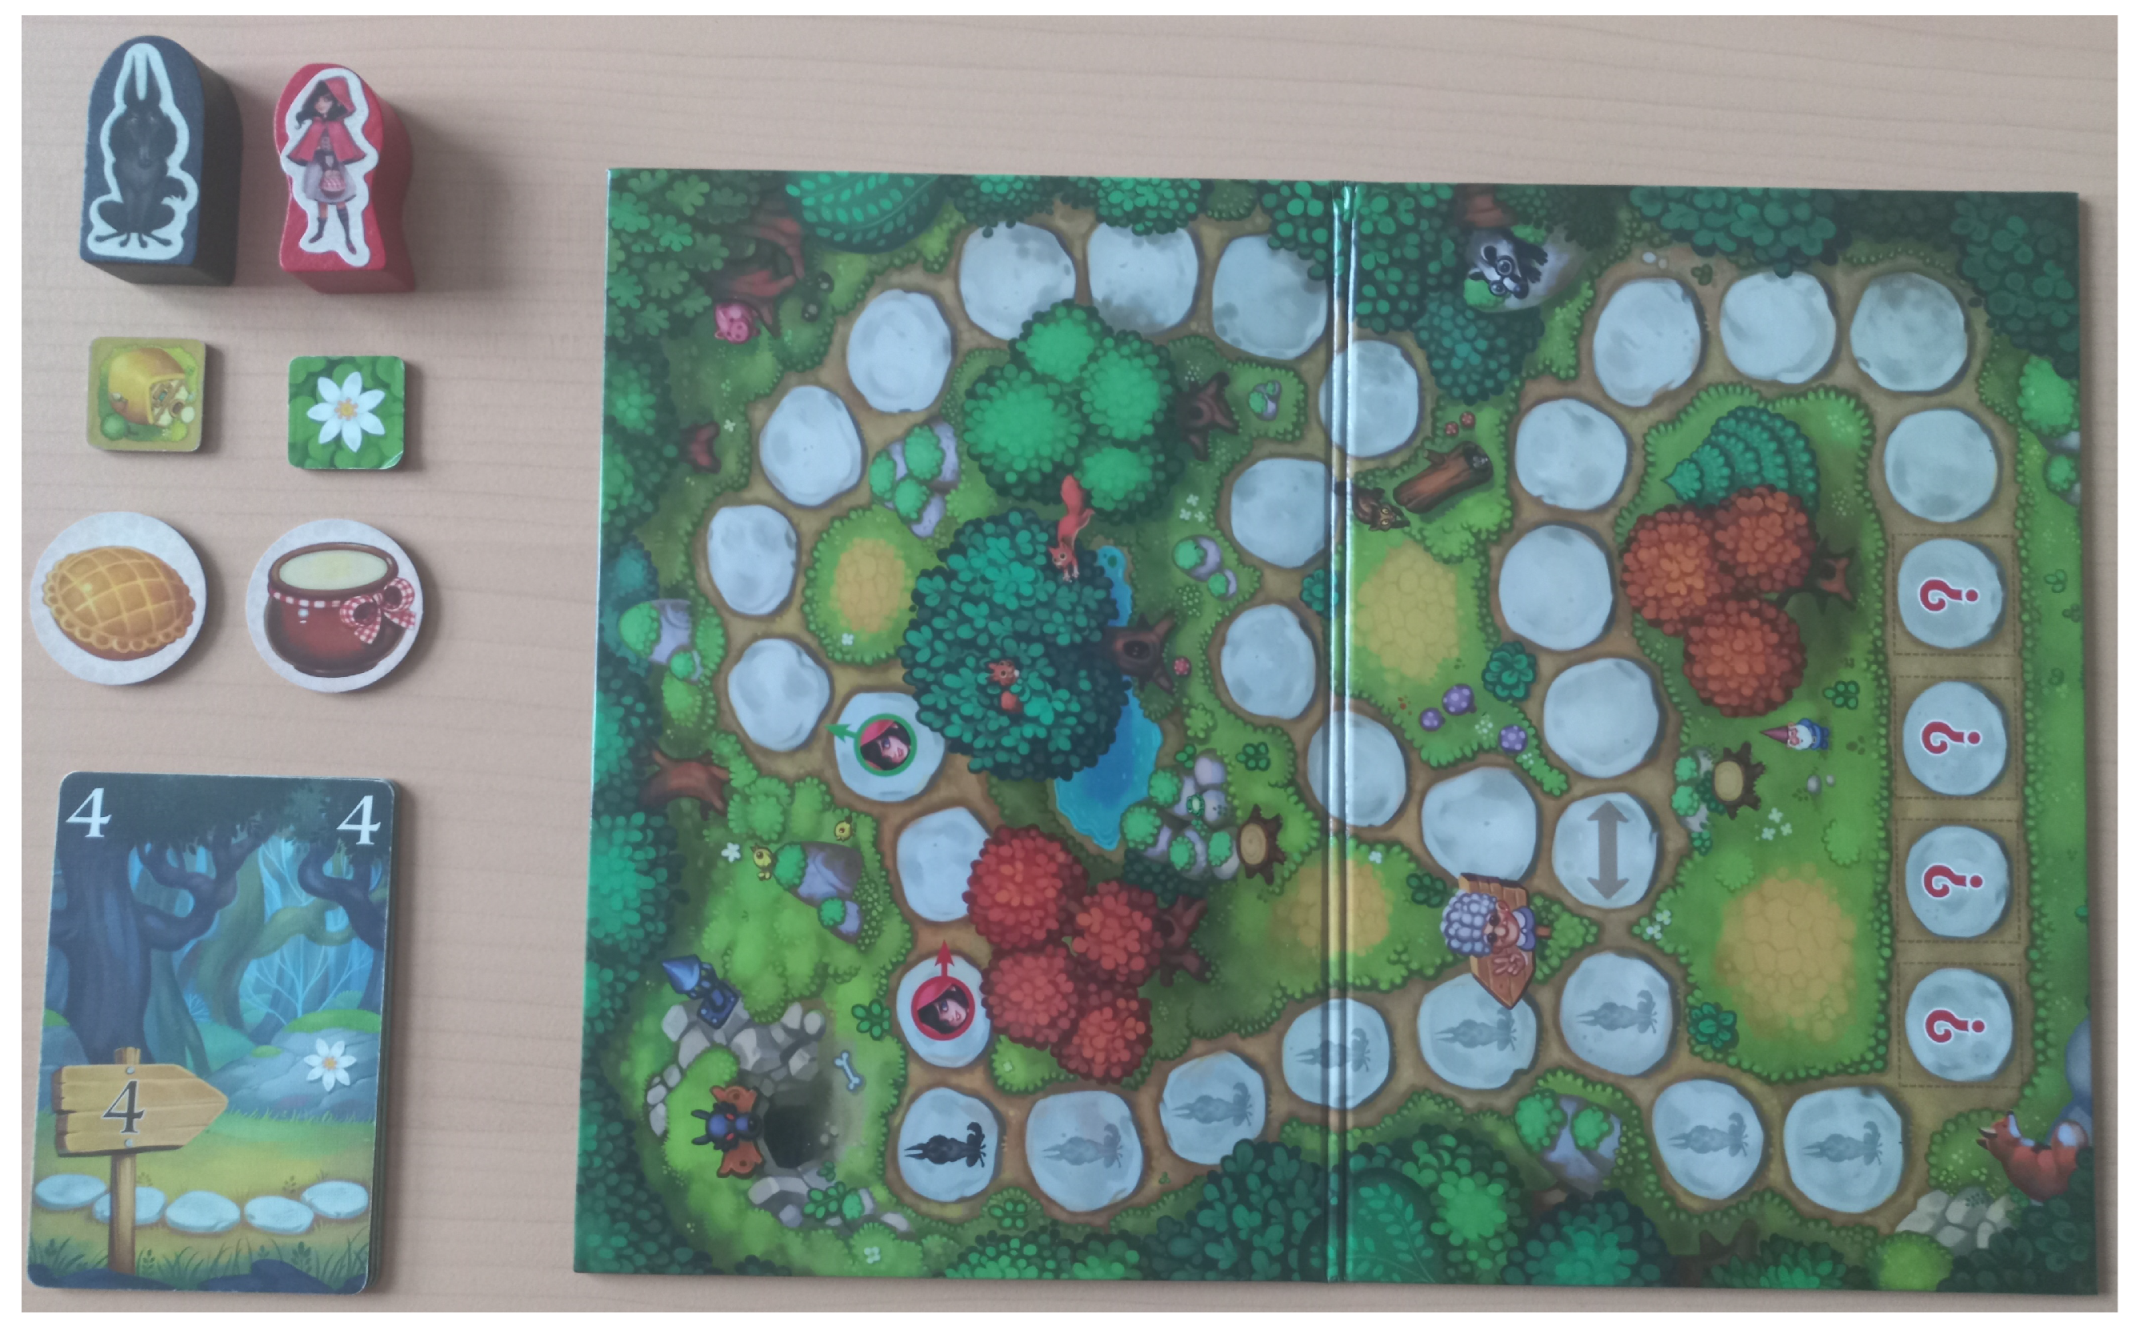
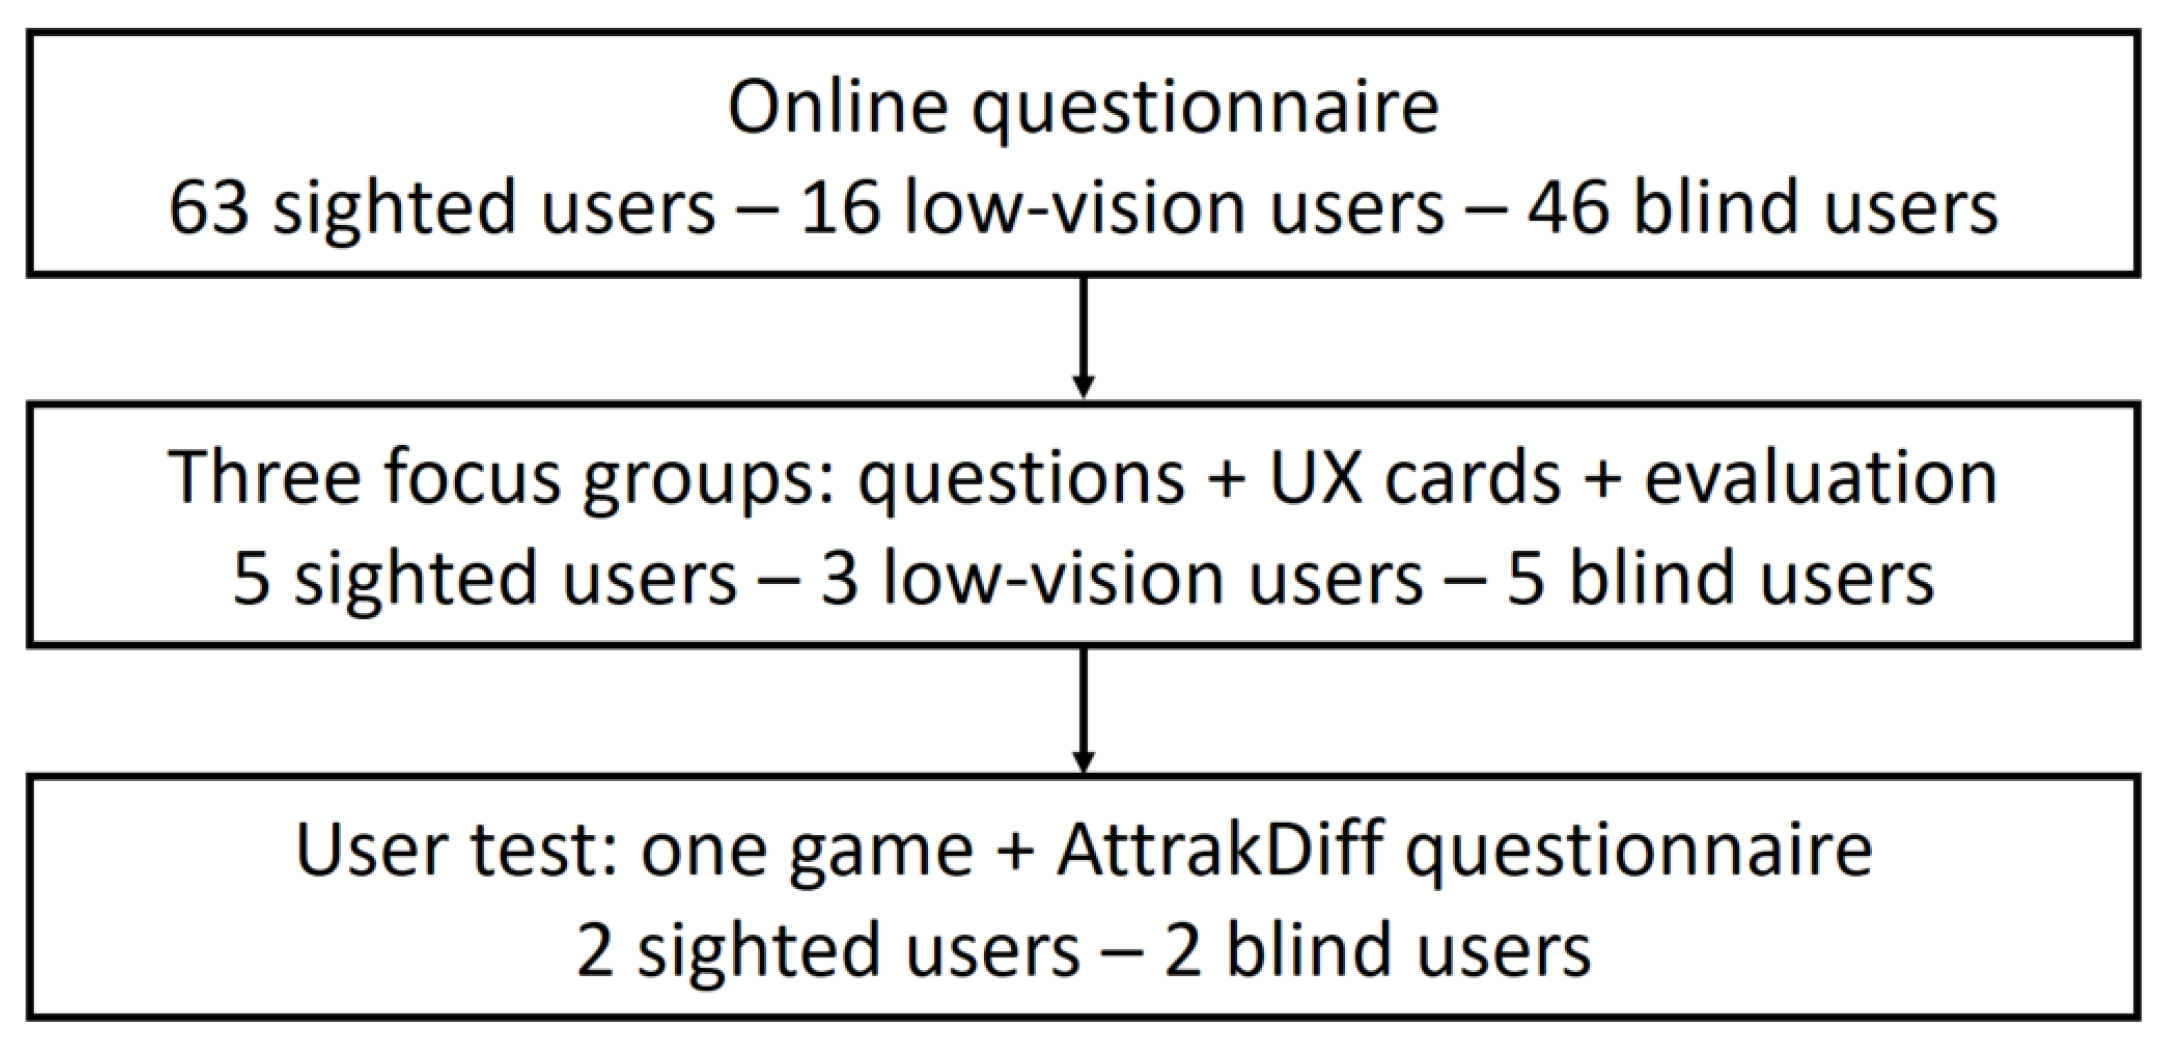
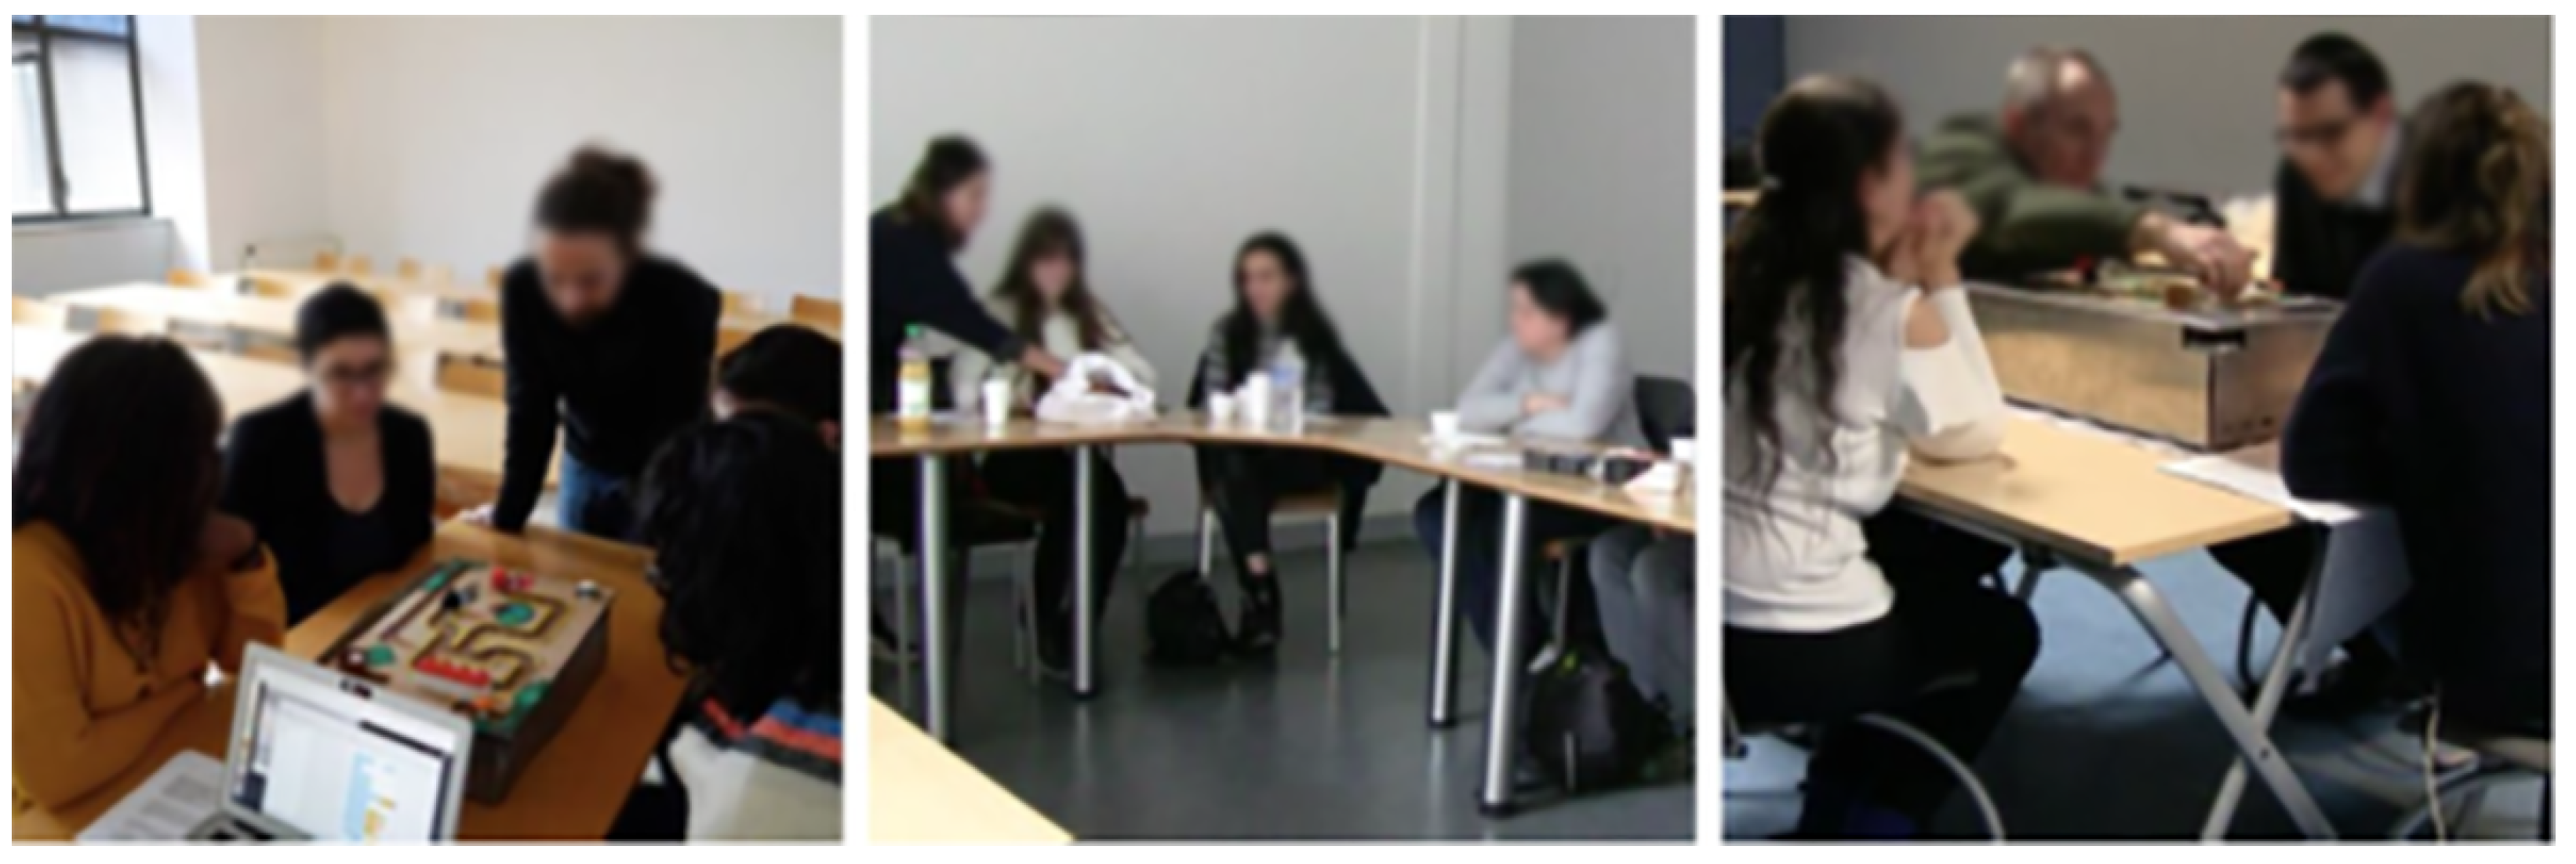
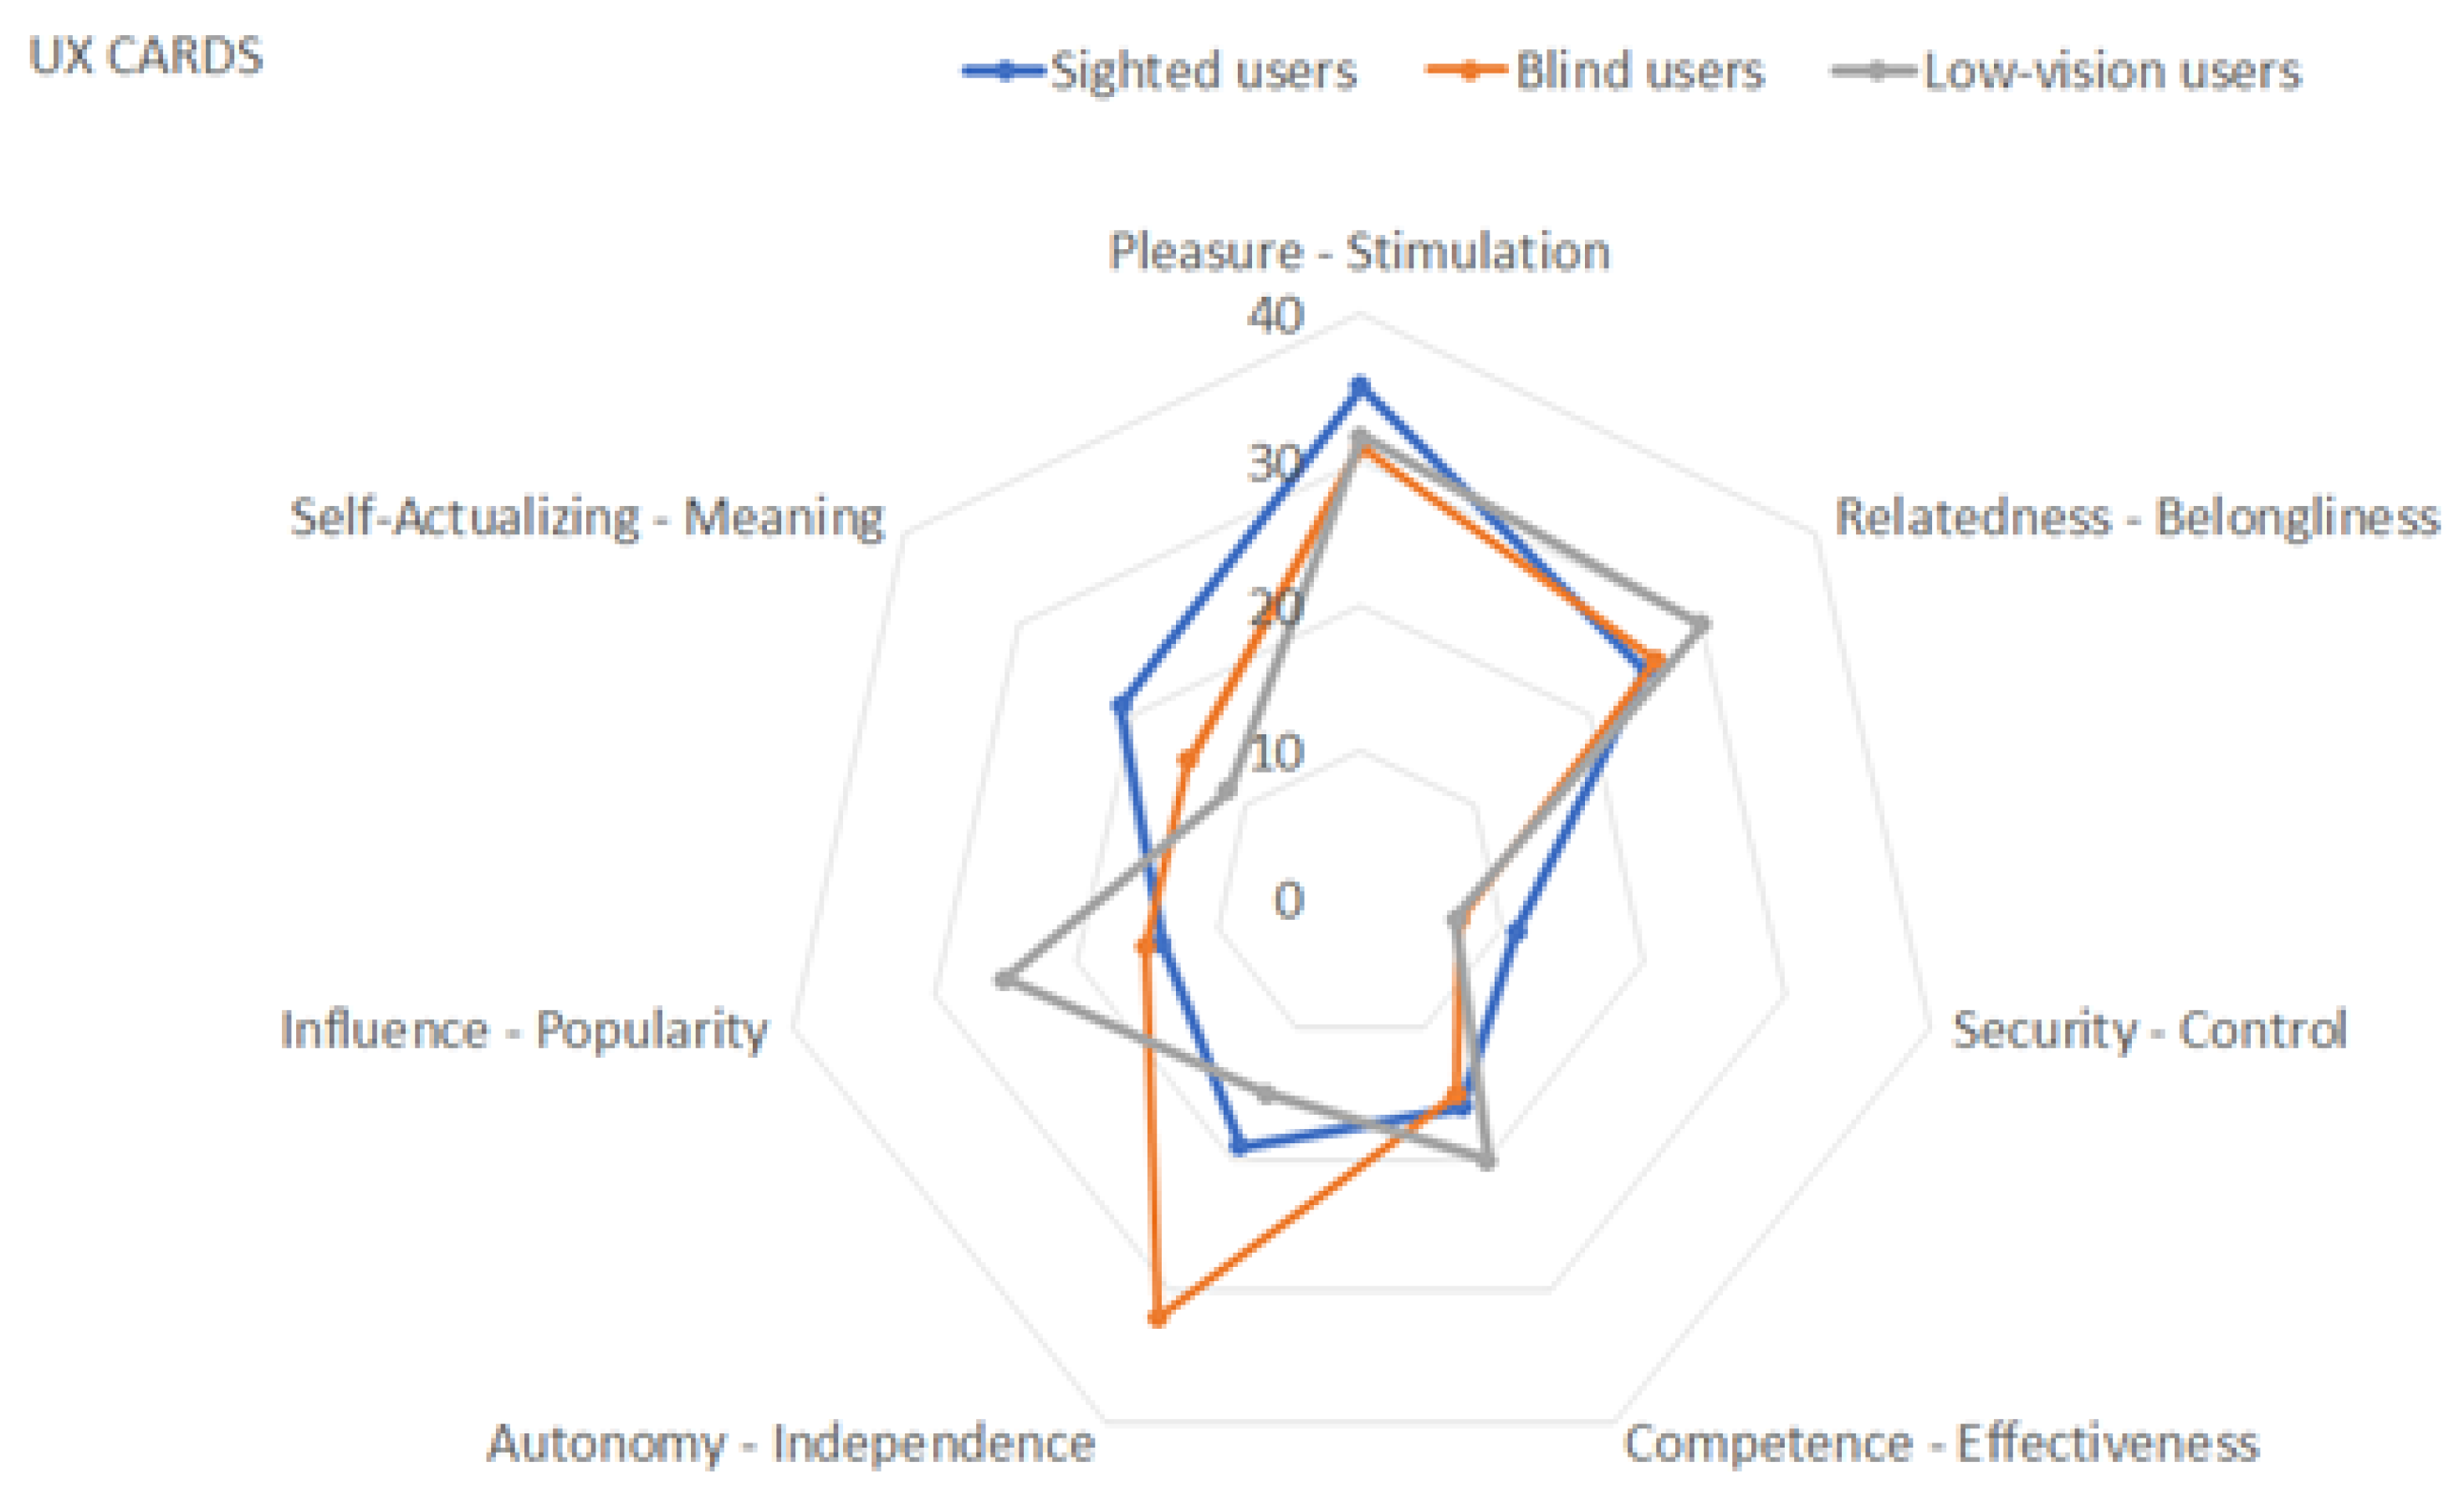
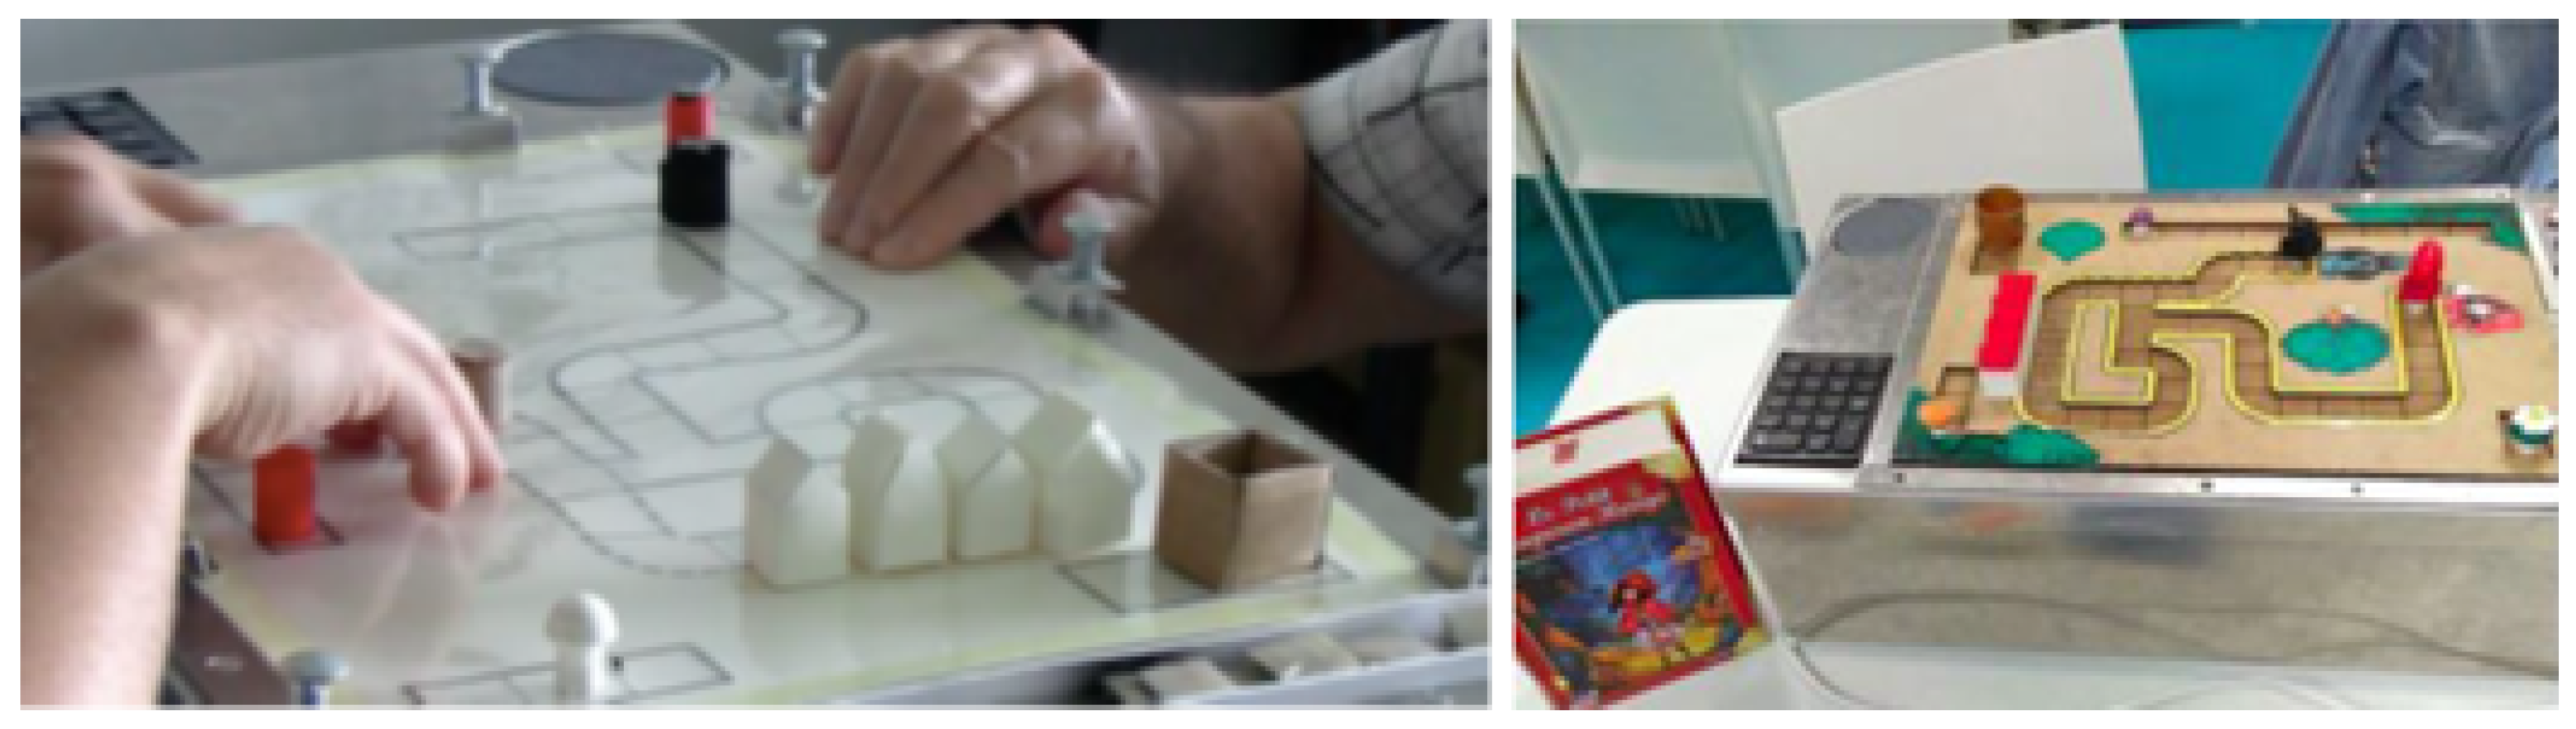
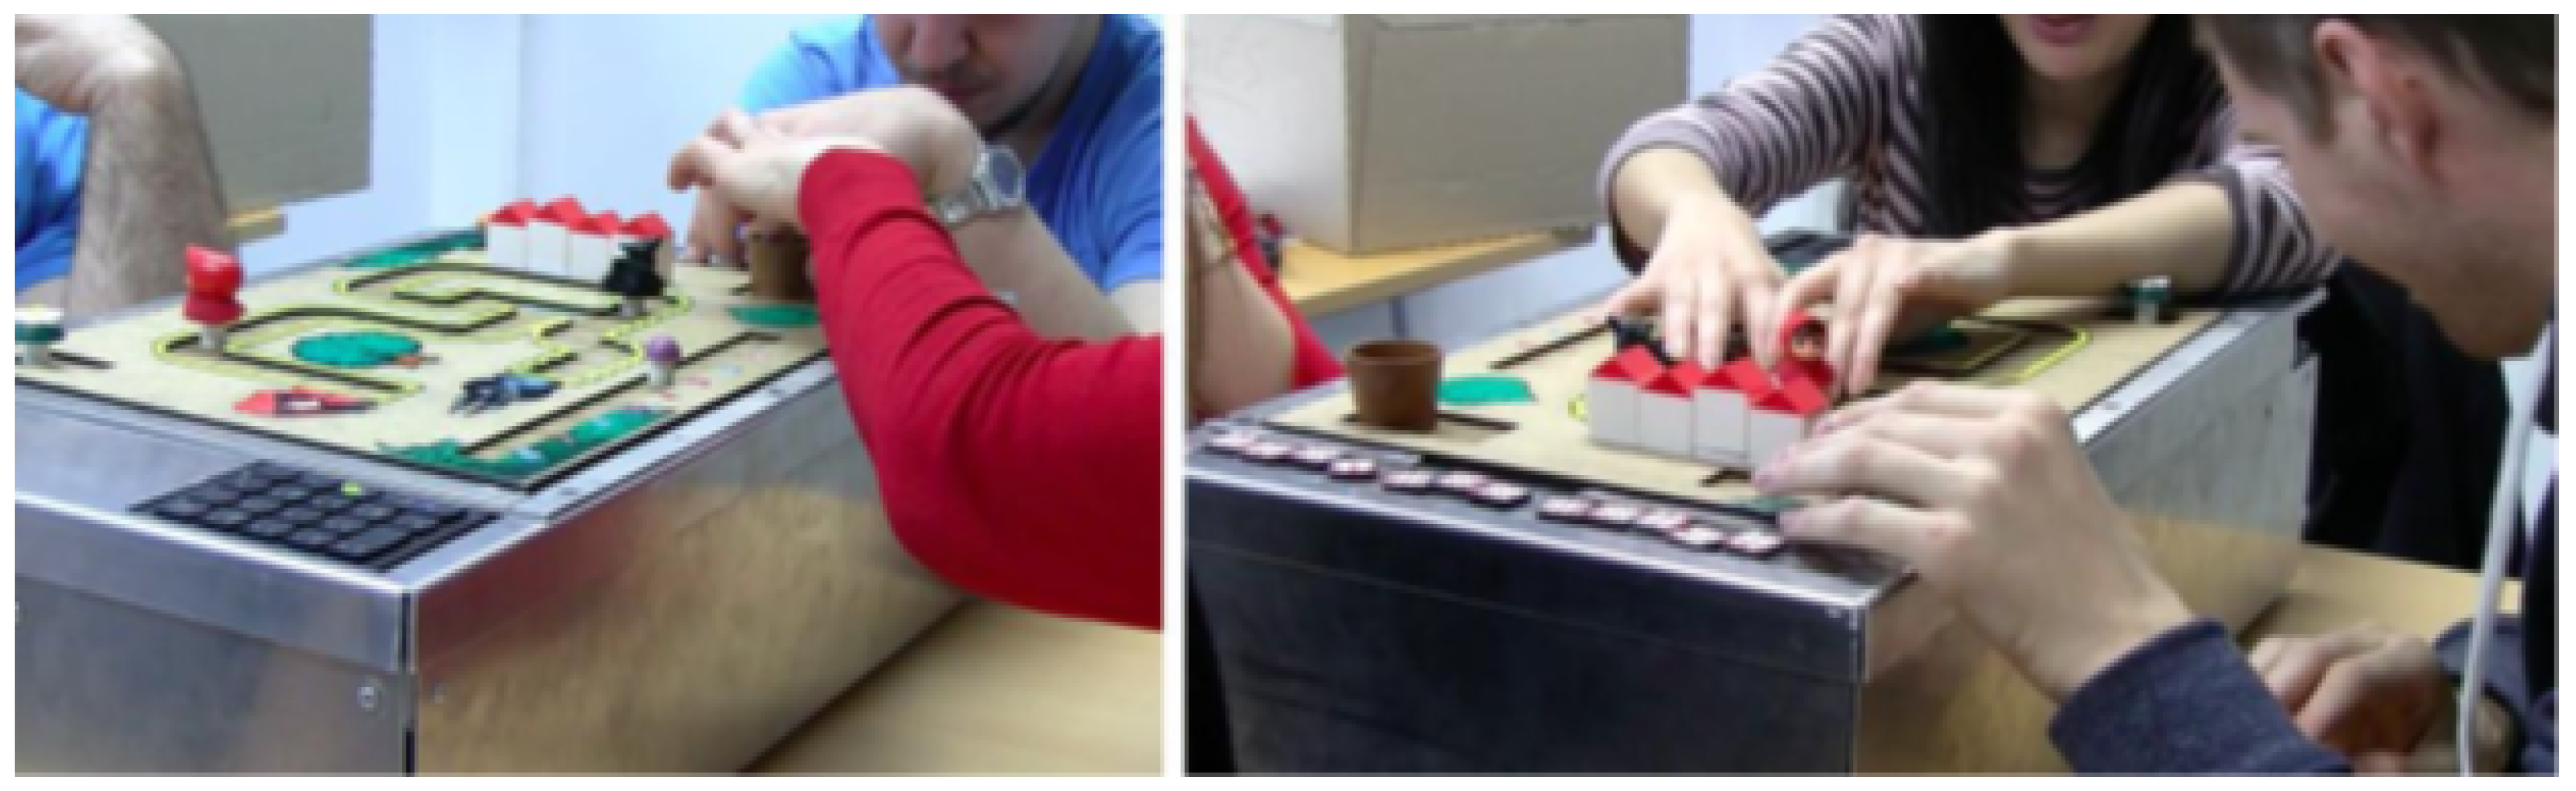
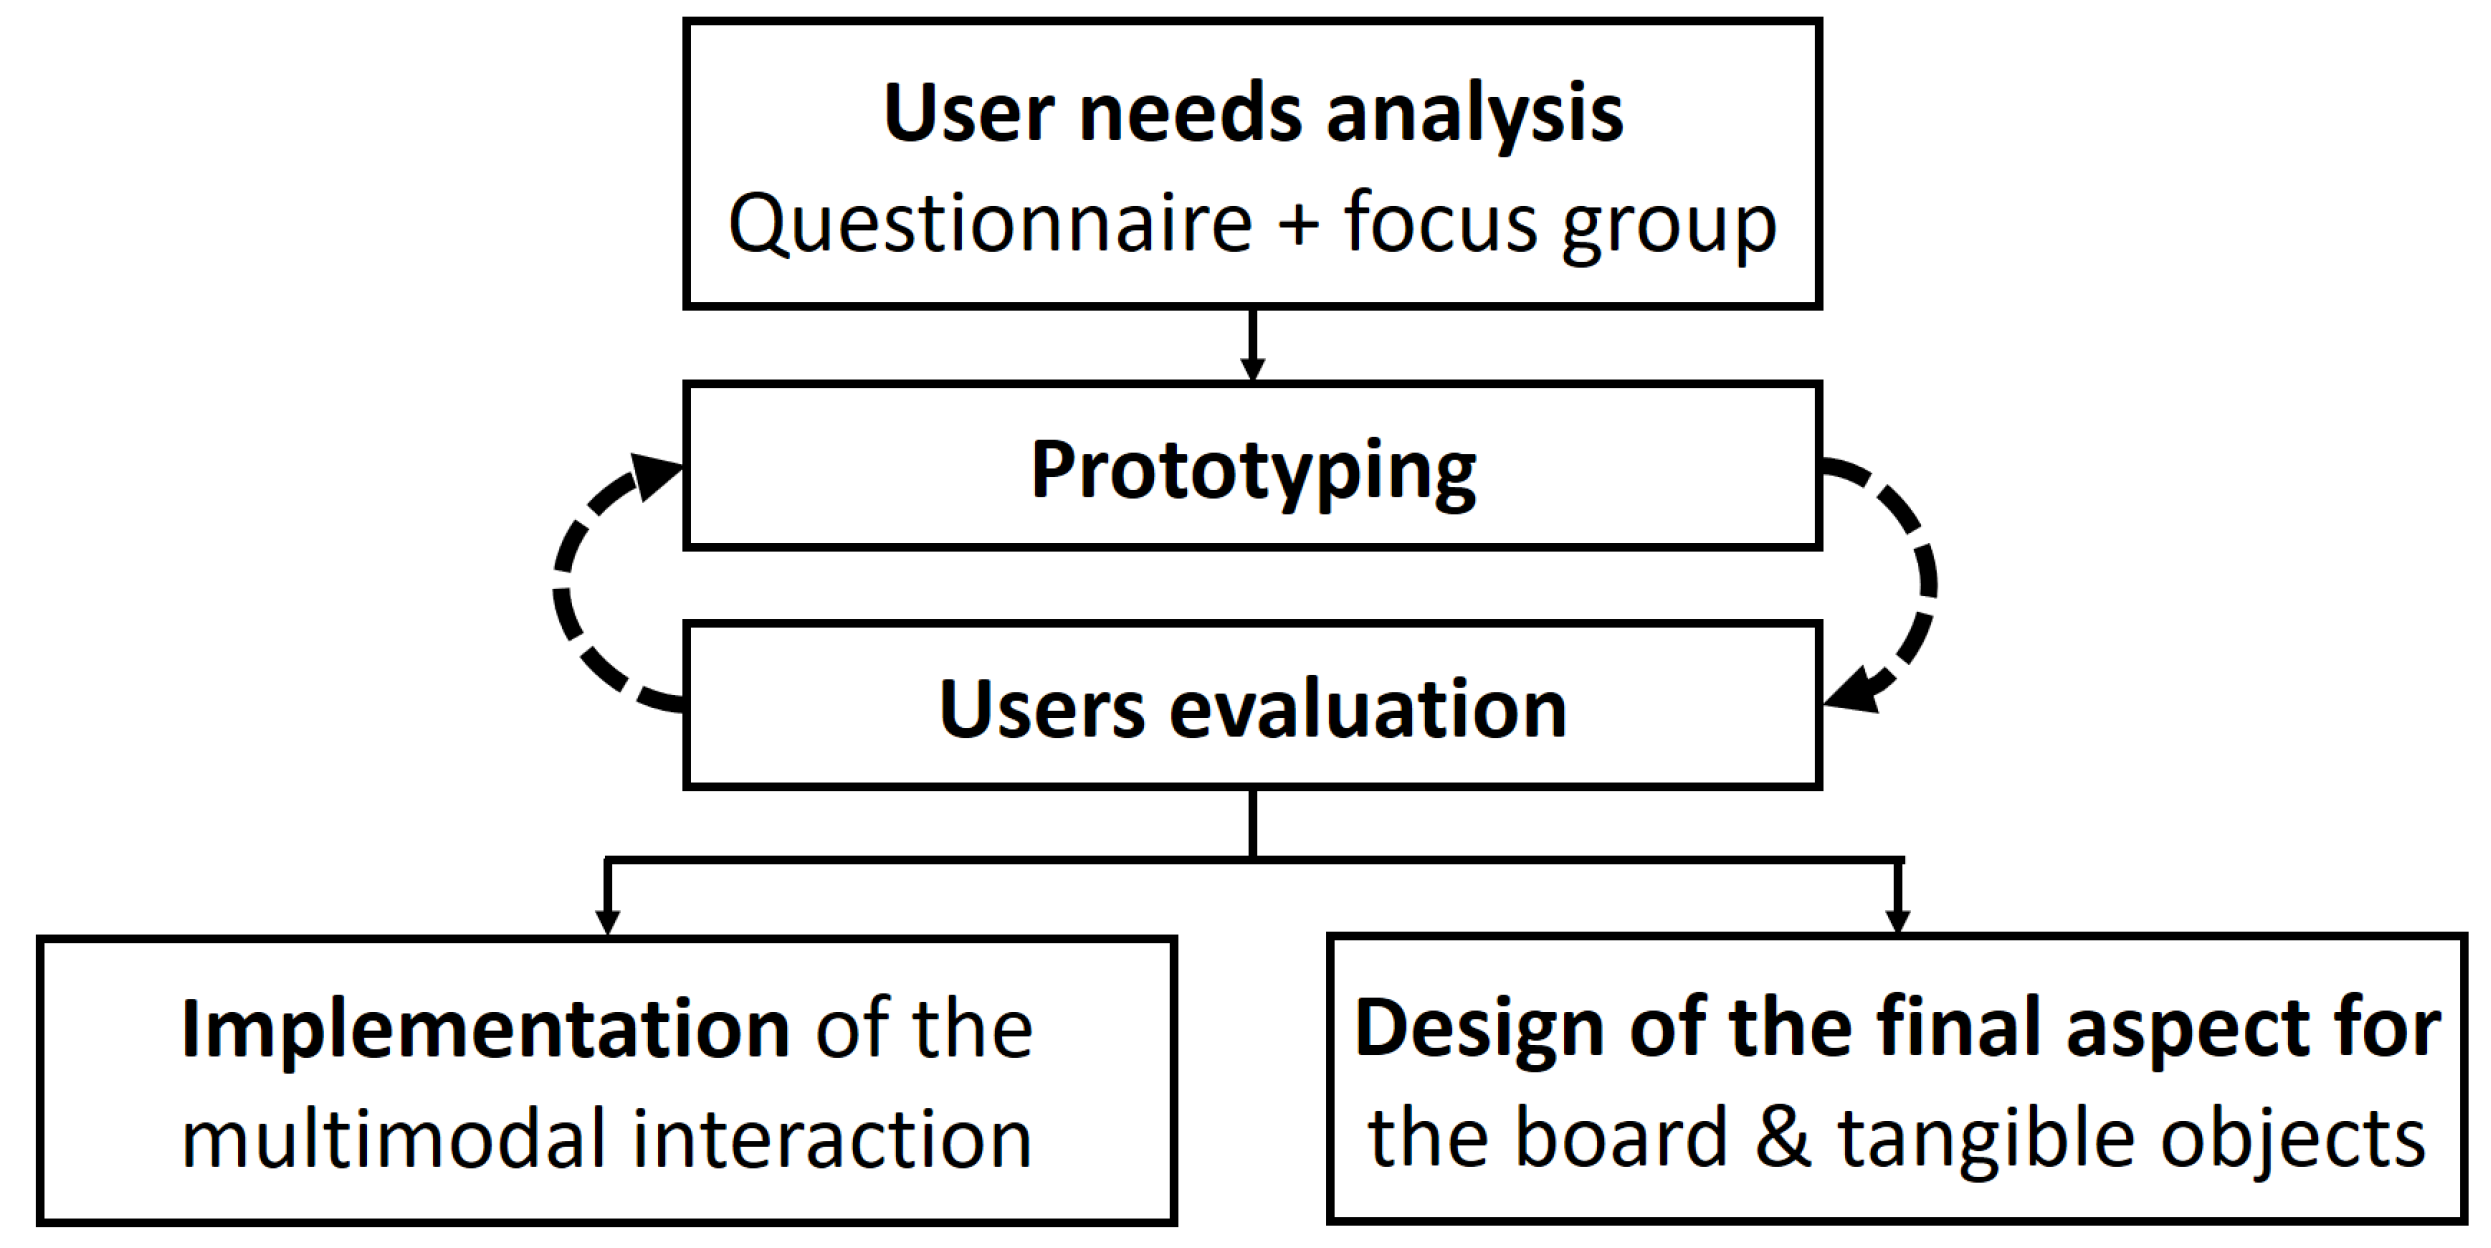


