1. Introduction
Progressing research and development in immersive assistance systems open new opportunities for further use cases. The proofs of concept in an industrial context are also increasing. However, the high complexity of the systems continues to inhibit the acceptance, and thus, crossing of the productive threshold. The main potential of immersive assistance systems lies in their ability to present the right information in the right place at the right time, thus enabling users to perform the same amount of work in less time with less perceived workload; see [
1]. In this context, immersive assistants can record a lot of information in a limited lapse of time, especially for hands-free operation, thanks to voice input. The challenge here remains the resilience under real operating conditions in an industrial environment. Associated literature on cognitive immersive assistance systems (ASs) shows that people reject assistance systems due to a lack of acceptance and previous negative experiences, among other things (see [
2,
3]). This hypothesis can be inferred from the socio-technical interaction framework consisting of humans, technology and organization (HTO) (see [
4,
5]), which extends to the so-called Human-(Centered) Cyber-Physical System (HCPS) (see [
6,
7,
8]). Accordingly, to the human–computer interaction loop approach (see
Figure 1), we derived the following question: What is the influence of errors on performance and acceptance with human–machine interaction? The research design of this contribution evaluated the performance of Automatic Speech Recognition (ASR) as an alternative interaction paradigm to gesture control for industrial use of the HMD MS HoloLens 2 (HL2). The industrial environment is a complex challenge for ASR. An industrial site emits high levels of ambient noise wherein resilient ASR performance is required.
2. Related Work
Industry applications in the context of ASR: ASR technology simplifies the industrial use of human–machine interaction with an AS [
9]. By avoiding manual tasks and entering keystrokes, several tasks can be carried out in parallel using an AS (‘while hands or eyes can serve other functions’) [
9]. According to [
9], ASR is spreading and gaining acceptance as a key technology in ASs across various industrial fields. Today, ASR technology is used in several areas of ASs, such as medical, industrial, forensics, law enforcement, defense, aerospace, telecommunication, home automation, access control and consumer electronics, and is widely accepted [
9].
Advantage of industrial ASR: Speech input is intended to reduce workers’ fatigue and increase the speed and flexibility of command transmission, as the hands can handle other tasks simultaneously. ASR results in less exhaustion and intuitively involves the operator in the workflows [
9]. The speech interaction assists in monitoring and operating the machines, enabling the completion of the assigned tasks more easily, faster and with less effort [
10]. ASR supports handicapped employees, and hence, is helpful for inclusion [
9].
ASR in augmented reality technology: As an alternative interaction technique to gestures, ASR can be used on the MS HoloLens [
11,
12] because text input via gesture was measured to be very slow on the MS HoloLens 1 (5.41 words per minute) [
10]. ASR is not limited to the immersive application itself but also facilitates control over production machines and robots via connected interfaces (e.g., OPC-UA). Speech commands (SPCs), like ‘start or stop production’, among other parameters, or navigating menu structures of integrated machines are made possible [
13].
Evaluation of ASR: In studies, different ASR engines have already been tested with audio files from different sources on participants using the Word Error Rate (WER) metric (see [
14,
15,
16]). ASR was investigated in industrial studies but was deemed incapable of use at Sound Pressure Levels (SPLs) > 81 dB. Between 81 dB and 84 dB, 90% of SPCs were not received [
17]. SPC capabilities were also evaluated on the HL2 but under laboratory conditions. In addition, only correctness was measured and the effective information payload per time was not considered [
16]. On the MS HoloLens 1 (HL1), the research design and results (
n = 16) were tested in terms of the parameters input speech, WER, perceived workload and perceived system usability as a function of SPL exclusively involving native speakers [
18]. Based on the research design of [
18], a study was conducted (with
n = 16 participants) on the HL2 (research design was replicated and extended to further HCI assessments). However, no statistically significant differences in the WER were demonstrated in relation to the SPL conditions. The mean WER was measured at various SPL conditions of 36%, 68% and 48%. No statistically significant differences were found for the perceived system usability in the given experimental setup [
19].
Motivation: Errors in an AS influence technology acceptance and the effective performance of humans and machines, depending on the level of automation [
20]. With automation support or the use of an AS, studies indicate that acceptance depends on the reliability of the system [
21]. Over the last decade, user-related studies have been conducted on immersive systems spanning various fields, considering usability, emotion, cognitive load, attention, learnability, decision making, etc. [
22,
23,
24]. It can be summarized that there are challenges to overcome for AR technology as an interface between humans and machines.
Research demand: In general, the error weighting needs to be explored in detail regarding the acceptance factors [
25,
26]. The contributions about taxonomies of errors in ASs (see [
27,
28,
29]) require a focus on the error effects. To be successful in ASR applications, the limitations of current technology must be adequately considered [
9]. Most voice interface technology providers engage with users to understand the crucial human factors that influence product usage and applications [
9]. The reference scenarios of the related work were carried out under simplified conditions. In a preliminary study, considerable issues occurred due to ambient noise. The participants were asked to interact with the system using ASR during a pick-and-place task. The ambient noise caused significant errors in the ASR, which was detrimental to the task, and thus, the study was discontinued. As a result, ASR was replaced with a Bluetooth clicker, which enabled the study to proceed successfully [
30]. It should be noted that contrary to the recommendation of [
31], a single-syllable word was used. However, some industrial tasks require the flawless hands-free operation of systems that make alternative means of interaction imperative. It is necessary to evaluate the capabilities and effects of the HL2 under SPLs found in an industrial environment [
18].
3. Methodology
A research demand was identified in accordance with the preliminary work. Objectives, research questions and hypotheses were derived from this. The conducted study was part of an overarching research model. This model for error analysis was derived from the HCPS approach (see [
4,
5,
6]) and was based on a control loop (human–computer interaction loop; see [
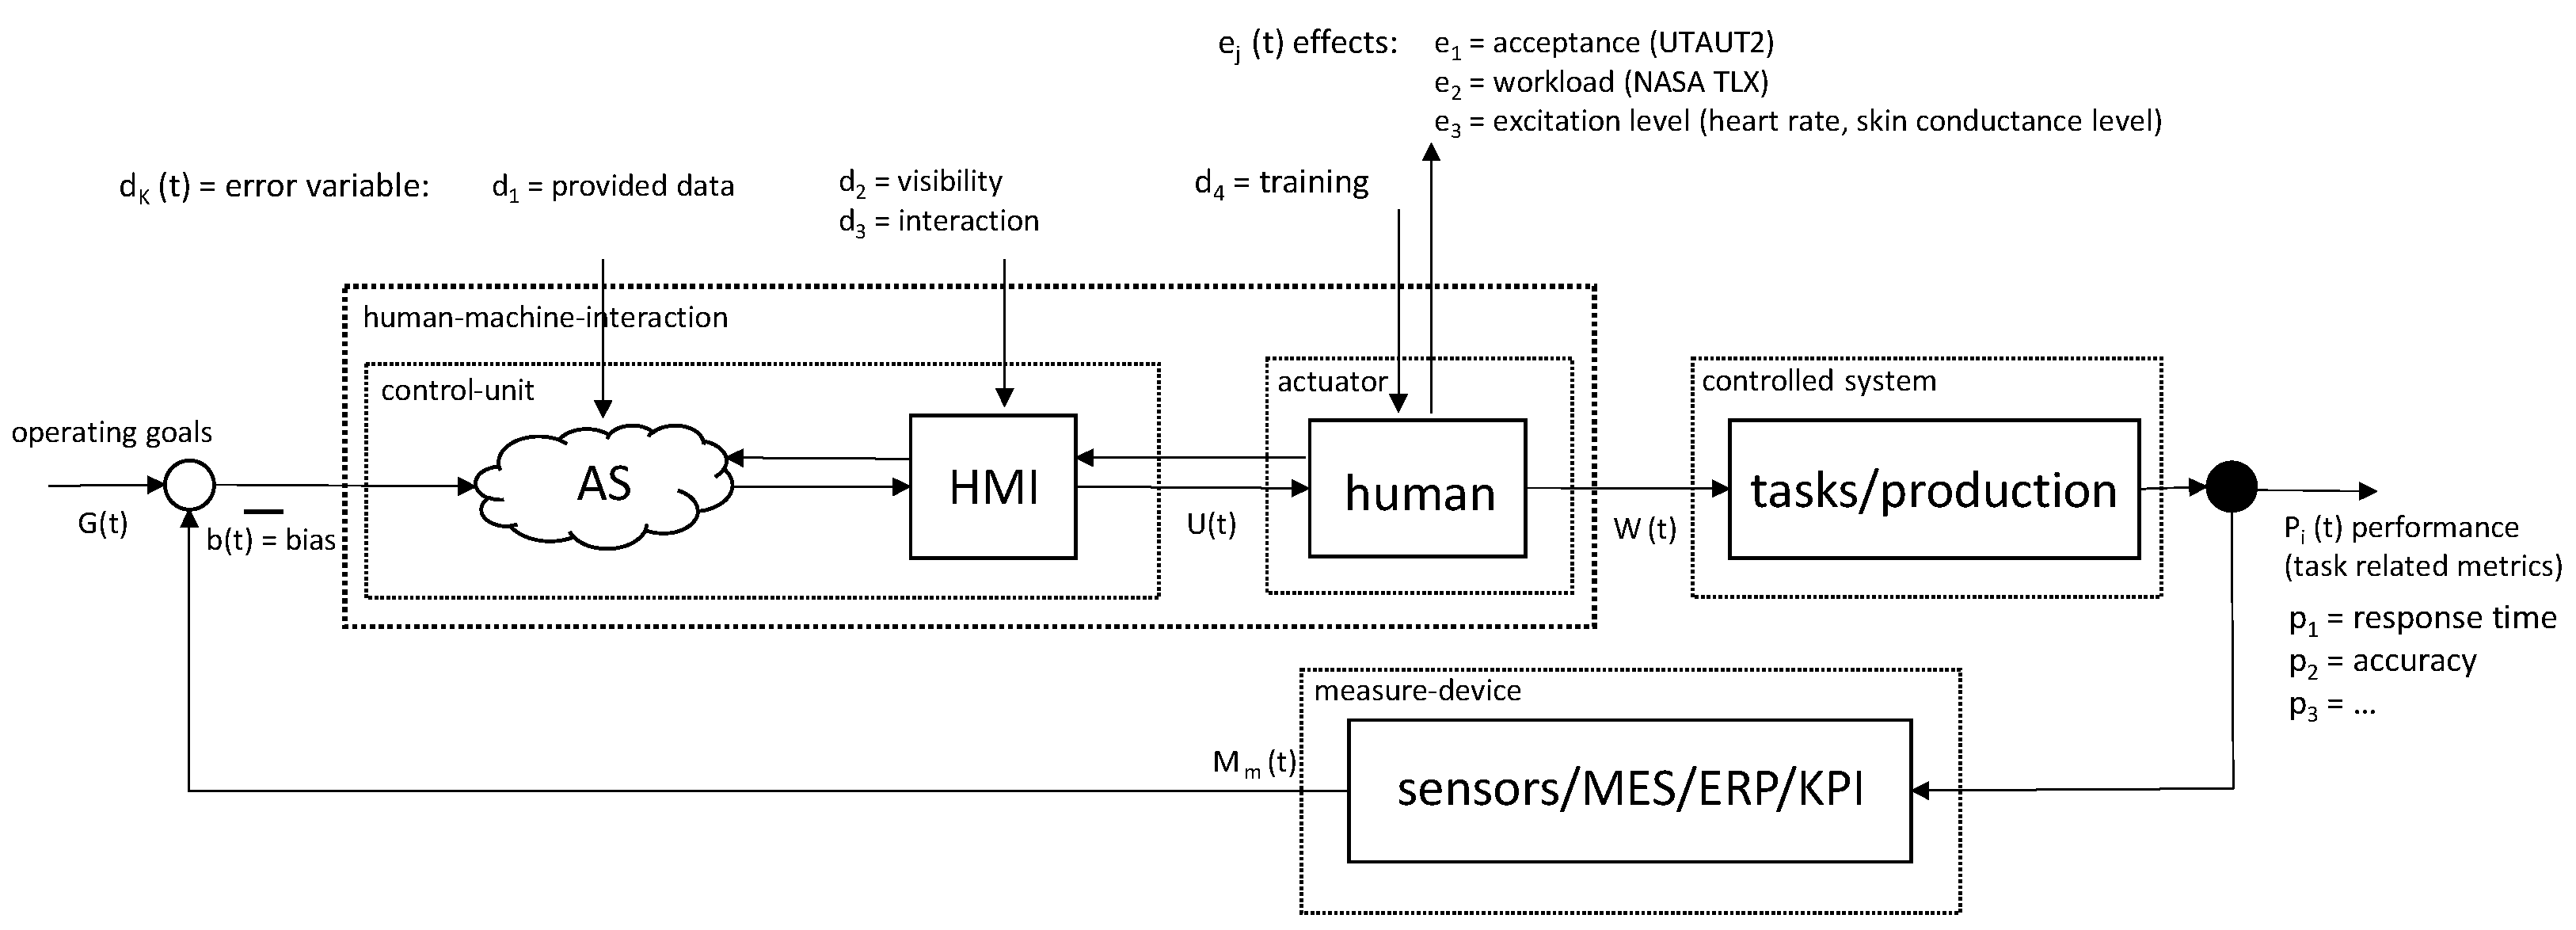
25]). The model was designed to investigate errors and their effects on immersive assistance systems in operational tasks in an industrial context. The model consisted of the following components (see
Figure 1).
The control unit consisted of the assistance system and the HMI. It was tasked with comparing the data that originates from the measuring device (e.g., KPI) with the stated operating goals. The prepared data, including the recommended action, was presented to the actuator (human) adapted to the situation. Therefore, the control unit and actuator combined form the human–machine interaction. The human as the actuator followed the provided recommended actions toward the controlled system (e.g., machine in the factory). The model analyzed the effects of data, visibility, interaction, and training errors on performance, acceptance and stress.
In this model, the independent variable errors d
k acted as stimuli and the corresponding dependent variable effects e
j and effective performances p
i were investigated; see
Table 1.
According to related work, there is a research demand for speech input within immersive applications for industrial contexts. Therefore, from the overall research context, only the voice interaction was evaluated here toward performance and acceptance in an adverse industrial noise environment. The low performance of the ASR induced by a high ambient noise represented the interaction error d3. The dedicated research design was developed to answer the following research questions:
Research question 1: Is Automatic Speech Recognition capable as an interaction design in an industrial environment on a current AR HMD?
Research question 2: What influence does erroneous Automatic Speech Recognition have on user acceptance?
Based on the results and the discussion of the related work, the following hypotheses could be derived:
Hypothesis HA.1.: The Sound Pressure Level has a negative impact on the performance of Automatic Speech Recognition on an MS HoloLens 2.
Hypothesis HB.1.: Automatic Speech Recognition on an MS HoloLens 2 performs better in stationary rather than non-stationary ambient noise.
Hypothesis HC.1.: Erroneous Automatic Speech Recognition reduces the user acceptance of an assistance system on an MS HoloLens 2.
(The corresponding HA.0/B.0/C.0 hypotheses are negated accordingly.)
3.1. Design of Experiment
The research design was a counterbalanced within-subject design. The metrics of WER and Information Transfer Rate (ITR) were considered as dependent variables to measure the ASR performance. As a reference measurement, the WER was collected in parallel on an Apple iPad Pro 12.9. To measure the acceptance, the metrics of the UTAUT2 questionnaire were surveyed. For further analysis, the perceived workload of the NASA TLX questionnaire and the physiological parameters were recorded to determine the stimulation level (e.g., technostress). The independent variables were the SPL, the stationarity of the ambient noise and the experimental order.
Word Error Rate: the metric used to measure performance was the WER according to Equation (1); see [
14,
15,
16,
17,
18]:
Information transfer rate: to evaluate the quality (number of correct commands in relation to the time consumed) of the SPC capability, the ITR index was calculated based on the metric for evaluating brain–computer interfaces (see [
35]); see Equations (2)–(4):
where
B—information transferred in bits per trial,
N—number of targets and
P—classification accuracy.
UTAUT2: The standardized UTAUT2 questionnaire was used to assess the acceptance and the inherent sub-dimensions; see [
32]. The UTAUT2 item price value was consciously not asked because, in the industrial context, monetary considerations do not play a role for the user.
NASA TLX: the standardized NASA TLX questionnaire assessed the impact of errors on workload.
Physiological parameter: the Empatica E4 wearable device measured the level of stress via the metrics of the heart rate level and skin conductance level; see [
36,
37].
Text input: All participants were native German speakers and spoke the following text (seven inhomogeneous sentence fragments consisting of 39 words):
Original version (German):
‘Platziere den Gabelstapler im Raum
Fenster im Raum anheften
Ich denke also bin ich
Ich glaube also bin ich
Arbeit besiegt alles unablässiges Mühen bezwingt alles bringt alles fertig
Gehe zum Ende des Paragraphen
Gehe zum Anfang des Paragraphen‘
Translated version (English):
‘Place the forklift in the room
Attach the window in the room
I think therefore I am
I believe therefore I am
Work conquers all ceaseless struggle conquers all accomplishes all
Go to the end of the paragraph
Go to the beginning of the paragraph’
Sound Pressure Level: For the definition of the SPL, measurements (machining industry) were carried out in real industrial production, and the legal requirements (see [
38]) were also considered. The lower value of 64.2 dB(A) was measured as the average minimum value on the shop floor; 85 dB(A) was the upper value as an exposure limit for 8 h a day due to regulatory requirements regarding safety at work (see [
38], paragraph 1b of Article 3). The SPL value of 87 dB represents the maximum permissible exposure limit (see [
38], paragraph 1a of Article 3). The SPL value of 0 dB(A) was chosen, at which no noise was emitted by the speakers. It is explicitly stated that the study was carried out with all participants wearing appropriate noise protection.
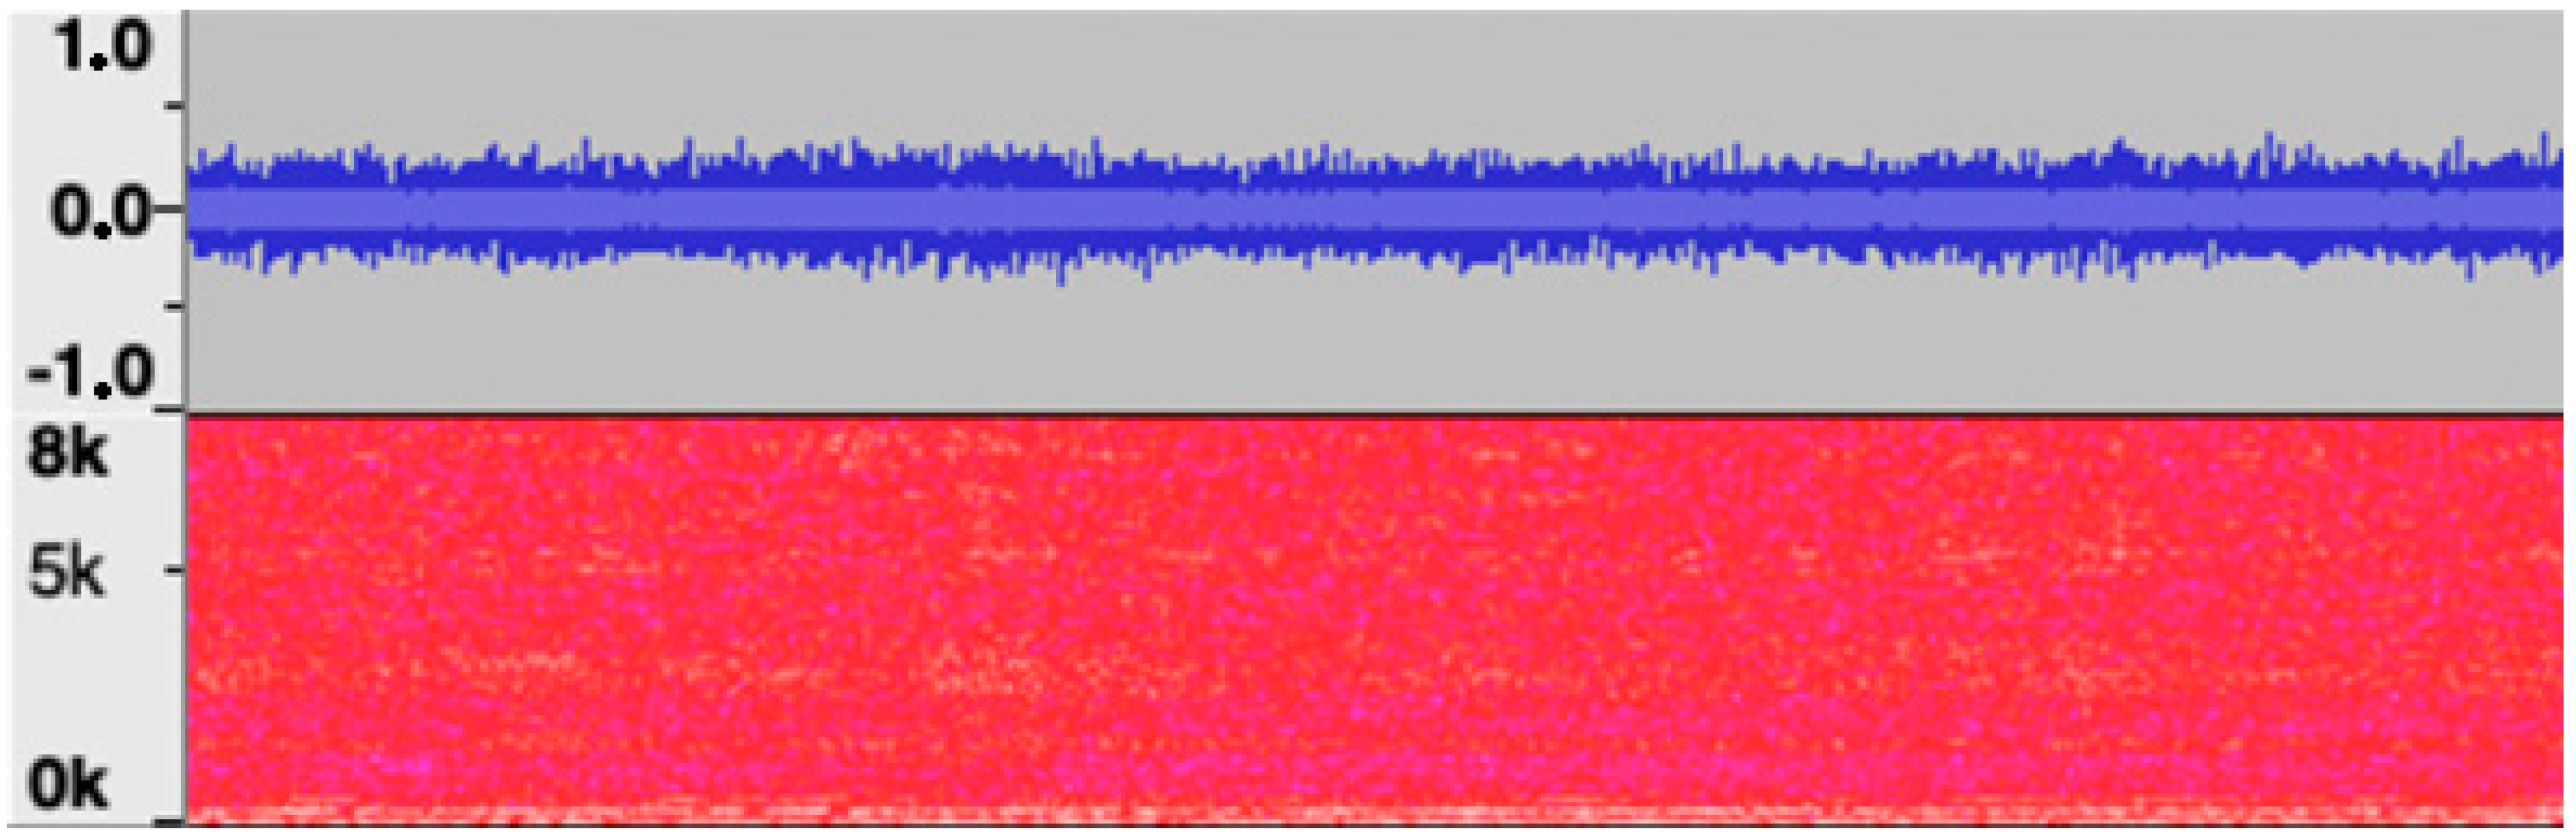
Stationarity: For the industrial noise, an audio recording of a water jet cutting machine was used. The spectrogram of the stationary signal (water jet cutting) shown in
Figure 2 presents an almost constant spectrum over time (stationarity). It can be assumed that a stationary background noise is easier to fade out for both humans and algorithms than a non-stationary one; see [
39].
Figure 2.
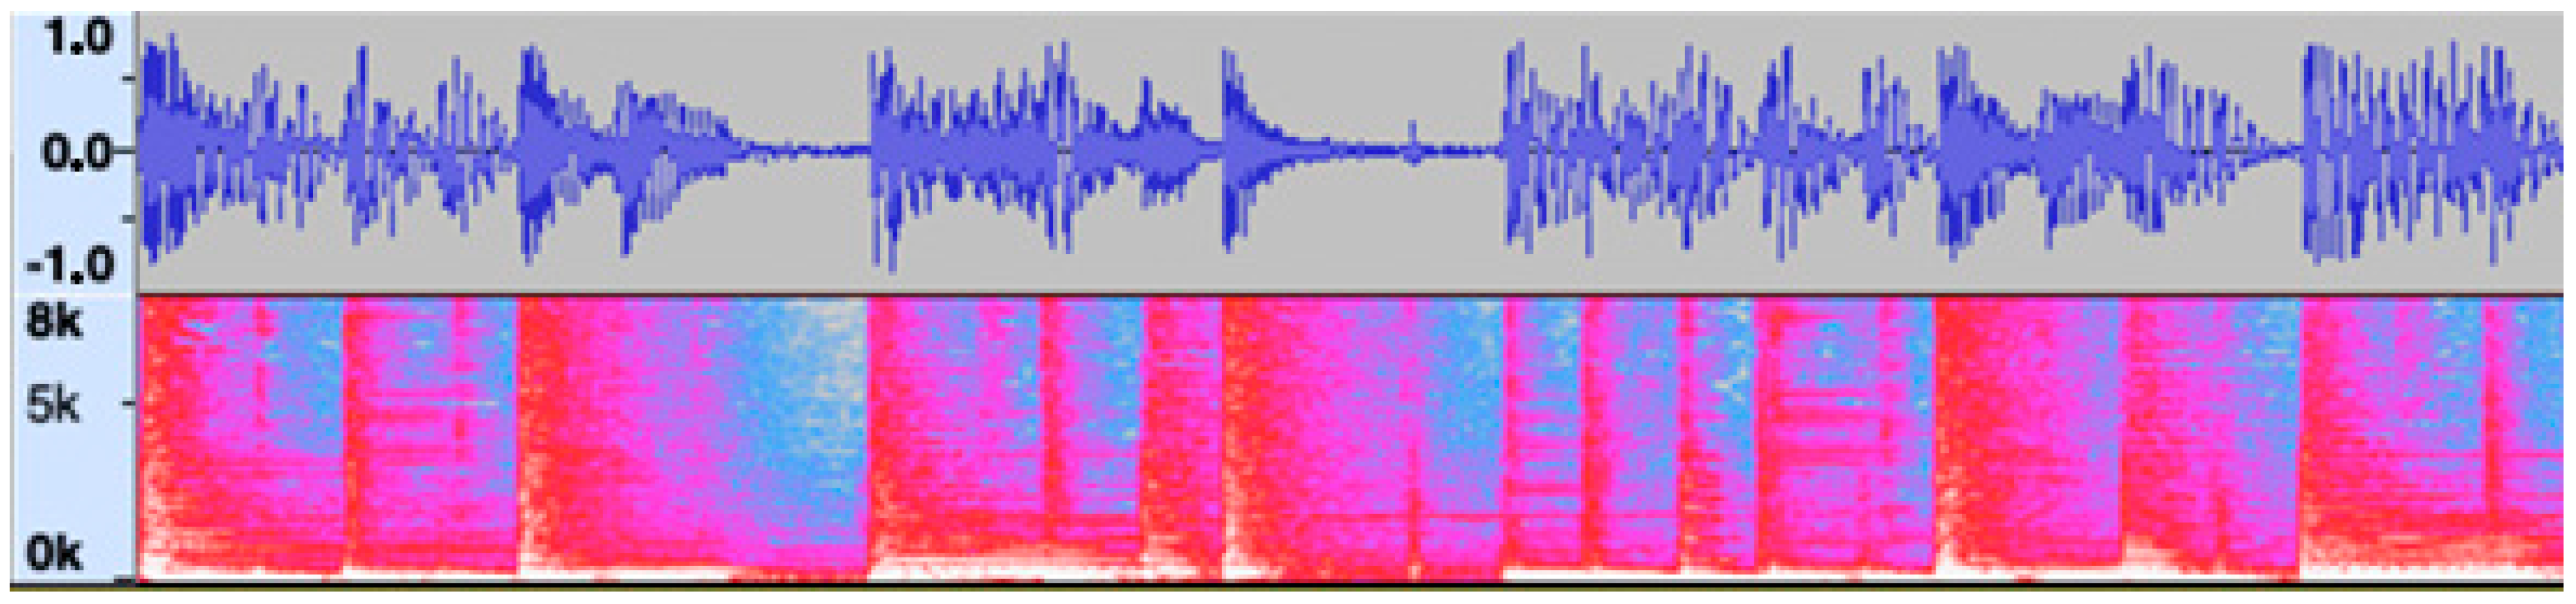
Water jet cutting analysis: top shows the amplitude and bottom the spectrogram of the stationary signal.In contrast, to investigate the influence of stationarity, a non-stationary signal (free jazz) was also examined; see
Figure 3.
Figure 2.
Water jet cutting analysis: top shows the amplitude and bottom the spectrogram of the stationary signal.In contrast, to investigate the influence of stationarity, a non-stationary signal (free jazz) was also examined; see
Figure 3.
Figure 3.
Free jazz analysis: top shows the amplitude and bottom the spectrogram of the stationary signal.
Figure 3.
Free jazz analysis: top shows the amplitude and bottom the spectrogram of the stationary signal.
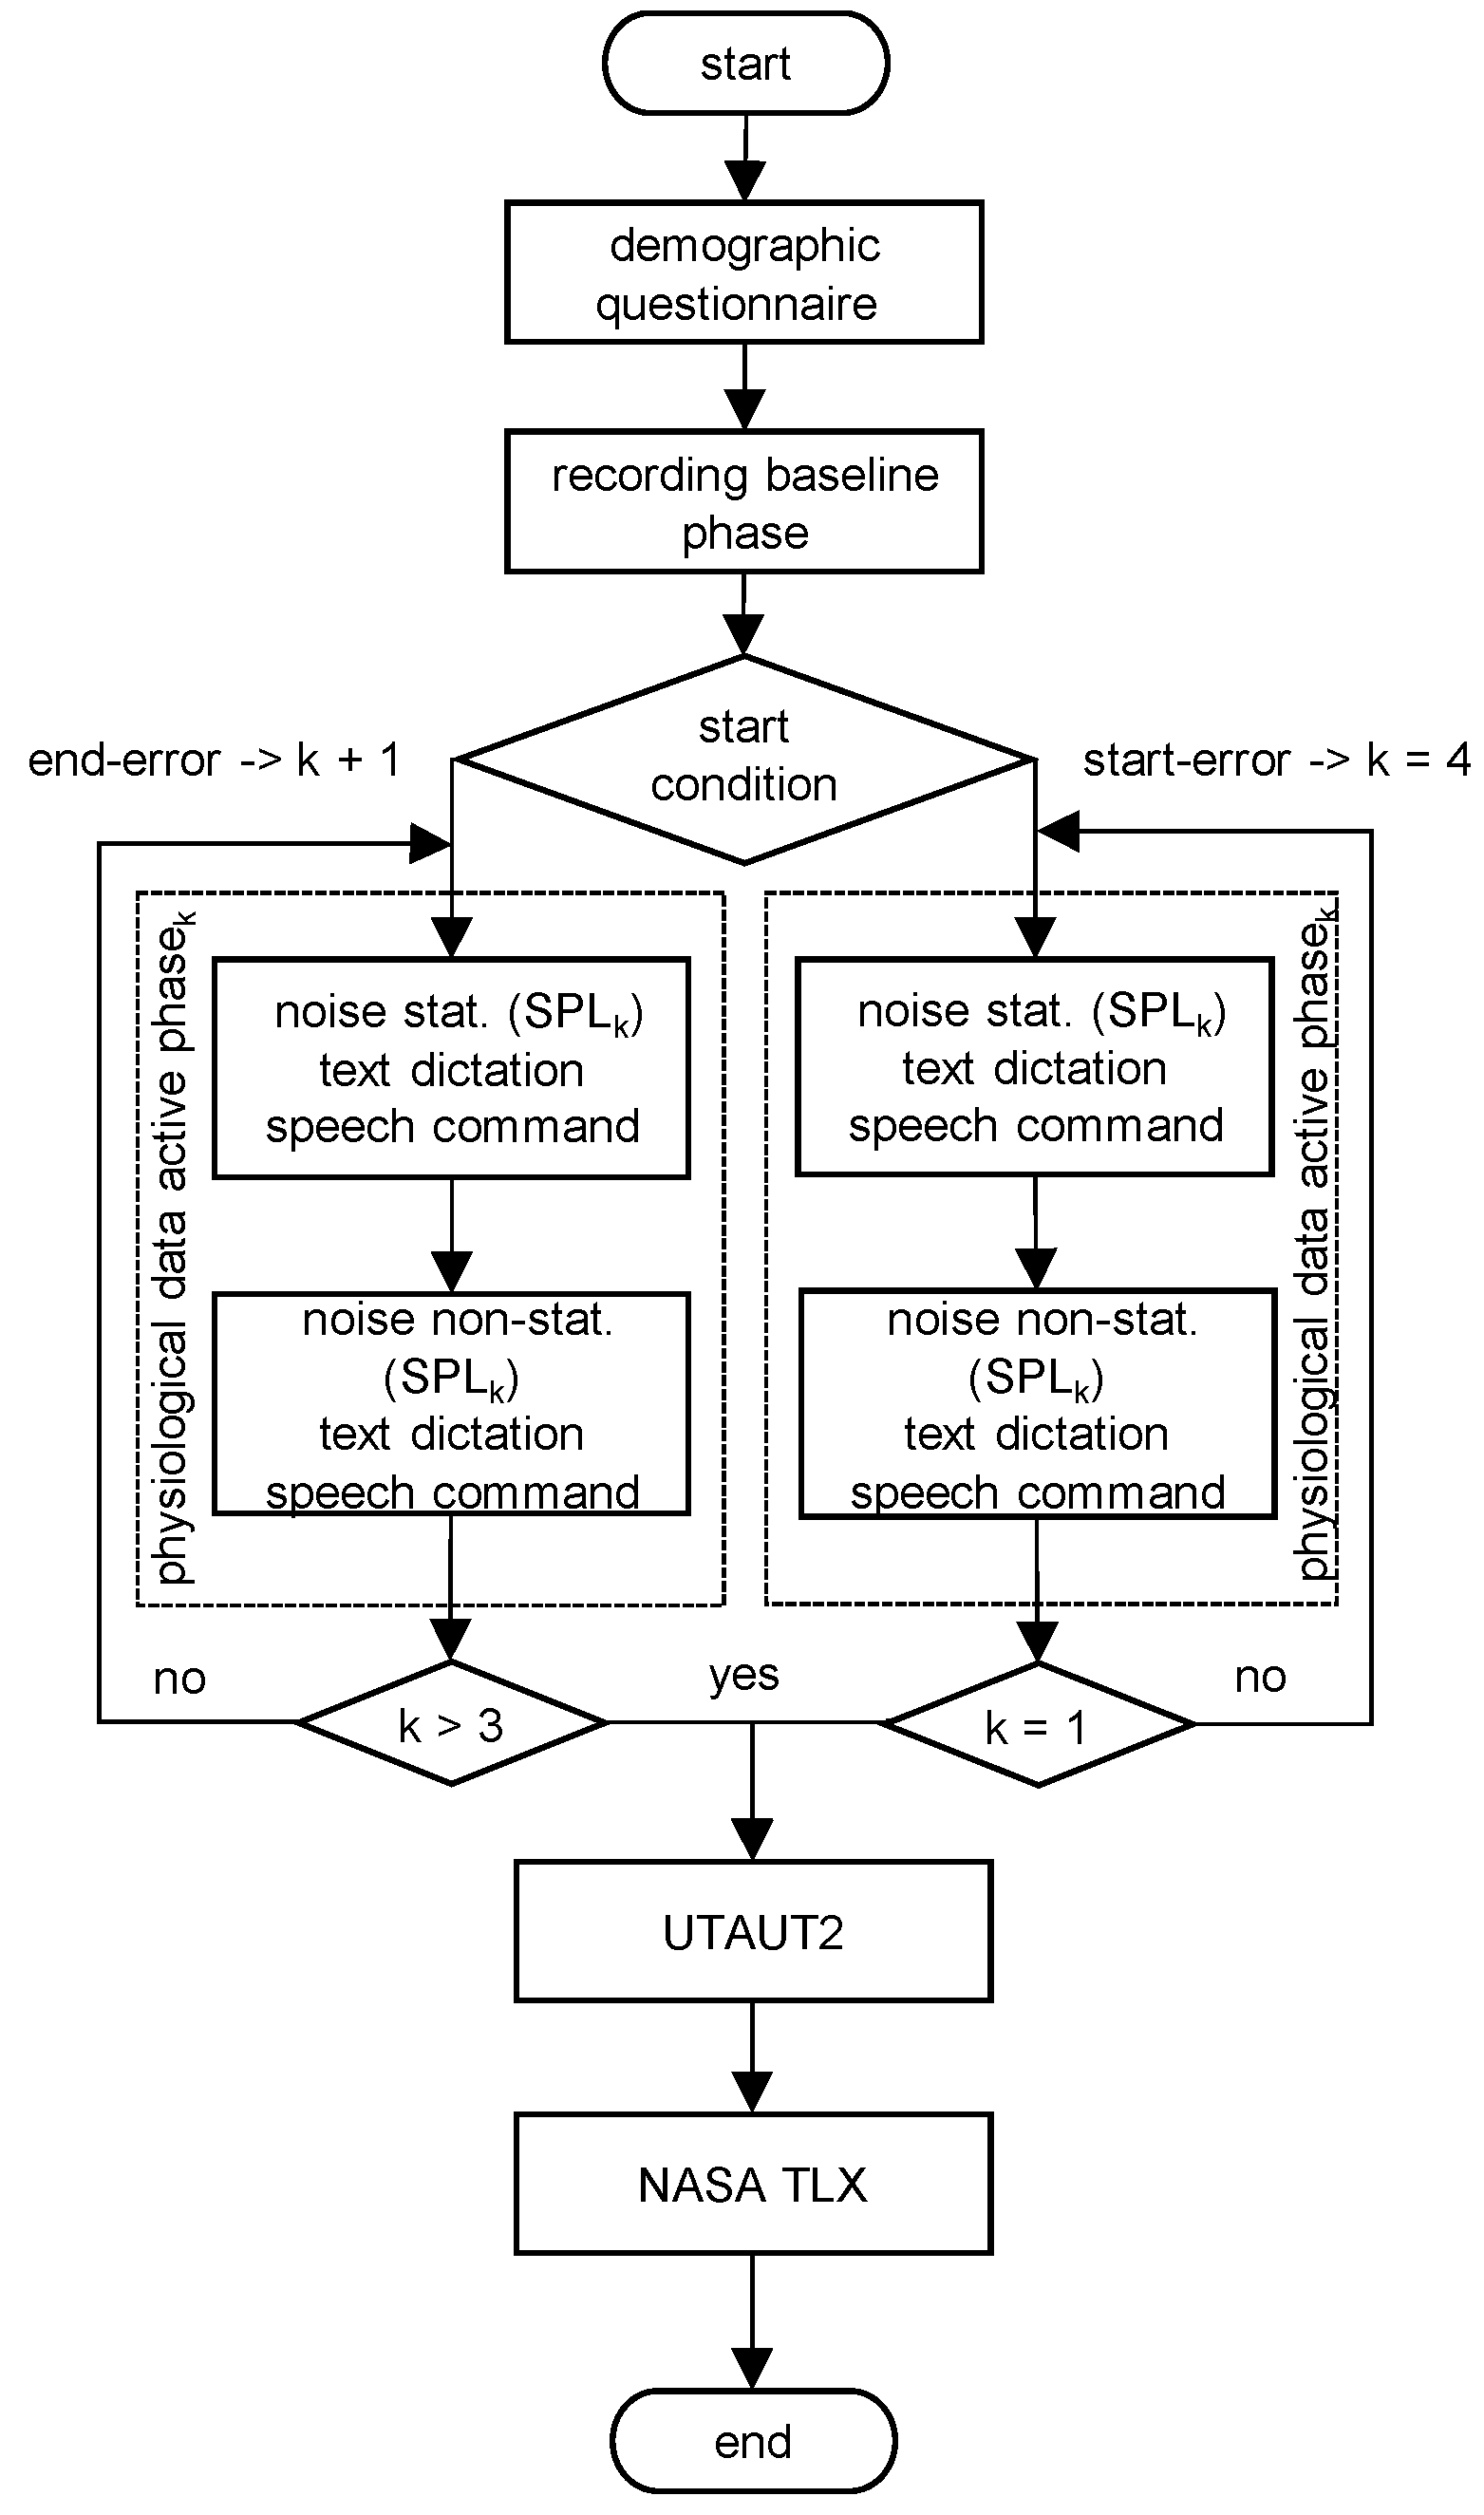
Experimental order: Two experimental orders were defined as groups. In one group (start error), the participants started in two loud conditions (SPLs 86.9 dB(A) and 84.9 dB(A)), and afterward, ended in quiet conditions (0 dB(A) and 64.2 dB(A)). In the other group (end error), the experimental order was reversed, starting quietly and ending loudly.
3.2. Experimental Setup
The experiment was conducted in a recording studio (10.5 m × 7.3 m). The concrete walls and floor were covered by a green screen cave.
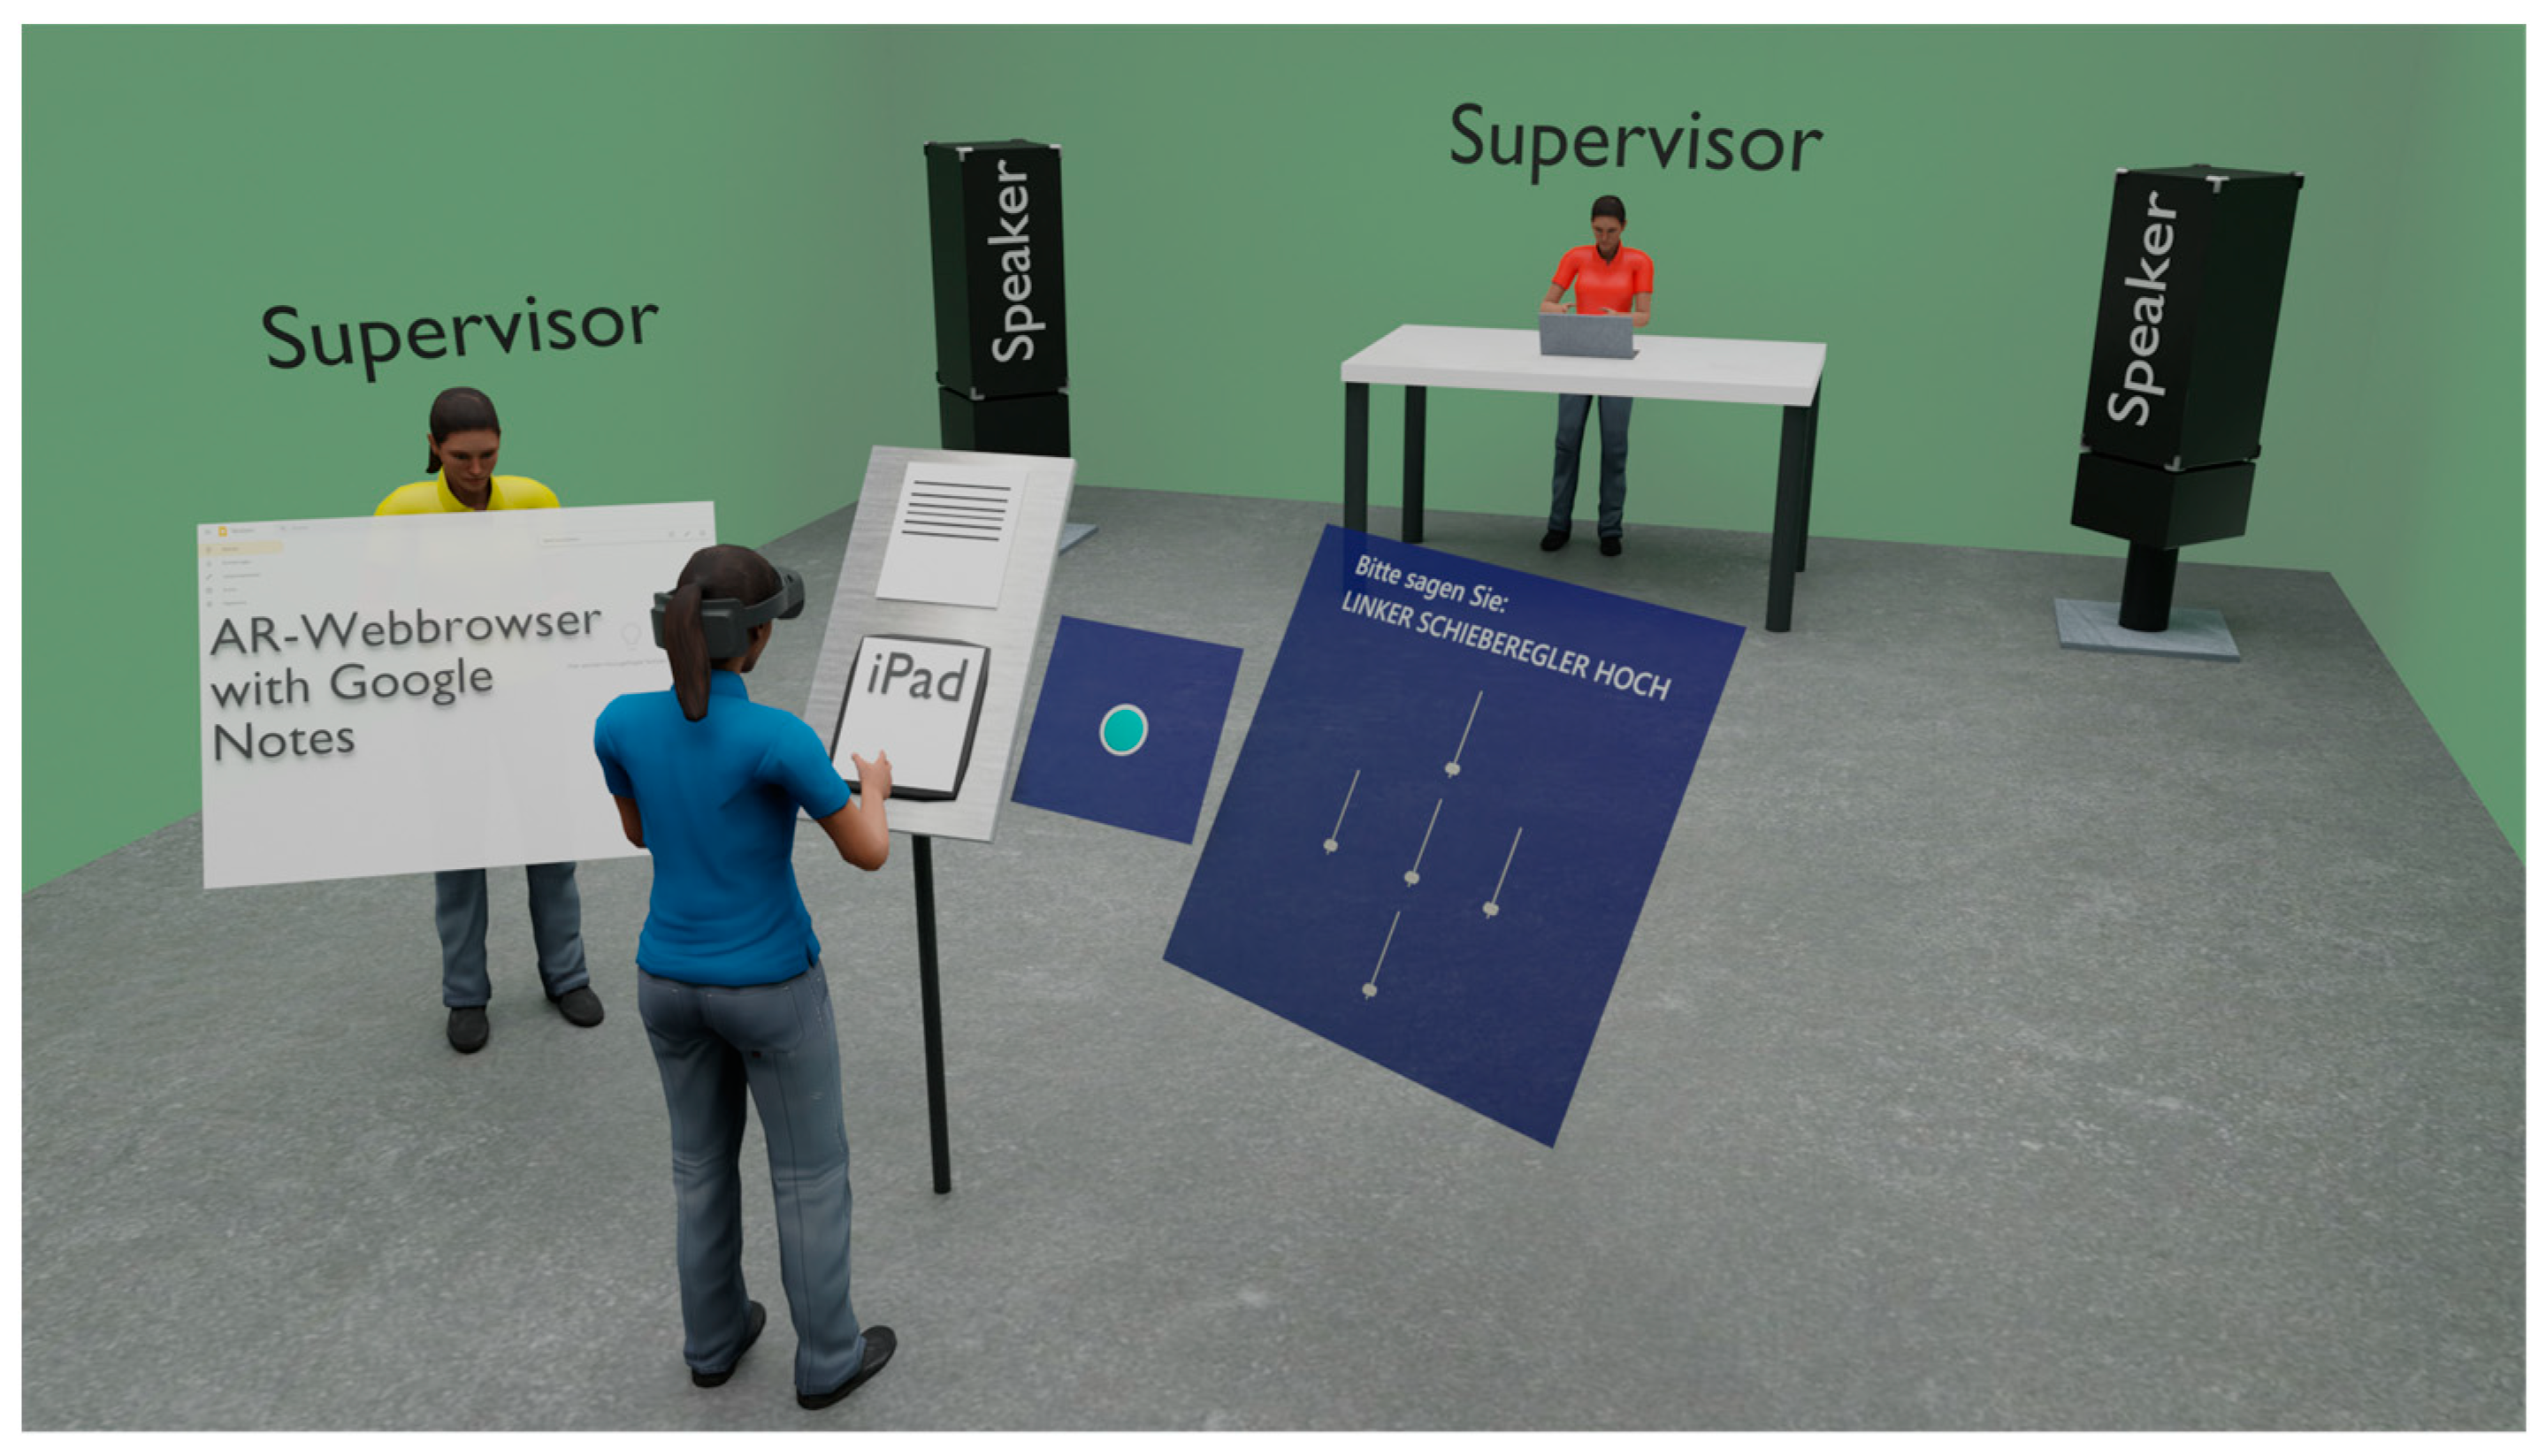
Figure 4 shows the setup schematically.
The speakers (Yamaha MSP5 active speakers) were aligned at a distance of 0.5 m toward the walls at a 45° angle (facing the corners). The goal of the acoustic setting was to recreate a diffuse sound field. In industrial plants, the sound emitted by several machines is reflected by numerous sound-reflecting surfaces, resulting in a diffuse sound field. This creates a constant soundscape in terms of the intensity and temporal distribution (see [
40]). One supervisor of the study at the speakers managed the sound, while the other supervisor instructed the participant. The text to be read was placed in front of the participant, along with the iPad on a stand at approx. 20 cm distance. The aim was to ensure the distance between the mouth reference point to the HL2 was the same as the distance to the iPad. Next to the stand holding the iPad an immersive browser window was shown. It contained the Google Notes website, which documented the output of the HL2s ASR.
3.3. Experimental Plan
The study was conducted according to the experimental flowchart; see
Figure 5. At the beginning of the experiment, the participants were asked to answer a socio-demographic questionnaire. Subsequently, the so-called relaxation phase (baseline) of the physiological parameters was measured for 5 min using the wearable Empathica E4. Next, the participant was equipped with the HL2 and noise protection. The experimental groups and conditions were randomized. During the action phase (execution of the experiment), the physiological parameters were recorded. For each SPL, the following procedure was applied: Depending on the experimental order, the volume was calibrated according to the experimental plan using the external sound card Scarlett 2i2 (controlled by device Digital Sound 8928).
Then, the ambient noise with the respective SPL and stationarity was played to the participant while they spoke the text. Afterward, the research application for investigating the SPC was started. The participant had to press the virtual button (turquoise), see
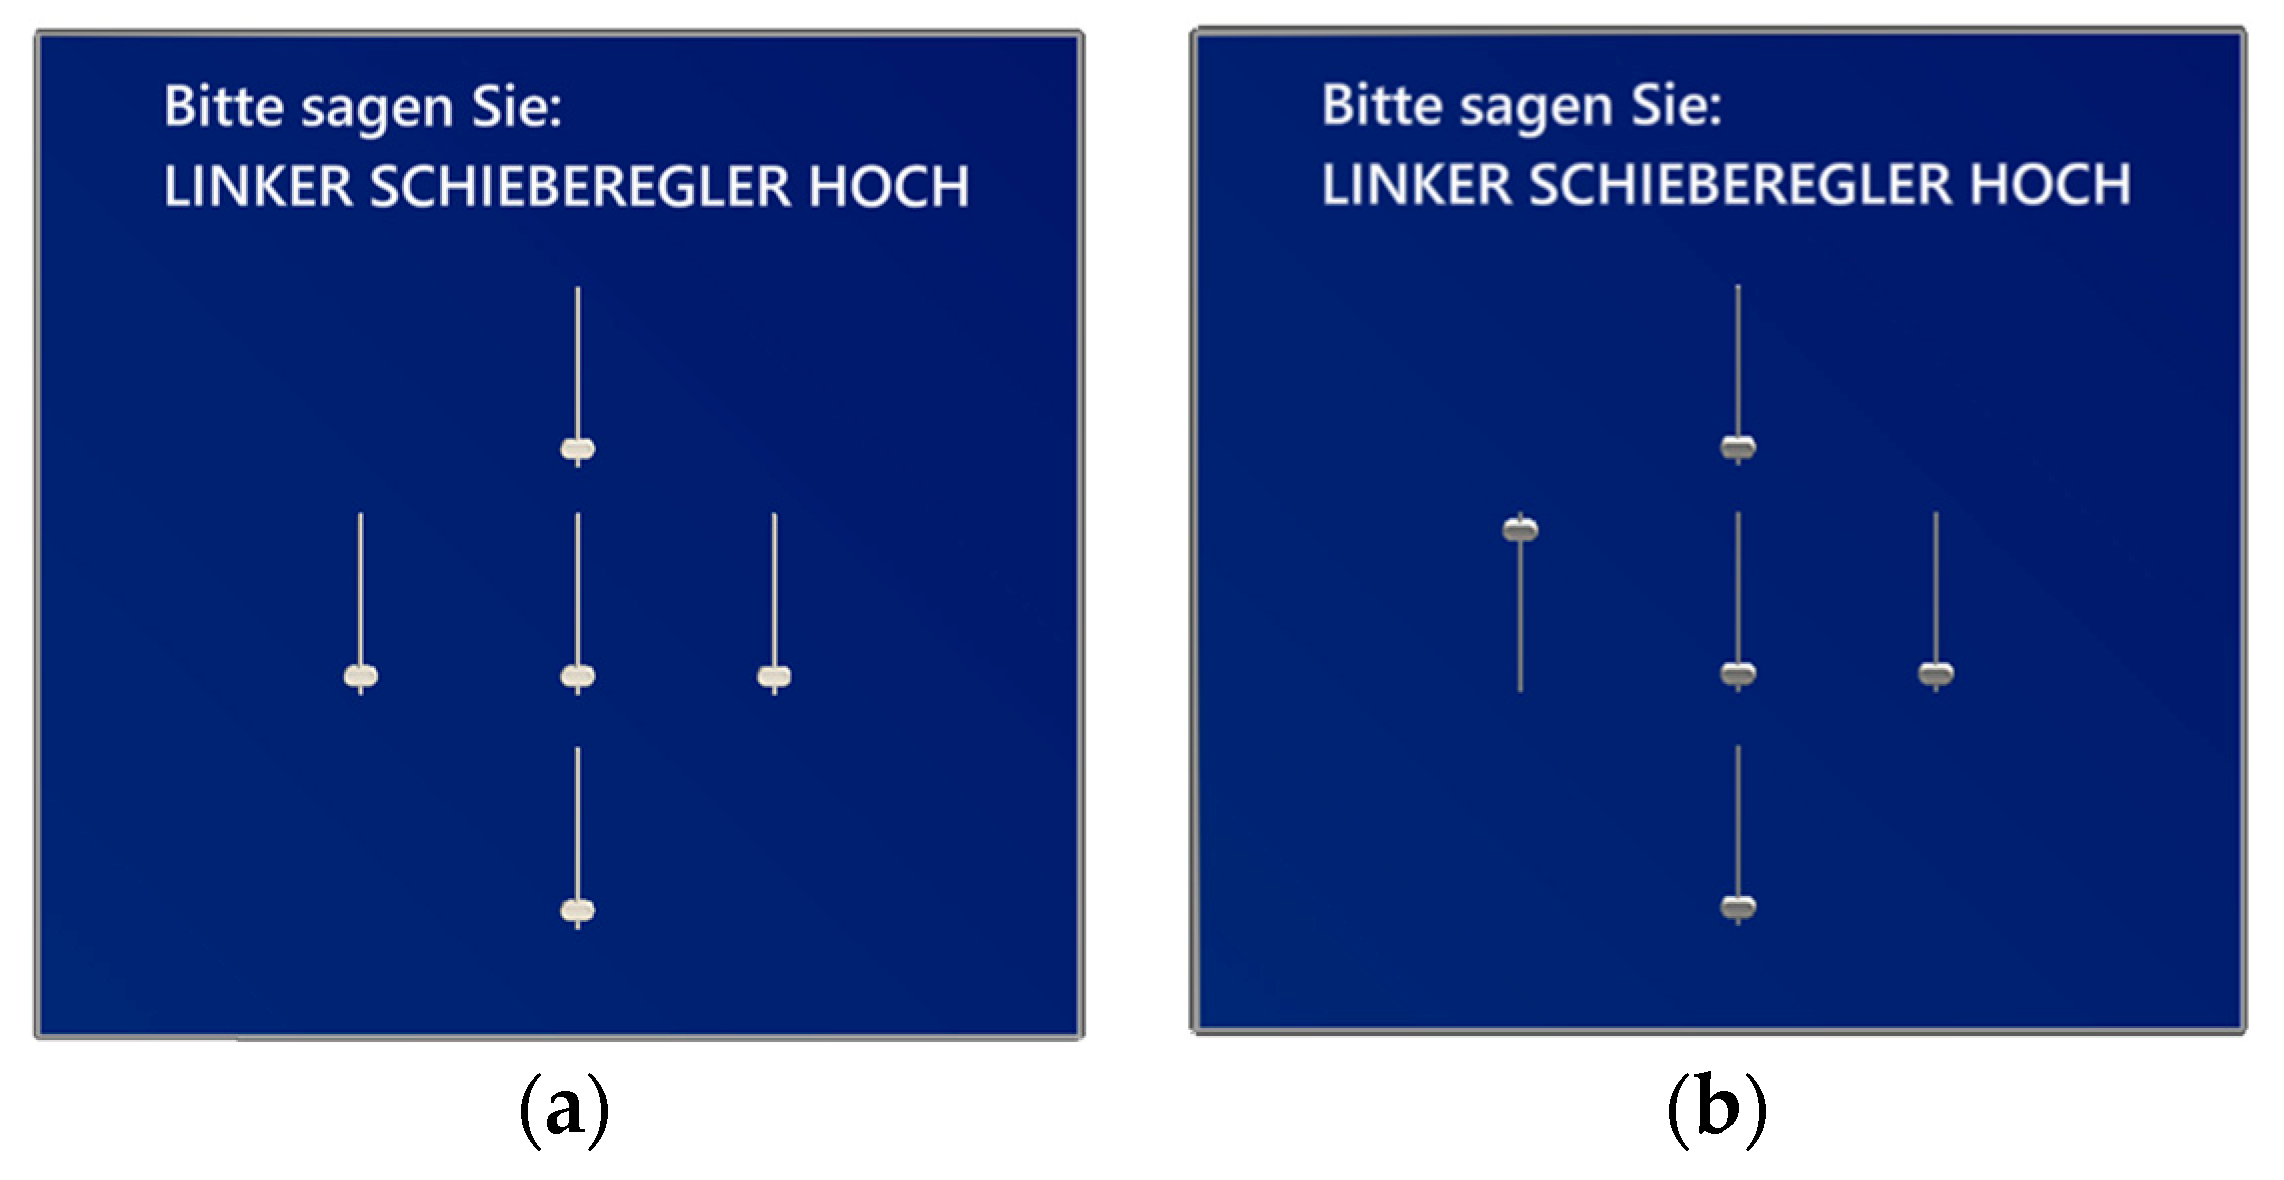
Figure 4, so that the automatic time measurement was started. The participant was asked to speak out the given command for each slider labeled by position, e.g., see
Figure 6 (English: ‘move left slider upwards’). Once all five dedicated commands were carried out correctly using the ASR of the HL2, the measurement was automatically stopped (see
Figure 6).
The correctness of the system’s actions regarding the SPCs was documented by the supervisor of the study. If the participant correctly articulated the command but the ASR did not recognize it, it was remotely activated by the supervisor of the study and documented. Afterward, the sound was stopped again and the same procedure was repeated with the complementary sound (stationarity) at the same SPL. Then, the procedure was repeated with the next SPL. After the first two SPLs, the recording of the physiological parameters was stopped and started again with the last two SPLs. At the end of the experiment, the participant was asked to complete the UTAUT2 and the NASA TLX questionnaire.
3.4. Estimation of Sample Size and Formal Procedure
In accordance with [
18], no statistically significant differences could be demonstrated between the SPL effects on the HL2 using the WER. In contrast, the analogous research design on the HL1 (see [
19]) revealed a significant effect (F(1.37, 20.47) = 13.56,
p < 0.05, η
2p = 0.475). In order to estimate an appropriate sample size and to demonstrate the concept of the research design, a pre-study with 5 participants was conducted, from which the first data were generated and calculated; see
Table 2.
For the main study, a total of
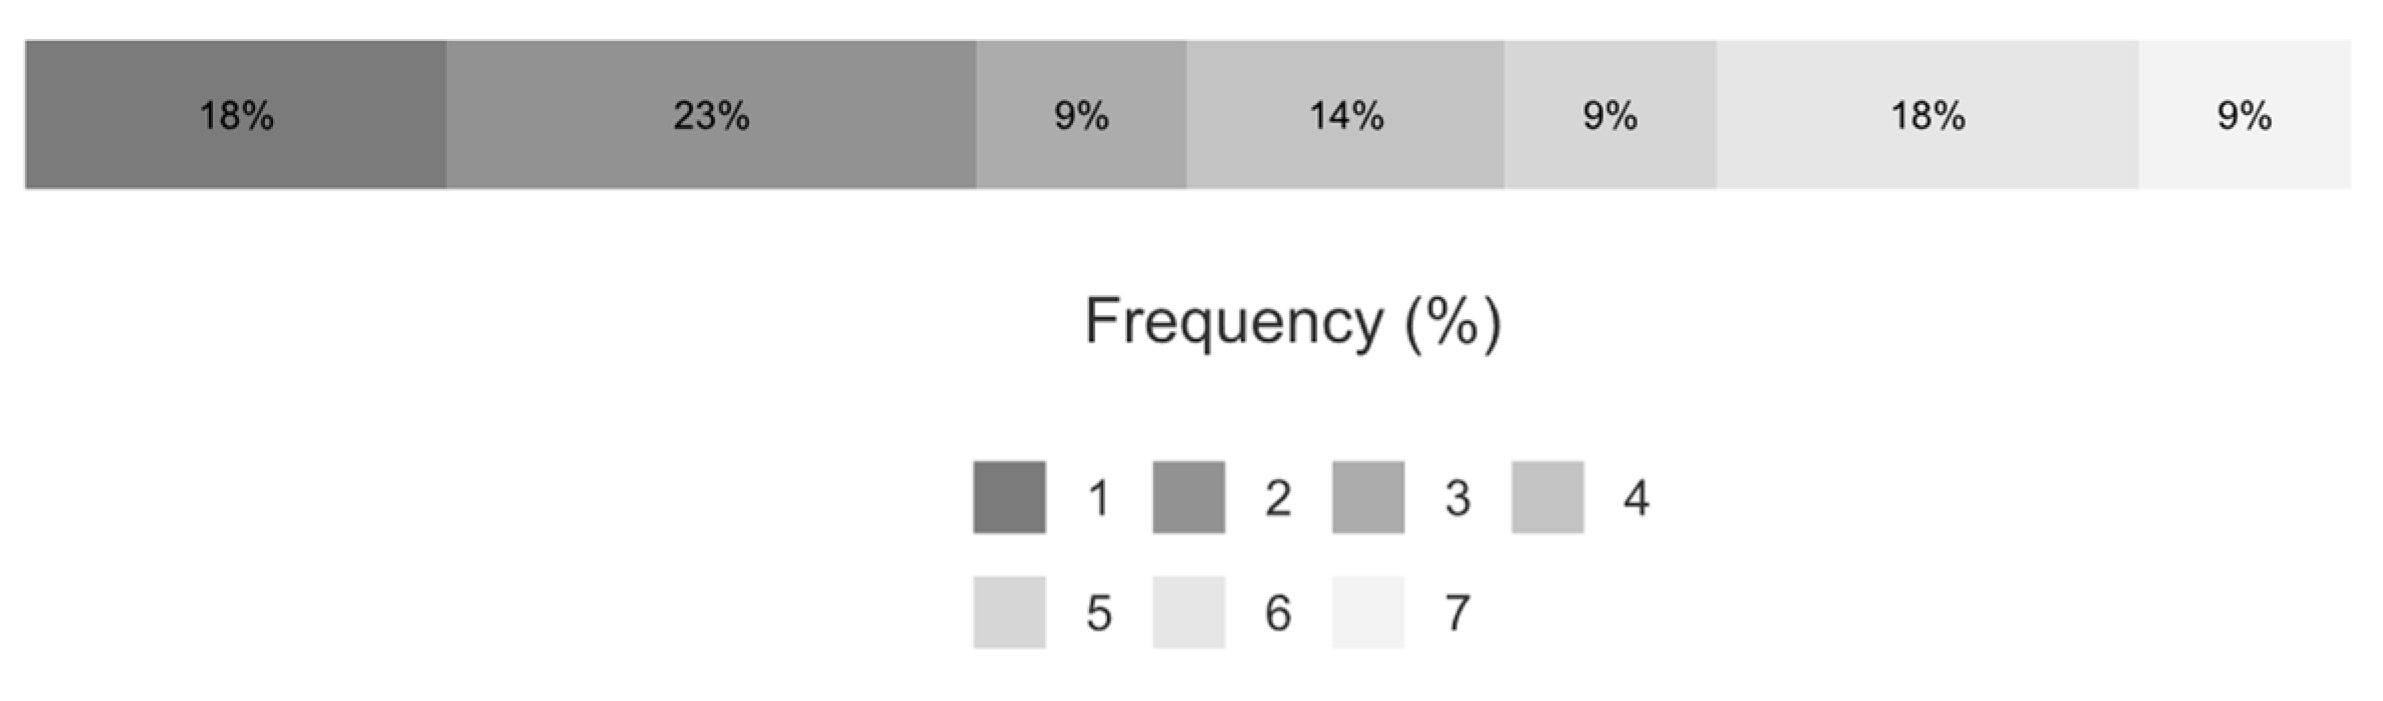
n = 22 participants were recruited via a regional student mailing list. The following demographic data characterized the cohort of participants: 55% male and 45% female; 9% of the participants had completed vocational training, 55% had university entrance qualifications and 36% had a university degree; the participants were aged between 20 and 41 years and the average age was 25.7 years.
Figure 7 shows the results of the experience level in dealing with speech interaction regarding the self-assessment of the participants.
The study was conducted in week 34 of 2023. All data sets were recorded anonymously. The participant joined the study voluntarily and received no monetary compensation. Each participant was informed about the guidelines for good ethical research and needed to give their explicit willingness to participate. The experimental duration was approx. 50 min. The equipment was completely disinfected after each participant. The experimental order was randomly determined in advance.
3.5. Statistical Procedure
The statistical analysis was run in Jamovi 2.3.2. To analyze the influence of the independent variables SPL and stationarity on the dependent variables WER and ITR, repeated measures ANOVA with hypothesis tests were performed; see [
41]. To avoid an over-interpretation of anomalies for the statistical analysis, outliers were cleansed by means of winsorizing according to Equations (2)–(4); see [
42,
43]:
In order to filter out the effects of undefined, linguistic, technical or organizational problems, both the response time (upper boundary = 27.9 s) as a factor of the ITR and the WER (upper boundary = 77.85%) were winsorized. Based on the logical causality, 0 was the natural lower boundary for both variables. As an assumption check, the violation of sphericity was tested. In the case of significant differences between the SPLs, a post hoc comparison, including a Scheffe α-error correction, was carried out. Since SPL 0 dB(A) had only half the data points, it did not qualify for the ANOVA. Therefore, a paired samples
t-test (one-tailed hypothesis) was performed for SPL 0 dB(A) against the other SPLs; see [
44]. As an assumption check, the normal distribution was tested first. If this was violated, a non-parametric
t-test needed to be carried out (
n < 30). The effects of the interaction error were assessed for both the NASA TLX and the UTAUT2 as independent
t-tests with a one-tailed hypothesis. As an assumption check, normality and homogeneity of variances were tested in advance. If the homogeneity of variances was violated, a Welch
t-test needed to be performed. If, on the other hand, the normal distribution was violated, a Mann–Whitney U test was carried out. From the measured skin conductance values, mean values for experimental order were calculated (loud versus quiet). To isolate the effects of excitement, the baselines were subtracted from the action phases. An independent
t-test was performed (one-tailed hypothesis) on both groups (loud and quiet). The evaluation of the heart rate was carried out in an analogous way.
4. Results
The results were evaluated using the methods presented in
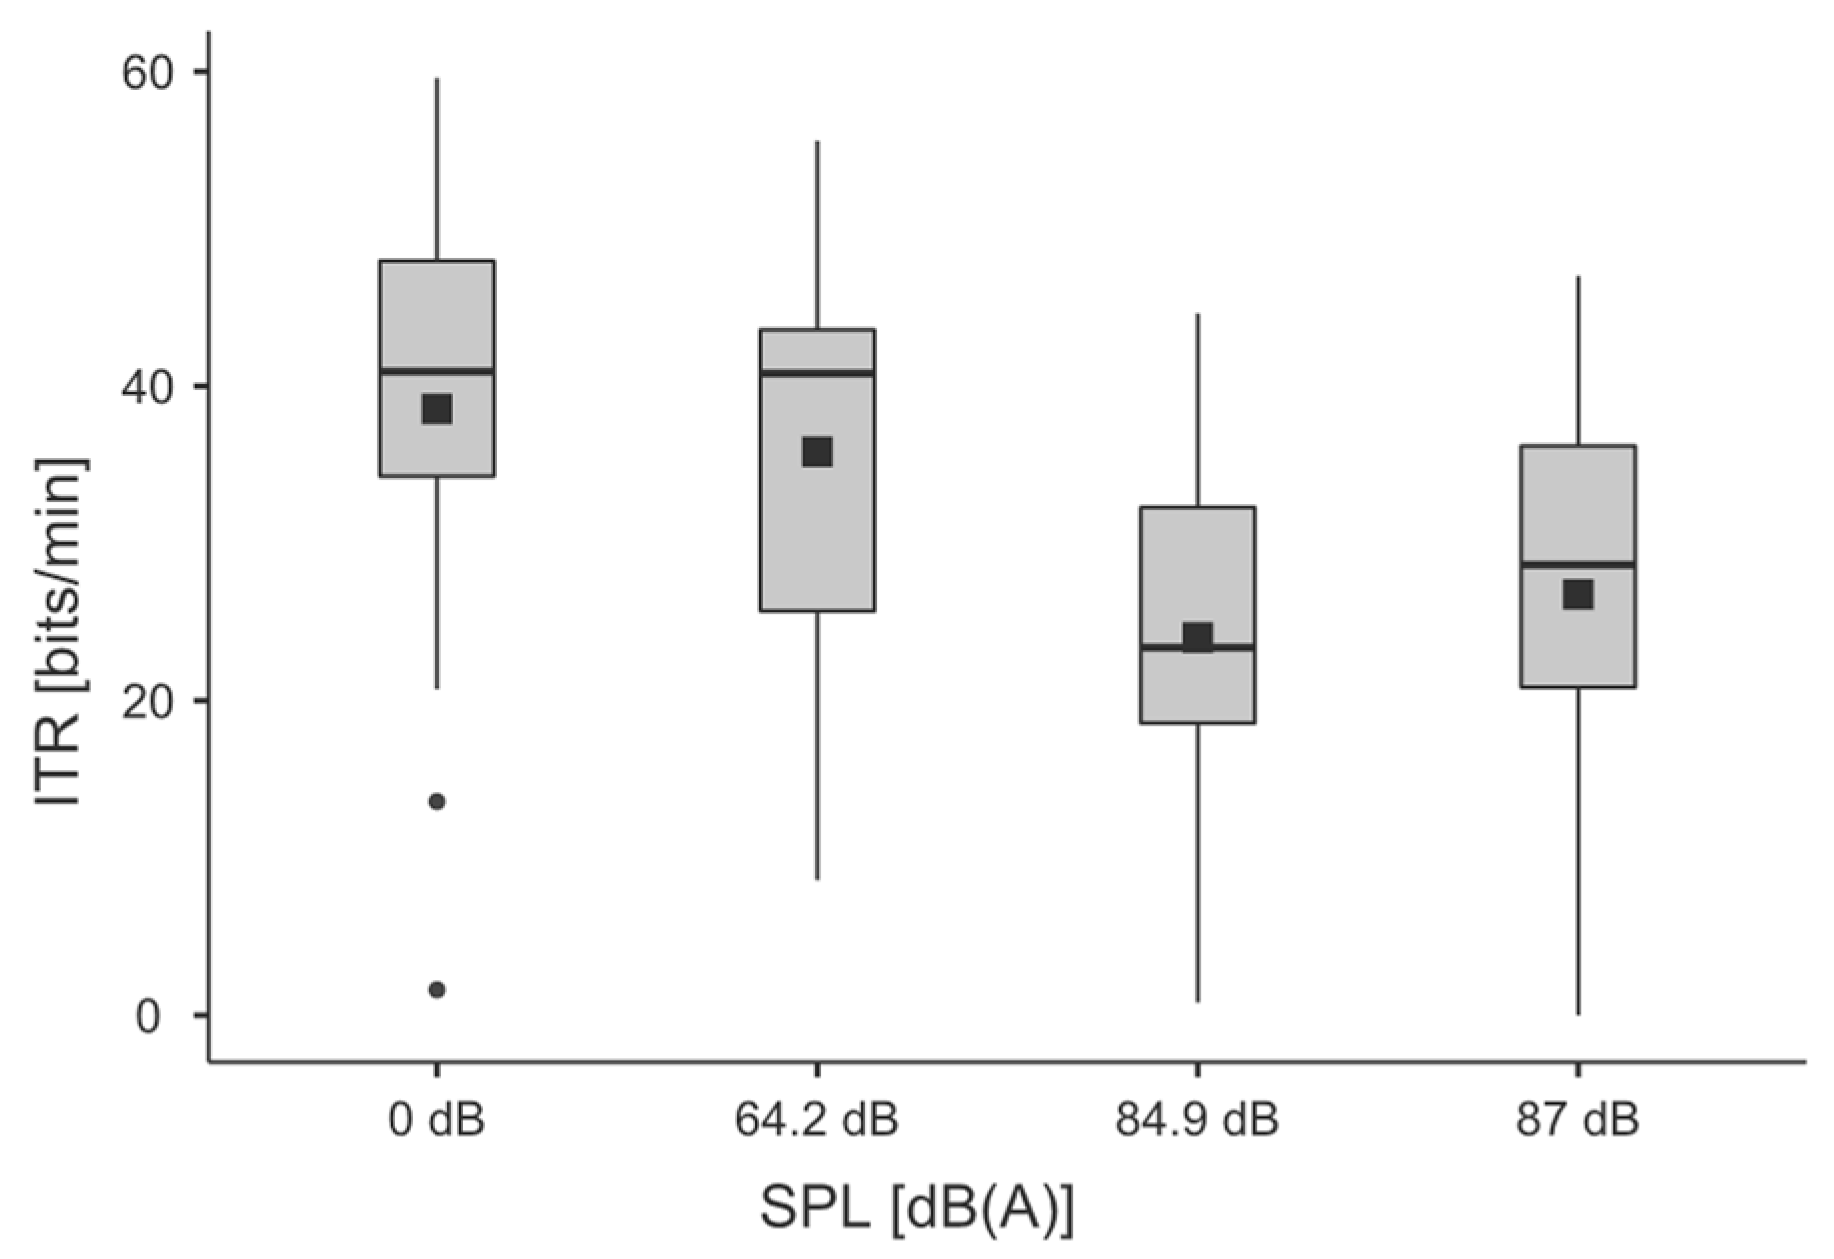
Section 3.5. The influences of the independent variables stationarity, SPL and experimental order on the dependent variables WER and ITR were analyzed and the results are given below. In addition to the data, the results are presented via boxplots and barplots. The boxplots are structured in such a manner that dots represent the outliers, the lower edge of the box represents the first quartile, the upper edge the third quartile, and the wiskers delimit the 1.5-fold IQR. The horizontal line represents the median and the black dot the mean.
4.1. Analysis of Data
Stationarity: For the independent variable stationarity, sphericity was met due to the repeated measures ANOVA having only two levels. Via repeated measures ANOVA, no statistical significance was found for either WER (F(1, 20) = 0.004, p = 0.95, η2p = 0.001, power 0.05) or ITR (F(1, 20) = 2.8, p = 0.109, η2p = 0.123, power 1.00).
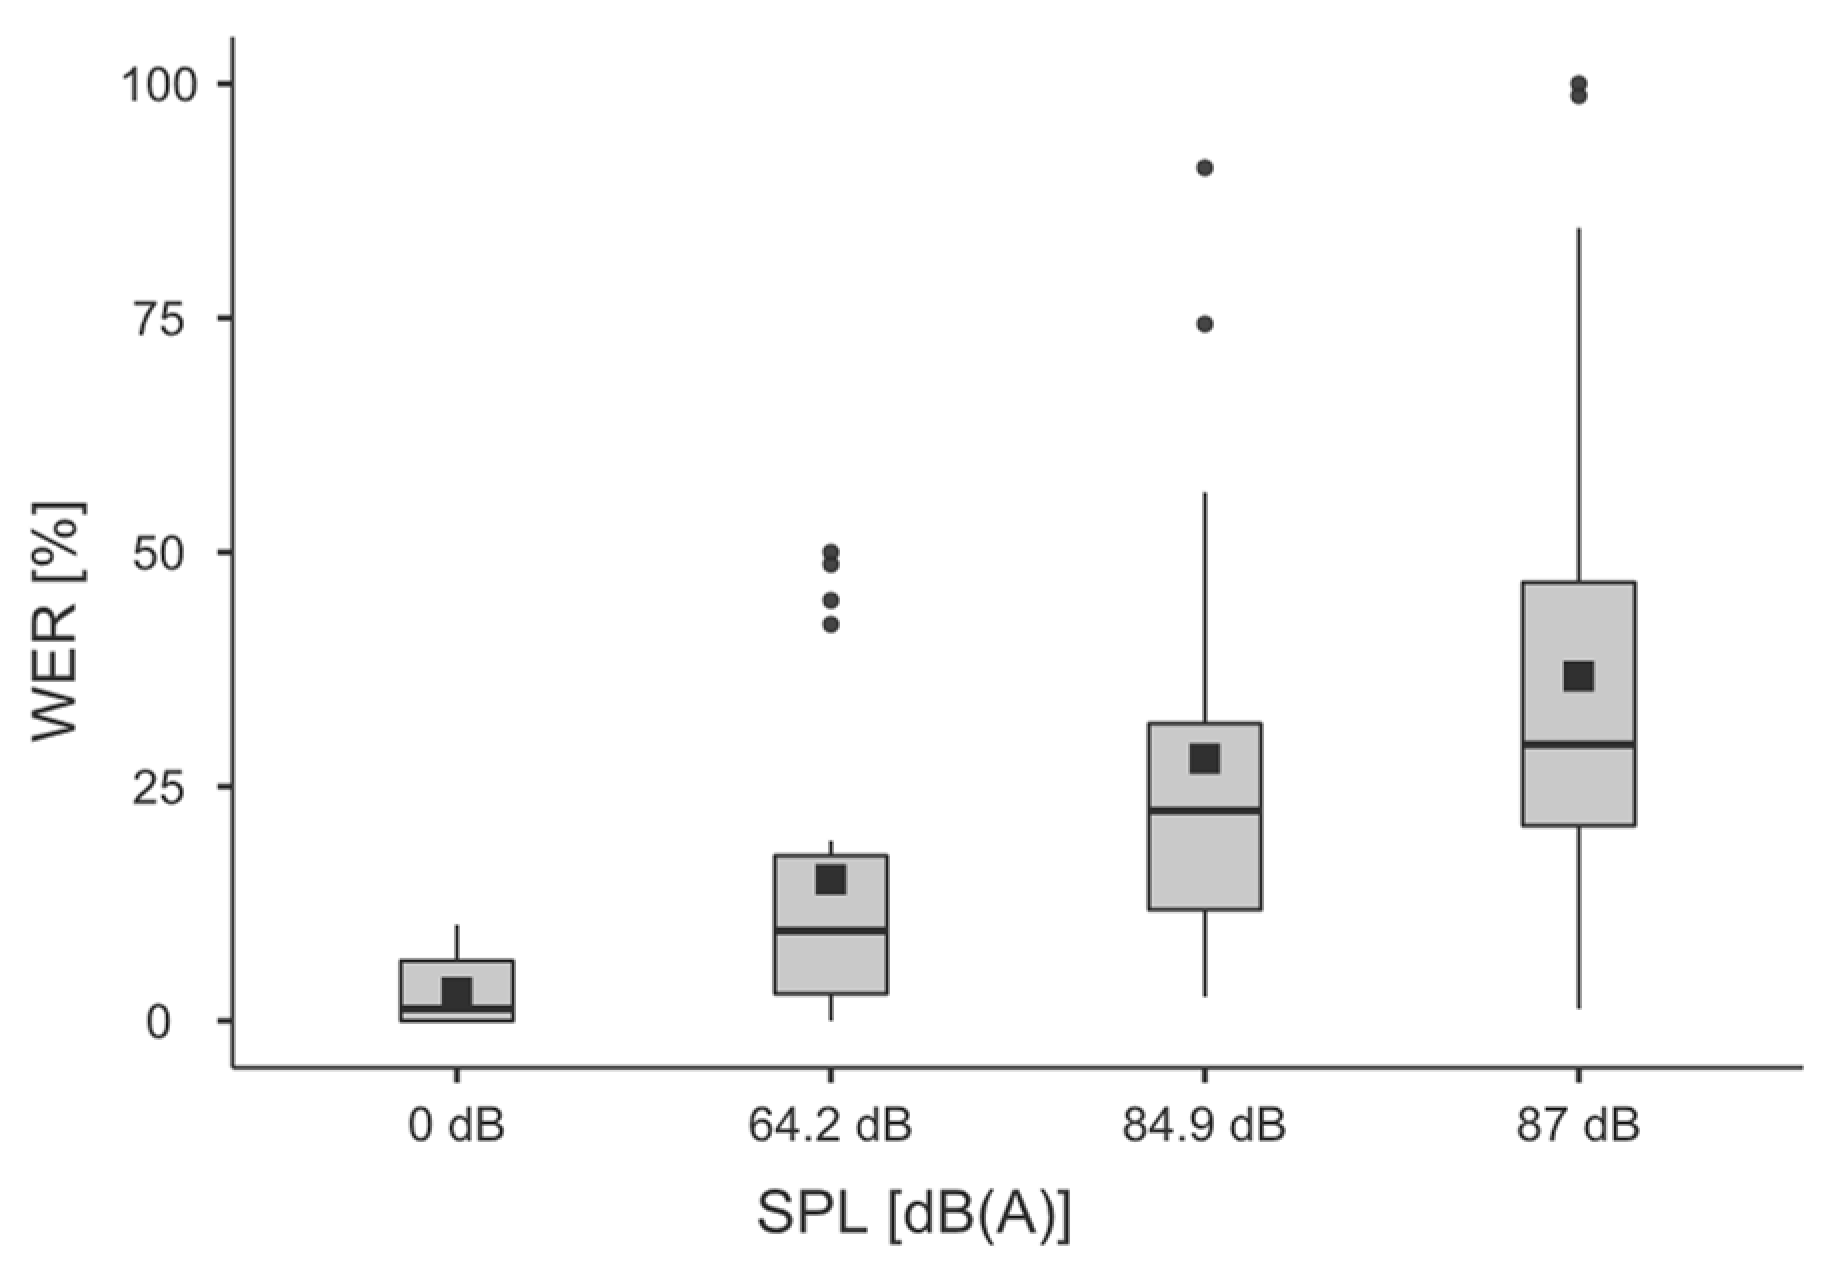
SPL: Regarding the WER, the statistical significance of the independent variable SPL (F(2, 40) = 14.80536,
p < 0.001, η
2 = 0.119, η
2p = 0.425, power 1.00) was demonstrated via repeated measures ANOVA. Sphericity was not violated.
Table 3 shows the post hoc comparison.
Table 4 shows the results of the WER with a paired samples
t-test of the SPL factor level 0 dB(A) compared with the others. Since normality was violated, a non-parametric paired samples
t-test was performed.
Table 5 shows the descriptive values.
Table 6 gives a detailed overview of inherent errors leading to the WER.
Figure 8 shows the corresponding boxplots.
For the ITR, the statistical significance of the independent variable SPL (F(2, 40) = 13.208,
p < 0.001, η
2 = 0.095, η
2p = 0.398, power 1.00) was demonstrated via repeated measures ANOVA. Sphericity was not violated.
Table 7 shows the post hoc tests.
Table 8 shows the results of the ITR with paired samples
t-tests of the SPL factor level 0 dB(A) compared with the others. The normality was not violated.
Table 9 gives the descriptive values and
Figure 9 gives the corresponding boxplots.
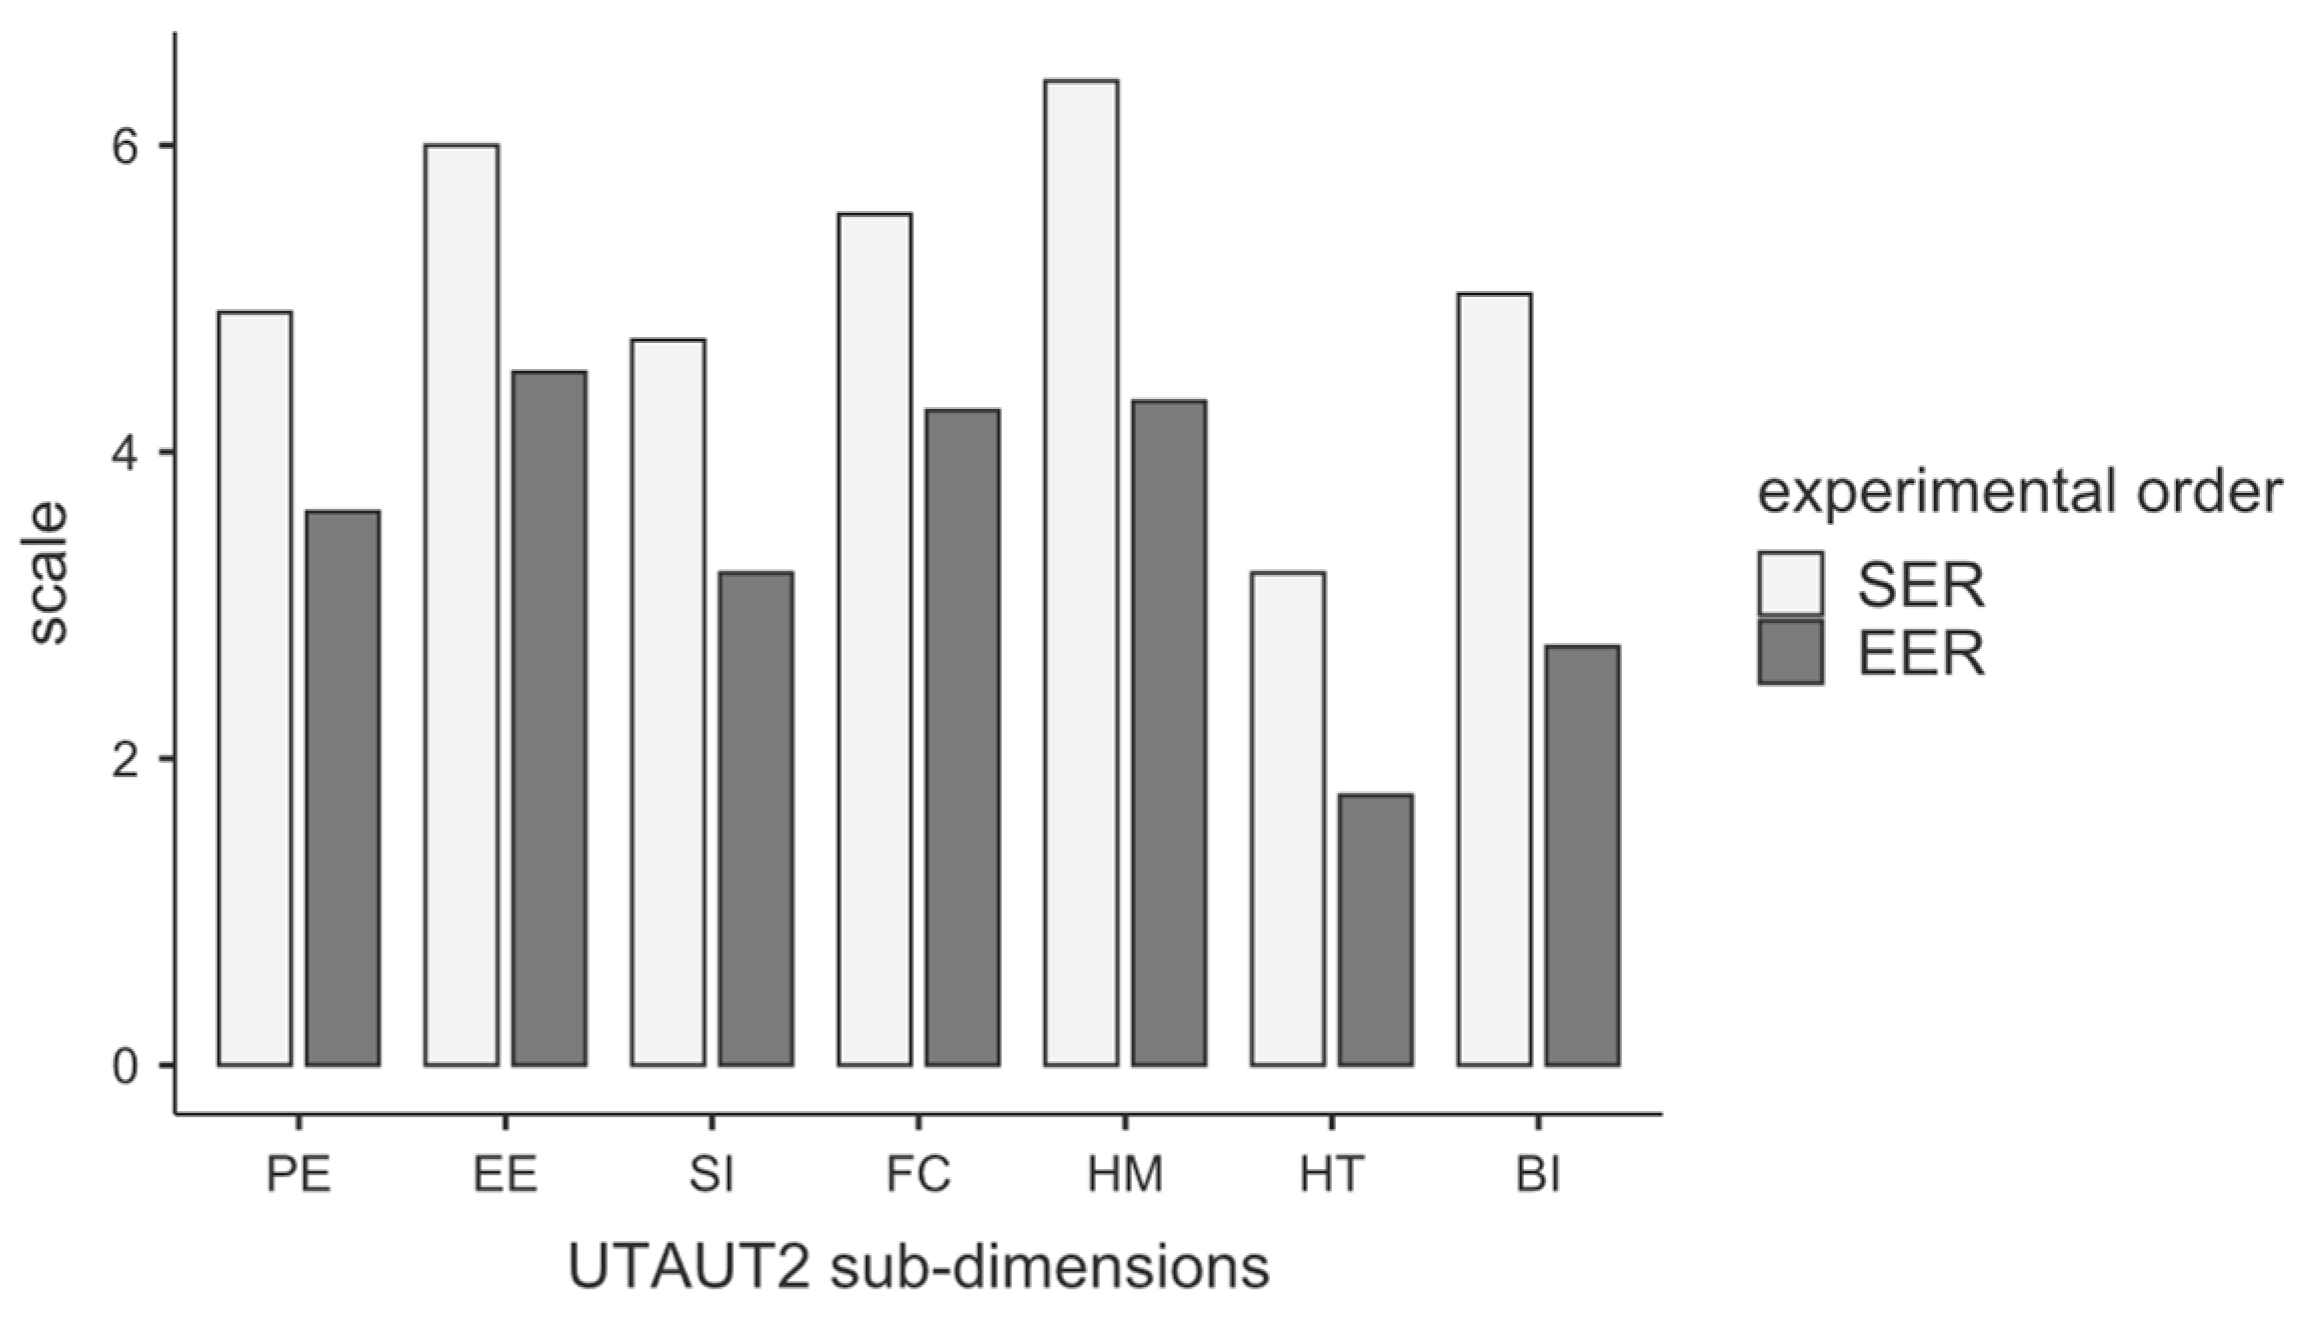
Experimental order: All sub-dimensions of the UTAUT2 questionnaire showed a statistically significant difference between the start error (SER) and end error (EER) groups. The results of the independent
t-test are shown in
Table 10. The homogeneity of variances was not violated, but the normality was partially violated. Where indicated, a Mann–Whitney U test was performed as a result.
Table 11 shows the results of the descriptive data analysis and
Figure 10 the vertical barplot of the UTAUT2 sub-dimensions.
All sub-dimensions of the NASA TLX questionnaire, except frustration, showed no significant differences between the experimental orders. The evaluation of the independent t-test (t(11.4) = −3.07, p = 0.01, Cohen’s d = −1.31, power 0.8) showed that the experimental order start error (M = 5.45, SD = 4.91) implies a lower frustration than the end error (M = 9.55, SD = 7.22). In contrast with the homogeneity of variances, normality was not violated. The physiological parameters showed significant differences in stimulation (e.g., stress) between the experimental order groups.
iPad: To classify the ASR capability of the HL2 in the industrial environment, the results of the iPad were compared. From the paired t-test (t(21) = 10.9, p < 0.001, Cohen’s d = 2.32), statistically significant differences between the WER on the iPad (M = 66.5, SD = 10.9) versus the HL2 (M = 17.2, SD = 17.2) were observed in all conditions. Here, the conditions of normality were met.
4.2. Interpretation of Results
The results of the study allowed for the following conclusions to the hypotheses:
Hypothesis HA.1. The sound pressure level has a negative impact on the performance of automatic speech recognition on the MS HoloLens 2.
Proof of Hypothesis HA.1. was confirmed, and thus, Hypothesis HA.0. was rejected.
The ANOVAs showed a significant influence of the independent variable SPL on both the WER (F(2, 40) = 14.80536,
p < 0.001, η
2 = 0.119, η
2p = 0.425, power 1.00) and the ITR (F(2, 40) = 13.208,
p < 0.001, η
2 = 0.095, η
2p = 0.398, power 1.00). A negative influence of the SPL was demonstrated using the mean values of the post hoc tests; see
Table 3 and
Table 7.
Hypothesis HB.1. Automatic speech recognition on the MS HoloLens 2 performs better in stationary rather than non-stationary ambient noise.
Proof of Hypothesis HB.1. was rejected, and thus, Hypothesis HB.0. was confirmed.
The ANOVAs showed no significant influence of the independent variable stationarity on either the WER (F(1, 20) = 0.004, p = 0.95, η2p = 0.001, power 0.05) or ITR (F(1, 20) = 2.8, p = 0.109, η2p = 0.123, power 1.00).
Hypothesis HC.1. Erroneous automatic speech recognition reduces the user acceptance of an assistance system on the MS HoloLens 2.
Proof of Hypothesis HC.1. was confirmed, and thus, Hypothesis 3. HC.0. was rejected.
All sub-dimensions of the UTAUT2 questionnaire showed a statistically significant difference within the independent variable experimental order; see
Table 10. According to this,
Table 11 demonstrates that all mean values of UTAUT2 were lower if the condition end error was given to the participants.
The research questions could be answered as follows:
Research Question 1. Is automatic speech recognition capable as an interaction design in an industrial environment on a current AR HMD?
Answer 1. Considering the cut-off value of a WER of approx. 22.5%, the ASR on the HL2 did not provide an alternative interaction method (see cut-offs of 25% [
45] and 20% [
46]) for an SPL > 64.2 dB(A). The SPC results show that the SPL factor had a distinctly smaller effect on the ITR than on the WER. The data revealed two statistically significant levels of 0 dB(A)–64.2 dB(A) and 84.9 dB(A)–87 dB(A). Considering the means over the two SPL ranges, the ITR dropped from Mquiet = 37.15 bits/min to Mloud = 25.4 bits/min. The error effect for the SPCs was significantly lower than for the text input. Generally, if a voice command is ignored, it could be repeated because the missing action can be identified easily. In contrast, dictation does not allow for repetition in case of failure.
Research Question 2. What influence does erroneous automatic speech recognition have on user acceptance?
Answer 2. The results of the study demonstrated that an erroneous ASR, as an interaction error, had a negative impact on the acceptance factors. This effect can therefore be recurred to immersive AS, as ASR is an inherent technology. An error-free speech interaction thus has a positive effect on all recorded sub-dimensions of the UTAUT2: BI, PE, FC, HT, HM and EE were increased. Furthermore, the results indicated that the participants’ level of frustration was increased by an erroneous ASR. The results of the social influence due to an erroneous ASR were not logical from a theoretical perspective. The participants had already obtained the attitude or the opinion of their peers before the study and the social influence consequently should not be manipulated by the experiment. Neither the questionnaires nor physiological parameters indicated stress due to a malfunctioning ASR.
5. Discussion
The research design addressed the relevance of the call to investigate ASR functions up to an SPL of 90 dB (or > 70 dB(A)); see [
47]. In contrast with [
18], the investigated SPL range > 70 dB was extended. In this study, experiments were limited to 87 dB(A), as this is not a tolerable level of exposure for health. To mitigate harmful effects and reflect industrial conditions, experiments were carried out wearing hearing protection, enabling realism. In summary, previous results show that the HL1 has a WER of 55% (at 70 dB(A); see [
18]) and the HL2 according to [
19] has an average WER of 51% (SPL 40–70 dB(A)). In this study, a WER of 37% was demonstrated at 87 dB(A) with a German text template. Overall, a significant improvement in the ASR could be noted from the HoloLens versions 1 to 2. Analogously, comparing the performance of the gesture control on the HL1, the WER was about 0.12%; see [
10]. In contrast with [
19], a significant influence of the SPL on the WER was shown. Although [
19] did not find a significant effect on the perceived system usability, this contribution did confirm a significant difference in performance and effort expectancy (see UTAU2 PE and EE) by manipulating the experimental orders with start error and end error conditions. In contrast with [
18,
19], the perceived workload could not be confirmed in this study. By way of a critical analysis of [
18,
19], it can be assumed that the research design entailed a bias due to the participants’ habituation effects. It can be stated that the design was suboptimal due to the long-winded and repeated interviews. Our findings (influence of stimulus/error on acceptance factors) confirmed the proposed research design. Participants experience all conditions counterbalanced and are being questioned afterwards only once in questionnaires. Our design enabled the probands to distinctly differentiate between correct and imperfect ASR. In contrast with the previous work, the study was conducted in German, widening the scope of contributions on the one hand but reducing comparability on the other. In this study, a larger sample size (
n = 22) was taken into account (see [
18] with
n = 16 and [
19] with
n = 13), which increased the statistical power. Not only the dictation function but also the SPC function, which also extended the scope of the research in the level of detail, was analyzed. The disadvantage of the study was that no standardized text was applied for better comparability. The ITR metric was introduced to evaluate the SPC, but its comparability and meaningfulness have yet to be shown due to the lack of comparative studies. The applied methodology for the evaluation of the skin conductance level and the HR must be optimized from a medical point of view.
6. Conclusions and Further Research
Human–machine interaction may not be everything, but if human–machine interaction is flawed in the context of assistance systems, then everything is nothing.
This statement is strengthened by the results of this study. As expected, the volume significantly influenced the performance of the ASR. Within the industrial context, a WER between 3% and 36% can be expected on the HL2. Assuming that an acceptable WER is below 22.5%, ASR does not present an alternative paradigm of interaction. A more extended approach to research design is presented as lessons learned from the previous studies. It was shown that the ITR metric from brain–computer interaction research offers the potential for evaluating SPCs, which requires further investigation. SPCs can achieve between 27 bits/min and 39 bits/min depending on the SPL. Regarding the overarching research design, this study delivered a powerful contribution regarding the evaluation of interaction error. It was shown that an imperfect HMI had a negative impact on the acceptance of the AR technology and the AS. On the other hand, both the subjective user survey and the measurement of physiological parameters in this specific study indicate no influence of the error on stimulation or technostress. This calls for interdisciplinarity beyond the field of engineering and toward psychology or medicine in the research of HMI. The research design and the ongoing questions regarding the errors of the immersive HMI invite further research. In this work, attention was paid to a comprehensible statistical approach and detailed description. In further studies, replications of the overall research design will be carried out with a focus on errors of visibility, instruction and information value. Nevertheless, the research design can be adapted and applied to a range of additional error types and stimuli. Furthermore, in this work, which will be based on the speech interaction error, other independent variables, such as the speech tempo or volume, should be investigated. It is likely that workers in a noisy environment, especially with hearing protection, may unconsciously modify their voice due to the Lombard effect or others; see [
48]. These variations of speech production might be considered a feature in application design or speech behavior. Especially in the future context of an industrial metaverse, ASR will play a relevant role. Nevertheless, the current technology maturity is not yet ready for this.


 ,
, 


