1. Introduction
In many real-world scenarios, people need to work together while being remote. Collaborative virtual environments (CVE) tend to metaphorically reduce the distance between the users by using virtual reality (VR) or Augmented Reality (ar) to create a shared workspace among the users. There are applications of CVE in many domains, e.g., education and training [
1], entertainment and gaming [
2], manufacturing [
3], architecture [
4], and engineering [
5]. While CVEs are becoming widespread, there is still a lack in the perception of other users’ activity and emotional states [
6]. The perception of collaborative activity is based on workspace awareness [
7,
8,
9] (sum of knowledge, perception, and understanding of an environment) and empathic computing [
10] (how technologies can be used to help increase empathy or create deeper shared understanding between users). Generally, these works intend to understand how people experience impact on their feelings and metabolism. We thus consider building user status on awareness elements to identify people and describe their activity and their internal states (physiology, emotions, cognitive workload, etc.).
We aim to enhance collaboration in a shared virtual environment by providing users’ activity indicators in order to help users to detect when their partners need assistance or to monitor a team. This paper investigates the following research question: which activity indicators are most relevant during cooperative scenarios where all parties have the same interaction capabilities?
We propose a set of visualization techniques to display user status based on two categories: the identification of a collaborator and his activity. For each of these categories, we propose various indicators depending on the task and collaborative context. As we needed to experiment and evaluate these propositions, we implemented a virtual collaborative platform. We used a VR adaptation of the NASA Multi-Attribute Task Battery II (MATB-II [
11]) to create a collaborative environment where two users would cooperate to complete tasks as fast and as accurately as possible. We conducted a controlled experiment on this platform to evaluate how relevant the indicators are for representing the user’s activity. In summary, the contributions of this paper are:
A set of visualization techniques to give information to a user about a collaborator’s activity to help them detect a need for help, without creating a mental workload for the observer.
The results of the user study show that instantaneous indicators are more relevant than the ones that show the same data but as past information to the users of an augmentative cooperation system. We thus recommend focusing on sharing instantaneous information in environments where people with the same capabilities work together, rather than a history of actions and events.
An open-access collaborative VR experimental platform we developed: MATB-II-CVE. The sources of the Unity Project and compiled versions of the application can be used by anyone who would want to study collaboration in an environment that can put pressure on users.
With these contributions, we try to improve teamwork, whether it is for the well-being of workers, the speed of completion of tasks, or the flexibility of the team.
The rest of the paper is organized as follows:
Section 2 presents related work on collaboration in a shared virtual workspace.
Section 3 introduces the NASA MATB-II (Multi-Attribute Task Battery).
Section 4 presents our visualization techniques to share a user’s activity.
Section 5 details the controlled experiment evaluating activity status indicators.
Section 6 then shows the results of this study.
Section 7 and
Section 8 discuss the limitations and future work.
2. Related Work
Awareness is defined by Gutwin and Greenberg as the set of knowledge and environmental understanding for answering the questions: Who? What? How? Where? When? [
8]. We will address these as the awareness questions. The information that has to be accessible in a shared environment depends on the awareness question:
Who—information about presence (is there anyone here?), identity (who is that?), and authorship (who did or is doing that?).
What—information about action (what is happening?), intention (why is it being done?), and artifacts (what objects are involved?).
Where—information about location (where are things happening?), gaze (where are others looking?), view (what can they see?), and reach (where can they reach?).
How—a history of the process that affected objects and people (how did it happen to someone or something?).
When—an event history to link all the other information to time (when did that happen?).
Workspace awareness is the knowledge required to interact with a system, and the up-to-the-moment understanding of another person’s actions [
12]. Yang et al. [
13] investigated collaborative sensemaking with groups of users in VR. Their findings suggest several positive outcomes and potential advantages of supporting VR-distributed collaborative sensemaking tasks involving the spatial organization of information over a traditional desktop environment. As a way to focus on interactions between humans, we focus on the notion of collaborative awareness (or awareness of collaboration). This goes beyond just understanding people’s actions and into how they feel, why they acted, how they did what they did, and any other elements that may influence collaboration. To help us to build collaborative awareness, we can allow verbal communication, embody people with realistic avatars [
14,
15], and share gaze [
16,
17,
18], emotions [
19], and physiological data. For example, Dey et al. shared the heart rate between two participants with a heart icon in their field of view [
20] and later shared the heart rate between two participants through VR controllers’ vibration [
21].
In terms of placement and presentation, we could situate information outside or inside the workspace, and the presentation can be either literal (raw data) or symbolic (with abstraction) [
8,
12]. We considered three categories of placement:
fixed,
movable, and
body-relative. With a
fixed placement, information would be displayed at one or more locations for the user. With a
movable placement, information is shown as a virtual tablet that could be resized, enabled, and disposed on demand (e.g., Tablet Menus [
22]). With a
body-relative placement, information is presented attached to the users’ body (e.g., on their wrist or fingers Tulip Menus [
22]). These three placements are already used in VR games (such as EchoVR [
23] or Zenith [
24]) and in academic research ([
12,
25,
26,
27]).
Gutwin and Greenberg wrote in 2002, “The input and output devices used in groupware systems and a user’s interaction with a computational workspace generate only a fraction of the perceptual information that is available in a face-to-face workspace. Groupware systems often do not present even the limited awareness information that is available to the system” [
8]. This is still true nowadays. We can extract two research directions from this statement: generation of more perceptual information and presentation of already available information. With this work, we will address the latter, investigating if sharing already available information among collaborators will help them to work better and which kind of indicators are more relevant depending on the situation.
As the introduction states, we need an experimental platform to study collaboration, which can stress people. We will see in the next section that the NASA Multi-Attribute Task Battery II (MATB-II [
11]) is suited for this purpose.
3. MATB-II
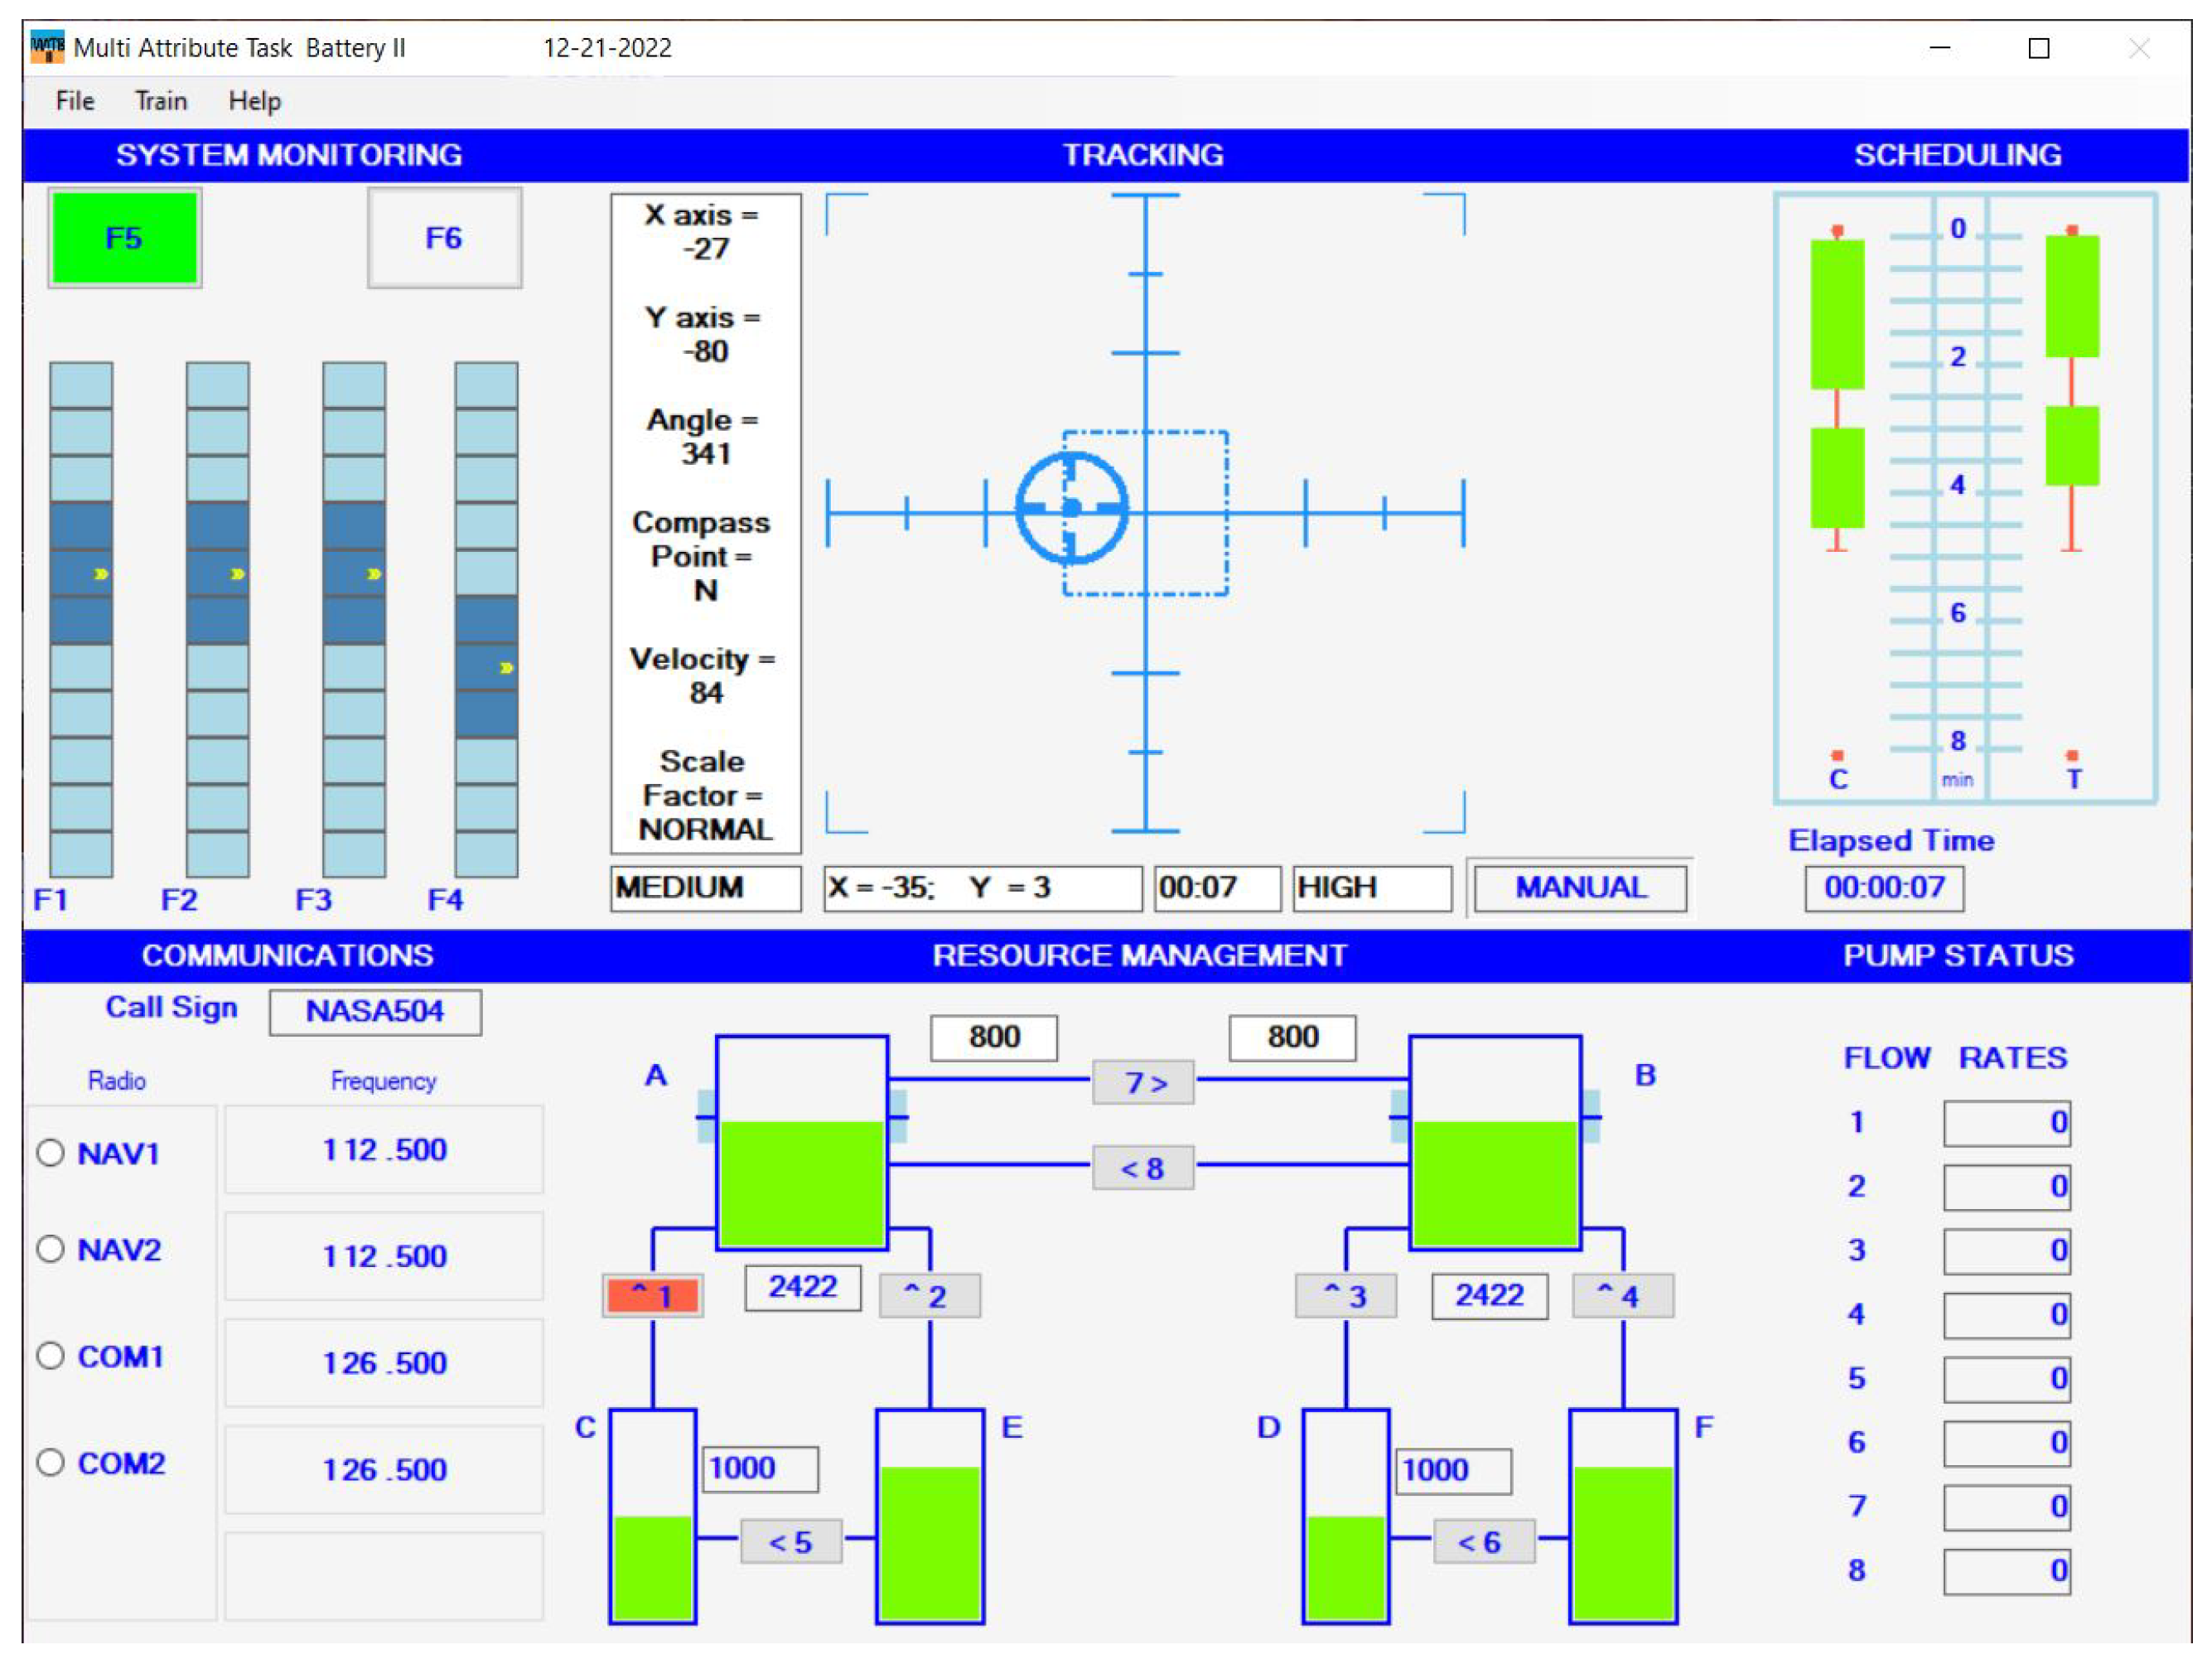
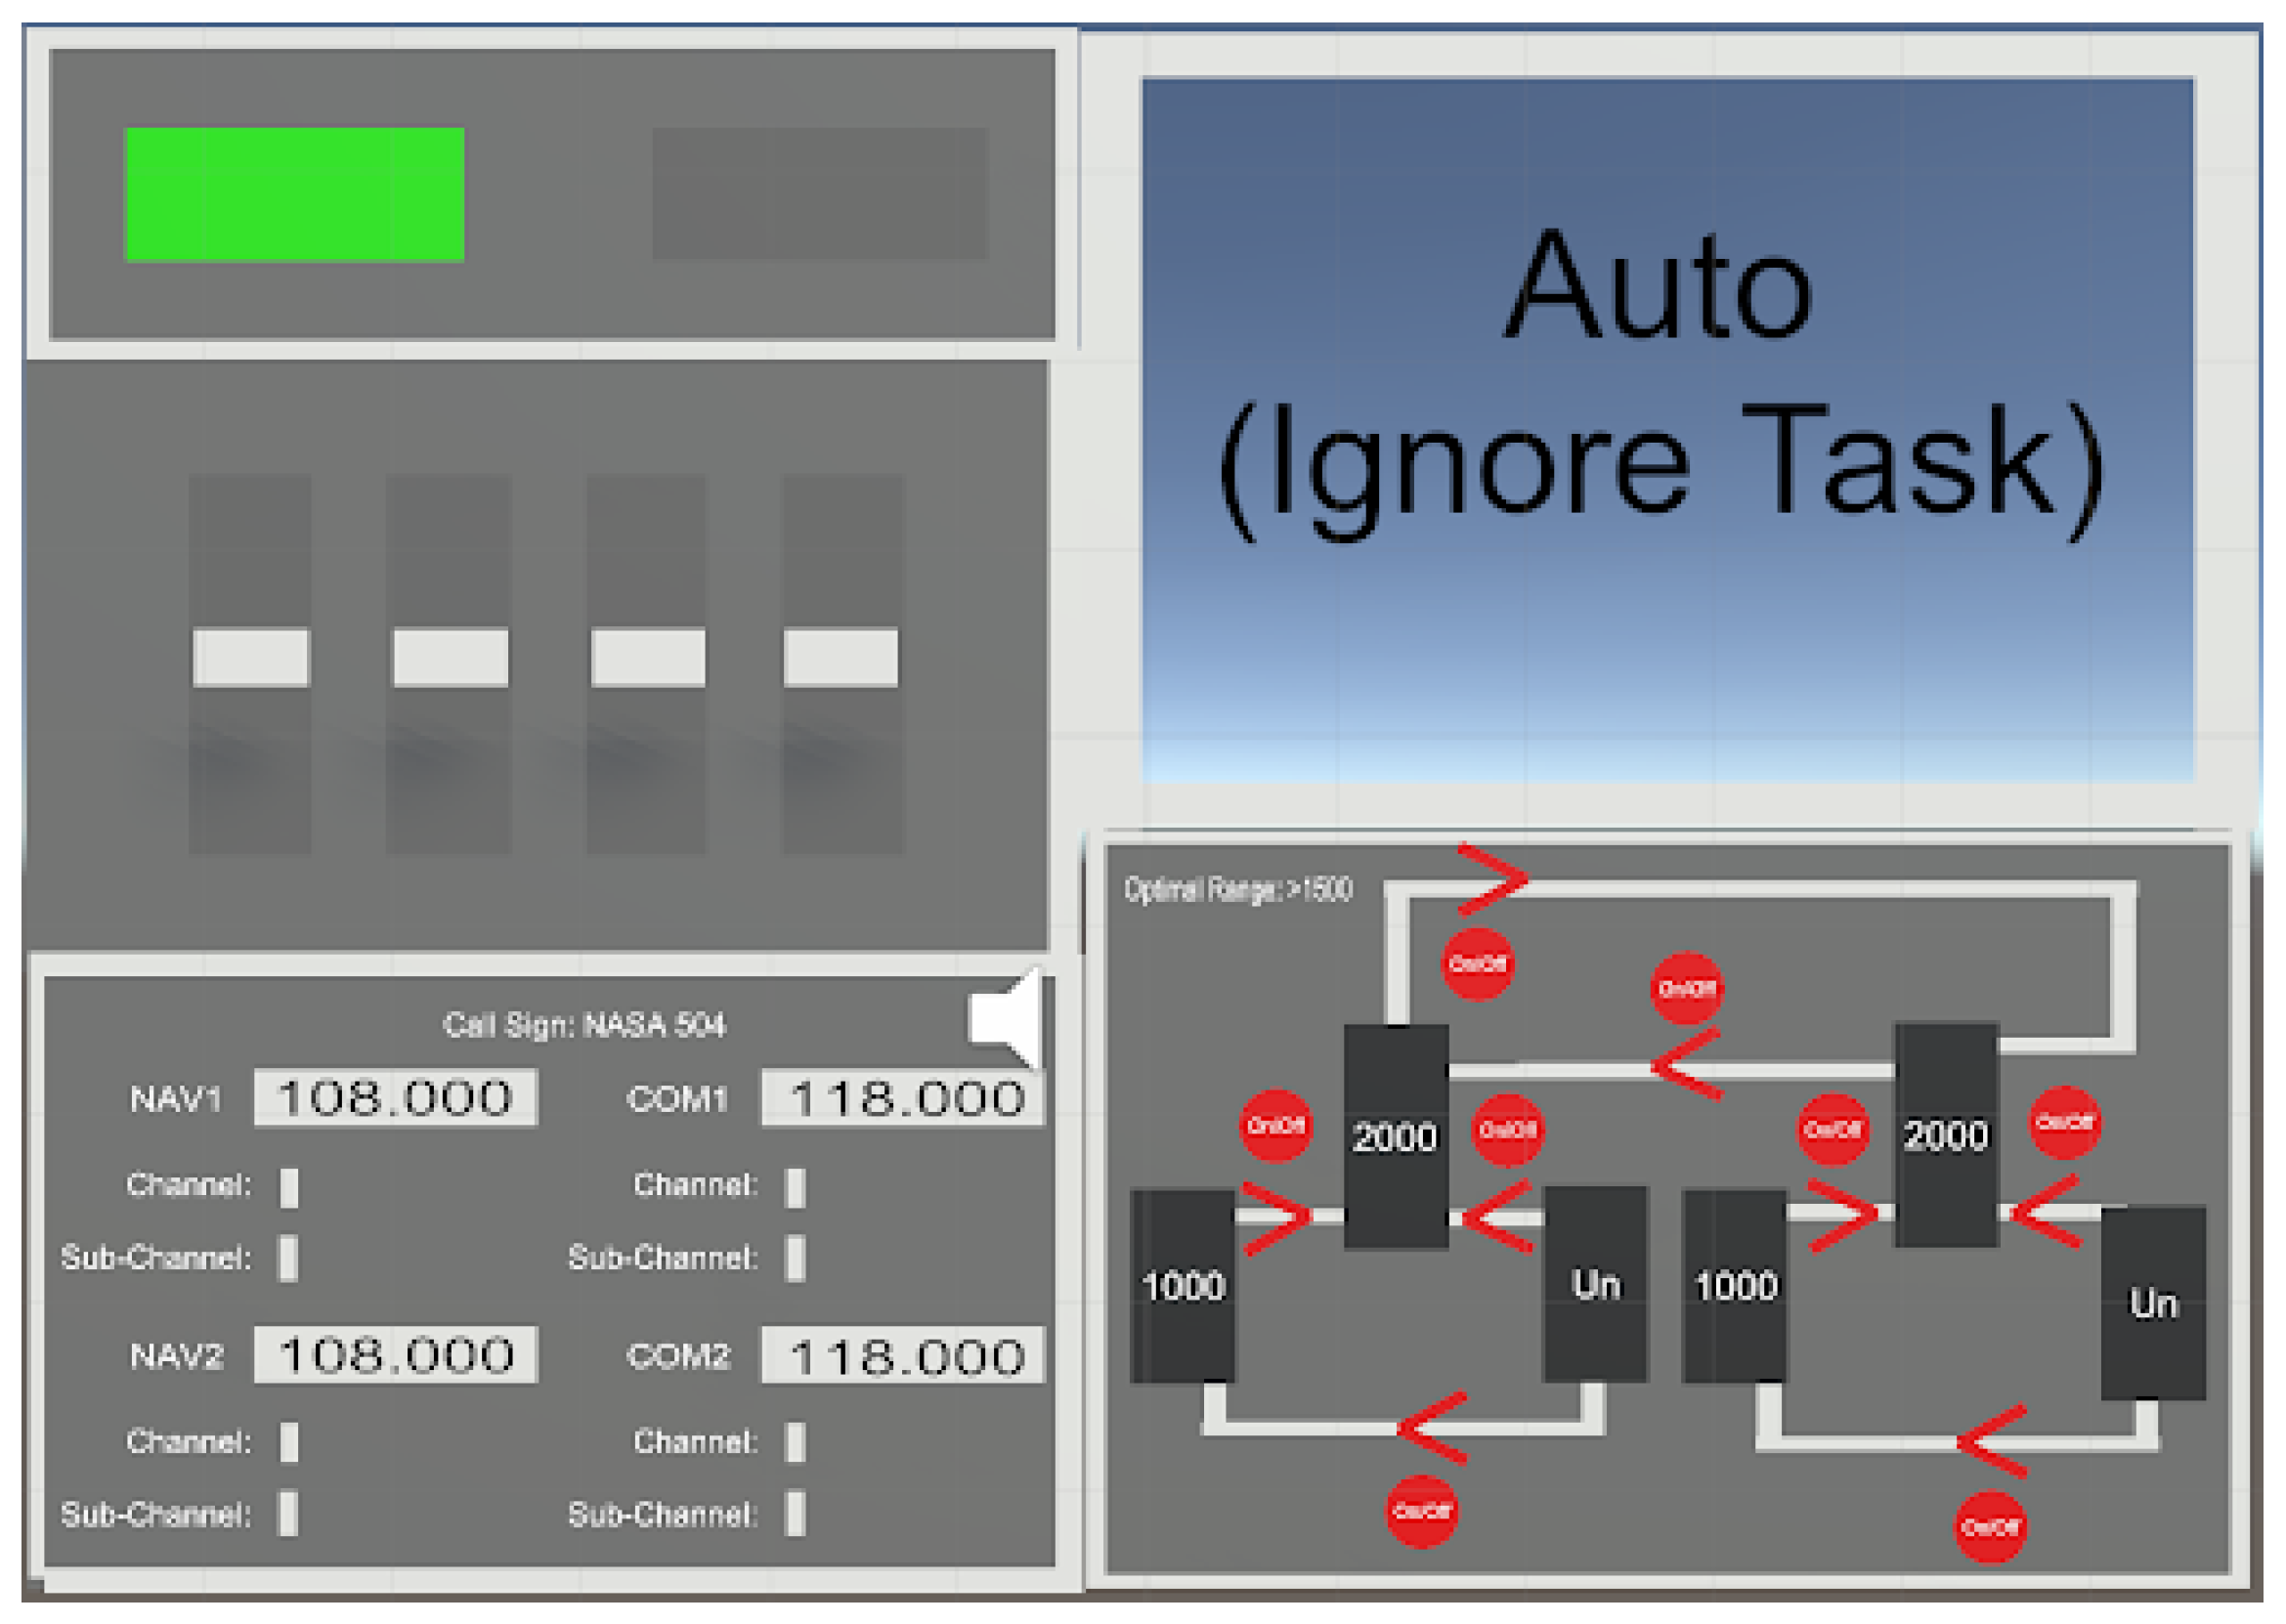
The Multi-Attribute Task Battery (MATB-II, see
Figure 1) is software designed by NASA to provide activities to study workload. MATB-II is used to design training scenarios [
28] to study relations between cognitive control modes and mental workload [
29] and for real-time estimation of the mental workload with machine learning [
30]. The main feature of this tool is the simultaneous performance of multiple tasks:
System monitoring (sysmon): the user has to respond to the absence of the green light and to the presence of the red light, and has to monitor the four moving pointer dials for deviation from the midpoint.
Communications (comm): this task presents pre-recorded auditory messages to the user, who has to determine which messages are addressed to NASA-504 and who has to respond by selecting the appropriate radio and frequency.
Tracking (track): the user has to maintain the target at the frame’s center.
Resource management (resman): the user has to maintain the upper tanks at around 2500 units each by turning on or off any of the eight pumps. Pump failures can occur and are shown by a red light on the failed pump that repairs after some time.
Yang et al. investigated remote VR collaboration:
“When people collaborate remotely using desktop interfaces they no longer feel like they are sharing the same space. This limitation may be overcome through collaboration in immersive environments, which simulate the physical in-person experience.” They concluded with,
“Many positive outcomes and potential advantages for performing distributed collaborative sensemaking tasks that involve spatial organisation in VR over more standard Desktop environment” [
13]. This shows that collaboration might be more interesting to study in VR. MATB-II is mainly used to assess mental workload because it is designed to put the user under pressure to create a mental workload. For our study, we needed a system that put users under pressure so that they would need help at some point. Singh et al. already used MATB-II as a desktop collaborative system between a human and an AI [
31].
4. Visualization Techniques
Sharing information about a user’s activity is a good way to enhance collaborative awareness. During a collaborative task, it is mandatory to share elements answering the awareness questions (who, what, how, where, when) to improve understanding among users [
8]. We consider two design dimensions to display information: (i) the symbolism and (ii) the placement. For the symbolism, we chose a hybrid strategy combining symbolic representations and literal values. The first part of this section explains this strategy and presents how we display a user’s activity inside a 2D panel. The second part supports different placements of this panel inside the workspace. In parallel with the interface and indicator design process, we tested them with pilot experiments. The last part of this section is dedicated to the conclusions drawn from these tests.
4.1. User’s Activity
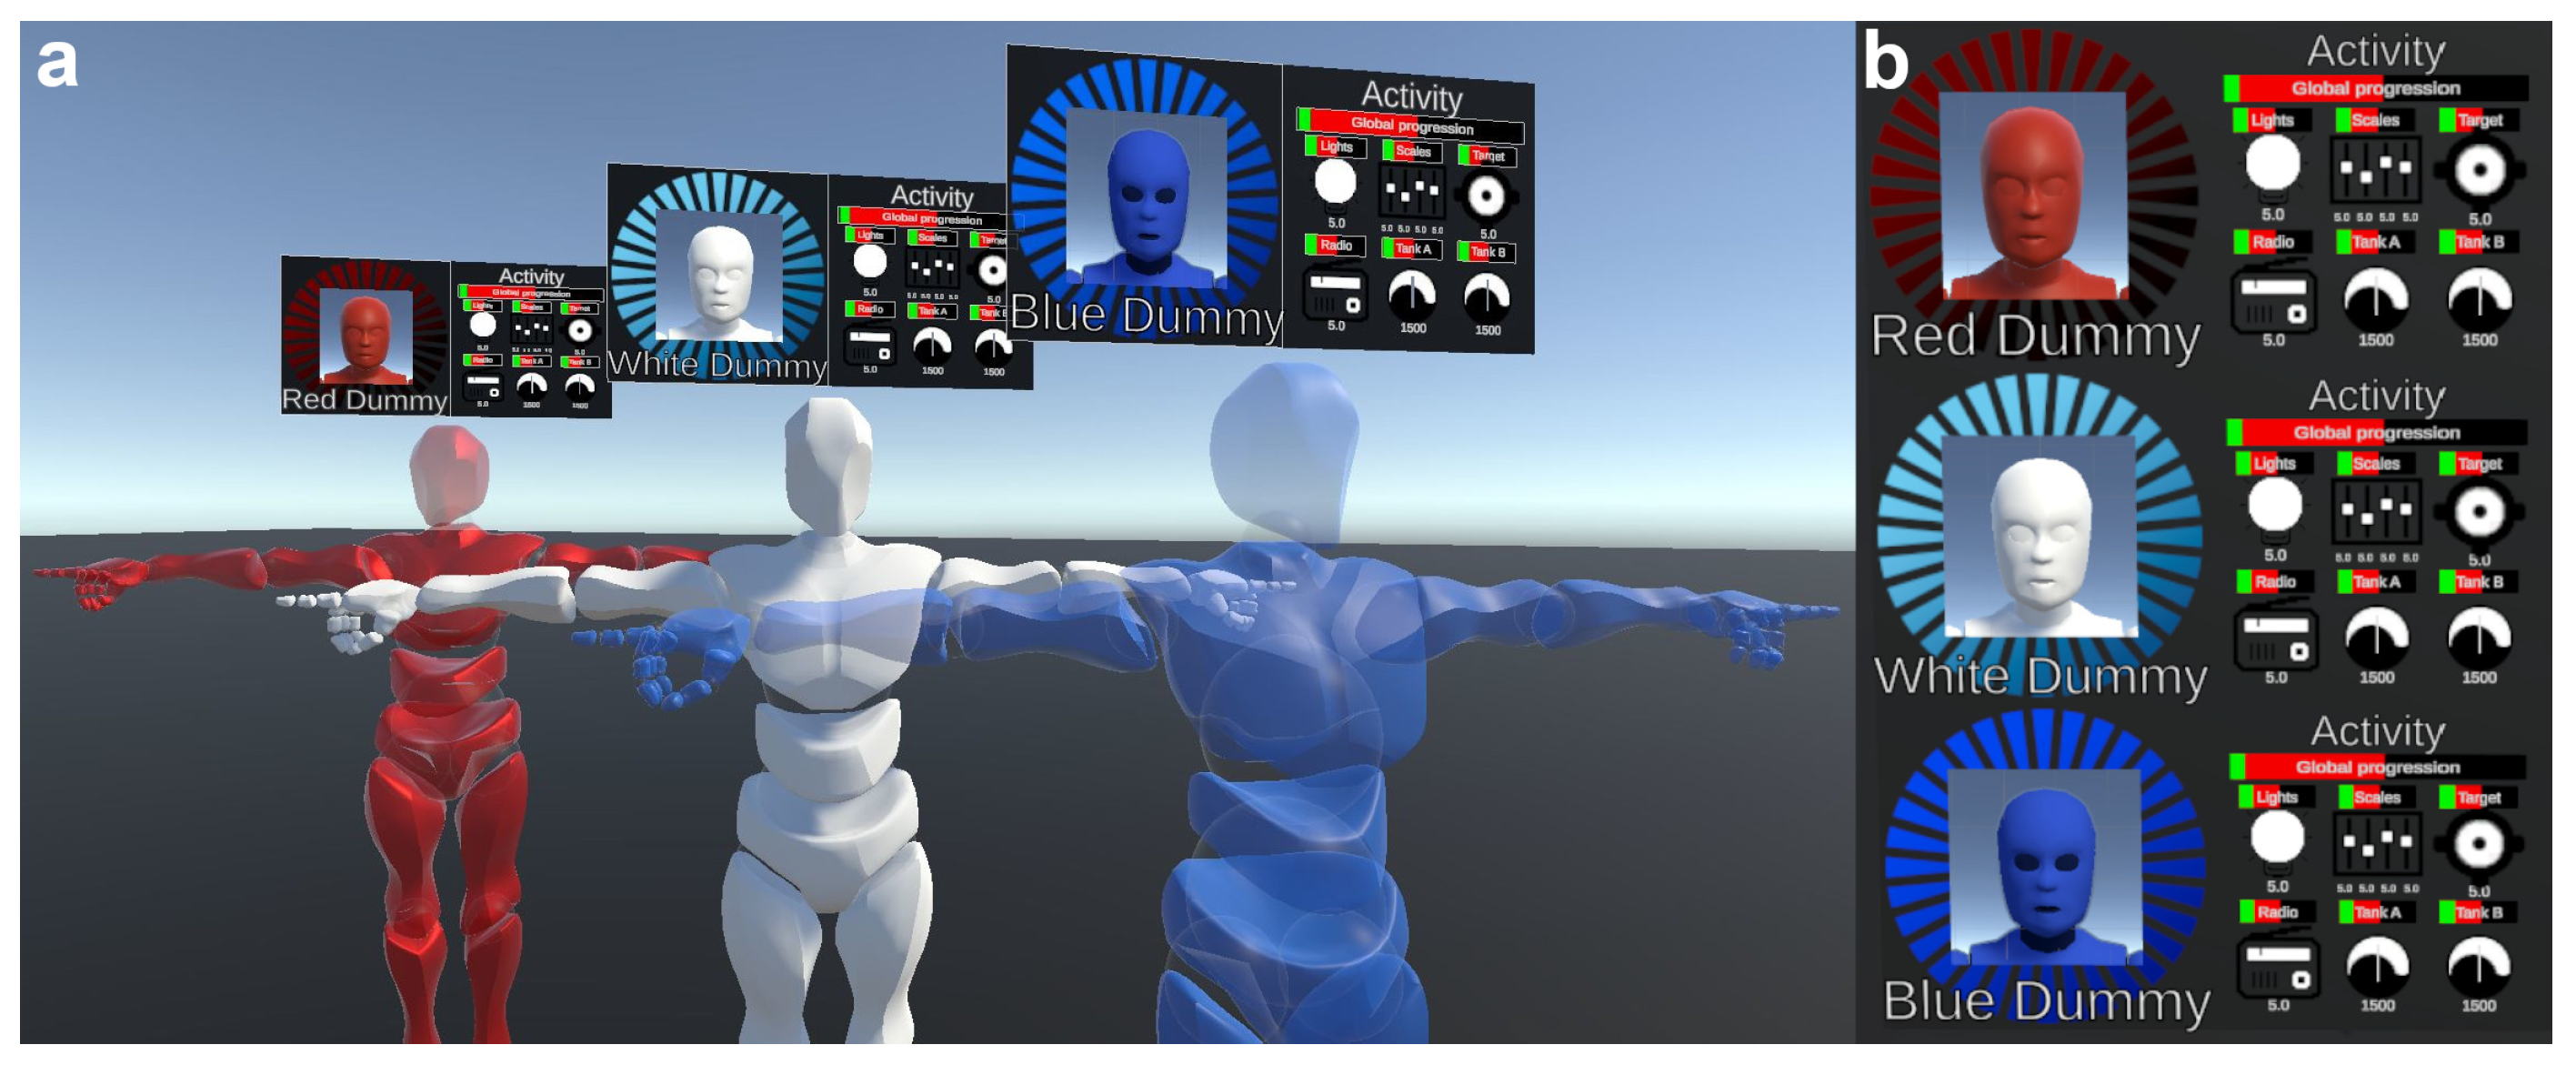
A 2D panel gathers all indicators representing the user’s activity (see
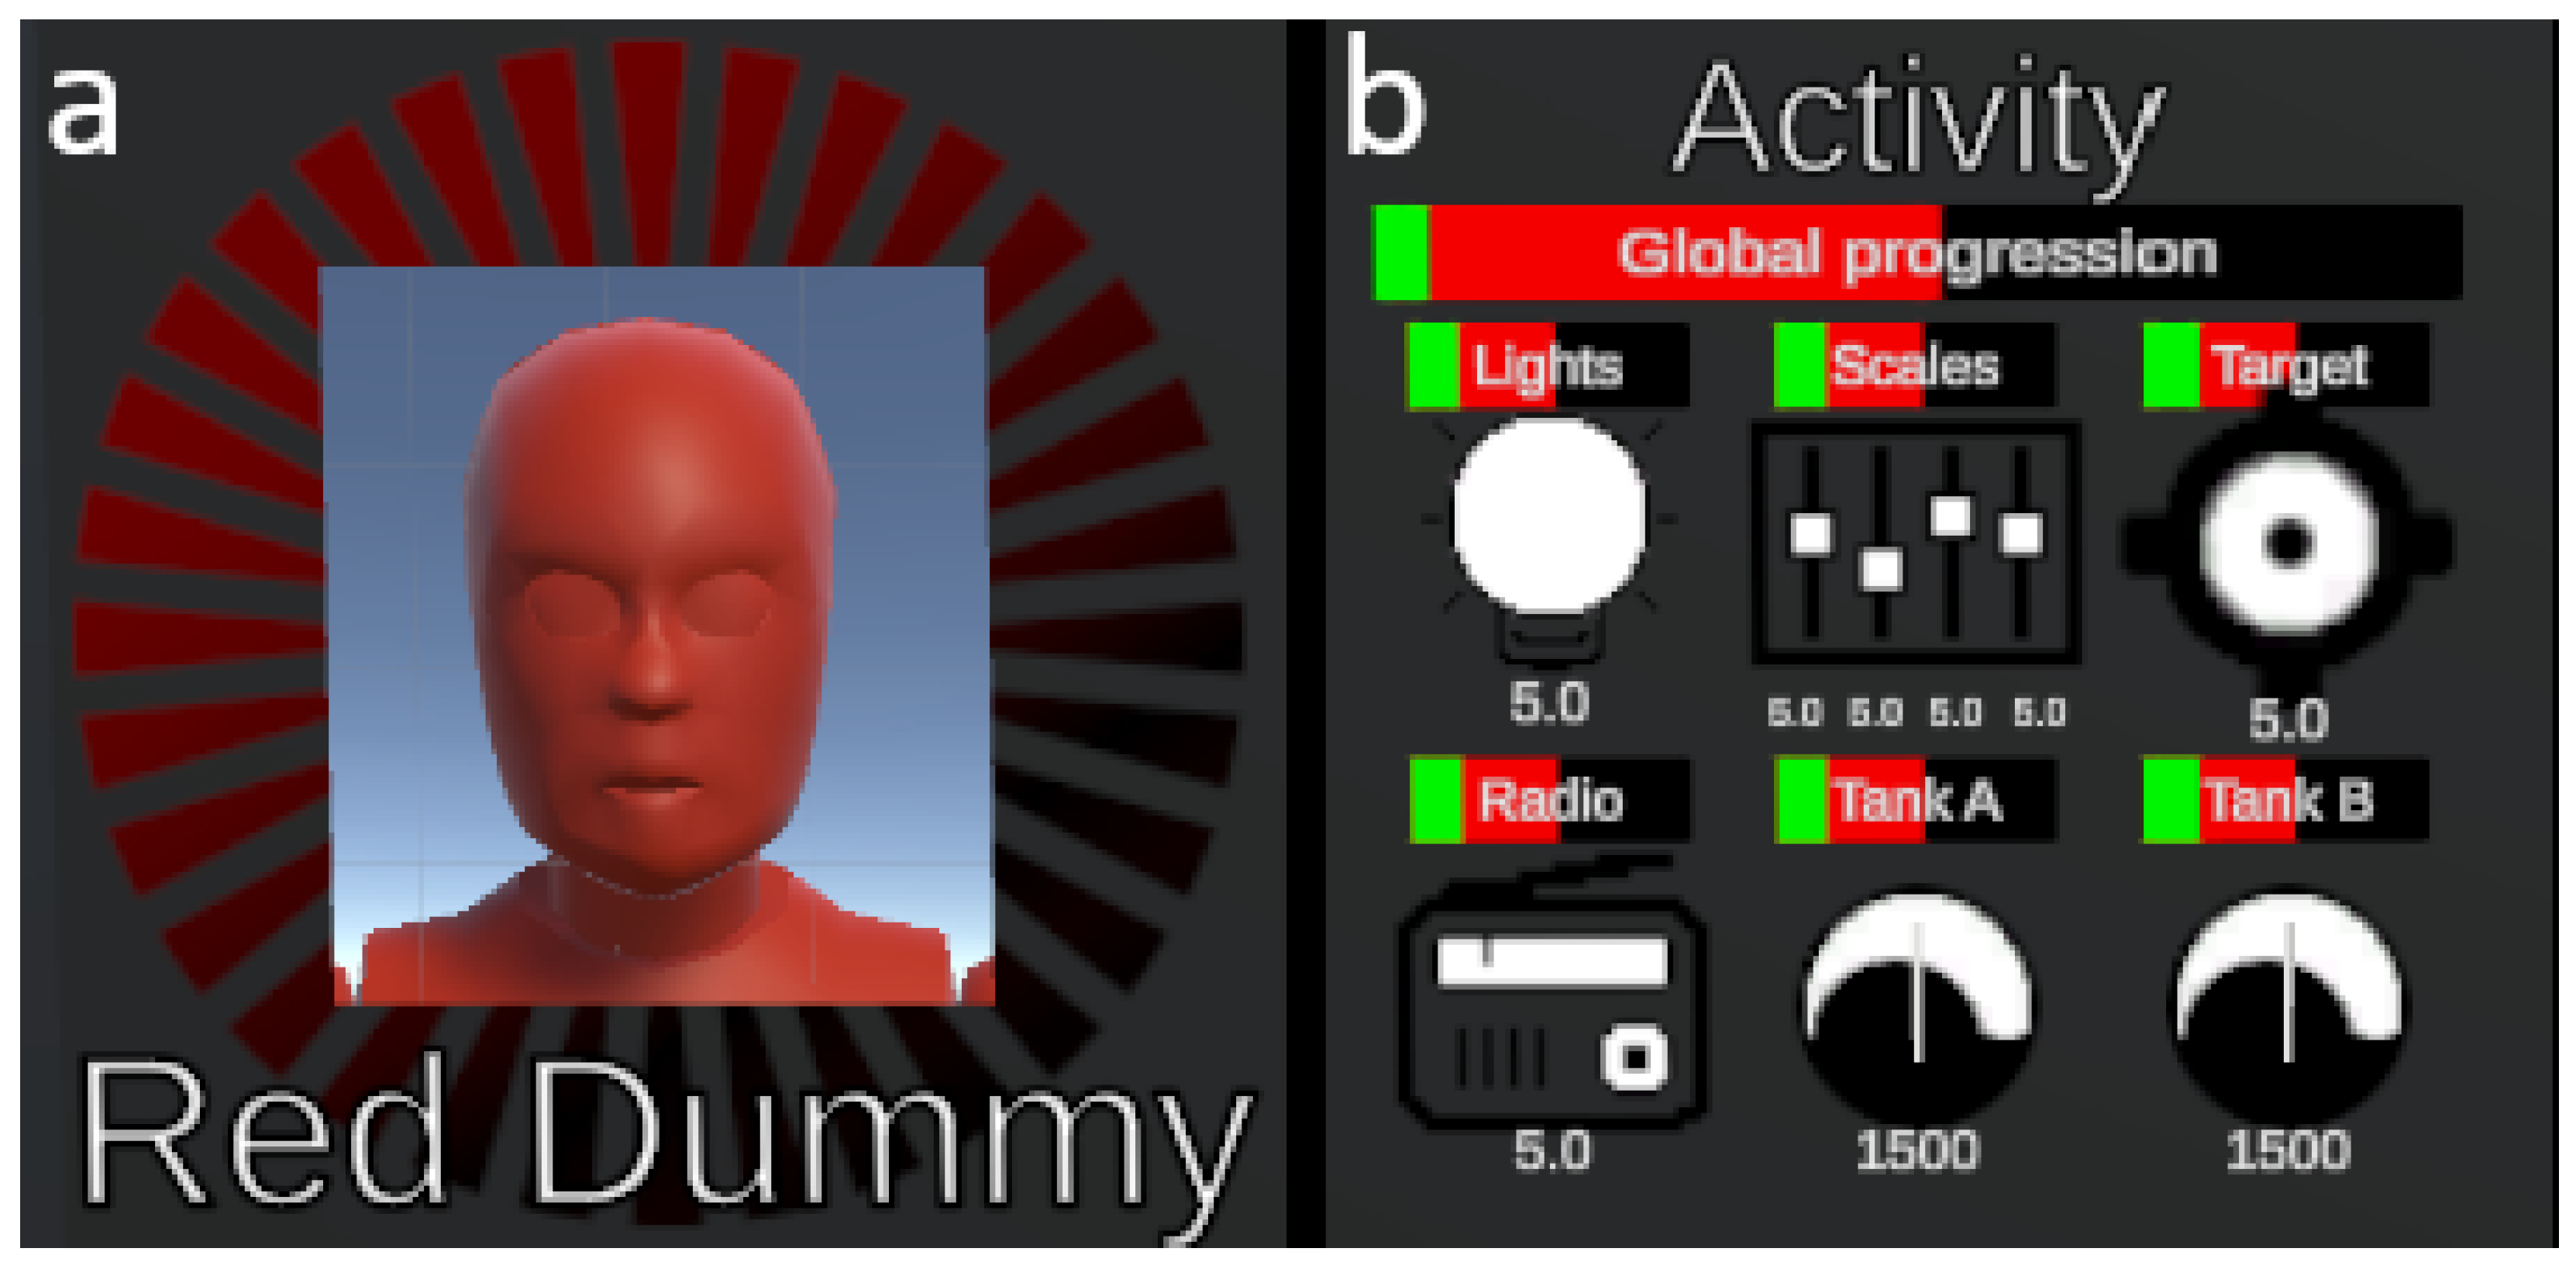
Figure 2). These indicators are divided into two groups: (a) identification and (b) task status.
The identification group (a) offers three ways to bind the rest of the panel to someone in the workspace, presenting awareness elements that answer the Who question. Three unique identifiers are attributed to each collaborator: a color (displayed as a background disc), a textual name (written at the bottom of the frame), and a visual (with a picture in the center of the frame). A full-body avatar creates visual and spatial awareness elements for the who and where questions and situates a user in the workspace.
To give information for the what, how, and when questions, the tasks’ status group (b) has two kinds of indicators: progress bars and icons. The progress bars are designed to give information about the progression of a task (i.e., how well is it going since the beginning?), and the icons are designed to give information about the current state of a task (i.e., is it currently going well?). During collaborative work, each user can be charged with tasks that will create a task load. Each task can be rewarded with a score, contributing to the final cumulative score of global activity. The progress bars show in red the sum of the task load from the beginning of the activity and in green the cumulative score. With a perfect score, i.e., a perfect completion of the task, the green bar would completely hide the red bar. A global progress bar shows the sum of all task load scores. At the end of an activity, red bars will completely fill the progress bar. The icons refer to a task or a part of a task; white icons fade to red as their bounded task triggers and time passes. When a task is inactive, its icon(s) is/are colored in white. When a task reaches its time limit, the colored part(s) of the icon is/are red if the task was not properly completed. In the current example, each icon represents a task or a subtask of the MATB-II system:
The upper-left first icon refers to the lights of the system monitoring task (sysmon): if at least one of the SYSMON lights is not in its normal state, the light bulb icon gradually fades to red.
The second icon (upper-middle) refers to the sysmon scales; each square gives information about one of the sysmon scales: if a scale quits its normal state, the associated square fades to red.
The upper-right icon refers to the tracking task (track); if the target quits the central zone of the track frame, the icon fades to red.
The lower-left icon refers to the communication task (comm); the icon starts fades to red at the end of the audio instruction.
The lower-middle and lower-right icons refer to the resource management task (resman); the left one is bounded to the left upper tank and the right one to the right upper tank (target tanks). While the fuel in a tank remains in the optimal range, the icon stays white; when the fuel level leaves that range, the icon gets more and more red as it gets further from the targeted value.
4.2. Workspace Situated Placement
We need then to find the best location to place the information in the user’s shared workspace. We investigated two main solutions: (i) distribution and (ii) aggregation of information.
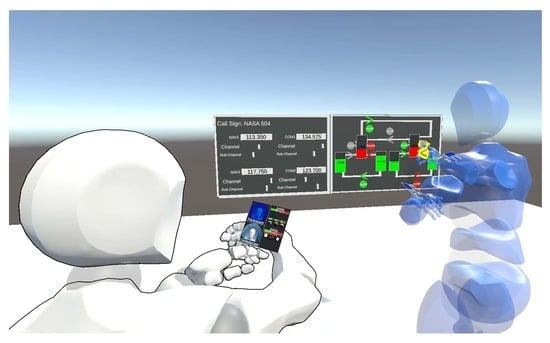
With a distributive placement, each piece of information is situated close to the person or object it refers to (see
Figure 3a). With an aggregative placement, all information is gathered in the same place. An aggregative panel (see
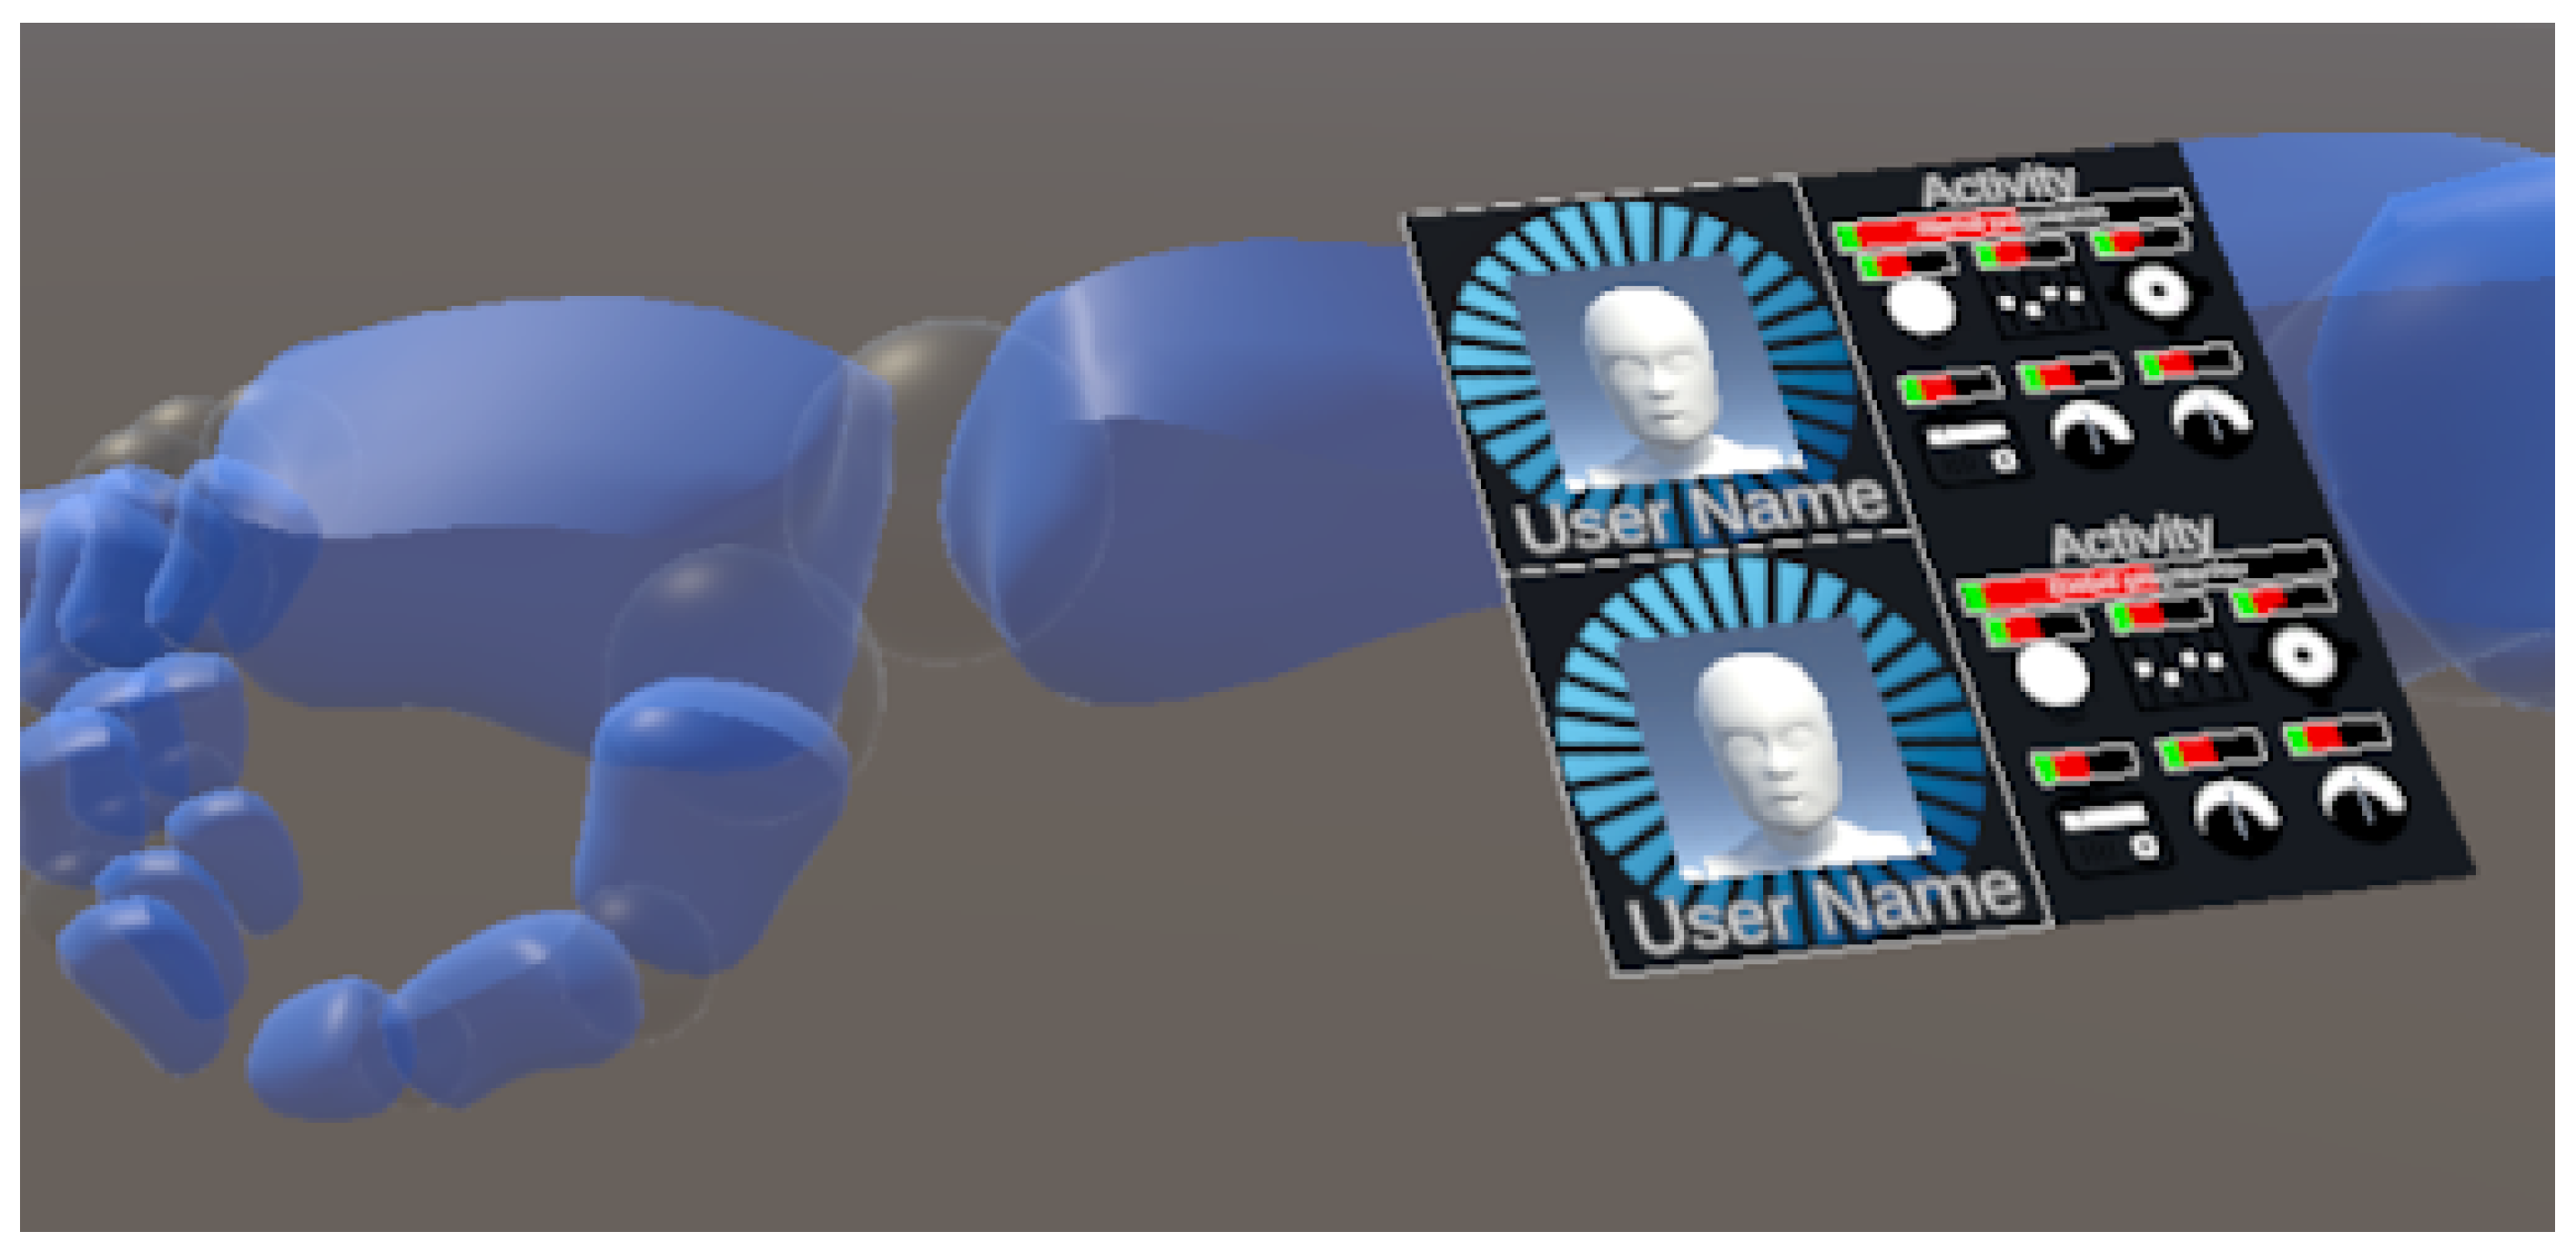
Figure 3b) can take multiple forms: a fixed panel in the workspace, a movable artifact, or a body-relative one (see
Figure 4).
4.3. Pilot Experiments
Alongside the development of the visualization techniques and the experimental platform, we regularly ran pilot experiments. The results of these experiments were purely qualitative and only helped to design the indicators and the collaborative VR application for the study.
Quickly, pilot experiments showed that placing information panels on top of the head of a close collaborator avatar was irrelevant, as people would not raise their heads to look at the panel. We believe that with more distance between users or a different presentation of information (e.g., augmented avatars), the distributive placement would be more useful; however, large distances were not evaluated in the pilots, as we wanted to allow users to move inside the virtual environment without any special navigation technique other than real movements. Pilot experiments also showed that people were not looking at fixed panels either and that the movable artifact was not convenient because it needed one hand to be moved; thus, we focused on body-relative placement.
At the beginning of the development, the users would have to work on a single floating panel containing the MATB-II interface. We saw that taking a small step back or just turning the head would suffice to have enough information about task status, and any indicator would not help in collaboration. We then decided to split the panel in two. We could either double the amount of MATB-II systems, one full interface per panel, or split the tasks of a single MATB-II system into the different panels. We chose the latter in order to keep the experiment as simple as possible.
When we were refining the parameters of the experiment to prepare the study, we saw that allowing dynamic responsibility for tasks led to longer experiments and blurred the notion of help between users. We also investigated if the participant had enough time to help the confederate. We determined that a 10 min duration was enough; indeed, the confederate needed help 10 times during that time (6 SYSMON tasks of 10 s each and 4 TRACK tasks of 30 s each). We give more details about the final experiment design used for the user study in the next section.
5. Experimental Design
We conducted a controlled within-participant experiment where participants would collaborate with an experimenter (confederate) in the MATB-II under two conditions: with and without user activity sharing. Given the results of the initial pilot experiments, we only focused on the body-relative placement. K. Schmidt [
32,
33] classified cooperation into three categories: (i) augmentative cooperation, where everyone has the same interaction capabilities; (ii) integrative cooperation, where people have complementary interaction capabilities; and (iii) debative cooperation, where discussion and strategy are the main parts of the collaborative activity. We avoided having a dynamic distribution of the roles (debative cooperation), so the participant had full responsibility for the
comm and
resman tasks, and the confederate had the responsibility for the
sysmon and
track tasks. When adapting MATB-II to VR, we had two options: either users would need their partner to complete each of their tasks (integrative cooperation), or users could complete all the tasks on their own except when they were overloaded, and only then would one’s partner help by doing one’s task for one (augmentative cooperation). The confederate was well-trained on the MATB-II and fulfilled his/her role quickly and accurately. Opting for augmentative cooperation helped to have an invariant need for help in task scenarios: to simulate a need for help, the confederate abandoned his tasks regularly, at the same time for each participant, and waited for help.
We recruited 20 unpaid volunteers (7 females, 13 males) aged 18 to 65 years old (mean: 26.7, sd: 10.7). We asked them to rate on a scale from 0 to 4 their use of video games (mean: 2.3, sd: 1.5), 3D environments (mean: 2.15, sd: 1.6), and immersive technologies (mean: 1.55, sd: 1.4).
5.1. Apparatus
To carry out the experiment, two unobstructed floor spaces of at least 2 × 2 m, two VR-ready computers connected together either via the Internet or via a Local Area Network, two immersive Head Mounted Displays (we used a HTC Vive Cosmos for the confederate and an Oculus Quest 2 for the participants) were required. The immersive technology difference had no effect on the user experience, as both HMDs offered the same interaction capabilities and the same feedback from the virtual environment. However, what is important is that all the participants had the same HMD, the Oculus Quest 2, and the confederate always had the same HTC Vive Cosmos. This did not induce variability in the experiment, so it is asserted to not have affected the results. The experiment itself was run by the
MATB-II-CVE application: Custom software was developed for this study (see the data availability section for accessing it, see
Figure 5) using the Unity 2018 game engine, the SteamVR Virtual Reality framework for VR tracking, and Photon, a network framework.
To transform a non-collaborative application like MATB-II to a collaborative one, S. Singh et al. chose to have a dynamic split of the responsibility of the tasks between a human and AI [
31]. However, we decided to split the responsibility of the four tasks between two human users: one would have the
comm and
resman tasks, the other the
sysmon and
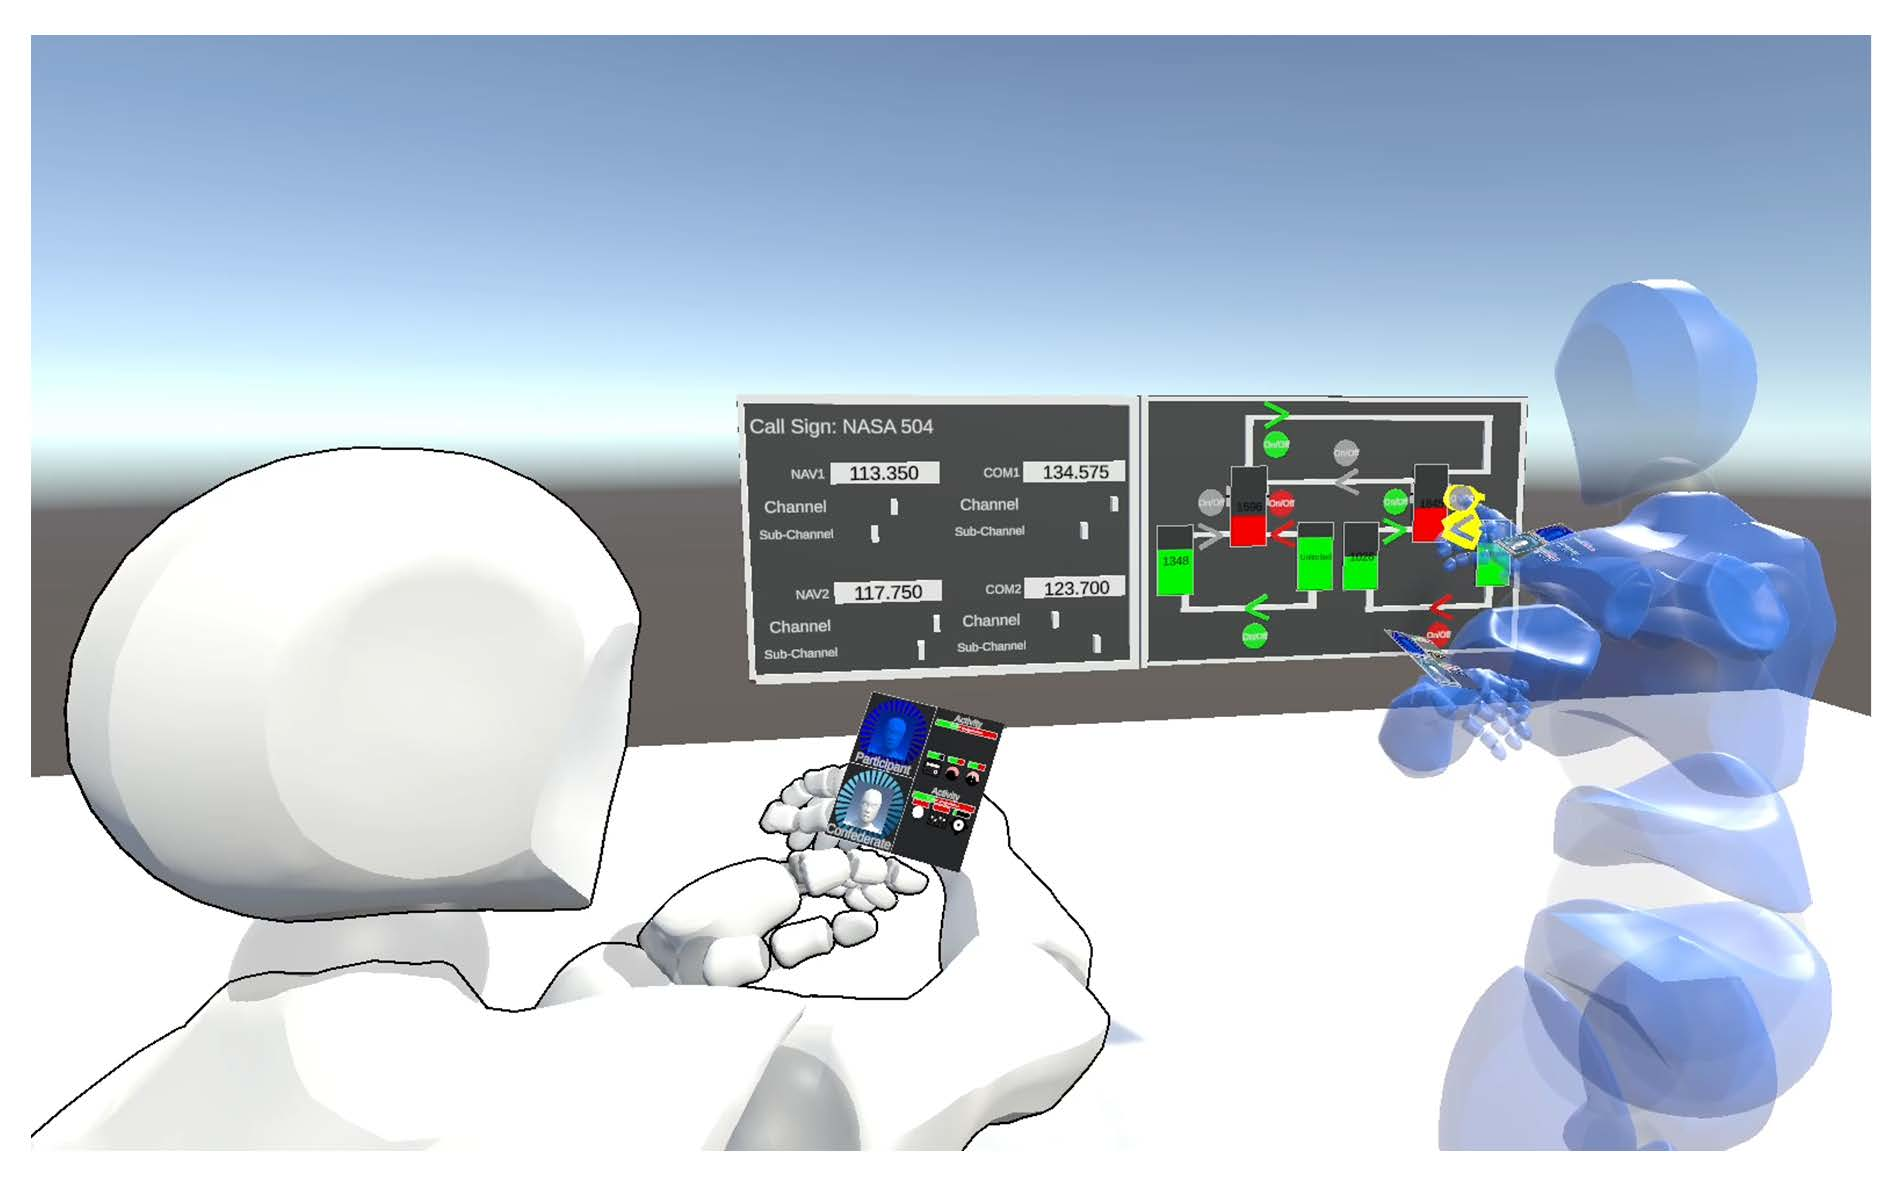
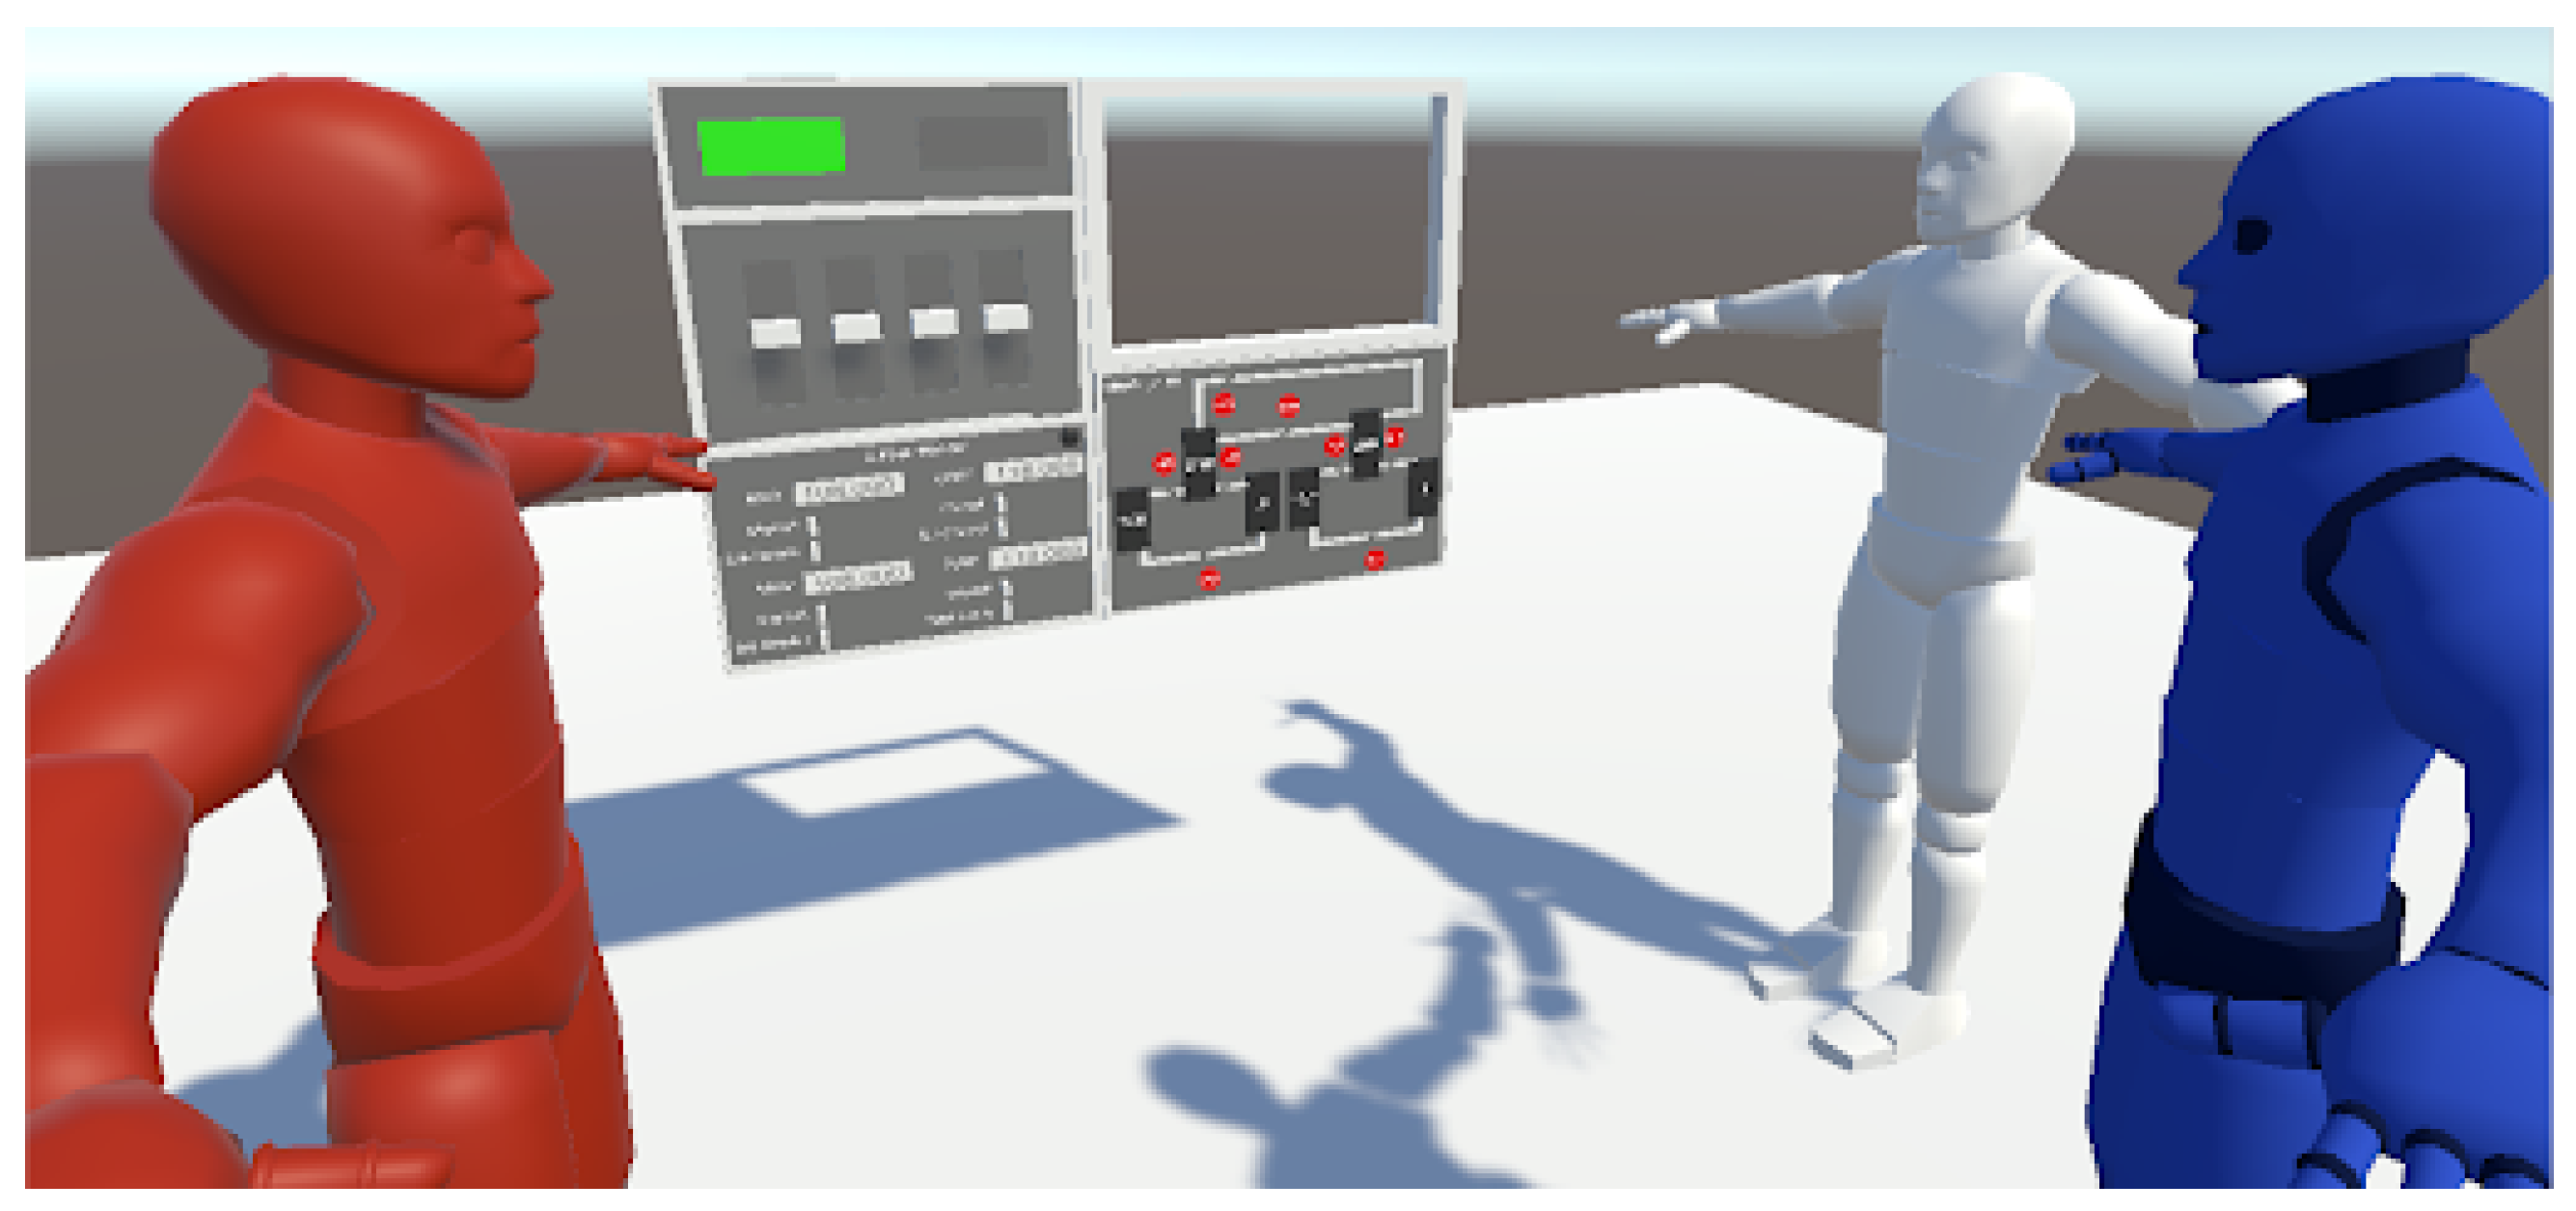
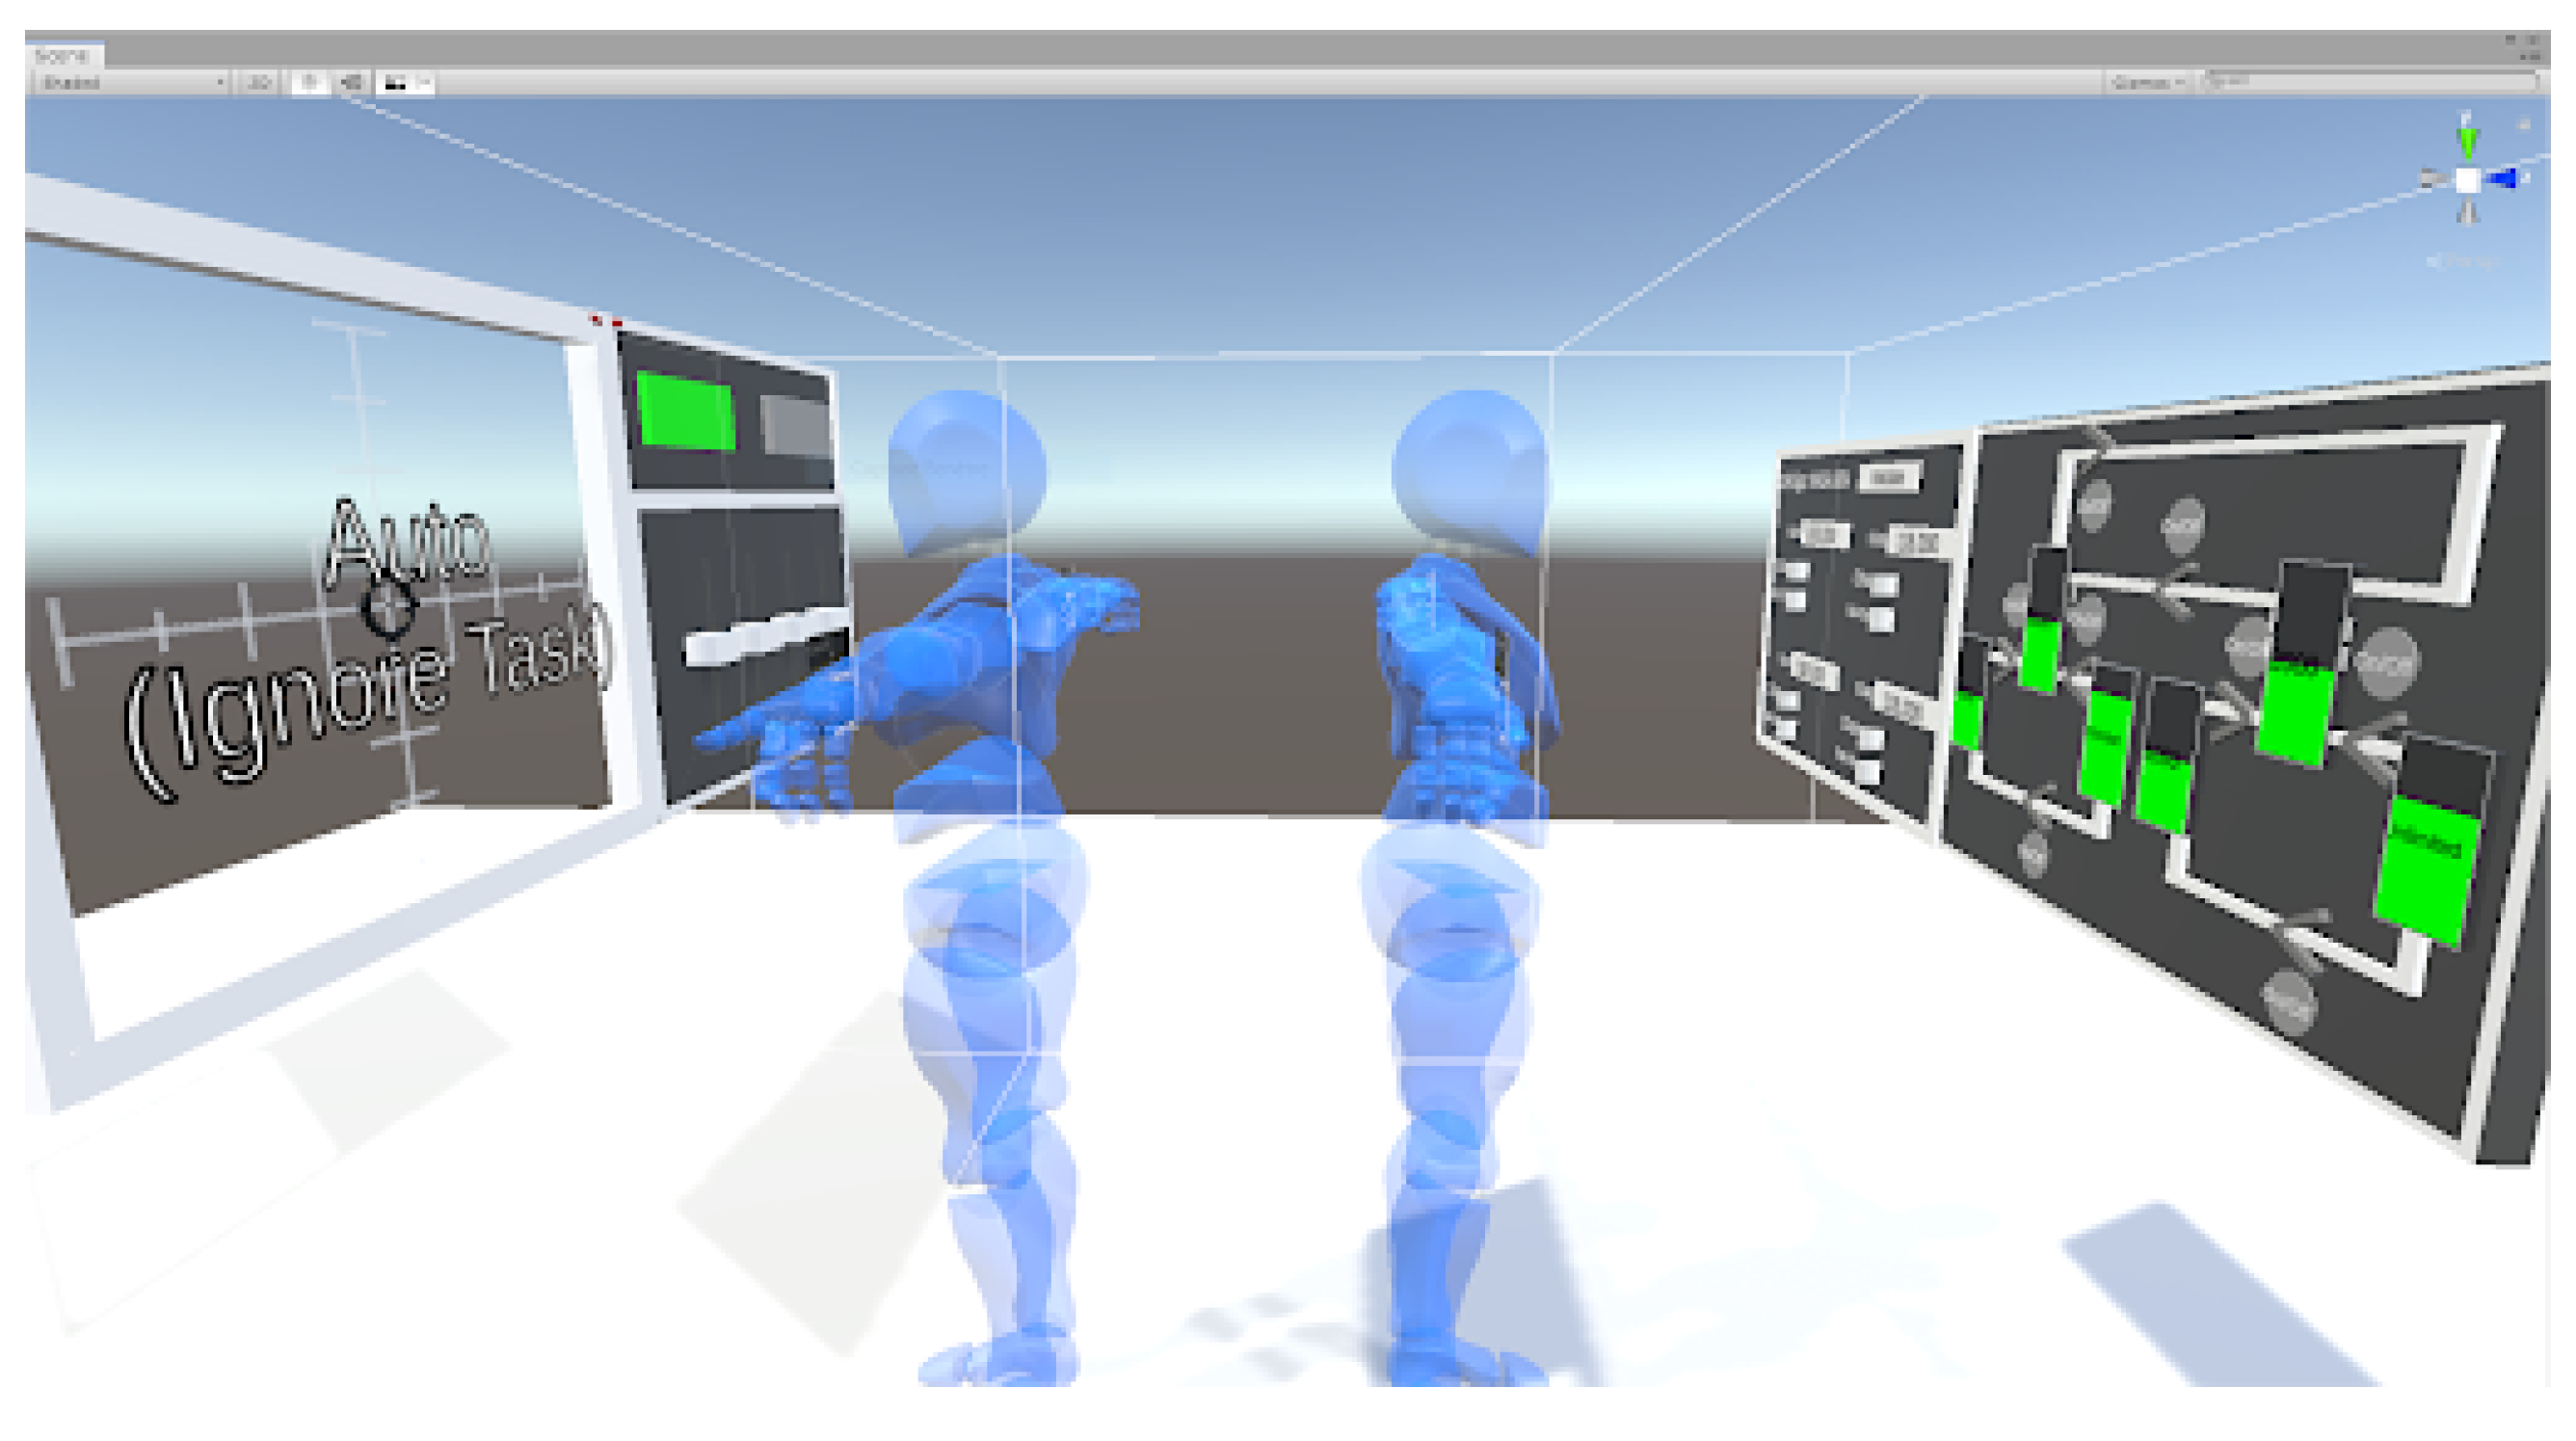
track tasks. We made two main modifications to the MATB-II system: we adapted it to VR and allowed multiple VR users to interact with it. In the early development of the application, users were side by side facing a unique MATB-II interface (see
Figure 6). In the pilot experiments, we quickly saw that taking a small step back or just turning the head would suffice to have enough information about task status, and any indicator would not help in collaboration. Thus, we decided to split the interface into two panels facing each other (see
Figure 7) to make it more difficult to get task status information at a quick glance.
5.2. Data Collection
In this study, we only had one independent variable: the data presentation mode. This factor has two possible values in this context: no data presentation (
NoData) and an aggregative body relative presentation (
AggData) (see
Figure 4). We can split the dependent variables into two categories: the objective measures (all quantitative) and the subjective measures from questionnaires.
Objective measures:
- -
Expected help—number of times the participant helps the confederate when expected;
- -
Unnecessary help—number of times the participant helps the confederate when there is no need.
Subjective measures:
- -
Demographics—age, gender, video games/3D environments/immersive technology habits;
- -
Evaluation of the progress bars;
- -
Evaluation of the icons;
- -
Estimation of participant’s self-ability to detect that the confederate needs help with and without indicators;
- -
Estimation of participant’s self ability to help the confederate needing help.
5.3. Protocol
We first gave detailed information and explanations to the participants. Then, we equipped them with an immersive headset and its controllers and started the initial training phase. For each condition, participants went through an additional training phase and a ten-minute task scenario, collaborating with the confederate. At the end of the experiment, participants were asked to answer a questionnaire to gather demographic data and subjective evaluation of the proposed indicators. The experiment lasted forty-five minutes for each participant.
There were three training phases: the initial training phase and two condition training phases. During the initial training, the participant could experience the completion of each task one after another: once the resman, the training stopped when the participant clearly said that they understood the functioning of all the pumps; the sysmon task twice; the track task once; the comm task twice; all messages not addressed to Nasa-504 were ignored in the count. The participant could ask to retry as many tasks as they wanted until ready to begin a 10-min scenario. Before each condition, the tasks triggered once each, one after another in the same order as the initial training phase. For the NoData condition, the participants were asked to complete the task as they triggered; this was followed by the simultaneous activation of all tasks at once, and the participant and the confederate completed their task together. For the AggData condition, the participants were asked to watch the indicators as the task went on while the confederate gave a detailed explanation of them. This was followed by the simultaneous activation of all tasks at once where the participant and the confederate completed their task together.
During the experiment, the participant and the confederate had to complete two task scenarios on the MATB-II interface. A scenario was 10 min long. This 10 min duration had been determined during preliminary pilot experiments, where we investigated if the participant helped the confederate. Indeed, within 10 min, the confederate needed help 10 times. These 10 times consisted of 6 SYSMON tasks (of 10 sec each) and 4 TRACK tasks (of 30 sec each). As such, we found that 10 min was enough to measure if the participant helped the confederate or not. It contained a fixed number of tasks (12 comm, 12 track, 12 resman, and 18 sysmon) to create a workload for the users, and activated multiple MATB-II tasks that overlapped in time, so the confederate and the participant had to work at the same time. It was divided into 3 phases, “participant is loaded more than confederate”; at the beginning and the other two phases were interchangeable: “confederate is loaded more than participant” and “both users are loaded”. Verbal communication (apart from reporting an issue) was prohibited to simulate distant collaboration in a noisy workspace. The confederate simulated a need for help by not doing a task following an invariant predefined scheme (1/2 of the track tasks and 1/3 of the sysmon tasks).
5.4. Hypothesis
We formulated two hypotheses about the user’s task status indicators: H1—people would prefer instantaneous information conveyed by icons to a history constructed from the progression bars in terms of activity feedback. This could only be measured by data gathered via the questionnaire. H2—people would more easily detect that a collaborator needs help with AggData compared to NoData. This could be measured by data gathered via the questionnaire and by counting the number of times participants will help the confederate (help measures).
6. Results
We first present objective data, followed by subjective data. Each participant went through two conditions, so we have data points. We checked for normality of the distribution with Shapiro–Wilk tests among measures, and we did not have normal distributions, so we used Wilcoxon tests to check if there were significant differences in results between the two conditions.
We did not observe any significant difference between the two conditions for the objective data, neither expected help () nor unnecessary help (). An explanation would be that the participant feared not being able to help the confederate with NoData. They were checking if the confederate was in need of help every few seconds at the risk of their own tasks.
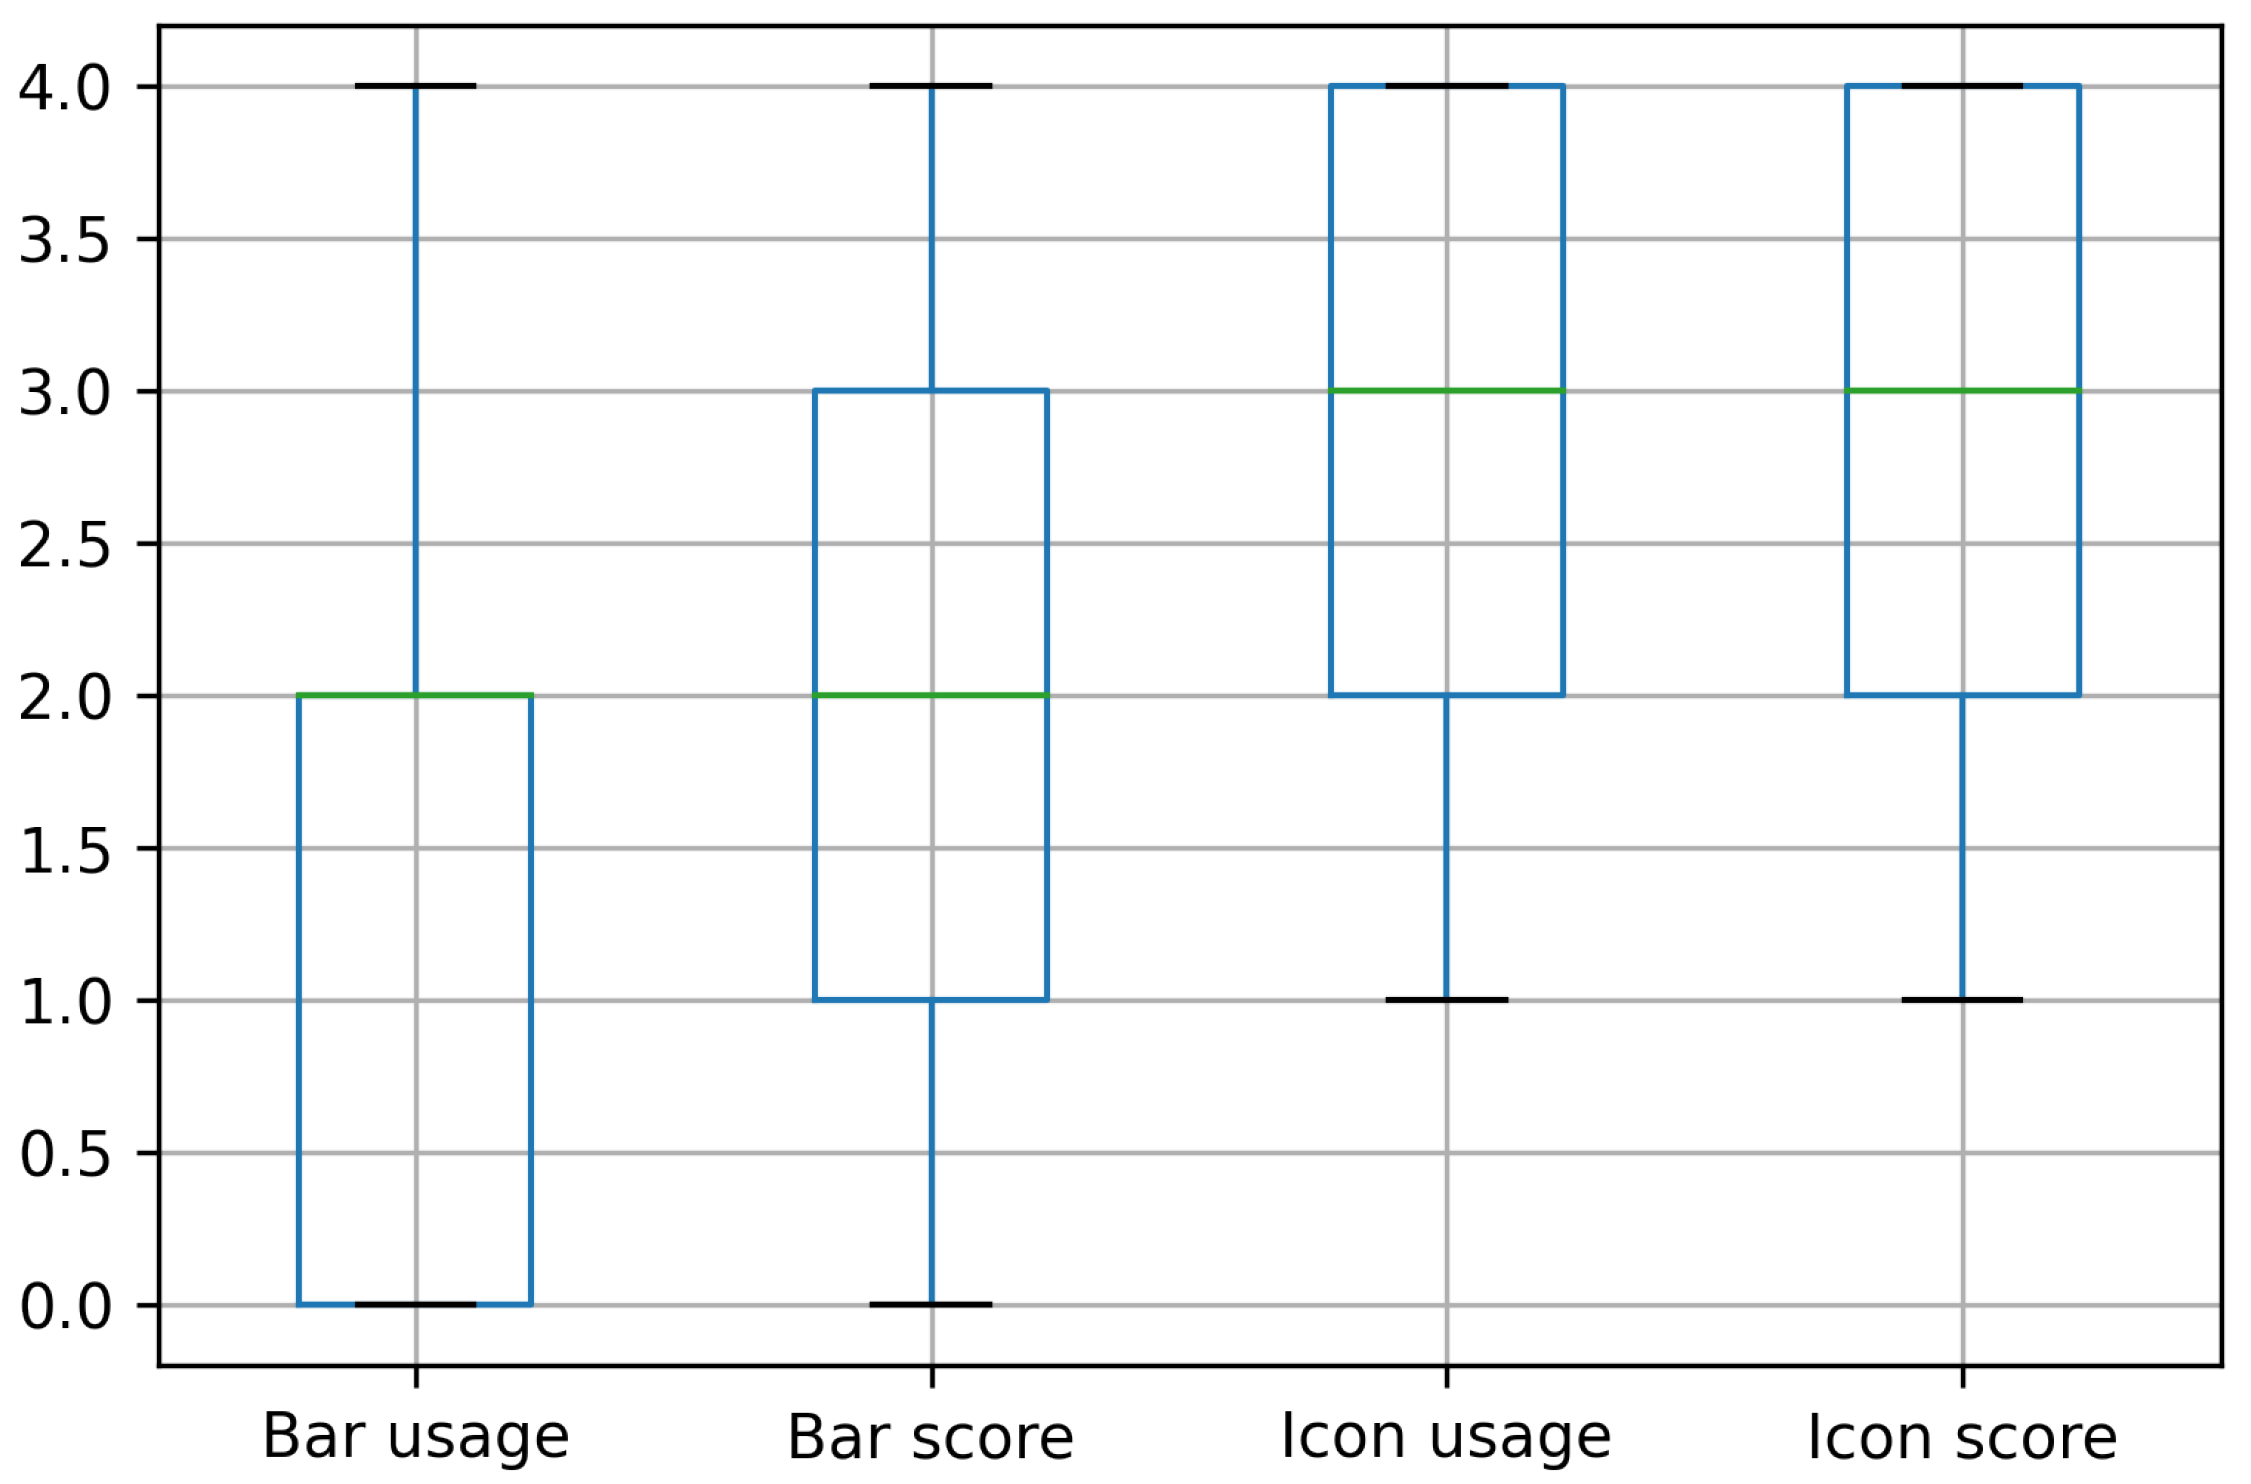
Concerning subjective data, participants evaluated bars and icons on two aspects: frequency of use and a score, both on a [0–4] scale. We observed significant differences between the frequency of use (
) and score (
) of bars and icons (
Figure 8).
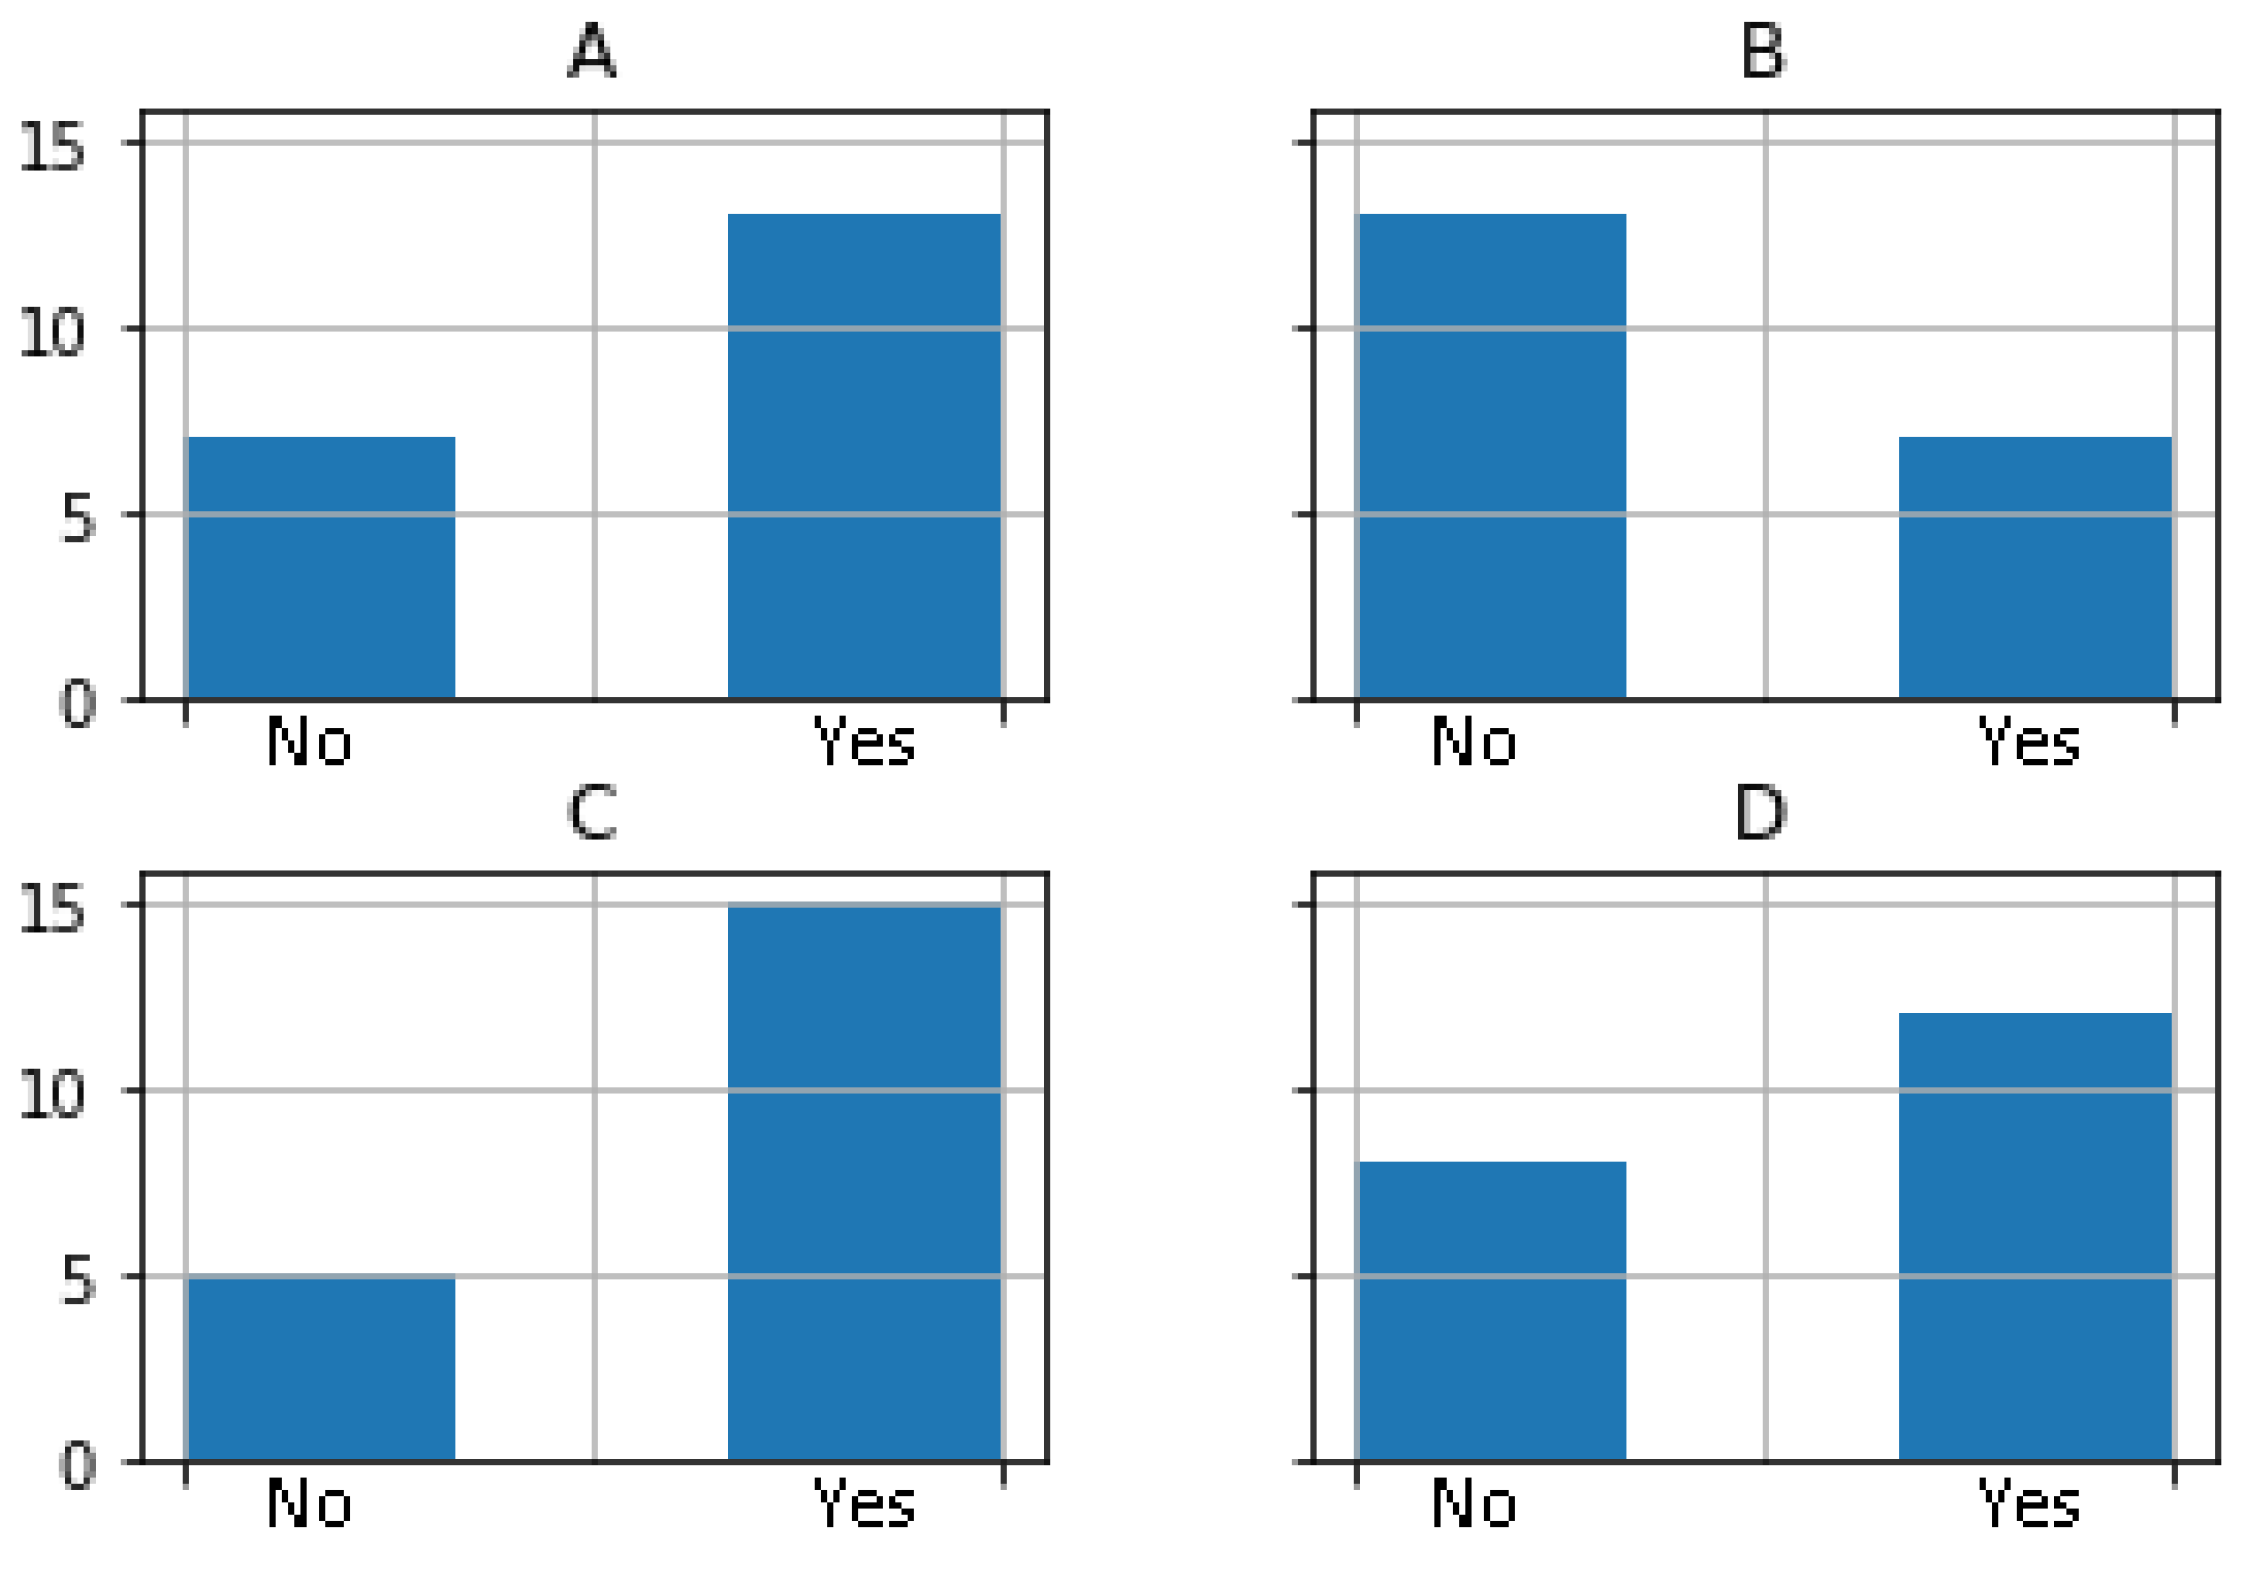
Participants also evaluated their ability to detect that their collaborator needs help and their ability to help a collaborator needing help with the two conditions, all with a binary response (yes or no). We observed a significant difference in participants’ perception of their ability to detect the need for help (
). Thirteen participants felt that they were able to detect when their collaborator needed help with
AggData (compared to only seven for
NoData). The difference in participants’ perception of their ability to help (
) was not significant (see
Figure 9).
7. Discussion
Results from the questionnaire show that icons were used significantly more often and were preferred by participants compared to progress bars for monitoring the collaborator’s activity in the context of continuous interaction with the MATB-II system. This supports H1 and demonstrates that users rely more on instantaneous activity feedback than a history of progression for such continuous collaboration with symmetrical interaction capabilities among collaborators.
The user’s activity indicators significantly allow users to estimate that they better detect the collaborator’s need for help, which supports H2. However, the estimation of self-ability to help the collaborator is not significantly improved, just like the measurement of expected and unnecessary help count.
The main limitation of our experiment is that it focuses only on a specific type of collaborative task. Given MATB-II is a realistic simulation of a stressful situation, it enables us to place a task load on users [
11]; however, it was not originally designed to be collaborative. Only augmentative cooperation can be done on a single task battery: users having the same interaction capability prevent integrative cooperation, and when a scenario is launched, the team has no time for debative cooperation. In our case, the only way to help someone was by doing their task, and it is very unpleasant when someone interferes with our task, judging we are not doing it well or fast enough. This could explain why the experiment failed to demonstrate with quantitative measures the benefits of sharing the user’s activity. To draw a more generic conclusion about collaboration in VR, it would be necessary also to address all the categories of collaborative tasks.
This experiment was a generic way to assess real use cases of teamwork. The approach we used, sharing users’ activity, can be applied to different situations: command centers [
34], airliners pilots [
35], air traffic control [
36,
37,
38], or any other type of augmentative computer-supported collaborative work (CSCW) between humans.
8. Conclusions
Efficient collaboration in VR requires not only perceiving partners’ positions and actions, but also understanding their individual status (task activity, emotional states, fatigue, etc.). In this paper, we explored several solutions to visualize and share the user’s activity in a collaborative virtual environment. We then evaluated the tasks’ status part in a controlled experiment based on a VR adaptation of the NASA MATB-II system. We show that giving information on the task status enhances the detection of the need for help and that people prefer instantaneous information to progress history in a continuous augmentative cooperation scenario. MATB-II has limitations for collaboration. It generates interference when we want to collaborate: to help someone, you have to do his task for him. A future study, such as investigating the distribution of tasks and the balancing of the workload of a team, would create more opportunities to explore the different cooperation modes.
Author Contributions
Conceptualization, T.R., C.F., G.C., T.D. and B.H.T.; data curation, T.R.; formal analysis, T.R., C.F. and G.C.; funding acquisition, T.D.; investigation, T.R.; methodology, T.R., C.F., T.D. and B.H.T.; project administration, T.D. and B.H.T.; resources, T.D.; software, T.R.; supervision, C.F., G.C., T.D. and B.H.T.; validation, C.F., T.D. and B.H.T.; visualization, T.R.; writing—original draft, T.R.; writing—review and editing, T.R., J.W., C.F., T.D. and B.H.T. All authors have read and agreed to the published version of the manuscript.
Funding
This research was supported by the Centre National de la Recherche Scientifique (CNRS) with international PhD funding, and by the University of South Australia (UniSA) through a PhD scholarship. This work was also supported by French government funding managed by the National Research Agency under the Investments for the Future program (PIA) grant ANR-21-ESRE-0030 (CONTINUUM).
Institutional Review Board Statement
The study was conducted in accordance with the Declaration of Helsinki and approved by the Ethics Committee of IMT Atlantique (approved on 2 December 2021).
Informed Consent Statement
Informed consent was obtained from all subjects involved in the study.
Data Availability Statement
The data presented in this study are openly available on GitHub at
https://github.com/ThomasRinnert/MATB-II_CollabVR, accessed on 12 December 2022. The MATB-II-CVE application can be found as compiled Desktop and VR windows executables or as a Unity 2018 project in this repository. The measures acquired during the user study can be found in the same repository as “XP1_Results.csv”.
Acknowledgments
We would like to thank Fabrice Poirier for his quick introduction to statistical analysis; Pierre Bégout, Nicolas Delcombel, and Anthony David for their help with Unity development; Damien Bouchabou and Benjamin Sommers for their help with the network’s architecture; Jerome Kerdreux for his help with finding a place and some equipment to run the experiment; and all participants, especially those who told their friends and family about the study.
Conflicts of Interest
The authors declare no conflict of interest.
Abbreviations
The following abbreviations are used in this manuscript:
| VR | Virtual Reality |
| AR | Augmented Reality |
| CVE | Collaborative Virtual Environment |
| MATB-II | Multi Attribute Task Battery II |
| -resman | Resource management task |
| -sysmon | System monitoring task |
| -track | Tracking task |
| -comm | Communication task |
References
- Kamińska, D.; Sapiński, T.; Wiak, S.; Tikk, T.; Haamer, R.E.; Avots, E.; Helmi, A.; Ozcinar, C.; Anbarjafari, G. Virtual reality and its applications in education: Survey. Information 2019, 10, 318. [Google Scholar] [CrossRef]
- Thomas, B.H. A survey of visual, mixed, and augmented reality gaming. Comput. Entertain. 2012, 10, 1–33. [Google Scholar] [CrossRef]
- Berg, L.P.; Vance, J.M. Industry use of virtual reality in product design and manufacturing: A survey. Virtual Real. 2017, 21, 1–17. [Google Scholar] [CrossRef]
- Noghabaei, M.; Heydarian, A.; Balali, V.; Han, K. Trend analysis on adoption of virtual and augmented reality in the architecture, engineering, and construction industry. Data 2020, 5, 26. [Google Scholar] [CrossRef]
- Berni, A.; Borgianni, Y. Applications of virtual reality in engineering and product design: Why, what, how, when and where. Electronics 2020, 9, 1064. [Google Scholar] [CrossRef]
- de Belen, R.A.J.; Nguyen, H.; Filonik, D.; Favero, D.D.; Bednarz, T. A systematic review of the current state of collaborative mixed reality technologies: 2013–2018. Aims Electron. Electr. Eng. 2019, 3, 181–223. [Google Scholar] [CrossRef]
- Benford, S.; Fahlén, L. A Spatial Model of Interaction in Large Virtual Environments. In Proceedings of the ECSCW ’93 Third European Conference on Computer-Supported Cooperative Work, Milan, Italy, 13–17 September 1993; pp. 109–124. [Google Scholar] [CrossRef]
- Gutwin, C.; Greenberg, S. A descriptive framework of workspace awareness for real-time groupware. In Computer Supported Cooperative Work; Kluwer Academic Publishers: Amsterdam, The Netherland, 2002; Volume 11, pp. 411–446. [Google Scholar] [CrossRef]
- Le Chénéchal, M.; Duval, T.; Gouranton, V.; Royan, J.; Arnaldi, B. Help! I Need a Remote Guide in My Mixed Reality Collaborative Environment. Front. Robot. AI 2019, 6, 106. [Google Scholar] [CrossRef] [PubMed]
- Piumsomboon, T.; Lee, Y.; Lee, G.A.; Dey, A.; Billinghurst, M. Empathic Mixed Reality: Sharing What You Feel and Interacting with What You See. In Proceedings of the 2017 International Symposium on Ubiquitous Virtual Reality (ISUVR), Nara, Japan, 27–29 June 2017; pp. 38–41. [Google Scholar] [CrossRef]
- Santiago-Espada, Y.; Myer, R.R.; Latorella, K.A.; Comstock, J.R. The Multi-Attribute Task Battery II (MATBII): Software for Human Performance and Workload Research: A User’s Guide; NASA Technical Memorandum (TM) 217164; NASA: Washington, DC, USA, 2001.
- Sereno, M.; Wang, X.; Besancon, L.; Mcguffin, M.J.; Isenberg, T. Collaborative Work in Augmented Reality: A Survey. IEEE Trans. Vis. Comput. Graph. 2020, 28, 2530–2549. [Google Scholar] [CrossRef] [PubMed]
- Yang, Y.; Dwyer, T.; Wybrow, M.; Lee, B.; Cordeil, M.; Billinghurst, M.; Thomas, B.H. Towards immersive collaborative sensemaking. Proc. ACM Hum. Comput. Interact. 2022, 6, 722–746. [Google Scholar] [CrossRef]
- Beck, S.; Kunert, A.; Kulik, A.; Froehlich, B. Immersive Group-to-Group Telepresence. IEEE Trans. Vis. Comput. Graph. 2013, 19, 616–625. [Google Scholar] [CrossRef]
- Yoon, B.; Kim, H.I.; Lee, G.A.; Billinghurst, M.; Woo, W. The effect of avatar appearance on social presence in an augmented reality remote collaboration. In Proceedings of the 26th IEEE Conference on Virtual Reality and 3D User Interfaces (VR), Osaka, Japan, 23–27 March 2019; pp. 547–556. [Google Scholar] [CrossRef]
- Piumsomboon, T.; Dey, A.; Ens, B.; Lee, G.; Billinghurst, M. The effects of sharing awareness cues in collaborative mixed reality. Front. Robot. AI 2019, 6, 5. [Google Scholar] [CrossRef] [PubMed]
- Fraser, M.; Benford, S.; Hindmarsh, J.; Heath, C. Supporting awareness and interaction through collaborative virtual interfaces. In Proceedings of the UIST (User Interface Software and Technology), Asheville, NA, USA, 7–10 November 1999; Volume 1, pp. 27–36. [Google Scholar] [CrossRef]
- Bai, H.; Sasikumar, P.; Yang, J.; Billinghurst, M. A User Study on Mixed Reality Remote Collaboration with Eye Gaze and Hand Gesture Sharing. In Proceedings of the 2020 CHI Conference on Human Factors in Computing Systems, Honolulu, HI, USA, 25–30 April 2020; pp. 1–13. [Google Scholar] [CrossRef]
- Niewiadomski, R.; Hyniewska, S.J.; Pelachaud, C. Constraint-based model for synthesis of multimodal sequential expressions of emotions. IEEE Trans. Affect. Comput. 2011, 2, 134–146. [Google Scholar] [CrossRef]
- Dey, A.; Piumsomboon, T.; Lee, Y.; Billinghurst, M. Effects of sharing physiological states of players in collaborative virtual reality gameplay. In Proceedings of the Conference on Human Factors in Computing Systems, Denver, CO, USA, 6–11 May 2017; pp. 4045–4056. [Google Scholar] [CrossRef]
- Dey, A.; Chen, H.; Hayati, A.; Billinghurst, M.; Lindeman, R.W. Sharing manipulated heart rate feedback in collaborative virtual environments. In Proceedings of the 2019 IEEE International Symposium on Mixed and Augmented Reality (ISMAR), Beijing, China, 14–18 October 2019; pp. 248–257. [Google Scholar] [CrossRef]
- Bowman, D.A.; Wingrave, C.A. Design and evaluation of menu systems for immersive virtual environments. In Proceedings of the Virtual Reality Annual International Symposium, Yokohama, Japan, 13–17 March 2001; pp. 149–156. [Google Scholar] [CrossRef]
- Ready At Dawn Studios. EchoVR; Videogame PC; Ready At Dawn Studios: Irvine, CA, USA, 2017. [Google Scholar]
- Ramen VR. Zenith: The Last City; Videogame PC; Ramen VR: San Francisco, CA, USA, 2022. [Google Scholar]
- Bégout, P.; Duval, T.; Kubicki, S.; Charbonnier, B.; Bricard, E. WAAT: A Workstation AR Authoring Tool for Industry 4.0. In Augmented Reality, Virtual Reality, and Computer Graphics: Proceedings of the International Conference on Augmented Reality, Virtual Reality and Computer Graphics, Lecce, Italy, 7–10 September 2020; Lecture Notes in Computer Science; Springer: Cham, Switzerland, 2020; Volume 12243, pp. 304–320. [Google Scholar]
- Jing, A.; Gupta, K.; Mcdade, J.; Lee, G.A.; Billinghurst, M. Comparing Gaze-Supported Modalities with Empathic Mixed Reality Interfaces in Remote Collaboration. In Proceedings of the 2022 IEEE International Symposium on Mixed and Augmented Reality (ISMAR), Singapore, 17–21 October 2022; pp. 837–846. [Google Scholar] [CrossRef]
- Sasikumar, P.; Pai, Y.S.; Bai, H.; Billinghurst, M. PSCVR: Physiological Sensing in Collaborative Virtual Reality. In Proceedings of the 2022 IEEE International Symposium on Mixed and Augmented Reality Adjunct (ISMAR-Adjunct), Singapore, 17–21 October 2022. [Google Scholar] [CrossRef]
- Luong, T.; Argelaguet, F.; Martin, N.; Lecuyer, A. Introducing Mental Workload Assessment for the Design of Virtual Reality Training Scenarios. In Proceedings of the 2020 IEEE Conference on Virtual Reality and 3D User Interfaces (VR), Atlanta, GA, USA, 22–26 March 2020; pp. 662–671. [Google Scholar] [CrossRef]
- Rauffet, P.; Said, F.; Laouar, A.; Chauvin, C.; Bressolle, M.C. Cognitive Control Modes and Mental Workload: An Experimental Approach. In Proceedings of the 4th International Conference on Computer-Human Interaction Research and Applications (CHIRA 2020), Budapest, Hungary, 5–6 November 2020; pp. 17–26. [Google Scholar] [CrossRef]
- Luong, T.; Martin, N.; Raison, A.; Argelaguet, F.; Diverrez, J.M.; Lecuyer, A. Towards Real-Time Recognition of Users Mental Workload Using Integrated Physiological Sensors into a VR HMD. In Proceedings of the 2020 IEEE International Symposium on Mixed and Augmented Reality (ISMAR), Porto de Galinhas, Brazil, 9–13 November 2020; pp. 425–437. [Google Scholar] [CrossRef]
- Singh, S.; Heard, J. A Human-Aware Decision Making System for Human-Robot Teams. In Proceedings of the 2022 17th Annual System of Systems Engineering Conference (SOSE), Rochester, NY, USA, 7–11 June 2022; pp. 268–273. [Google Scholar] [CrossRef]
- Schmidt, K.; Rasmussen, J.; Brehmer, B.; Leplat, J. Cooperative Work: A Conceptual Framework. In Distributed Decision Making: Cognitive Models for Cooperative Work; John Wiley & Sons: Hoboken, NJ, USA, 1991. [Google Scholar]
- Schmidt, K. Cooperative Work and its Articulation: Requirements for Computer Support. Le Travail Humain 1994, 57, 345–366. [Google Scholar]
- Prouzeau, A.; Bezerianos, A.; Chapuis, O.; Road, T.; Management, T.; Bezerianos, A.; Chapuis, O. Towards Road Traffic Management with Forecasting on Wall Displays. In Proceedings of the 2016 ACM International Conference on Interactive Surfaces and Spaces, Niagara Falls, ON, Canada, 6–9 November 2016. [Google Scholar]
- Becquet, V.; Letondal, C.; Vinot, J.L.; Pauchet, S. How do Gestures Matter for Mutual Awareness in Cockpits? In Proceedings of the 2019 on Designing Interactive Systems Conference, San Diego, CA, USA, 23–28 June 2019; pp. 593–605. [Google Scholar] [CrossRef]
- Mackay, W.E. Is Paper Safer? The Role of Paper Flight Strips in Air Traffic Control. ACM Trans. Comput. Hum. Interact. 1999, 6, 311–340. [Google Scholar] [CrossRef]
- Valès, S.; Chatty, S.; Lemort, A.; Conversy, S.; Valès, S.; Chatty, S.; Lemort, A.; Collabo, S.C.M.P.; Vales, S.; Chatty, S.; et al. MAMMI Phase1–Collaborative workspaces for en-route air traffic controllers. In Proceedings of the 5th Eurocontrol Innovative Research Workshop & Exhibition, Bretigny-sur-Orge, France, 5–7 December 2006. [Google Scholar]
- Mertz, C.; Chatty, S. The influence of design techniques on user interfaces: The DigiStrips experiment for air traffic control. In Proceedings of the International Conference on Human-Computer Interaction in Aeronautics (HCI-Aero), Toulouse, France, 27–29 September 2000; pp. 1–6. [Google Scholar]
| Disclaimer/Publisher’s Note: The statements, opinions and data contained in all publications are solely those of the individual author(s) and contributor(s) and not of MDPI and/or the editor(s). MDPI and/or the editor(s) disclaim responsibility for any injury to people or property resulting from any ideas, methods, instructions or products referred to in the content. |
© 2023 by the authors. Licensee MDPI, Basel, Switzerland. This article is an open access article distributed under the terms and conditions of the Creative Commons Attribution (CC BY) license (https://creativecommons.org/licenses/by/4.0/).

 ,
, 


