Article

Comparative Study of Machine Learning Algorithms to Classify Hand Gestures from Deployable and Breathable Kirigami-Based Electrical Impedance Bracelet

by
Godwin Ponraj Joseph Vedhagiri
1,
Xin Zhi Wang
2,
Kirthika Senthil Kumar
1 and
Hongliang Ren
1,*
1
Department of Biomedical Engineering, National University of Singapore, Singapore 117583, Singapore
2
Department of Mechanical Engineering, National University of Singapore, Singapore 117575, Singapore
*
Author to whom correspondence should be addressed.
Multimodal Technol. Interact. 2020, 4(3), 47; https://doi.org/10.3390/mti4030047
Submission received: 30 June 2020 / Revised: 27 July 2020 / Accepted: 4 August 2020 / Published: 7 August 2020

Abstract

:
Wearable devices are gaining recognition for their use as a biosensor platform. Electrical impedance tomography (EIT) is one of the sensing techniques that utilizes wearable sensors as its primary data acquisition system. It measures the impedance or resistance at the peripheral (skin) level and calculates the conductivity distribution throughout the body. Even though the technology has existed for several decades, modern-day EIT devices are still costly and bulky. The paper proposes a novel low-cost kirigami-based wearable device that has soft PEDOT: PSS electrodes for sensing skin impedances. Simulation results show that the proposed kirigami structure for the bracelet has a large deformation during actuation while experiencing relatively lower stress. The paper also presents a comparative study on a few machine learning algorithms to classify hand gestures, based on the measured skin impedance. The best classification accuracy (91.49%) was observed from the quadratic support vector machine (SVM) algorithm with 48 principal components.

Graphical Abstract

1. Introduction

Wearable devices are being extensively researched in recent times to sense and classify various biological phenomenon. Ranging from gesture identification for user interfaces to vital parameters measurement for health monitoring services, wearable devices have a wide range of applications. For the problem of gesture recognition or classification, conventionally, a wearable device will measure the electromyographic (EMG) signals from the forearm region [1,2]. An EMG is an electrical signal generated during muscle movement. The Kai (Vicara, India) and the CTRL-kit (CTRL-Labs. NY, USA) are examples of commercially available EMG-based wearable hand gesture tracking devices used as user interfaces. Alternatively, the movement of muscles could also be deduced by a change in skin impedance or resistance values [3,4]. An electrical impedance tomography (EIT) or electrical resistance tomography (ERT) is a medical imaging technique that studies the impedance or resistance distribution of internal structures based on surface measurements.
The mathematical calculations required to estimate the conductivity distribution inside the body involve solving several nonlinear elliptical partial differentiation equations [5]. Moreover, the numerical methods used to solve the inverse problem should also account for the possible instability [6] and the higher number of iterations [7,8] to arrive at a unique solution. Due to the complexity of the inverse problem of image reconstruction and the large amount of data collected, analyses of EIT data is migrating towards machine learning or deep learning approaches [9]. The algorithm suitable for the gesture classification problem depends on the sensors used, data acquisition systems, amount of data, and the application requirement of the system. For example, a deep learning network will provide better accuracy for a large amount of data, but require longer training duration, whereas machine learning algorithm-based networks might be more suitable for real-time classification of smaller datasets.
Another important factor to consider while designing wearable devices is the ease of long-term use. Prolonged use of wearable devices will cause that particular area of the skin to sweat more and make them uncomfortable to use. Hence, in addition to the technical requirements, developers also focus on making the device more breathable to allow adequate ventilation as part of a pleasant user experience. The electrodes should also be easily deployable on the body. While most of the commercial devices like the Kai and the Ctrl-kit are quickly deployable, they are not breathable. Alternatively, using individual gel electrodes will provide a more comfortable and breathable experience, but requires a longer duration to deploy them one by one on specific locations. In this paper, we introduce a novel breathable, quickly deployable kirigami-based wearable bracelet integrated with soft resistance-sensing electrodes along its length. Five gestures are classified based on the electrical resistance data collected from the electrodes. The paper also presents a comparative study of seven machine learning algorithms working on the same dataset for the problem of gesture classification: tree classifier, naïve Bayes algorithm, subspace discriminant ensemble, linear discriminant, k-nearest neighbor (kNN), and two types of support vector machines (SVM).
The manuscript is organized as follows. Section 2 explains the materials, kirigami patterns used, and the implementation of machine learning models used. Subsequently, Section 3 presents the results of the simulation and gesture recognition experiments. Section 4 accounts for the interpretation of the results from the various classification algorithms, followed by a conclusion.

2. Materials and Methods

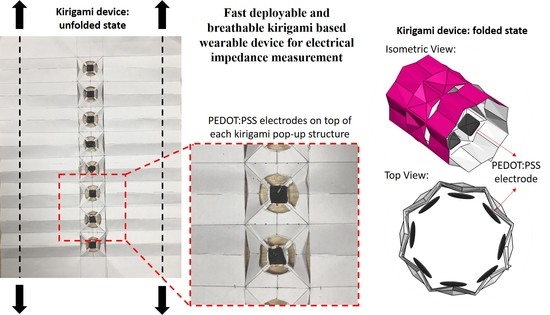
2.1. Kirigami Pattern Design

The origami design consists of valley and mountain folds, which are known as the crease pattern. Kirigami is a method of design that consists of a cut pattern on top of the crease pattern. Furthermore, the kirigami design is more strain-tolerant and stretchable and offers stretchability beyond the material’s normal deformability [10]. The complex behavior of the kirigami design arises from the individual cuts, which causes the material to experience vertical out-of-plane displacement [11]. The objective of using kirigami structures in our proposed device is to provide buckling under a compressive force such that the electrodes have better contact with the skin. The device is designed in such a way that it resembles a 2D sheet of paper at rest but projects sections of the paper that contain the sensing electrodes.
Three kirigami patterns were considered to realize this “popping-up” effect: pyramid tip, flat-top, and flat platform. The designs were simulated using SolidWorks FEM software (Dassault Systèmes SolidWorks Corporation, Yvelines, France) to understand their stress–strain relationship. The flat platform design was selected finally due to its high strain (displacement) and low stress at the electrode interface region, and the presence of a flat platform for electrode integration. The prototype was fabricated using an A4 size paper with eight of the flat platform kirigami structures along its length. A schematic representation of the overall crease pattern is given in Figure 1, where red lines represent mountain folds, blue lines, valley folds, and green lines denote the traces to cut along. The schematic is replicated on an A4 sheet, and the crease pattern acts as a guide for the cuts to buckle in the desired direction. The dimensions of this kirigami structure were designed specifically to be used in the fore-arm region (circumference of the deployed device: 24 cm). However, it can be scaled to the desired dimension for an object of different diameters.

2.2. Electrode Placement and Data Acquisition

The electrodes are made up of PEDOTS: PSS—a flexible, stretchable, and conductive polymer with high ductility [12]. The ability to stretch enables the electrode to be subjected to mechanical deformations such as twisting, shearing, bending, folding, and large tensile strains [13]. The surface of the electrodes is uniform and smooth, making it ideal for biosensing applications [14]. Furthermore, the fabrication of soft electrodes is simple and comparatively cheaper than other metal-based electrodes [15]. The electrodes are integrated to the top of the flat platform in each of the eight kirigami pop-up structures (Figure 2a). Thin strips of double-sided copper tape were used to secure the electrodes to the platform and to establish an electrical connection to the data acquisition system. The entire structure can be wrapped around the arm such that the electrodes face downwards and establish contact with the skin. A thin string can be attached along the longer side of the A4 sheet such that pulling them from either side while holding the two short edges together tightens the cylinder around the arm. Figure 2b shows the developed prototype in a folded state without any object (forearm) inside.
The device is wrapped around the forearm, such that all eight electrodes contact the skin. The data acquisition system consists of a galvanic skin response (GSR) sensor, two 8-channel analog multiplexers, and an Arduino controller (Figure 3a). The GSR sensor is used to measure the skin conductivity between two points. The conductivity is measured between all possible combinations of the eight electrodes by the help of two multiplexers each for a lead from the GSR sensor. The resultant 64 data points constitute a single data frame. The Arduino controller is used to collect the sensor readings, compute the impedance from conductivity values, and cycle through the electrode combinations by controlling the multiplexers. It was programmed to collect data frames at approximately 1.5 Hz (about 450 data frames for a five-minute experiment).

2.3. Machine Learning Algorithms for Gesture Classification

To evaluate the proposed device, a simple gesture experiment was devised. The study was based on experimental data from five subjects with forearm circumference from 22 to 28 cm. The users wore the device on their left hand such that the first electrode aligned with and was about five centimeters away from the cubital fossa (elbow pit). Five gestures were selected for the experiment: “Fist”, “Left”, “Right”, “Up”, and “Down”, as shown in Figure 3b. The users were instructed to perform each gesture ten times for five minutes (repeat the following for each gesture—{gesture: 1 s; rest: 5 s; repeat 10 times}). In total, five datasets, each with 435 data samples, were collected from five users. The data obtained from different users had an average standard deviation of 0.43. A low standard deviation denotes that the device is reliable to be used on multiple users for data collection. For each of the gestures performed, the individual muscles of the forearm are actuated to different degrees. The action potential change during such muscle movements is reflected in the surface (skin) impedance. Hence, the 64-channel data collected during experiments represent a series of impedance changes between various contact points on the electrodes along the circumference of the forearm, and each channel is considered as a feature for the model.
The skin impedance data were used (in the same order of their measurement) to train and develop machine learning models to classify the gestures. The dataset from one of the users was assigned as testing data, whereas the data from the remaining users were used to train the models. The training also included a five-fold validation technique wherein the dataset will be divided into five subsets, and the model will be trained five times with each subset being the validation set of each iteration. This technique will prevent the model from overfitting the given training data and makes it more accurate for new test datasets. Seven different machine learning algorithms were trained and tested for the same data: tree classifier, naïve Bayes algorithm, linear discriminant (LDA), subspace discriminant ensemble, k-nearest neighbor (kNN), quadratic SVM, and medium Gaussian SVM. Principal component analysis (PCA) was used to reduce the dataset to reflect the most significant components affecting a change in the output. All the machine learning models were realized using the MATLAB R2020a software (The MathWorks, Inc., Natick, MA, USA) in a Windows 10, 64-bit system.

3. Results

Three different kirigami structures were considered for the device. The final design is selected based on the simulation results that had maximum strain (displacement of the electrode) and low stress along with the crease patterns. Results from the machine learning models show that they can classify the hand gesture based on the 64-channel resistance input from the kirigami bracelet.

3.1. Stress-Strain Results from Kirigami Simulation

The results in Figure 4 show the pop-up effect of the kirigami designs when a compressive force similar to the one experienced by the kirigami paper is applied to the simulation. In the simulation, the applied material is natural rubber as its Young’s modulus is close to that of wood products. In this work, we assume paper to come under the category of wood products. The simulation of the three designs helps to validate the ideal placement of the electrodes, considering the stress and strain undergone by the kirigami structure.
The simulation result for the first design is shown in Figure 4a. The first design consists of the crease and cut patterns, which would result in sharp tips at the top. The structure buckles under compression, and the central region was pushed up, forming the pyramid tip. The strain analysis shows that maximum vertical displacement (44.84 mm) occurs around the tip of the pyramid. Hence, this region is suitable for the electrode placement so that it can contact the user’s skin upon actuation. However, due to the uneven surface of the projection, the area of electrode contacting the skin will be less than the actual area of the electrode. It also increases the difficulty of integrating the electrode securely. Moreover, high levels of localized stress (21370 N/m2) in the design indicate that the structure will not withstand prolonged loading or repeated usage.
In the second design, a flat top was considered to eliminate the unevenness of a pyramidal tip. The stress and strain analyses are as shown in Figure 4b. Even though the maximum localized stress (1190 N/m2) is considerably reduced, the maximum strain (22.54 mm) was almost half of the previous design for the same base dimensions. This means that for a similar highest vertical point of displacement (electrode placement region), the size of the device will increase. In addition, the design does not provide any surface for the placement of the electrode. The flat-top design highlighted the need to provide some surface around the maximum vertical displacement for the electrode to be placed.
The stress and strain analysis performed for the final design of a flat platform is shown in Figure 4c. The flat platform consists of a flat surface for the electrode to be placed on to achieve better contact with the user’s skin. The simulation results show that the flat platform design has a maximum displacement of 40.26 mm at the center at a comparable level with the pyramid tip design at almost half the localized stress level (11,290 N/m2). The four bridging gaps perform the function of maximizing the vertical displacement such a structure can achieve, and, at the same time, provides the required area for the placement of the electrode. Thus, this design eliminates the problems stated in the first and second designs.
From the result of the simulation, the flat platform design was selected for further development as the simulation result shows high displacement and offers a flat surface for the electrode to be placed on. Furthermore, the double-sided copper tape can secure the electrodes by looping around the platform via the holes. This would ensure the maximum contact area and eliminate unnecessary movement of the electrodes during the experiments. The localized zones of intense stress and strain developed within every single design can be seen in Table 1.

3.2. Machine Learning Results

While the raw stream of the 64 data seems random, the results were conclusive with varying accuracy levels for the five gestures. The accuracy of the classification algorithm is defined as the ratio of the number of correct predictions versus the total test samples (true positives—TP). It should be noted that the classification models were trained and evaluated with different sets of training and testing data by randomized selection among the total gesture dataset. All the results presented in this section and the subsequent sections are a sample from one of such randomized dataset partitions. The confusion matrices for the seven models using 48 principal components are given in Figure 5.
Most of the models classify “Up” and “Right” gestures with high accuracies (average accuracy is 99% and 92.3%, respectively). The “Left” gesture had the least accuracy across all the models (least accuracy is 46%). The remaining two classes showed different accuracies for different models and a different number of principal components. It was also observed that the accuracy improved in general with an increasing number of components. For example, the overall accuracy for the quadratic SVM model with two principal components was 58.4%, whereas the same model with 48 components recorded 91.49% overall accuracy. However, for an energy-efficient implementation, an optimized number of components can be chosen depending on the computing power available. The following section discusses in detail the influence of the type of algorithms and level of PCA in the classification results.

4. Discussion

4.1. Comparison between Different Machine Learning Algorithms

Table 2 shows the accuracy of the predictions from the various machine learning models mentioned in Section 2.3 in descending order of accuracies. The models were trained using the top 48 components from the principal component analysis (PCA). SVM algorithms are known to have good accuracy for datasets that have distinct classes and with a fewer number of features. The polynomial kernel and radial basis function (RBF) kernel are the two most commonly used kernels in support vector machine (SVM) implementations. Supporting the existing belief, the SVM models have the best accuracies for all the classes among the seven models considered. The quadratic SVM utilizes a second-order polynomial kernel to estimate the classes based on the feature set provided, whereas the median Gaussian SVM uses an RBF-based kernel. It was observed that these two models always occupied the top two slots of accuracies for different dataset partitions.
The next in the list of high-accuracy models is the discriminant models. They analyze the statistical properties of the feature set like mean, variance, and covariance among the feature set and predict the classes based on the probability of the test data being under a specific class. The difference between the subspace discriminant ensemble and a simple linear discriminant ensemble is that the former divides the predictors (feature set) into several small subsets and trains individual learning models. The final prediction is based on the average score of the prediction from all the individual models, whereas the latter considers all the features as the inputs to a single large learning model. It can be seen from the results that the “Down” class has higher accuracies under discriminant models than other models. It could be interpreted that this gesture involves more variations within individual data points.
The k-nearest neighbor algorithm (kNN) clusters the dataset based on the Euclidean distance between the data points in an n-dimensional feature space. A modification of the standard kNN algorithm is used in this paper, where the distance metric between data points is substituted using cosine similarity. For a kNN classifier, using a cosine metric will improve the classification accuracy in cases of missing data points. However, in some cases, it may seem inferior to the Euclidean distance metric for perfectly classifiable classes.
The models with the least accuracies were based on the naïve Bayes algorithm and the medium tree algorithm. The naïve Bayes is a simple and easy to implement algorithm that predicts the classes based on the probabilistic outcome of the data based on their features. The tree model classifies the data based on a series of subcategorizations based on the feature set. This low accuracy of the medium tree algorithm could be explained as a case of overfitting owing to the small size of the training dataset.

4.2. Comparison of Different Levels of Principle Component Analysis for Feature Selection

Principal component analysis (PCA) is a reduction technique used on datasets with a large number of feature sets. It analyzes the dependability of the outcome based on the various components of the feature set and sorts them in descending order of importance. Several machine learning problems utilize PCA to reduce the computational complexity and to improve the result accuracies. An example would be the technique of identifying and removing muscle or eye movement artifacts from an EEG experiment. Similarly, PCA helps in the gesture classification problem to identify the most significant contributions and train the models as per the selected components. The accuracy of the models also depends on the number of features selected to train them. Different models react to the change in feature set size differently. The average accuracy of the models for a different number of principal components is given in Table 3.
The prediction accuracy between models with no PCA (all 64 components used) and models with 48 components were comparable. All the models except the naïve Bayes model showed only 1–3% change in accuracy. In the naïve Bayes model, the accuracy was considerably improved with PCA. This could be due to the reduction in the number of calculations based on the features to predict the probability of the outcome of each class. Subsequently, when the number of components was halved, the accuracy reduced for most of the models. It is interesting to note that under fewer components (four and two components), the kNN, naïve Bayes, and tree classifiers showed better accuracies than the SVM and discriminant classifier. This shows the superiority of these simple algorithms in a reduced feature set. However, the overall accuracy (<75%) might not be sufficient for the model to be implemented in a real-time classification problem. Hence, a balance must be obtained considering the computing power and the expected accuracy from an application point of view. For example, an optimized implementation for a battery-powered wearable device could be one of the SVM models with 24 components.

5. Conclusions

The paper proposes a novel kirigami-based bracelet like a wearable device that can host biosensors. The design is simple and undergoes a buckling mechanism to project the soft, flexible electrodes onto the user’s skin. The electrode network around the circumference of the skin can be used to sense the skin impedance signals, which are later used to identify muscle movements inside the arm and classify various hand gestures. A major advantage of the proposed device is that it is both breathable and quickly deployable. Seven commonly used machine learning models were considered in the paper and their accuracies were compared. From the results, it was found that the SVM models have higher accuracy across all the classes. The effect of the number of principal components considered while creating the models on the classification accuracy was also studied. It was found that decreasing the components reduced the prediction accuracy to a certain extent. An optimal model design can be considered by analyzing the results of different models with different component sets based on the application expectation and system capacity. As future work, the effect of increasing the number of surface electrodes and increasing the number of gestures for a larger dataset will be considered. Optimization towards the implementation of the same under-constrained system configurations such as limited power or computational capability would be another direction to develop a self-sustainable wearable device.

Author Contributions

Conceptualization, G.P.J.V. and H.R.; methodology, H.R., G.P.J.V., X.Z.W. and K.S.K.; software, G.P.J.V.; validation and data curation, G.P.J.V., X.Z.W. and K.S.K.; writing—original draft preparation, G.P.J.V.; writing—review and editing, supervision, H.R.; funding acquisition, H.R. All authors have read and agreed to the published version of the manuscript.

Funding

This work was in part supported by the Singapore Academic Research Fund under Grant R-397-000-297-114 and National Key Research and Development Program, The Ministry of Science and Technology (MOST) of China (No. 2018YFB1307703).

Acknowledgments

The authors would like to thank Lei Zhang and Jianyong Ouyang for their help related to PEDOT: PSS electrodes.

Conflicts of Interest

The authors declare no conflict of interest. The funders had no role in the design of the study; in the collection, analyses, or interpretation of data; in the writing of the manuscript, or in the decision to publish the results.

References

  1. Stapornchaisit, S.S.; Kim, Y.Y.; Takagi, A.A.; Yoshimura, N.N.; Koike, Y. Finger Angle estimation from Array EMG system using linear regression model with Independent Component Analysis. Front. Neurorobot. 2019, 13, 75. [Google Scholar] [CrossRef] [PubMed]
  2. Yu, M.; Li, G.; Jiang, D.; Jiang, G.; Tao, B.; Chen, D. Hand medical monitoring system based on machine learning and optimal EMG feature set. Pers. Ubiquitous Comput. 2019, 1–17. [Google Scholar] [CrossRef]
  3. Zhang, Y.; Harrison, C. Tomo: Wearable, low-cost electrical impedance tomography for hand gesture recognition. In Proceedings of the 28th Annual ACM Symposium on User Interface Software Technology, Charlotte, NC, USA, 8–11 November 2015; pp. 167–173. [Google Scholar]
  4. Zhang, Y.; Xiao, R.; Harrison, C. Advancing hand gesture recognition with high resolution electrical impedance tomography. In Proceedings of the 29th Annual Symposium on User Interface Software and Technology, Tokyo, Japan, 16–19 October 2016; pp. 843–850. [Google Scholar]
  5. Fan, Y.; Ying, L. Solving electrical impedance tomography with deep learning. J. Comput. Phys. 2020, 404, 109119. [Google Scholar] [CrossRef] [Green Version]
  6. Alessandrini, G. Examples of instability in inverse boundary-value problems. Inverse Probl. 1997, 13, 887. [Google Scholar] [CrossRef]
  7. Borcea, L. A nonlinear multigrid for imaging electrical conductivity and permittivity at low frequency. Inverse Probl. 2001, 17, 329. [Google Scholar] [CrossRef]
  8. Borcea, L. Electrical impedance tomography. Inverse Probl. 2002, 18, R99. [Google Scholar] [CrossRef]
  9. Rymarczyk, T.; Kłosowski, G.; Kozłowski, E.; Tchórzewski, P. Comparison of Selected Machine Learning Algorithms for Industrial Electrical Tomography. Sensors 2019, 19, 1521. [Google Scholar] [CrossRef] [PubMed] [Green Version]
  10. Zheng, W.; Huang, W.; Gao, F.; Yang, H.; Dai, M.; Liu, G.; Qiu, Y. Kirigami-inspired highly stretchable nanoscale devices using multidimensional deformation of monolayer MoS2. Chem. Mater. 2018, 30, 6063–6070. [Google Scholar] [CrossRef]
  11. Dias, M.A.; McCarron, M.P.; Rayneau-Kirkhope, D.; Hanakata, P.Z.; Campbell, D.K.; Park, H.S.; Holmes, D.P. Kirigami actuators. Soft Matter 2017, 13, 9087–9092. [Google Scholar] [CrossRef] [PubMed] [Green Version]
  12. Gan, A.W.; Kumar, K.S.; Zhang, L.; Ouyang, J.; Ren, H. Electromechanical characterization of magnetic responsive and conductive soft polymer actuators. In Flexible Robotics in Medicine: A Design Journey of Motion Generation Mechanisms and Biorobotic System Development; Academic Press Inc., Elsevier: London, UK, 2020; chapter 15; p. 349. [Google Scholar] [CrossRef]
  13. Zhang, L.; Kumar, K.S.; He, H.; Cai, C.J.; He, X.; Gao, H.; Ouyang, J. Fully Organic Skin-compliant Self-adhesive and Stretchable Dry Electrodes for Long-term Motion-robust Epidermal Biopotential Monitoring. Nat. Commun. 2020. accepted. [Google Scholar]
  14. Kumar, K.S.; Chen, P.Y.; Ren, H. A review of printable flexible and stretchable tactile sensors. Research 2019, 2019, 3018568. [Google Scholar]
  15. Kumar, K.S.; Xiao, X.; Kalairaj, M.S.; Li, C.; Ponraj, G.; Cai, C.J.; Ren, H. Steerable Surgical Forceps with Soft Stretchable Sensors for Minimally Invasive Interventions. IEEE/ASME Trans. Mechatron. 2020. under revision. [Google Scholar]
Figure 1. Schematic representation (left) and a section of the actual prototype (right) of the pop-up kirigami structure. The lines in the schematic denote the following: red lines—mountain fold, blue lines—valley fold, green lines—cuts. The structure buckles under a compressive force to project the center platform up.
Mti 04 00047 g001
Figure 2. (a) Proposed kirigami-based bracelet in the unfolded state. Inset shows electrode placement with the help of thin strips of double-sided copper tape over the flat platform. The black dotted lines represent the string, and the small black arrows denote the direction in which they must be pulled in order to tighten the prototype around the arm. (b) Simulated model of the proposed kirigami bracelet in the folded state. The PEDOT: PSS electrodes are projected inward towards the skin of the arm to establish electrical contact for measuring skin conductance.
Mti 04 00047 g002
Figure 3. (a) Overall data acquisition system. The legend table for the different data and control channels in the system. An 8-channel connection is established from the electrodes in the proposed kirigami device to both the multiplexers. The outputs from the multiplexers are connected to the input leads of the galvanic skin response (GSR) sensor. The output from the GSR sensor (data signal) is connected to an analog input terminal of the Arduino controller. Two separate 3-channel connections are established between the Arduino and the multiplexers to control the electrode selection for measurement. (b) The five gestures used in the gesture classification experiment: Up, Left, Fist, Right, and Down. For every five seconds, the user will perform one of the five gestures for one second.
Mti 04 00047 g003
Figure 4. SolidWorks simulation results showing the stress (left) and strain (right) analysis of (a) the pyramidal tip; (b) flat-top; and (c) flat platform kirigami design patterns. The pyramidal tip design has high localized stress and strain values. Though the flat-top design experiences the least localized stress, it can achieve only half of the displacement as the other designs for the same base dimensions. The flat platform design has high vertical deformation for comparatively low stress. It also has a dedicated flat surface for electrode placement, which is mostly undisturbed by the stress experienced by the buckling.
Mti 04 00047 g004
Figure 5. Confusion matrices showing the true positives rates and average accuracy (percentage in brackets) for the gesture classification problem based on various algorithms: (a) quadratic support vector machine (SVM) (91.49%); (b) medium Gaussian SVM (90.57%); (c) subspace discriminant ensemble (83.45%); (d) linear discriminant (82.99%); (e) cosine k-nearest neighbor (kNN) (81.84%); (f) naïve Bayes (81.15%), and (g) medium tree (73.79%).
Mti 04 00047 g005aMti 04 00047 g005b
Table 1. Simulation results of localized stress and maximum strain for the three kirigami designs.
Stress (N/m2)Strain (mm)
Design 1—Pyramid Tip21,37044.84
Design 2—Flat-Top119022.54
Design 3—Flat Platform11,29040.26
Table 2. Comparison of accuracy percentage among various machine learning algorithms for the gesture classification problem (maximum accuracies marked in bold font).
Model/ClassDownFistLeftRightUpTotal
Quadratic SVM77.0088.5092.00100.00100.0091.49
Medium Gaussian SVM78.2087.4088.5098.90100.0090.57
Subspace Discriminant Ensemble97.7065.5069.0087.4097.7083.45
Linear Discriminant93.1071.3074.7079.3096.6082.99
Cosine kNN75.9070.5172.4090.80100.0081.84
Naïve Bayes75.9069.0070.1092.0098.9081.15
Medium Tree62.1063.2046.0097.70100.0073.79
Average accuracy79.9973.6373.2492.3099.0383.64
Table 3. Comparison of accuracy percentage for a various number of principal components. Maximum accuracies marked in bold font).
No. of PCA Components64482412842
Quadratic SVM92.6491.4990.3484.8375.1769.4358.39
Medium Gaussian SVM91.7290.5791.2683.2278.1671.4959.77
Subspace Discriminant Ensemble82.5383.4580.6982.9975.459.7752.41
Linear Discriminant80.4682.9983.4581.3875.1768.9758.62
Cosine kNN81.1581.8480.9282.9975.6373.3357.47
Naïve Bayes73.1081.1581.8478.1671.7269.8959.31
Medium Tree73.5673.7970.870.5767.1365.2962.07

