1. Introduction
Several works in the literature demonstrate the relationship between human personality and product design. Rothmann and Coetzer claim that extraverted, emotionally stable and open-to-experience individuals are more creative and work more efficiently than introverted, neurotic and closed-to-experience people. They also claim that conscientious people are creative and efficient as well, but their impact is lower [
1]. Chang et al. performed tests with engineering students and discovered that openness to experience predicts originality in creativity; it seems that open people are more inclined to new ideas. Moreover, openness, conscientiousness and agreeableness predict usefulness in creativity because these people seem to be more goal oriented [
2]. For Oyibo et al., agreeableness and conscientiousness are strongest predictors of aesthetics and usability; this suggests that products showing good aesthetics and usability could satisfy agreeable and conscientious users more easily [
3]. Steel et al. claim that conscientiousness tends to increase product innovation. Since innovation requires hard work, mainly to bring inventions to successful adoption, conscientious people who are strongly goal oriented appear to be the most suitable to make innovation spring up [
4]. Kohn and Smith show that during a brainstorming process, agreeable people generate fewer ideas, with lower variety, because of the influence/dominance of the other participants [
5]. Finally, Reilly et al. found that extraversion increases productivity when tasks involve imaginative or creative activities, but may inhibit productivity when tasks require precise, sequential and logical behavior [
6].
These examples from the literature highlight that human personality could affect the different stages of product design. For example, this could occur during the evaluation/testing of prototypes, as well as in the monitoring of the daily uses of products to get suggestions for improvements in the field.
User experience (UX), as one of the overriding concerns in product design, shows a tight connection with human personality as well. This is also supported by the International Standard ISO 9241-210:2019, where UX is defined as the "user’s perceptions and responses that result from the use and/or anticipated use of a system, product or service" and where "users’ perceptions and responses include the users’ emotions, beliefs, preferences, perceptions, comfort, behaviors, and accomplishments that occur before, during and after use" [
7].
Based on this definition, several UX design methods and tools have been developed. Burmester and Dufner suggest improving the quality of products by designing stimulation aspects, which raise people’s curiosity and attention [
8]. Pucillo and Cascini propose a UX framework based on the "experience affordances", a set of features that contribute to the fulfilment of basic psychological user needs by affording specific experiences [
9]. Yamazaki and Furuta defined the User Experience Design (UED) Studio, a tool to support the product design process, from the planning of the UX design activities to the validation of the results on the market [
10]. Zhou et al. propose a conceptual model that integrates UX with product ecosystem design to improve user satisfaction [
11]. Hokkanen et al. defined the Minimum Viable User eXperience (MVUX) framework, providing a good user experience in the early, minimal versions of the product, helping start-ups to survive in the market in this way [
12]. Finally, Harte et al. offer a structured methodology based on UX principles that allows for the assurance that user needs are taken into account throughout product design [
13].
Although much research demonstrates the influence of personality on product design, these methods and tools do not fully exploit the knowledge about user personality in the selection of the best participants to maximize the effectiveness of the design efforts. This research tries to fill the gap by introducing PERSEL, the ready-to-use PERsonality-based SELector. PERSEL is a Microsoft Excel workbook, free to download, which allows for the expression of the objectives (needs) and the assessment of user personality; in turn, PERSEL suggests the best users to be involved in UX redesign activities and in what way, to obtain solutions that satisfy needs in the best possible way in terms of UX characteristics, such as usability, aesthetics, symbolic significance, emotions and consequences of use. PERSEL deals with redesign rather than design because it requires an existing product to improve to generate mental models, perform tests, etc.
The research outcomes could be useful for researchers, designers and engineers. Researchers could enrich their knowledge of the effects of personality on redesign activities; this in turn could allow for the development of new redesign methods and tools and/or the improvement of existing ones. Designers and engineers can use PERSEL as-is to assess personalities available in their working context and select the best users to make the results of their redesign efforts as aligned as possible with their needs.
The paper runs as follows: The background section deals with some fundamentals about human personality and its assessment, highlights the UX characteristics of interest and outlines the functioning of the tools used in the first adoption of PERSEL in the field. Section three describes the development of PERSEL and its first adoption in the field, together with the comparison of the results of this adoption with those coming from the involvement of users selected without obeying any specific criterion (random user sample). A discussion about the research outcomes and some conclusions and perspectives for future work are used to close the paper.
2. Background
PERSEL development needs some fundamentals about human personality theory and assessment; moreover, it considers UX to consist of seven characteristics, each of them made by specific items. The first adoption in the field of PERSEL exploits a specific evaluation method to collect data and some guidelines to generate solutions. All of this is described hereafter.
2.1. Personality Theory and Assessment
Human personality can be defined as the set of characteristics-traits of a person that account for consistent behavioral patterns over situations and time [
14]. Goldberg [
15] and McCrae and Costa [
16] highlighted personality traits and analyzed them to generate a structured taxonomy. The result is the big five personality traits. These traits are as follows: Extraversion or surgency (personality trait 1-PT1)—extraverts are energetic and optimistic; introverts are reserved rather than unfriendly, independent rather than followers. Agreeableness (PT2): An agreeable person is fundamentally altruistic, sympathetic to others and eager to help; disagreeable/antagonistic people are egocentric, skeptical of others’ intentions and competitive. Conscientiousness (PT3): A conscientious person is purposeful, strong-willed and determined; low scorers on conscientiousness may not necessarily lack moral principles but they are less exacting in applying them. Neuroticism (PT4): Neurotic people suffer from fear, sadness, embarrassment, anger, etc.; low neuroticism is indicative of emotional stability. Openness to experience/culture (PT5): Open individuals are curious about both inner and outer worlds and their lives are experientially richer; people scoring low tend to be conventional in behavior and conservative in outlook [
1].
The literature offers several ways to assess personality. McCrae et al. propose NEO-PI-3, a 240-item questionnaire, mainly adolescents-oriented, which assesses 30 specific personality facets, six for each trait [
17]. Goldberg et al. define the International Personality Item Pool (IPIP), a set of more than 200 personality items freely available over the internet. This set comes in 25 languages and researchers keep it updated in order to make it more complete and more usable in different contexts [
18]. The Big Five Inventory (BFI) is a 44-item questionnaire that measures individuals against the big five personality traits. Each trait is considered through its facets. Each facet consists of a sentence in the questionnaire. To measure the traits, individuals assign values from 1 (strongly disagree) to 5 (strongly agree) to each item. Once finished, a simple computation gives each trait a 0 to 100 score [
19].
2.2. UX Characteristics and Items
UX models and frameworks in the literature focus on different UX characteristics. Three of these models and frameworks are the bases on which this research defines the UX characteristics and the related items.
Product experience framework. Desmet and Hekkert defined the experience with a product inside their framework as composed by the aesthetical experience—the product capacity to delight one or more human sensory modalities; the experience of meaning—the personal and/or symbolic significance of a product given by an individual; and the emotional experience—the appraisal of an event or a situation as potentially beneficial or harmful deemed relevant to the needs, goals, or concerns of an individual [
20].
CUE model. In their Components of User Experience (CUE) model, Thuring and Mahlke consider as UX components the perception of instrumental product qualities (usability and usefulness), the perception of non-instrumental product qualities (aesthetic, symbolic and motivational aspects) and the emotional reactions. These components are influenced by product properties, user characteristics and context/task parameters, and generate the overall judgment of the product, the usage behavior, the user preferences between alternatives and the intention to use [
21].
Model of the seven stages of the action cycle. Norman decomposed the human actions performed during problem-solving activities into seven stages. Possible problems occurring during problem solving activities fall into two gulfs. The execution gulf represents possible mismatches between the desired action to perform and those the system seems to make available. The evaluation gulf represents possible problems in interpreting the system state and in deciding if the goals have been achieved or not [
22].
These three models and frameworks contributed differently in highlighting seven characteristics, considered as covering the UX field exhaustively. Each characteristic consists of UX items. The seven UX characteristics with the related twelve items are as follows:
Instrumental product qualities. The CUE model suggests this characteristic. It is related to technical features, such as suitability for a task, self-descriptiveness and controllability, and consists of two UX items: usefulness and usability.
Non-instrumental product qualities. This characteristic comes from the CUE model as well. It considers features like materials, form and color combinations, etc., referring to user needs that go beyond tasks and their achievements. This characteristic consists of three UX items: aesthetics, symbolic aspects and motivational aspects. The product experience framework took a role in the definition of aesthetics as well.
Meanings. The product experience framework suggests this characteristic. There is one item only, the meanings themselves, defined as the symbolic significance of a product.
Emotions. This characteristic comes from both the product experience framework and the CUE model. Emotions are the only item of this characteristic and correspond to physiological activation, motor expressions and subjective feelings, all of them characterized in terms of valence and arousal.
Consequences of use. This characteristic comes from the CUE model. The consequences of use represent the effects of the instrumental and non-instrumental product qualities and of the emotions on the consideration of the product in the future. They consist of two UX items: intention to use and user preferences between alternatives.
Overall evaluation. This characteristic comes from the CUE model. The item, the overall evaluation itself, consists of the evaluation of the whole product considering all the experiences with it.
Differences between expected user actions and product reactions/feedback and the real ones. This characteristic comes from the model of the seven stages of the action cycle and represents possible mismatches between the user and product behaviors before (expected behaviors) and after (real behaviors) the real interaction. This characteristic consists of two UX items: the positive and the negative differences between the expected user actions and product reactions/feedback and the real ones. Hereafter, they will be called positive and negative ARF (actions, reactions and feedback) differences.
Table 1 contains the twelve items constituting the seven UX characteristics and exploited in this research.
2.3. IrMMs-based UX Evaluation Method
The interaction-related Mental Models-based UX evaluation method, release 2.0, qualifies and quantifies the experiences of users interacting with products. This UX evaluation exploits the irMMs—cognitive processes that users generate before to act in order to satisfy a specific need in a specific situation of interaction. There is a direct reference between the irMMs and the UX items highlighted in the previous section, both before and after the real interaction with the product under evaluation. This reference is accomplished thanks to documents provided to the users to generate the irMMs. These documents, named user guides, report the activities to do and these activities develop orderly through the twelve UX items described before. The irMMs method reached release 2.0 thanks to the adoption of the meCUE (modular evaluation of key Components of User Experience) questionnaire, specifically devoted to the quantification of the UX [
23,
24]. This was the final step of the irMMs method development that enabled it to deal with the whole set of UX items.
The irMMs method works thanks to tests where users with different knowledge about the product generate their irMMs with respect to the specific need to satisfy and, after that, perform the real interaction to evaluate and compare it with their irMMs. The goal is to highlight possible mismatches between their expectations and what the product allows them to do. The results are two-fold. From the qualitative point of view, they consist of two lists of positive and negative UX aspects, describing the strong points and the criticalities of the product UX, respectively. From the quantitative point of view, the results measure the logical distance between what was expected and the reality for each UX item based on the knowledge of each different user.
The adoption of the irMMs method consists of four phases:
Phase 1: Input setting. This phase sets five inputs: The product features to evaluate, the need the users will try to satisfy, the sections of the method to consider, and the users and the evaluators’ characteristics. Users with different knowledge about the product will be involved in the tests. These differences allow the users to be assigned to three different roles. A specific section of the method corresponds to each role. The first section considers users with no knowledge of the product; this is the absolute beginners (AB) section. The second section considers users who had no prior knowledge of the product, but before the generation of the irMMs and before they know the need to satisfy, they are allowed to interact freely with the product for some time. This is the relative beginners (RB) section. The third section considers users who were already familiar with the product; this is the relative experts (RE) section. Specific evaluations could need different combinations of these three sections; the required users’ characteristics will be set accordingly. This also applies for the evaluators’ characteristics, since different combinations of sections require experts with different skills and knowledge.
Phase 2: Material and environment setup. This phase prepares everything to perform the tests. The material consists of some documents, the user guides and the evaluator guides. The user guides, different for each section involved, report the need to satisfy, and the instructions to perform the test as well as fill in forms with tables to collect the data during the test. The evaluator guides, also different for each section, help evaluators plan the tests in terms of time, number of users, activities, etc., and in collecting and analyzing data. This phase is also in charge of the setup of a suitable environment, reflecting the common use of the product under evaluation.
Phase 3: Test execution. This phase is where the test activities take place, from the RB users’ free interaction with the product to the generation of the irMMs, up to the real interaction with the product and to the debriefing where each user reasons with the evaluators about his/her experience.
Phase 4: Data analysis. This phase consists of two moments. First, the evaluators use some rules available in the irMMs method to produce the UX aspects. Once generated, these are classified against the interaction topics they refer to (specific procedures, product components, etc.), and for each topic they are split into positive and negative and ordered against the number of occurrences and the impact. After that, the evaluators collect the scores from each section for each UX characteristic in order to get the UX quantification. The way these data are collected facilitates achieving a view of the bigger picture—all sections are considered together, specific comparisons between sections can also be performed.
2.4. UX Redesign Guidelines
The UX redesign guidelines (guidelines hereafter) are a ready-to-use tool to generate UX redesign solutions. This tool encompasses all the UX items highlighted before and is generic enough to be used in different contexts for different products. Each guideline consists of positive and negative components. The positive component focuses on how to enhance aspects of the product UX already evaluated as positive. The negative component considers how to overcome and improve current drawbacks of the product UX. Each component consists of suggestions about the redesign activities and of the goal these activities aim to achieve. The guideline generation occurred by analyzing real redesigns [
25,
26], as well as by gathering information from systematic reviews on UX design and evaluation, collections of heuristics, principles, etc. [
27,
28]. Guidelines adoption occurs through three activities: Data collection, guideline selection and guideline implementation into solutions. These activities are as follows.
Data collection. This activity enables the selection of the best suitable guidelines for the specific redesign context and product. Data can be collected using any method able to record the moments of data generation before or after the real interaction (when), the user roles who generate them (AB, RB or RE), the UX items the data refer to, and the quantifications. In terms of what concerns quantification, if the items involved are UX-I6, UX-I11 or UX-I12, users assign positive or negative judgments to each meaning and to each ARF difference, respectively, as well as the reasons for this judgment. For all of the other items, users give scores (normalized to the range 0–1) and the reasons for them. An example of data collection regards the redesign of a TV set, focusing on the feature "showing information about TV programs". Twenty-one scores, collected after the interaction with the product, refer to UX-I1; eight were highlighted by RB users, seven by RE users and six by AB users. An RB user assigned 0.85 to I1 (usefulness), all of this referring to the expected reactions/feedback to "once the channel is selected, the TV set shows its number and name". During the real interaction, together with the number and the name of the channel, the TV set showed the title, starting time and duration of the program on the air, as well as the program that would have come afterwards. All of this generated a positive difference between the expectations and the real interaction. The reason associated to this difference was "the unexpected information the TV set shows about the programs on the air is very useful and spares me to search the channel scheduling by browsing the internet or magazines".
Guideline selection. This activity occurs by checking the presence of twenty-one situations where specific user roles (who) in specific moments of interaction (when) express something meaningful referring to specific UX items (what). Each situation has an associated guideline. If the data collected in the previous activity check a situation, the associated guideline is selected. The situation check occurs as follows: If the situation involves UX-I6 (meanings), the meanings expressed by each user role are considered together and duplicates are deleted. Then, the numbers of meanings generated by the three user roles are compared by normalizing them. The situation is checked only if the normalized number of meanings generated by the specific user role is higher than 0.7—the threshold reputed as reasonable now. This value comes from the analysis of the data (and of their sensitivity) available at guideline definition time. Progressively, the availability of new data could tune up this value. If the situation refers to UX-I11 or UX-I12 (positive or negative ARF differences), the check is the same for UX-I6, except that positive and negative ARF differences take the place of the meanings. When the situation refers to any of the other UX items, if more than the 70% of the users of a specific role express meaningful pieces of information referring to the UX item the situation refers to, then that situation is checked. One piece of information is reputed as meaningful if its score is lower than 0.35 or higher than 0.65. The author set these thresholds based on his experience and, again, they come from the guideline usage up to now and could change slightly in the future. For example, considering the redesign of the TV set and the data referring to UX-I1, the scores assigned by all the RB users are considered meaningful because they are between 0.78 and 0.92. Then, more than the 70% of the RB users express meaningful pieces of information related to UX-I1 and this checks the presence of the situation "after the interaction with the product, RB users are meaningful about UX-I1". This situation selects the guideline where the suggestions of the positive component are "highlight functionalities and possible results with advice (labels, drawings, tutorials, etc.). Improve the existing advices using lively colors, different fonts, etc." and the goal is to "enhance the product usefulness and its perception". The negative component of this guideline is composed by the suggestion "analyze competitors’ functionalities using focus groups and interviews. Highlight missing functionalities and implement them as best as possible by exploiting the data collected previously. Identify functionalities that could be deleted because considered as useless by the users" and the goal to "implement the usefulness in the product more clearly".
Guidelines implementation into solutions. This activity occurs by exploiting the reasons the users expressed to justify their positive/negative judgments and scores. Each reason generates one solution. Once this generation comes to an end, solutions are compared to each other to delete duplicates. Then, they are classified against the interaction topics they refer to (specific procedures, product components, etc.) and, for each topic, they are ordered against the number of occurrences. For example, considering the redesign of the TV set, the reason for the score reported in the first activity facilitates the implementation of the positive component of the guideline selected in the second activity. The resulting solution is to "make the information about TV programs on the air even richer by adding pictures in order to make them immediately recognizable. For example, a chef’s hat could be used if the program deals with cooking or the official poster if it is a movie". This solution is obtained by adding icons to the textual information. From the UX characteristics point of view, this solution impacts mainly on usefulness, since the UX item involved (UX-I1) refers directly to the usefulness component of the instrumental product quality UX characteristic.
3. Materials and Methods
PERSEL development, the goal of this research, will exploit well-known methods and tools dealing with human personality and the way to assess it, as well as with the characteristics of interest in UX design and evaluation contexts. Here, the BFI questionnaire will be used to assess the personality of possible users to involve in UX redesign activities while the product experience framework, the CUE model and the model of the seven stages of the action cycle will make the UX characteristics to focus on available. All of this grants that data about user personalities will be collected and processed as accurately as possible and that the twelve UX items—the components of the seven UX characteristics considered here—will describe the UX as completely as possible. The presence of the twelve UX items assures that PERSEL users will always remain focused on those aspects that matter, without misunderstandings and wasted time, since designers and engineers will be allowed to express their needs through the UX items only.
The algorithm to select the best user personalities to involve in UX redesign activities will exploit relationships between UX items and combinations of personality traits, user roles and moments of data collection. For now, these relationships will be highlighted using the top–down approach by performing literature reviews. Although the resulting set of combinations will be quite far from exhaustive, its content will be considered objective enough to validate the PERSEL approach to the user selection and to claim its readiness to be easily updated from the knowledge point of view, e.g., by adopting the bottom–up approach consisting of the analysis of UX redesign case studies.
The first adoption of PERSEL, aimed at verifying its functioning and effectiveness, will compare the results of UX redesign activities involving users selected thanks to PERSEL with results coming from the same activities where users are selected randomly. The experiments will be the same, except for the user selection process. In both cases, UX redesign solutions will be generated using the same tool, the UX redesign guidelines. This approach will make the two experiences comparable.
4. PERSEL Development and First Adoption in the Field
The main activities of this research are the development of PERSEL and its first adoption in the field, used to compare the results to those coming from the involvement of a random user sample.
Figure 1 provides an insight of the role of PERSEL in UX redesign at a glance; this occurs by comparing the process without (upper) and with (lower) PERSEL.
The upper part of
Figure 1 summarizes the generic UX redesign process. After identification of the needs, the evaluation of the product to redesign occurs thanks to the involvement of sample users. The outcomes of this evaluation are the basis for the generation of the UX redesign solutions.
The lower part of
Figure 1 depicts how the PERSEL adoption influences the UX redesign process. First, PERSEL allows identification of the needs in terms of the UX items (the components of the UX characteristics) to focus on. Second, PERSEL allows a reassessment of the users’ personality and knowledge in order to get a clear picture of the traits and competencies available. Third, PERSEL automatically selects those users whose personality and knowledge best match the needs; in other words, it highlights who will help develop UX redesign solutions as focused as possible on the UX items of interest. Fourth, the product evaluation occurs by involving the users suggested by PERSEL. Fifth, the generation of the UX redesign solutions takes place and these should match the needs well because of the previous concerns about each user’s personality and knowledge and their relationship with the UX items.
What follows describes the development of PERSEL referring to the first three activities (I, II and III in
Figure 1). The rest of the section deals with the first adoption of PERSEL in the field. This adoption makes clear the impact of PERSEL on the downstream redesign activities (IV and V in
Figure 1).
Before continuing, it is worth noting that the current research focuses on users only; the personality of any other subject is not considered. For example, this occurs for designers and engineers and they apply the suggested redesign methods and tools as they are, without subjective changes/interpretations. Nevertheless, possible influences of personalities of actors differing from the users will take part in future work. Moreover, users are involved in the redesign process only as evaluators of existing products; other types of involvement are not considered, but they will also be part of future work.
4.1. PERSEL Development
4.1.1. Needs Identification Based on UX Items (I)
PERSEL enables highlighting of the UX items of interest thanks to their translation into needs using the designers’ and engineers’ language. These select the needs they are interested in, case by case, and PERSEL considers the corresponding UX items from that moment on. This translation occurs thanks to the definitions offered by the product experience framework of Desmet and Hekkert [
20], the CUE model of Thuring and Mahlke [
21] and the model of the seven stages of the action cycle of Norman [
22]. For example, a designer might like to improve the product appearance, style, etc. As the product experience framework says, product aesthetics represents the product’s ability to satisfy user sensory modalities (sight, hearing, etc.) through a beautiful appearance, a pleasant sound, a good feeling in touching a surface, etc. As a result, the UX item aesthetics is translated into the need "improve product appearance, style, music/sounds, etc."
Table 2 contains the needs made available by PERSEL as translations of the twelve UX items highlighted before.
4.1.2. Assessing Users’ Personality and Knowledge (II)
The assessment of users’ personality traits exploits the BFI questionnaire. This tool has been preferred against others, like the NEO-PI-3 and the IPIP questionnaires, because it is ready-to-use and does not require a specific skill or knowledge of the designers and engineers to use it and to the users to answer to it. The statements the users answer are clear and expressed in simple language. Moreover, the BFI questionnaire is generic, not being related to any specific product or context; it represents the right compromise between the precision required for the traits assessment and the effort to gain it. In fact, if every trait uses three or more statements to be identified, the required time to answer to the whole questionnaire is less than ten minutes.
Once the BFI questionnaire has been proposed to the users, the trait quantification considers only two levels: The traits and their opposites. This occurs by considering the BFI values in the range 65–100 as the traits and those in the range 0–35 as the opposites. Neutral values are those in the interval 35–65 and are not considered. A finer scale will be dealt with in future work.
The assessment of users’ knowledge about the product occurs thanks to three more statements. These statements are "I do not know the product under redesign or other products similar to it", "I do not know the product under redesign, but I know similar product having the same functionalities" and "I know the specific product under redesign and use or have already used it". The answers will allow each user to be assigned the correct role in the product evaluation.
4.1.3. Selecting Users Whose Personality and Knowledge Best Match the Needs (III)
Once the needs are identified and the personality and knowledge of the users available are assessed, PERSEL selects the users whose personality best matches those needs thanks to an algorithm that exploits relationships between UX items and combinations of personality traits, user roles and moments of data collection. Each relationship means that the data collected in a specific moment from a user with a specific personality trait and role give information about a specific UX item. In each combination, the personality trait can assume the two values described before, that is, the trait itself or its opposite. The user roles are the same as they appear in the irMMs method described in the Background section: AB (Absolute Beginner), RB (Relative Beginner) and RE (Relative Expert). Finally, the moments of data collection can be "before" or "after" the user interaction with the product during the tests.
Table 3 contains the relationships between the UX items and the forty-three combinations discovered up to now. Combinations appear as labels, made explicit in
Table 4 to avoid repetition.
The relationships have been highlighted using a top–down approach, consisting of collecting and elaborating research in the literature focused on influences of personality on product design and redesign. Examples of these pieces of research are the work of Rothmann and Coetzer [
1], demonstrating that extravert and open-to-experience people are very creative and willing to have new experiences, and that one of Steel et al. [
4], claiming that open-to-experience and agreeable people are innovative and curious towards new technologies and products. Models and frameworks about personality influences have been considered as well; for example, Cloninger [
29] proposes a psychobiological model of personality based on temperament and character, and Zuckerman et al. [
30] compare three existing models of personality.
It is worth stating that the user roles and the moments of data collection are not mentioned in the literature explicitly; they need to be deducted by the description of the tests, data collection and analyses. Moreover, the content of
Table 3 is quite far from being complete. Further research, considering also the bottom–up approach that collects and analyzes real-world data under specific conditions, will add new combinations to
Table 4; these combinations will find correspondences with the UX items and
Table 3 will be updated accordingly. All of this will be considered in future work.
An example of a relationship, identified by exploiting the work of Rothmann and Coetzer [
1], refers to the will of open-to-experience people to have more than one interaction when dealing with new products. Since the products are new, open-to-experience (personality trait) people correspond to AB or RB users (user role); their will to use the products again in the future (UX-I8, intention to use) is expressed after the interaction (moment of data collection). Therefore, the combination of the openness-to-experience personality trait, the AB user role and the moment of data collection equal to After, combination labelled as C34, is put into the relationship with the UX item UX-I8.
The PERSEL algorithm works as follows. First, starting from the needs highlighted by the designers/engineers, the algorithm considers only the combinations that find correspondences to the related UX items. For example, if the needs consist of N1 only, the algorithm keeps just the combinations C37, C38, C42 and C43 (see
Table 3). The selected combinations are then compared to each other to delete duplicates. Using the data describing users’ personality and knowledge coming from the questionnaires, the algorithm computes the number of combinations that each user can satisfy. A user can satisfy a combination if he/she shows the specific personality trait and if he/she can assume the specific role. Users unable to satisfy any combination are discarded. After that, all the users knowledgeable with the product can be considered only as RE users; therefore, all of them are assigned to every combination each of them satisfies. The scenario is different for those users who do not know the product, since they must be divided into AB and RB users. If all the combinations involve only AB or only RB users, everything works as before—all users are assigned to every combination that each of them satisfies. On the contrary, if the combinations refer to both AB and RB users, the assignment works by considering first those users with the minimum number of combinations and continues up to those with the maximum number of combinations. Considering first those users who are more difficult to assign maximizes their possibility to be involved. If the user satisfies one combination only, the user is assigned to that combination and the role that that combination expects is assigned to him/her. If more than one of the combinations are satisfied, the user is assigned to the combination containing the lowest number of participants in that moment of the algorithm execution. The user is assigned the role the combination expects, and the same user is assigned to all the other combinations that he/she satisfies and that involve that specific role. Once all the users have been assigned to the combinations, the algorithm ends. The designers/engineers will now have precise indications about the role of each user to involve in the tests and when data must be collected from him/her, with the objective of matching the needs for the expected UX redesign solutions as best as is possible.
This algorithm has been implemented as an Excel workbook using a mix of formulas, macros and Visual Basic for Applications (VBA) procedures.
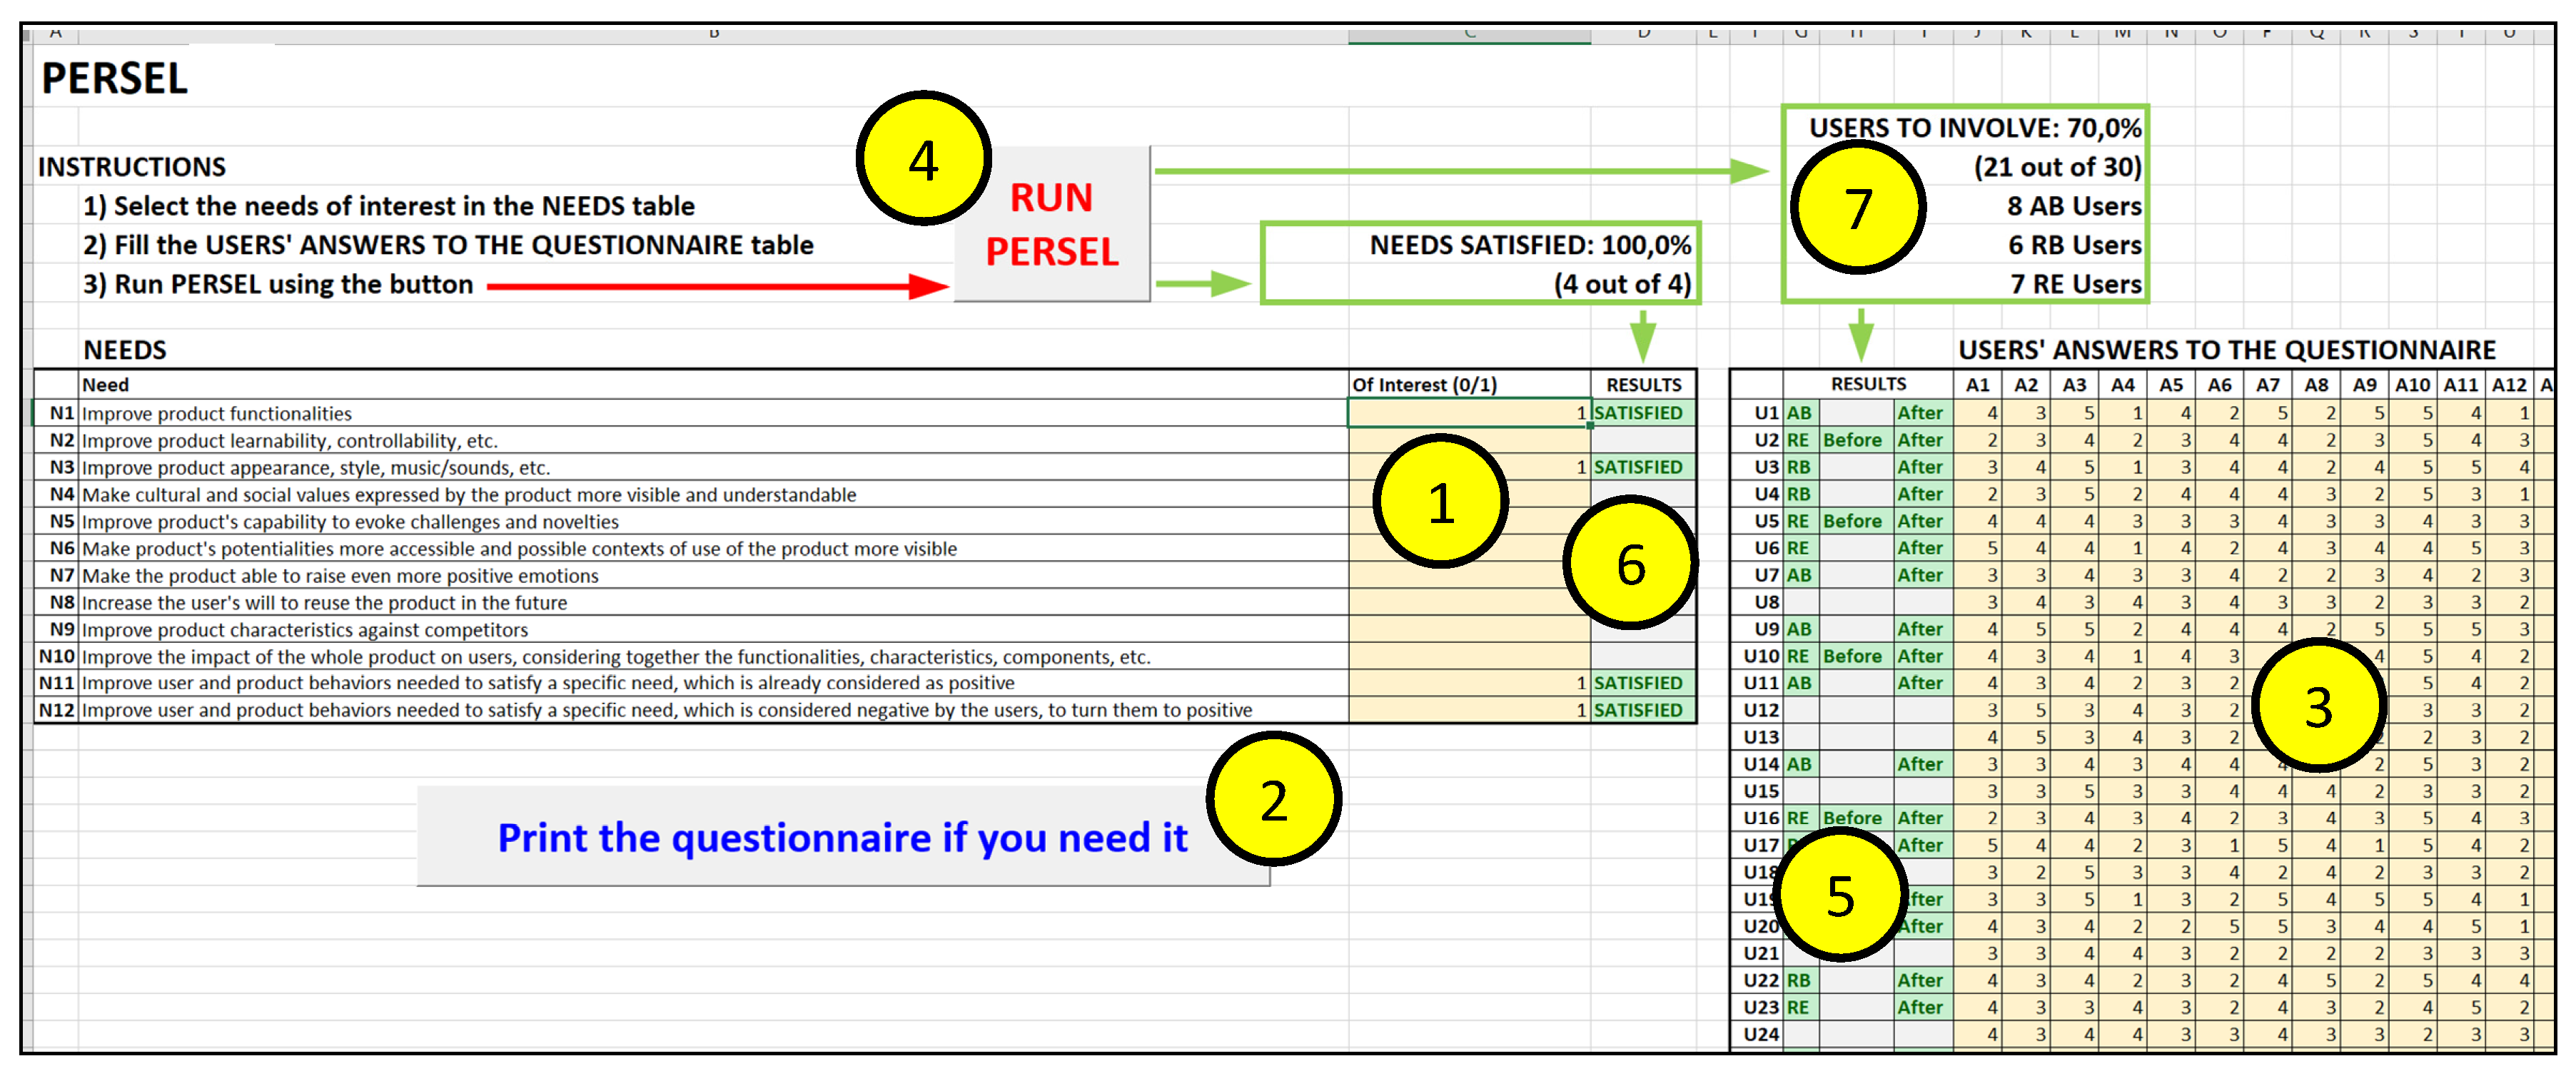
Figure 2 shows the interface of this workbook.
PERSEL development kept UX concerns in high consideration; therefore, the use of it is straightforward. Once launched, as the instructions state in the interface, designers/engineers can select the needs of interest using the table NEEDS (Item 1 in
Figure 2). Then, PERSEL allows the questionnaires to be printed to collect data about users’ personality and knowledge (Item 2,
Figure 2). Once collected, data are inserted in the table USERS’ ANSWERS TO THE QUESTIONNAIRE (Item 3,
Figure 2). Now, the algorithm is launched using the button "RUN PERSEL" (Item 4,
Figure 2). The execution of the algorithm generates several results—the assignment of the role and the moment of data collection to each user (Item 5,
Figure 2), the information about the needs satisfied (since, of course, it could happen that some need cannot be satisfied by the users available) (Item 6,
Figure 2) and some summarizing information like the percentages of needs satisfied and users involved in the tests, as well as the number of AB, RB and RE users (Item 7,
Figure 2). The PERSEL Excel workbook can be founded in
Supplementary Material.
4.2. PERSEL First Adoption in the Field
The first adoption of PERSEL in the field focuses on the UX redesign of the 3D modelling feature of a commercial CAD software package used in the engineering research and development fields.
This adoption occurred to verify the functioning of PERSEL and its effectiveness by comparing the results to the UX redesign solutions coming from the involvement of the random user sample. These solutions were generated some time ago, using the same methods and tools exploited here, namely, the irMMs method and the guidelines. To provide some examples of solutions, two of them are "starting from the positive judgment about the local menu of the sketching environment (where 2D profiles are generated, in order to build volumes by sweeping them in the third dimension), make it even more visible and usable by making it bigger, increasing font dimension, using different colors than grey for the background, representing commands using 3D buttons with different shapes than those of the widgets to introduce numerical values or that of the button to confirm the operations" and "every time a profile is generated and confirmed, exiting the sketching environment should change the view into isometric rather than remaining in the orthographic one".
For what concerns the PERSEL-based UX redesign process, five designers are involved as well as thirty possible users who are students attending mechanical engineering courses. The rest of the section describes the five activities labelled as I to V in
Figure 1. This description makes clear the basic setup of the case study and the testing environment.
4.2.1. Needs Identification Based on UX Items (I)
Designers identify their needs in the list proposed by PERSEL as "improve product functionalities" (N1), "improve product appearance, style, music/sounds, etc." (N3), "improve even more user and product behaviors needed to satisfy a specific need, already considered as positive" (N11) and "improve user and product behaviors needed to satisfy a specific need, considered as negative by the users, to change them into positive" (N12). Consequently, since there is a one-to-one mapping between needs and UX items (
Figure 2), PERSEL will consider only the UX items UX-I1 (usefulness), UX-I3 (aesthetics), UX-I11 (positive ARF differences) and UX-I12 (negative ARF differences).
4.2.2. Assessing Users’ Personality and Knowledge (II)
The designers send the questionnaire to users by e-mail and all of them send it back filled. The "ANSWERS TO THE QUESTIONNAIRE" table of the downloadable release of PERSEL contains the answers. The elaboration of these data generates the content of
Table 5, representing the characterization of each user in terms of personality traits and knowledge about the product to redesign. According to the BFI notation, trait values are expressed in the interval 0–100. The knowledge about the product assumes the known or unknown values only.
4.2.3. Selecting Users whose Personality and Knowledge Best Match the Needs (III)
PERSEL then uses the algorithm to try to assign each user to the combinations related to the UX items corresponding to the needs.
Table 6 shows the result of this elaboration. It contains who should be involved in the UX redesign process and how, in terms of the role and moment(s) of data collection.
As PERSEL shows in the MAIN sheet of the Excel workbook, all needs of interest are satisfied (4 out of 4) and 70% of the possible users will be involved (21 out of 30), classified as eight AB, six RB and seven RE. The remaining nine users are unsuitable because they show neutral values of personality traits.
4.2.4. Product Evaluation Based on PERSEL-Selected Users (IV)
Now, the product evaluation occurs by applying the irMMs method as described in the Background section. Clearly, only the activities related to the needs (UX items) of interest are carried out. What follows describes the first three phases of the irMMs method adoption; the last phase (data analysis) is not used here since the guidelines (the redesign tool used downstream) do not require it.
Phase 1. Input setting. The need is "use the CAD software package to generate the 3D model of the socket shown in the drawing. This model will be used for production. Respect the assigned dimensions". All sections (AB, RB and RE) are considered. The users suggested by PERSEL are involved (eight AB users, six RB users and seven RE users). The evaluators are the five designers that adopted PERSEL.
Figure 3 shows the drawing the need refers to.
Phase 2. Material and environment setup. The AB, RB and RE user guides are suitably customized with respect to the CAD software package by introducing the need and by deleting references to UX items that are not of interest. The first part of the evaluator guides, specific for each section of the irMMs method, reports the test planning in terms of activities and times; the second part remains as proposed by the irMMs method. Finally, a university lab consisting of two separate rooms is selected as the environment to perform the tests. The first room is devoted to the introductory briefings and to the generation of the irMMs; the second room is where the commercial CAD software package runs on a dedicated PC.
Phase 3. Test execution. Every test runs smoothly and data collection occurs throughout without problems.
4.2.5. Generation of UX Redesign Solutions that Best Match the Needs (V)
The guidelines are now applied as described in the Background section. What follows summarizes the three activities they consist of.
Data collection. The data coming from the adoption of the irMMs method are collected and classified. The outcomes are as follows (all duplicate values are excluded). Regarding UX-I1, AB users generated three positive and three negative judgments, RB users five and two, and RE users five and one, respectively. Overall, the users generated ten positive and four negative judgments. For example, a negative judgment about UX-I1 is the missing help in suggesting the way to carry out the modelling activity without browsing the online help. Regarding UX-I3, AB users generated two positive and four negative judgments, RB users four and two and RE users four and none, respectively. Overall, the users generated eight positive and four negative judgments. For example, a positive judgment about UX-I3 is the good layout from the graphic point of view; the main toolbar is clear and avoids eye fatigue. Regarding UX-I11, AB users generated seven positive ARF differences, RB users six and RE users eight. Overall, the users generated 16 positive ARF differences. For example, one of the judgements about UX-I11 is that the fillet command is immediately understandable and executable, because instead of passing through the preview, it directly generates the fillet. Finally, regarding UX-I12, AB users generated 19 negative ARF differences, RB users 12 and RE users nine. Overall, the users generated 32 negative ARF differences. For example, one of the judgments about UX-I12 is that the command for dimensioning 2D drawing views and 3D models is quite hidden, present only in the sketching menu, instead of being an independent functionality placed in the main toolbar.
Guideline selection. Data collected in the previous activity allow for selection of those guidelines suitable for the specific UX redesign. The current knowledge base of the UX redesign guidelines tool contains four guidelines that are meaningful here. The first one aims to improve product usefulness (UX-I1), the second to improve aesthetics (UX-I3), the third to improve positive ARF differences (UX-I11) and the fourth to solve the negative ones (UX-I12).
Guideline implementation into solutions. Now, designers consider each reason expressed by the users and generate the corresponding solution. Once finished, solutions are compared to each other to delete duplicates and are classified against the needs they refer to. An example of a solution generated thanks to the PERSEL involvement considers the third selected guideline. The suggestion of its positive component is "make functionalities and working procedures highlighted as positive even more visible, accessible and effective. To do this, if these functionalities or working procedures refer to user actions, exploit usability/UX principles and guidelines like the Nielsen’s heuristics [
31], Shneiderman’s golden rules [
28], etc.; on the contrary, if these functionalities or working procedures refer to product reactions/feedback, exploit rules and design principles like the TRIZ 40 principles [
32], the twelve principles for green engineering [
33], etc. Try to replicate all of this in all the other product functionalities and working procedures" and the goal is "make the product even more effective in supporting user problem solving processes in all its functionalities". An RB user reported a positive ARF difference related to the model history. He expected a fixed model history, without animations. Instead, the product used simple animations showing the functionalities used time by time. The user judged this difference as positive with the reason "it is very useful to have the model history animated because this allows finding mistakes in the model more quickly, as well as explaining how I generated the model to other people more easily". Based on this reason, the implementation of the positive component of the guideline generates the solution "starting from the positive judgment on the animations shown in the model history, make them even clearer and useful by proposing real pictures of the model in order to identify easily the modelling phase and the actions performed". The Nielsen’s heuristics, suggested by the guideline, helped with generating this solution. The fourth heuristic "consistency and standards" pushes the animation of the model history to be as close as possible to reality by exploiting pictures taken during the modelling activities.
4.2.6. Results Comparison
Table 7 compares the number of UX redesign solutions coming from the involvement of the random user sample to those generated thanks to the PERSEL adoption, all of them referring to the needs of interest.
From
Table 7, we deduce that the solutions generated thanks to the PERSEL adoption respond more closely to the needs than those coming from the random user sample. The number of solutions from the PERSEL sample group are higher for every need of interest. Concerning the quality of the results, all solutions generated by the random user sample were generated by the PERSEL-based activities as well. These shared solutions are generic and refer to explicit aspects/elements of the product. For example, a shared solution regarding the aesthetics UX item (UX-I3) is "make the color of the background less vivid using grey nuances in order to avoid eye fatigue; at the same time, use vivid colors for the main toolbar in order to catch users’ attention". This solution refers to the color of the background and of the main toolbar, explicit elements of the product. Nevertheless, the PERSEL involvement also generated fresh solutions. These focus on product details and implicit aspects that only users careful and curious about the specific UX items can find. PERSEL seems to be able to recognize and select these careful and curious users for each of the UX items of interest. For example, one solution generated only by the PERSEL-based activities and referring to the positive ARF differences (UX-I11) is "thanks to the positive judgement about the rotation of the view into isometric when exiting from the sketch environment, every time a profile is generated and confirmed outside the sketch environment (this can happen, for example, when the profile is generated directly on a face of the existing model), the CAD software package should switch the view to isometric as well". Only a fussy person can highlight such a specific UX aspect and PERSEL was able to identify this person among the participants.
5. Discussion
After its first adoption in the field, the Excel workbook implementing PERSEL appears to satisfy the expectations of the ready-to-use tool as starting from the needs and from the users’ answers to the questionnaires, it selects the best users to involve in the UX redesign activities. The NEEDS table allows the needs of interest to be highlighted. The questionnaire, generic and suitable for every product, is made available for printing simply by pushing a button; designers/engineers must only send it to each possible user. The answers go to fill the USERS’ ANSWERS TO THE QUESTIONNAIRE table. By simply pushing the "RUN PERSEL" button, the selection of the users occurs automatically. The outcomes of the first adoption, compared to those from the random user sample, start demonstrating the effectiveness of PERSEL in suggesting the right users to generate redesign solutions that are more focused on the needs of interest. In support of this, during the tests, some users selected by PERSEL because of the presence of a specific need of interest asked if they could write more comments and reasons on the part of the test referring to the UX item related to that need.
It is worth stating that the fact that PERSEL focuses on redesign rather than design could be seen as a limitation. Classically, redesign has fewer degrees of freedom than design; creative, innovative, and rule-breaking products are created in the design stage rather than while redesigning existing products. In the case of PERSEL, the author tried to achieve a compromise. Although the working space is clearly the redesign of existing products, some of the suggested tools to generate the UX redesign solutions were specifically developed for product innovation. For example, this is witnessed by the Russian acronym of the TRIZ theory; in English, it sounds like "Theory of Inventive Problem Solving" [
32].
Currently, PERSEL offers some space for improvement. First, personality traits are considered now as independent from each other; nevertheless, as the literature demonstrated, combinations of traits can influence the results in different ways. For example, open-to-experience people are usually creative, but if they are also agreeable and work with others, their creativity lowers because they tend to follow/agree what the others propose. Second, although each PERSEL relationship represents the link between a combination of personality traits, user roles and moments of data collection and a UX item, this link is missed in qualification/quantification. For example, as reported in
Table 3, both AB and RB users provide meaningful pieces of information about the UX item aesthetics (UX-I3) after the interaction (combinations C1 and C3 in
Table 4); unfortunately, there is no clue about who between AB and RB users could generate more pieces of information. If there were few users available, this missing information would prevent exploiting them effectively because the user role assignment would occur based on the equal distribution per role. Third, there are no relationships involving intermediate values of the personality traits. All of them consider only the trait or its opposite. Fourth, the selection of the needs of interest—the first input of the PERSEL adoption—occurs without any hint or suggestion; it is completely controlled by the designers and engineers. Clearly, the outcomes of PERSEL adoption depend on this selection; therefore, designers and engineers’ skill and knowledge could heavily affect the effectiveness of this adoption. Finally, just one comparison of the PERSEL adoption to the selection of users without obeying any specific criterion cannot be considered as being the ultimate word on PERSEL effectiveness.
6. Conclusions
Considering the strong influence of users’ personality on UX redesign activities, this research aimed to develop a ready-to-use tool—the PERsonality-based SELector (PERSEL)—to identify objectives (needs) and assess users’ personality in order to select the best personalities to be involved in UX evaluation activities to obtain solutions answering, as best as possible, to the needs in terms of UX characteristics such as usability, aesthetics, symbolic significance, emotions, and consequences of use. PERSEL development started by mapping possible needs to twelve UX items, highlighted thanks to the analysis of several UX models and frameworks. The BFI questionnaire was involved and integrated to measure users’ personality and knowledge about the product that was to be redesigned. Thanks to research in the literature, relationships between UX items and combinations of personality traits, user roles and moments of data collection were highlighted. These relationships have provided the basis of the algorithm that selects the best users to involve in the UX redesign activities automatically. Thanks to its implementation as an Excel workbook, PERSEL has already been adopted in the field. This experience has started to validate its effectiveness thanks to the comparison of the redesign solutions to those coming from the involvement of users selected without obeying any specific criterion.
In terms of future work, the PERSEL relationships must consider more personality traits together to avoid losing important pieces of information. This requires interactions with psychologists, and the outcomes will be exploited by following the same procedures used for the generation of the existing relationships. Second, the qualification/quantification of each combination must be managed in order to give PERSEL more information to select the users more effectively. To achieve this, a more careful analysis of the literature regarding redesigning case studies and models should be conducted. Third, the intermediate values of the personality traits must be considered in order to make the relationships more complete. Moreover, a finer granularity of the traits would increase the precision of the users’ selection process. Fourth, designers and engineers should be helped in understanding as best as possible the meaning of the needs they must express at the beginning of the PERSEL adoption in order to reduce the impact of personal skill and knowledge on the outcomes. A “help” document could be introduced to the Microsoft Excel workbook to guide designers and engineers towards the best selection each time. Finally, more comparisons between the involvement of PERSEL and the selection of users without obeying any specific criterion are required in order to achieve a more objective evaluation of the PERSEL performance, which is as free as possible from bias due to the user sample involved each time.


