1. Introduction
One of the most relevant emergencies that worry decision makers in the management of urban settlements is the concomitance of natural, environmental and climate risks, which are increasingly frequent due to the high urbanization and industrialization of population centers and ongoing climate change.
The recent COVID 19 pandemic crisis and the growing danger generated by extreme climatic and environmental phenomena have favored the development of studies on the analysis of environmental and climatic multi-risks. This research has been focused on the evaluation of resilience capabilities against multiple extreme phenomena of adaptation or mitigation actions and strategies.
The first studies of multi-risks are focused on multi-risks of different natural hazards [
1,
2,
3]. An analysis of multi-risks of natural hazards was developed in 2009 as part of the European project NaRas—Natural Hazard Risk Assessment, funded under the European Union’s Sixth Framework Programme of research (FP6) [
1]. In [
2], a model to detect hot spots subject to multiple natural risks was proposed. An overview of the issues of multi-risk assessment and governance is presented in [
3].
Much research has been carried out in the last decade to evaluate the concomitant impact of different types of hazards and the interrelationships between different types of risk. A complete overview of stochastic, empirical and mechanistic quantitative methods for modeling the interrelationships between different types of geophysical, atmospheric and hydrological natural risks is provided in [
4]; in this study, two types of multi-risk models are distinguished:
- -
cascading hazards: two hazards follow one another in sequence over time where the first hazard triggers or modifies the conditions of the subsequent one;
- -
compound hazards: two associated hazards that persist in the same period in the same geographical area.
Furthermore, these models are classified into three types based on the methods used to study the interrelationships between hazards: stochastic, empirical and mechanistic.
In stochastic models, the interrelationship between natural risks is modeled considering the statistical dependence between different environmental variables.
Empirical models are based on observations so that the interrelationships between environmental variables are fitted to the observed data. They have a high accuracy but are limited to the domain of observed values.
Mechanistic models are based on mathematical studies of the impact and evolution of natural phenomena. They are mainly applied in the study of hazard interrelationships in bodies of water, where hydrodynamic or hydraulic equations can be used.
The specific details of the various types of multi-hazard models in the literature are covered in [
4].
As highlighted in [
3,
5], today, local authorities are generally unprepared to deal with multi-risk phenomena as resilient actions and strategies remain focused on reducing the single risk, and do not consider cascade effects that can be produced by the presence of more hazard events. Furthermore, local communities suffer from a lack of skills in all the disciplines necessary for multi-risk reduction planning and are not equipped with the adequate resources to deal with it.
In particular, multi-risk analysis and management that refers to natural, environmental and climate risks require participatory approaches that involve interested actors or stakeholders, referring to processes or citizens exposed to risks, who are able to provide opinions and critical assessments.
In [
6], through specific questionnaires, the opinions of the stakeholders relating to the impacts generated by climate change and environmental risks in deltaic areas are collected to evaluate the deviations between the subjective assessments of the stakeholders and the results of mathematical risk assessment models. The authors demonstrate that the analysis of stakeholder perceptions is necessary to integrate the results of multi-risk mathematical models into decision-making processes.
From this perspective, an important study of the critical issues generated by multi-risk problems in dense urban settlements is focused on the detection of citizens’ states of mind and the emotions obtained, starting from the hidden knowledge base provided by information flows in the social network.
Emotion detection (ED) techniques are generally employed to detect emotions from unstructured texts posted in a social network. These techniques implement Natural Language Processing (NLP), lexicon-based, machine learning and deep learning algorithms using the Ekman [
7] or Plutchick [
8] model of the emotion categories to detect the most relevant types of emotions in the texts. In [
9], the Ekman model is applied to annotate and classify tweets; the Plutcick wheel of emotions is used in [
10] to annotate hindi texts for emotion detection in the disaster domain.
A neural approach using the Unison model [
11] is implemented in [
12] to detect both Plutchik and Ekman emotion categories for fake news detection. An overview of ED techniques from text to annotate and classify documents is presented in [
13]. A literature review of the different lexicon-based and machine learning ED methods is given in [
14].
Lexicon-based and machine and deep learning ED techniques can require high time and memory consumption and can be computationally expensive. Recently, in [
15], a fuzzy-based ED framework called FREDoc (Fuzzy Relevance Emotions Document Classification), based on a fast NLP process to classify documents based on the more relevant emotion categories was proposed.
The main advantages of FREDoC are its high computational speed and the implementation of a multiple document classification method, which introduces a new measure of the relevance of an emotional category in a document. This approach allows for the determination of a finer classification of the document, taking into consideration all the pleasant and unpleasant emotional categories with a relevance that is not negligible or greater than a specified threshold.
FREDoc was implemented in a GIS-based platform in [
16] to classify the relevance of pleasant and unpleasant emotions detected in reviews of service facilities posted on the web. The authors tested this platform to analyze which theater structures located in the city of Naples (Italy) were the most and least popular both for the quality of the theatrical performances and for the quality of the services offered. The Plutchick wheel of emotions was used to model the emotion categories and the relevance of the individual emotional categories was aggregated into the relevance of pleasant and unpleasant emotional categories. The results of the experiments showed that this method produces a more accurate assessment of user satisfaction than that expressed in the scores assigned in the reviews.
A GIS-based framework to detect critical urban areas due to heat wave phenomena is proposed in [
17]; FREDoc is executed to classify documents from posts extracted in social streams where a document is related to a location and a time interval. The primary and secondary emotion categories in the Plutchick roulette of emotions are considered to classify documents. Urban areas in which unpleasant emotional categories are prevalent over time will form hot spots that represent urban areas in which the discomfort due to the presence of periods of heat waves is particularly felt by residents.
This framework was tested on the study area made up of the municipalities of the northeastern area of the province of Naples (Italy); the detected hot spots represent urban areas with a high population and building density.
In this paper, we propose a new GIS-based framework applied to detect critical urban areas in the presence of environmental and climatic multi-risks, based on the emotional states expressed by citizens in the social network.
Following [
17], FREDoc was executed on documents containing posts related to a specific phenomenon released in a time interval by citizens residing in a subzone of the study area. The relevance of an emotional category in a document was evaluated creating a fuzzy partition of the domain of the normalized relevance index, as defined in [
15]. The normalized relevance index of an emotional category in a document was obtained calculating the Term Frequency–Inverse Document Frequency measure (for short, tf-idf) of each term belonging to the category in the document. The relevance of the emotional category in the document is given by the label of the fuzzy set of the relevance fuzzy partition to which the normalized relevance index belongs, with the greatest membership degree.
In order to classify a subzone with respect to more phenomena in a period and to detect the critical subzone in a multi-risk scenario, we propose a measure of the relevance of an emotional category to a subzone in that period in the presence of more risks. We apply the Godel minimum fuzzy triangular norm operator to the same fuzzy sets in the two fuzzy partitions, assigning to the correspondent document a fuzzy relevance of the emotion category given by the label of the fuzzy set with highest final membership degree. This process is described with an example in
Section 2.2.
The proposed model of analysis of critical urban areas in multi-risk scenarios therefore allows us to detect for each subzone of a study area and, in each period, which emotional states of the citizens were most relevant due to the presence of both phenomena: environmental and climate.
Furthermore, it allows to determine in each period which were the most critical subzones due to the presence of both phenomena; to determine the most critical subzones, the subzones in which the unpleasant emotional categories were most relevant, are selected, taking into consideration the fuzzy relevancies assigned to each emotional category.
We tested our framework on the districts of the city of Bologna (Italy), to analyze the critical issues that emerged from the emotional states of citizens in the period between 2020 and 2022 due to the co-presence of the COVID 19 pandemic and repeated heat wave phenomena in the summer months.
In the next section, some preliminary concepts will be analyzed, such as that of measuring the relevance of an emotional category in a document and that of fuzzy partition. Furthermore, the FREDoc model will be briefly described. The proposed framework is described in detail in
Section 3; in
Section 4, the results of the experimentation carried out on the neighborhoods of Bologna are shown and discussed. Finally,
Section 5 contains the concluding considerations.
2. Preliminaries
In this section, the concepts of relevance and fuzzy relevance of an emotion category are introduced and the measure of relevance of an emotional category in a document in the presence of multiple phenomena is introduced. In addition, the FREDoc model applied for the multiclassification of documents based on the relevance of emotional categories is briefly described.
2.1. Fuzzy Measure of the Relevance of an Emotional Category in a Document
Let C = {c1, c2, …, cM} be a set of M emotional categories and T
j = {T
j1, T
j2,…T
jMj} be the collection of terms assigned to the jth emotional category. Moreover, let D = {d
1, d
2, …d
N} be a corpus of N documents. To assess the relevance of the jth category c
j in the i
th document di in [
15] is calculated the tf-idf of each term belonging to cj in the document d
i. It is given by the following:
It is the product of the two terms:
called the term frequency, where f(t,d
i) is the absolute frequency with which the term t
jk appears in the document d
i and n
i is the number of times any term belonging to emotional categories appears in the document di;
and the last term:
called the inverse document frequency and given by the logarithm of the ratio between the number N of documents of the corpus D, and the number of documents N
jk in which the term t
jk appears at least once.
The relevance of the jth emotional category in the ith document is computed by the formula:
given by the ratio between the sum of the tf-idf values of the terms belonging to the jth emotional category and the sum of the tf-idf values of the terms belonging to all emotional categories. The relevance defined in (4) is a normalized value in the interval [0, 1].
In [
15], a process of fuzzification of the relevance of emotional categories in a document is proposed; this process is performed creating a fuzzy partition of the relevance domain [0, 1], where the fuzzy partition is built following the Ruspini constraints. In a Ruspini fuzzy partition the fuzzy sets are mutually disjointed and the sum of the degrees of membership of an element in the fuzzy sets is equal to 1 [
18]. The fuzzy partition assigned to the emotional category is given by the label of the fuzzy set to which the element belongs with the highest membership degree.
2.2. The Measure of Relevance of Emotional Categories in Multi-Risk Scenarios
Suppose we have measured in a period the relevance of an emotional category found in a document caused by phenomena connected to a specific risk and that we have carried out these measurements separately for n types of risk. The aggregate measure of the relevance of an emotional category in that period in the presence of more risks is obtained by applying the Godel minimum fuzzy triangular norm operator to the same fuzzy sets in the n fuzzy partitions. Then, to the correspondent document is assigned a fuzzy relevance of the emotion category given by the label of the fuzzy set with highest final membership degree.
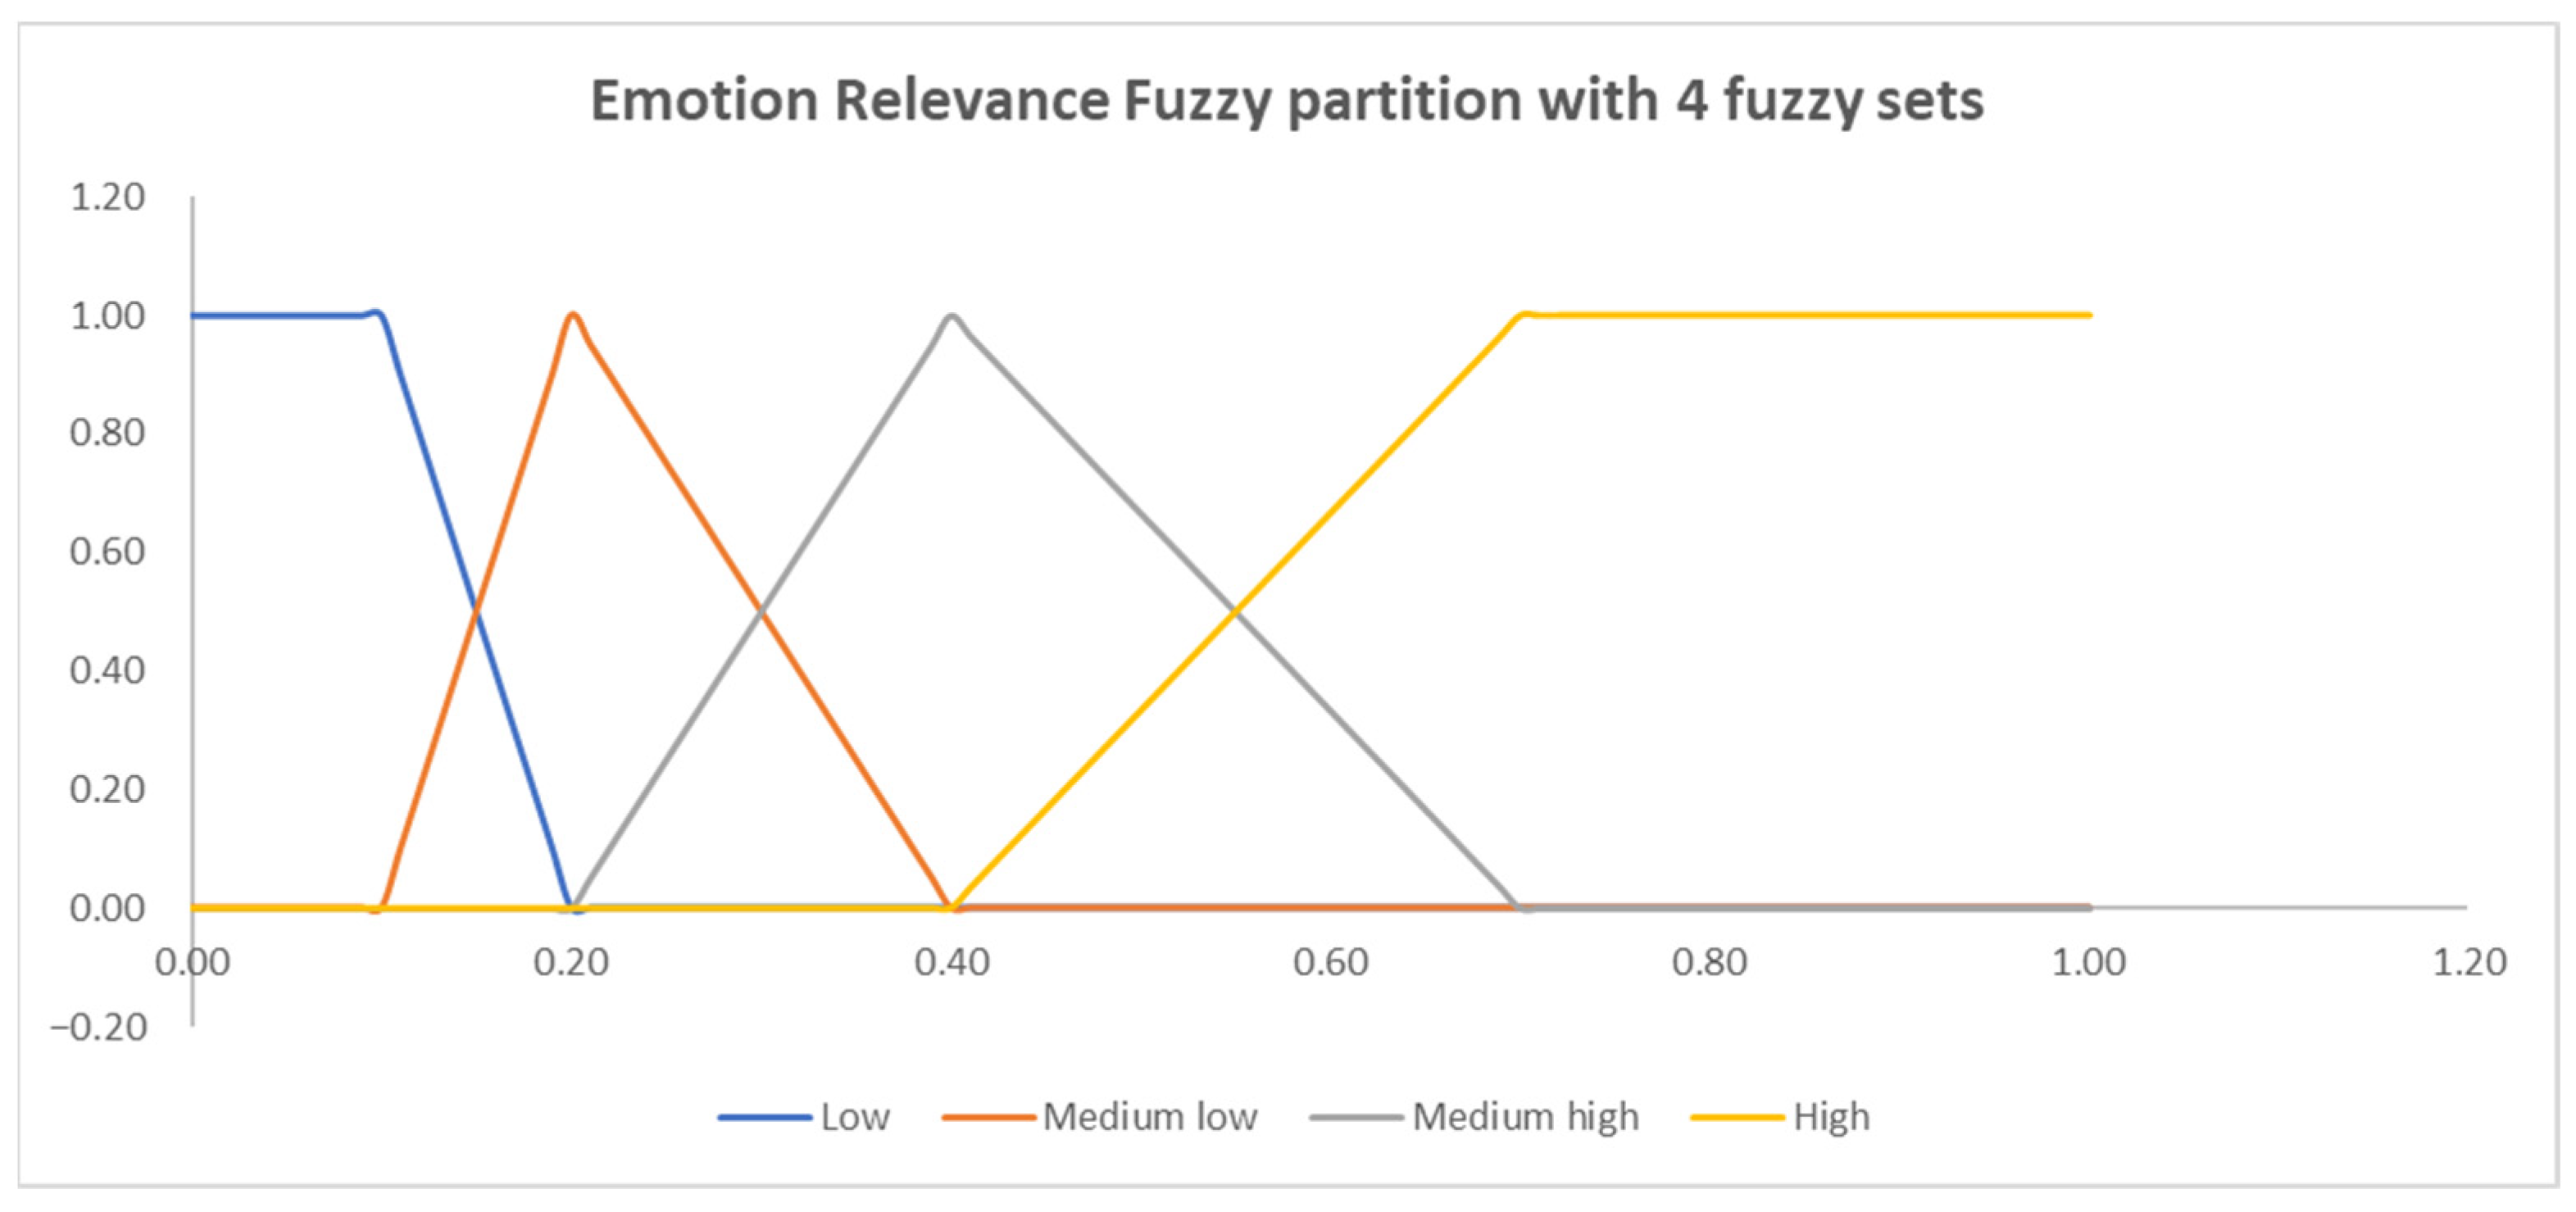
To show an example of this process, let us consider the following fuzzy partition of the domain [0, 1] of the emotional categories, composed of the four triangular fuzzy numbers in
Figure 1.
Let r
ij be the normalized relevance of the jth emotion category to the ith document. In the example in
Table 1 are shown the value of r
ij calculated for two types of environmental and climatic risks, labelled Hazard 1 and Hazard 2. In the table are inserted the correspondent membership degree values to the four fuzzy sets of the fuzzy partition. The third row show the t-norm values given by the minimum of the membership degrees to each fuzzy set.
The maximum value of the intersection calculated via the minimum T-norm is obtained for the Medium high fuzzy sets. Then, the fuzzy relevance assigned to the jth emotion category in the ith document in the analyzed period in the presence of the two risks is medium high.
2.3. The FREDoc Model
In this paragraph is briefly described the FREDoc model; a detailed discussion of FREDoc is given in [
15].
The components of the FREDoc models are schematized in
Figure 2.
The data streams are transmitted to the text parsing component which parses the texts to filter only posts with relevant terms; subsequently, it aggregates posts with similar characteristics (for example, posts with the same topics and inserted in a specific period from a specific place), creating documents. The output of this process is a corpus of documents.
Term filtering analyzes each document, annotating words matching terms inserted into their stemmed forms in a dictionary of terms assigned to emotional categories (dictionary of emotional words) in which, to every pleasant or unpleasant emotional category is assigned a list of terms in their stemmed form.
The ECM construction calculus component determines the relevance of the emotion categories in the documents by (4), after calculating the TF-IDF of each annotated term.
Finally, ECM construction creates the Emotional Category Matrix (in short, ECM), whose element provides the relevance of the jth emotional category in the ith document.
The document classification component classifies each document by using a fuzzy partition of the normalized emotional relevance, called ER fuzzy partition. The fuzzy relevance of the jth emotional category to the ith document is given by the terms of the fuzzy set to whom the emotional relevance rij belongs with highest membership degree.
The ith document di is classified assigning the fuzzy relevance of all pleasant and unpleasant emotional categories.
FREDoc provides a multiclassification of documents; each document is classified by assigning the relevance of each emotional category in the document.
In [
15], the sixteen primary and secondary emotional categories of the Plutchick wheel of emotions were used to create the EC dictionary; however, FREDoc is independent of the choice of model of the emotion categories.
In addition, FREDoc is independent of the cardinality and type of the ER fuzzy partition, which can be created by the user based on their application needs and how fine the classification of documents must be.
3. The Proposed Framework
The proposed framework provides the multiclassification of subzones of a study area based on the relevance of pleasant and unpleasant emotions occurring in a period of time in the presence of two or more environmental and climatic phenomena.
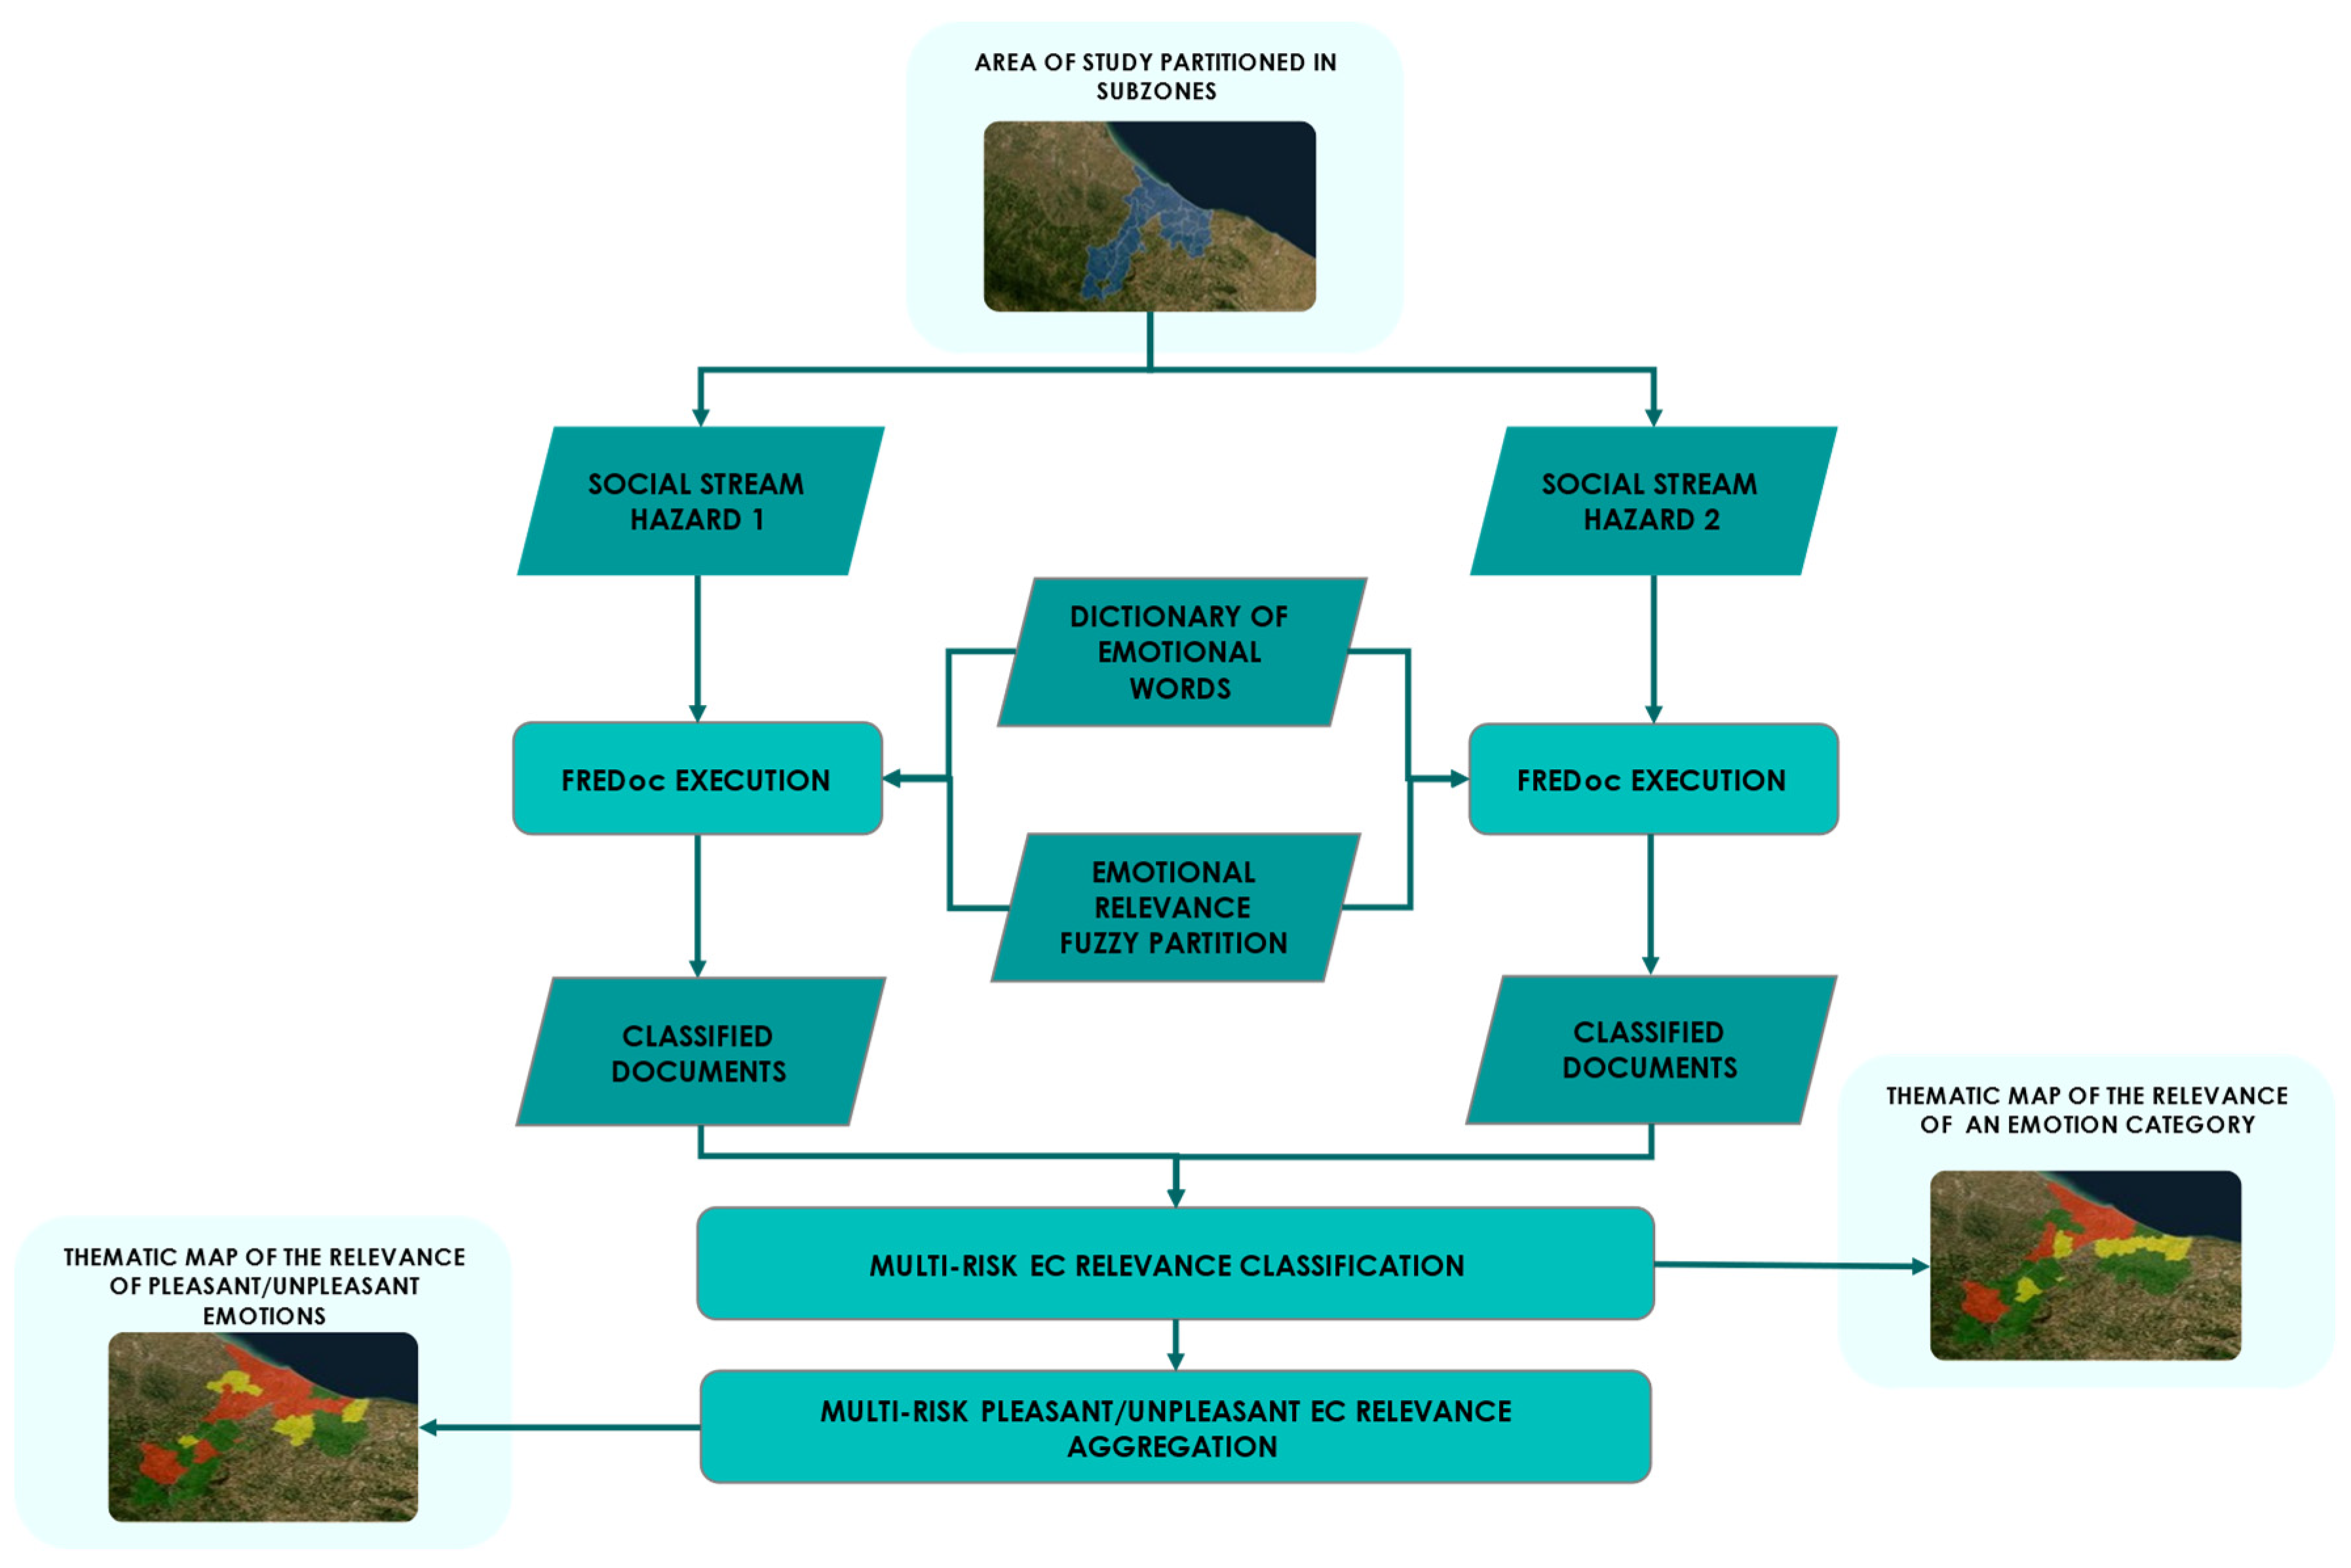
Figure 3 schematizes the architecture of the proposed framework.
The aim of the framework is to perform a multiclassification of the subzones of the study area in a set of periods based on the relevance of pleasant and unpleasant emotion categories detected in posts inserted by citizens relating to a set of environmental and climatic phenomena.
To carry out the multi-risk analysis of the critical issues generated by the joint occurrence of hazard scenarios generated by different environmental and climatic phenomena, FREDoc is executed separately to evaluate the relevance of citizens’ emotions in a specific period due to the presence of each phenomenon.
Subsequently, the joint relevance of the emotions generated by the presence of multiple phenomena in the same period was assessed; this assessment was accomplished by building thematic maps of the relevance of pleasant and unpleasant emotions to detect the most critical subzones.
The two data streams Social stream hazard 1 and Social stream hazard 2 are, respectively, flows of social data connected to the first and second phenomena and inserted into the network by residents in the study area throughout the entire time-period of the investigation. This period is partitioned into atomic time intervals of equal width, called time frames.
A time frame constitutes the unitary time interval of investigation. For example, the analysis to be carried out may refer to a time span of one year divided into time frames given by the four quarters.
FREDoc analyzes the two data streams separately, carrying out a multiple classification of documents based on the relevance of the emotional categories, where a document is built starting from posts inserted in a time frame by residents in a specific sub-area of the study area.
Following [
15], the ECR fuzzy partition is given by the seven fuzzy sets shown in
Figure 4.
The sixteen primary and secondary emotion categories of the Plutchick wheel of emotions are used to create the
EC dictionary. They are schematized in
Table 2.
The Multi-risk EC relevance classification component carries out the classification of the relevance of the emotional categories generated by the presence of both phenomena in a time frame. The min triangular norm operator is applied to assess the relevance of the category due to the presence of both phenomena. It is given by the lesser of the membership degrees of the relevance of the emotional category due to each of the two phenomena. The component evaluates for each document the fuzzy relevance of the emotional categories in the presence of the two phenomena. For each emotional category, a thematic map of its relevance in the subzones of the study area in the time frame is built.
The component Multi-risk pleasant/unpleasant EC relevance aggregation carries out an aggregation of the relevance of the pleasant and unpleasant categories for each document. It creates, for each time frame, a thematic map of the relevance of the pleasant and unpleasant emotional categories.
The classification of the subzones in a time frame based on the relevance of pleasant or unpleasant emotions is carried out by setting a threshold of the fuzzy relevance of the emotional categories FRth and checking which emotional categories have a relevance higher than or equal to the threshold.
A subzone is classified as pleasant (unpleasant) if only pleasant (unpleasant) emotional categories are present in it with a relevance higher than or equal to the FRth threshold. Following this reasoning, this subzone will be classified as follows:
Pleasant, if there are pleasant emotional categories with fuzzy relevance higher than or equal to FRth and all unpleasant emotional categories have relevance lower than FRth;
Unpleasant, if there are unpleasant emotional categories with fuzzy relevance higher than or equal to FRth and all pleasant emotional categories have relevance lower than FRth;
No prevalence, if there are both pleasant and unpleasant emotional categories with fuzzy relevance higher than or equal to FRth or all emotional categories are classified with a relevance lower than FRth;
In order to show this emotional category aggregation and classification process with an example, let FR
th be set to the value
Medium-high and let us consider the following classification of a subzone in a time frame (
Table 3).
After executing the aggregation process, the subzone will be classified with the label No prevalence, as there is one pleasant emotional category with fuzzy relevance higher than or equal to FRth (the emotional category Optimism) and there are two unpleasant emotional categories with fuzzy relevance higher than or equal to FRth (the emotional categories Fear and Anger).
The final thematic maps will show the relevance of pleasant and unpleasant emotions in the subareas of the study area in each time frame. These thematic maps allow to evaluate in which subzones pleasant or unpleasant emotions prevailed in the presence of the two phenomena and how these prevalences evolved over time. In this way, it is possible to detect the most critical subzones, i.e., those in which unpleasant emotions prevailed throughout the analyzed period.
In the next section, the results of an experimentation of the framework carried out in the city of Bologna (Italy) are shown.
4. Results and Discussion
Bologna is divided into six districts (
Figure 5), which constitute the individual subzones into which the urban study area is divided, which are Borgo Panigale–Reno, Navile, Porto–Saragozza, San Donato–San Vitale, Santo Stefano and Savena.
The experimentation was aimed at analyzing the multiple risks caused in the period from 2020 to 2022 by the presence of the COVID 19 pandemic and summer heat wave phenomena. The period is partitioned into three time frames corresponding to the three years 2020, 2021 and 2022.
The summer months of June through September were selected as the three periods of the year in which heat wave phenomena occurred frequently in the city of Bologna, as several heat wave occurrences took place in the city of Bologna in the three years 2020, 2021 and 2022, particularly in the months of July and August.
In the experiments, we carried out queries on all the posts published on Twitter by residents in the six districts of Bologna in the three years, separately analyzing all the posts whose keywords contained themes correlated with heat wave phenomena and with the COVID 19 pandemic.
For each of the two hazards, the emotional relevance of the sixteen pleasant and unpleasant emotional categories was assessed separately over the three years; then, the aggregation of the relevance with respect to the two hazards was carried out. Moreover, for each time frame were elaborated the thematic maps in which the six districts are classified based on each emotion relevance.
For the sake of brevity, below are shown two thematic maps: one for the pleasant emotional category Awe and another for the unpleasant emotion category Anger. The decision to show these two categories is related to how important they are in relation to the others and to their significant relevance registered in some subzones of the study area.
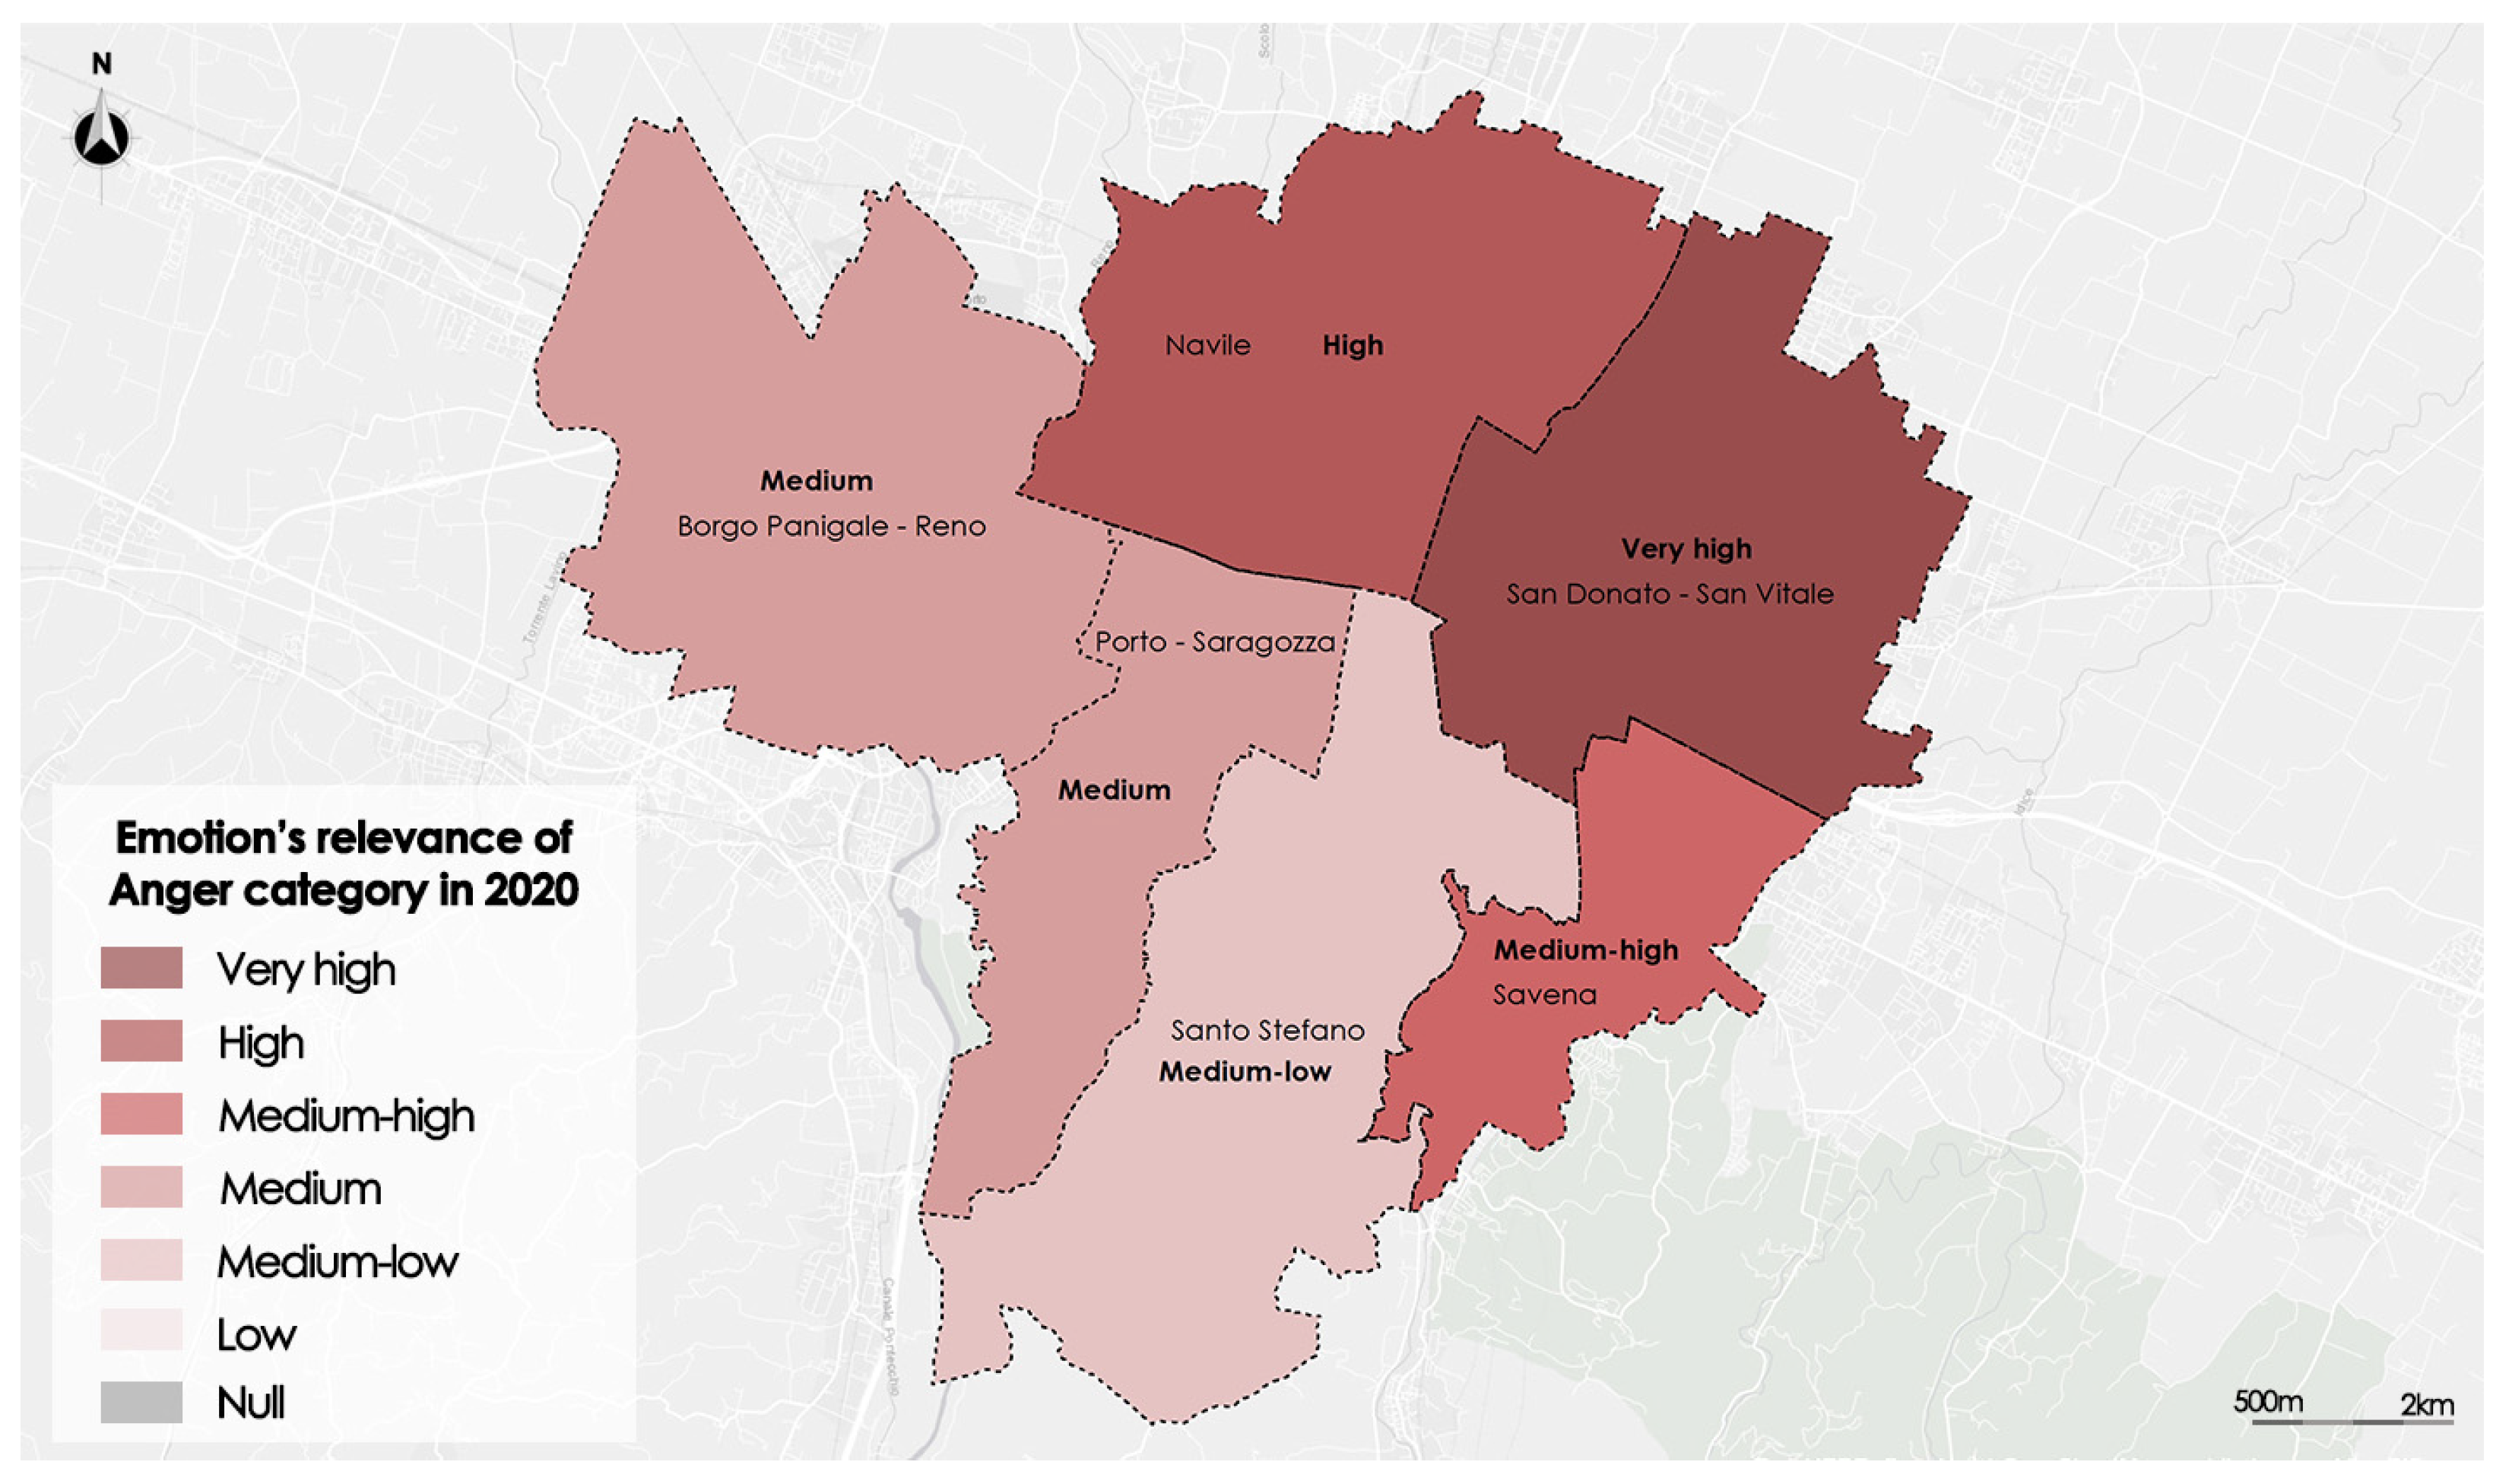
In
Figure 6 is shown the relevance thematic map of the unpleasant emotional category
Anger in the time frame 2020.
The districts classified with a significant relevance of the emotional category Anger in the year 2020 are in the north of the study area; they are Navile and San Donato–San Vitale. The Anger relevance in the first one is classified as High with a value of 0.80; in the second, it is classified as Very high with a value of 0.93. Santo Stefano, is the district with the lowest relevance value (0.18), classified as Medium-low.
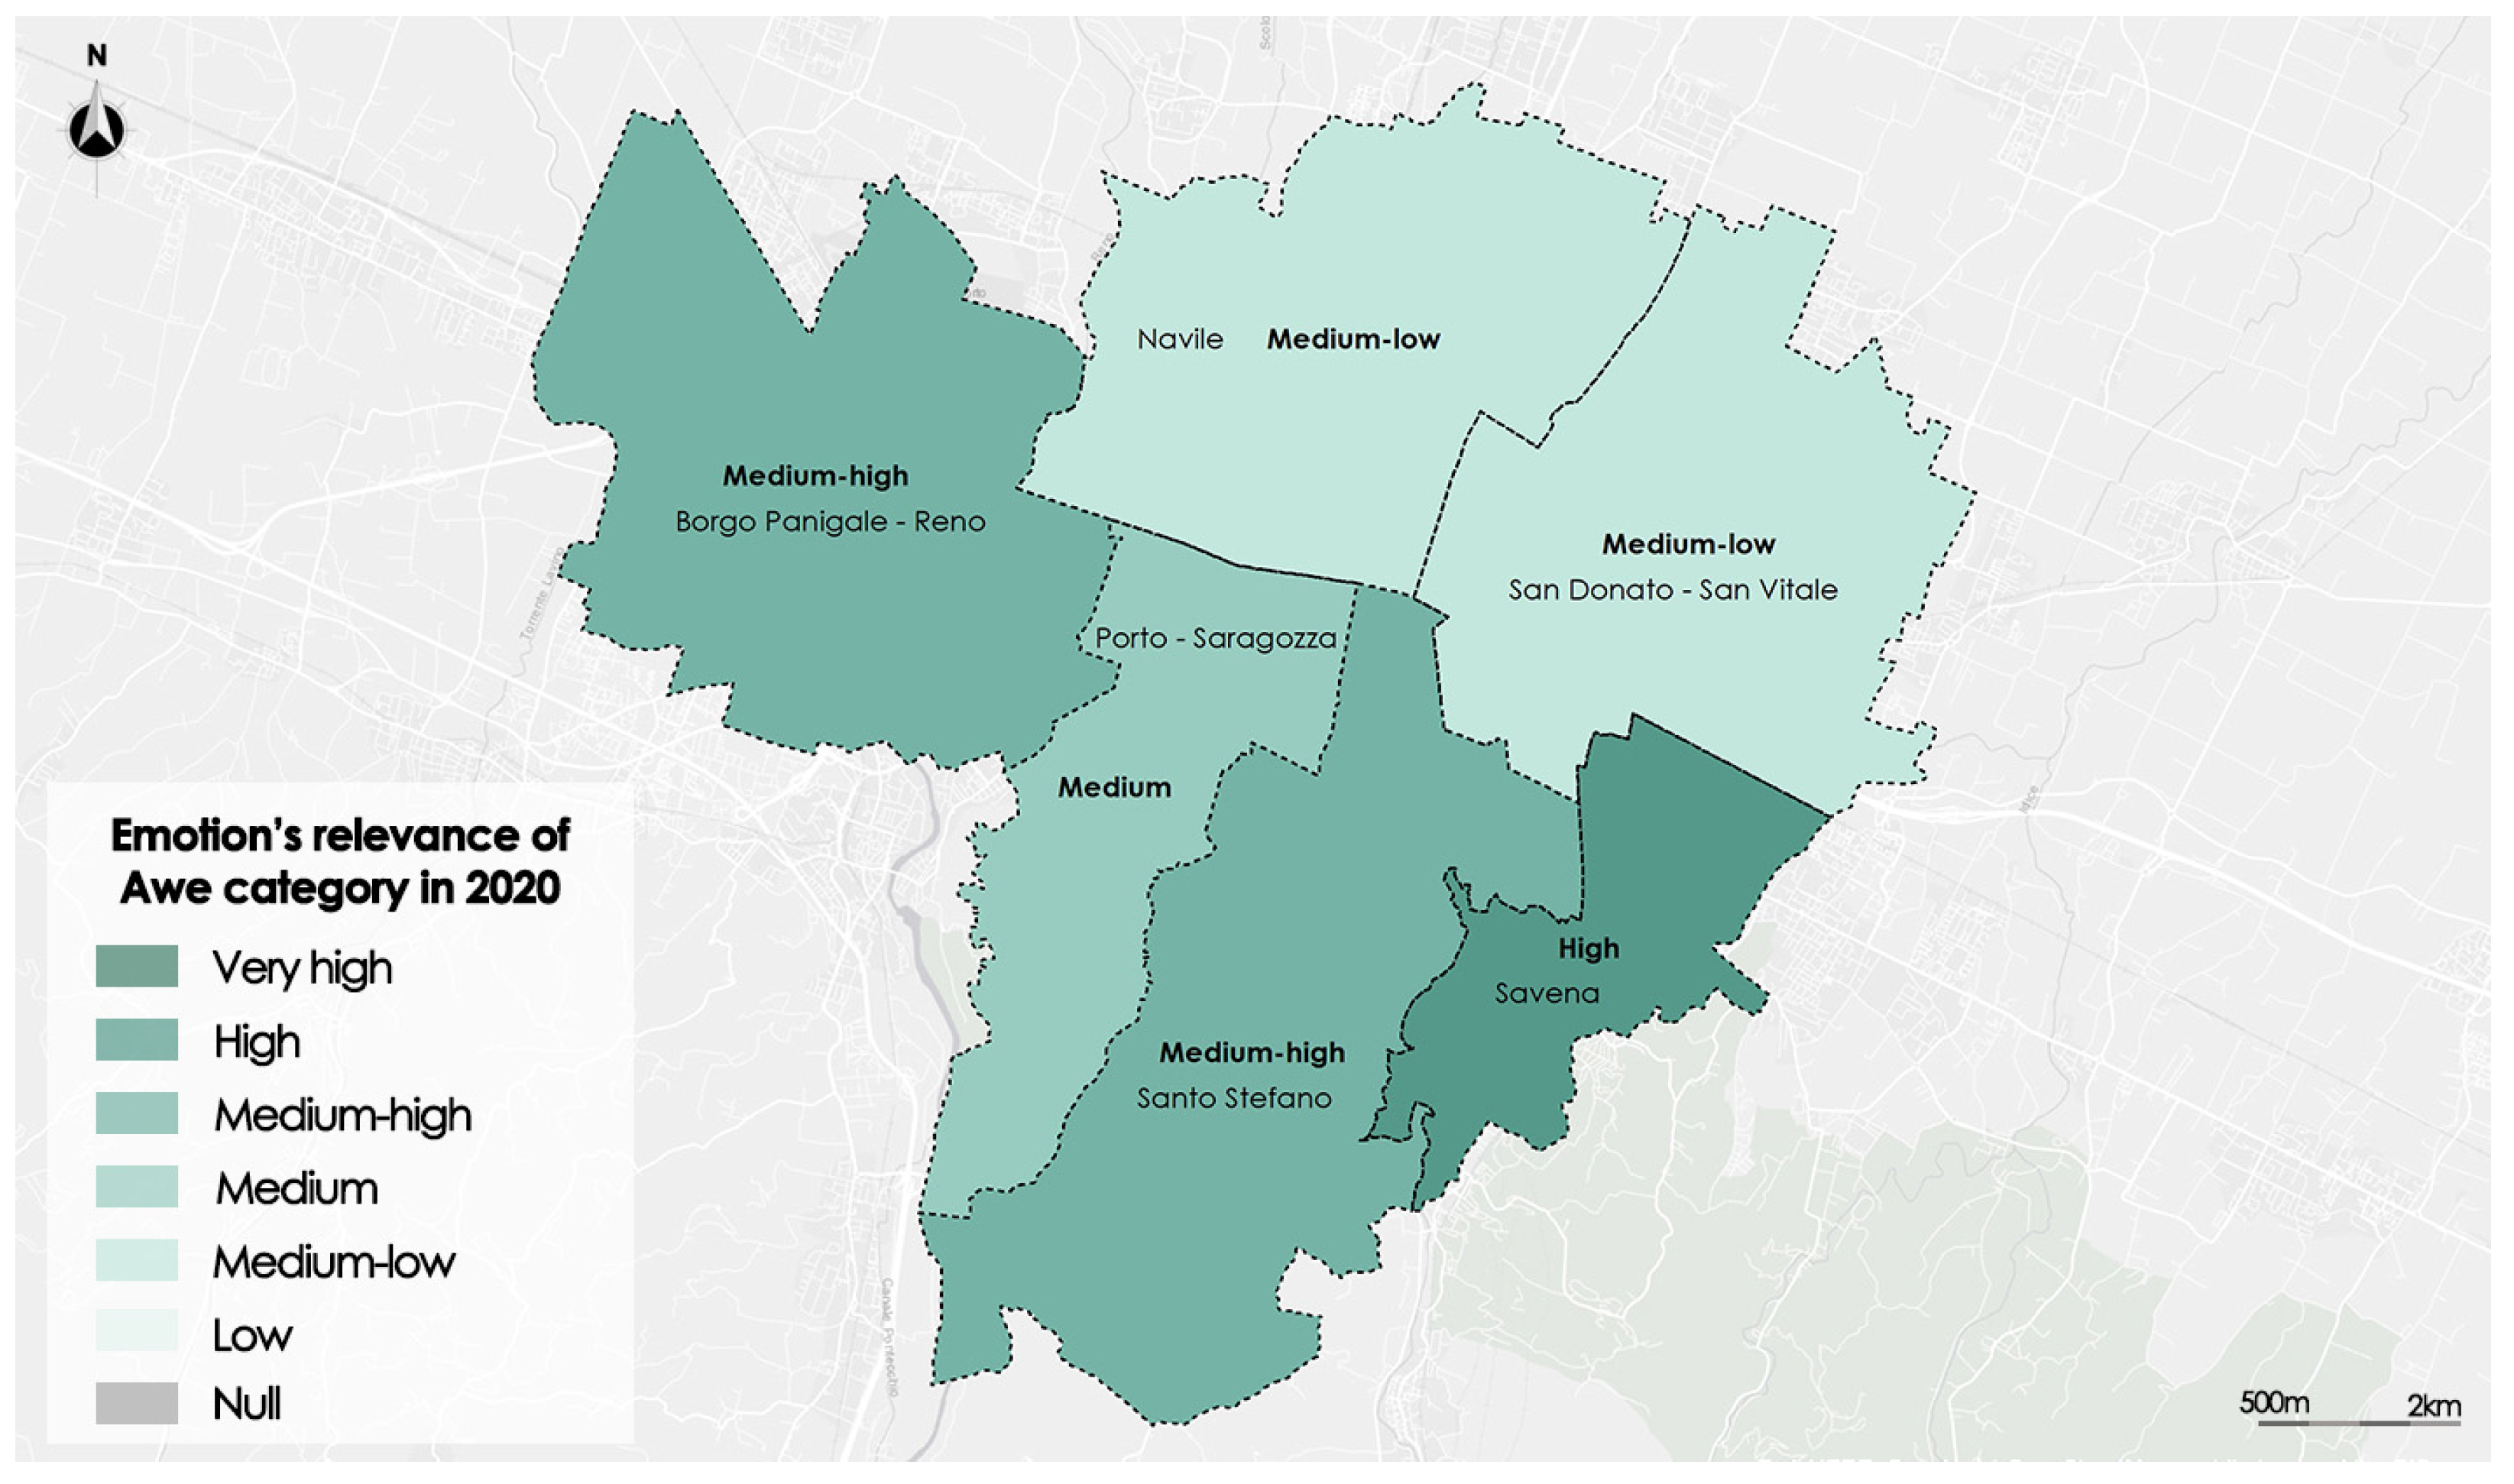
In
Figure 7 is shown the relevance thematic map of the pleasant emotional category Awe in the year 2020.
In the year 2020, the emotional category Awe records greater relevance in the district of Savena, classified as High, with a relevance value 0.84. The districts with the lowest relevance values, 0.19 and 0.17, respectively, are Navile and San Carlo–San Donato; they are both classified as Medium-low.
The relevance thematic map for the unpleasant emotional category Anger in the time frame 2021 is shown in
Figure 8.
The Anger emotional category in the time frame 2021 shows a different distribution than the previous one. In fact, in four districts out of six, the emotional relevance has increased compared with that recorded in the previous time frame. For example, the Anger relevance in the district of Navile, classified as High in 2020, in 2021 is classified as Very high, with a value increased from 0.80 to 0.96. The district that recorded the greatest relevance decrease is San Donato–San Carlo, classified as Very high in 2020 and Medium in 2021.
In
Figure 9 is shown the result of the thematic map of the relevance of pleasant emotion category Awe in the time frame 2021.
In 2021, the Awe emotional category recorded a tendency to decrease relevance for four out of six districts, for example, the district of Navile passed from the Medium-low class to the Low class. San Donato–San Carlo and Porto–Zaragoza have not undergone class changes, while the district that has recorded an improvement in the decline of relevance is that of Santo Stefano, which passes from a Medium-high class to High.
The thematic map showing the spatial distribution of the relevance of the unpleasant emotional category Anger in the year 2022 is shown in
Figure 10.
In this year, the increase in the relevance of the emotional category Anger turned out to be concentrated in the districts of Navile, Santo Stefano and Savena. The district that recorded the greatest increase in relevance is Santo Stefano, in which the relevance of this emotional category, which was Medium-high in 2021, is Very high in 2022.
The only district that recorded a decrease in relevance was Borgo Panigale–Reno, while the district Porto–Zaragoza was classified Medium-low as in 2021.
Figure 11 shows the thematic map of the relevance of the pleasant emotional category
Awe in the year 2022.
The Pleasant emotional category Awe in the year 2022 recorded an overall increase in relevance in many districts. The district that registered the best increase was Borgo Panigale–Reno, classified with relevance Medium in 2021 and High in 2022. The only district that recorded a decrease in relevance was Savena, classified with relevance Medium-high in 2021 and Medium in 2022
Table 4 shows the fuzzy relevance of the two emotional categories detected over the three years.
The results in
Table 4 highlight that, in the Navile district, the unpleasant emotional category Anger is significantly present during all three years; on the contrary, the relevance of the pleasant emotional category Awe in this district remains
Low and
Medium-low throughout the entire period.
Also significant is the rise of the relevance of the Anger emotional category in the Santo Stefano district, which from Medium-low in 2020 becomes Very high in 2022.
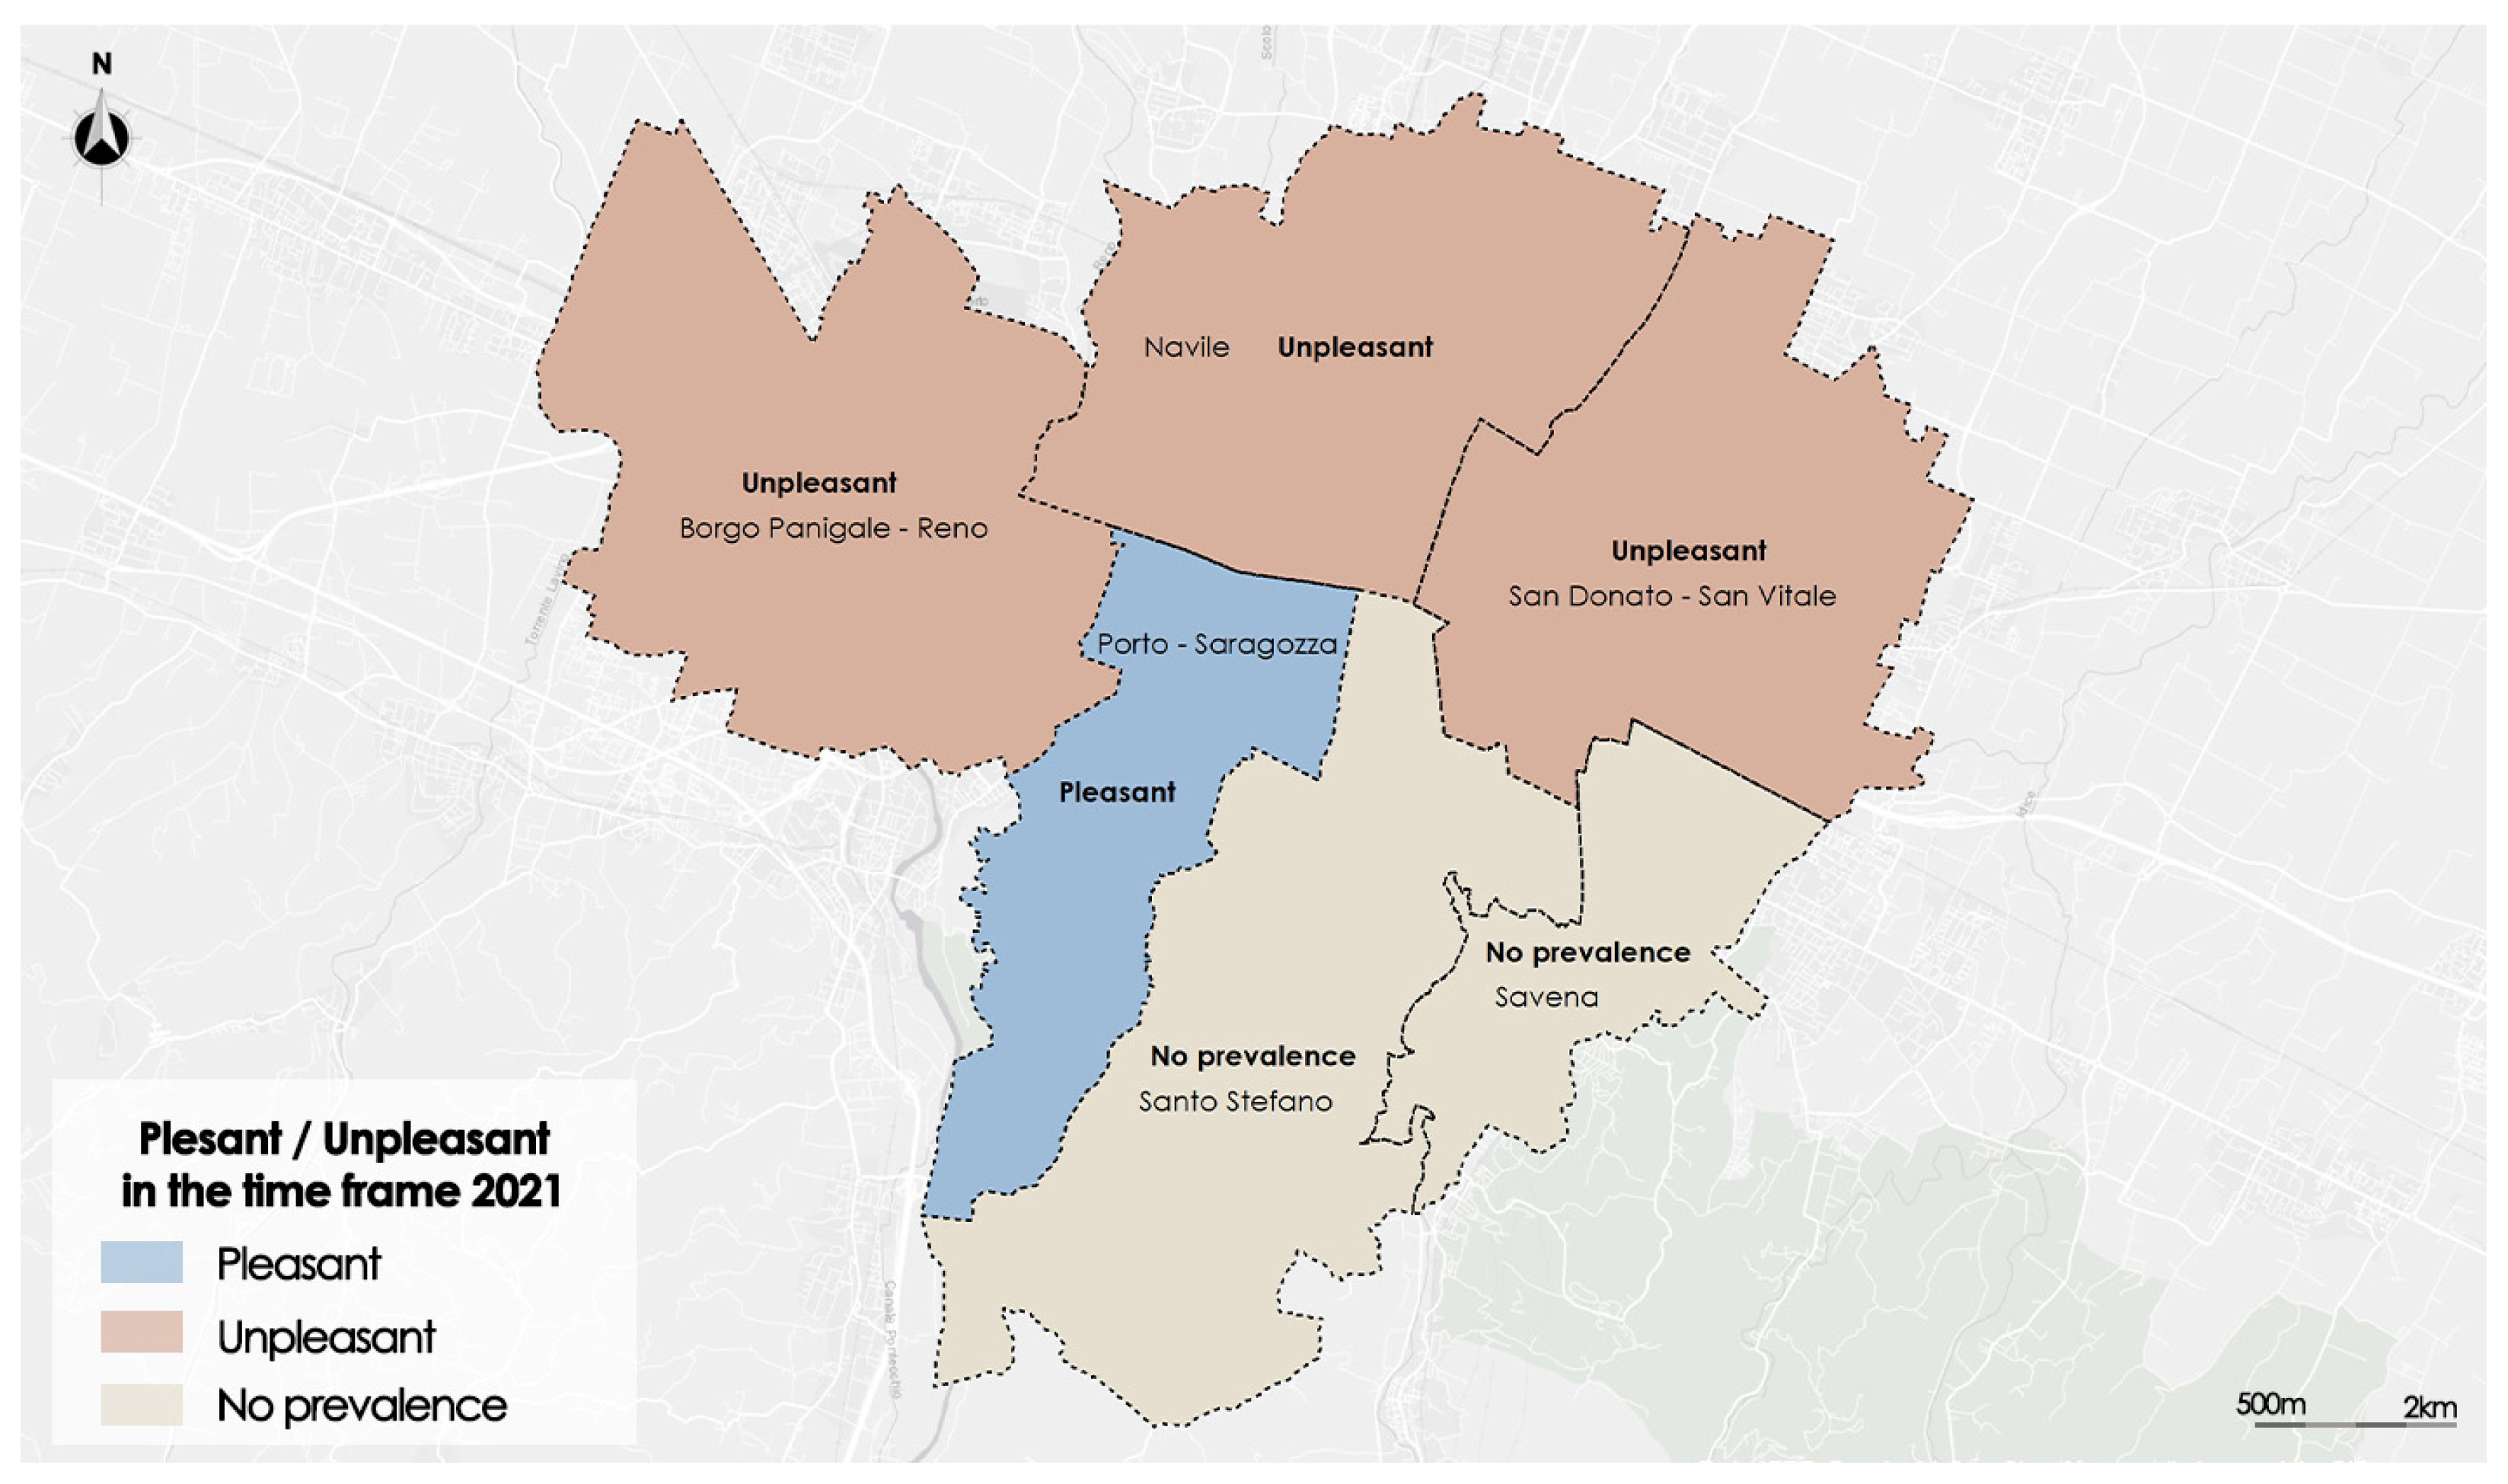
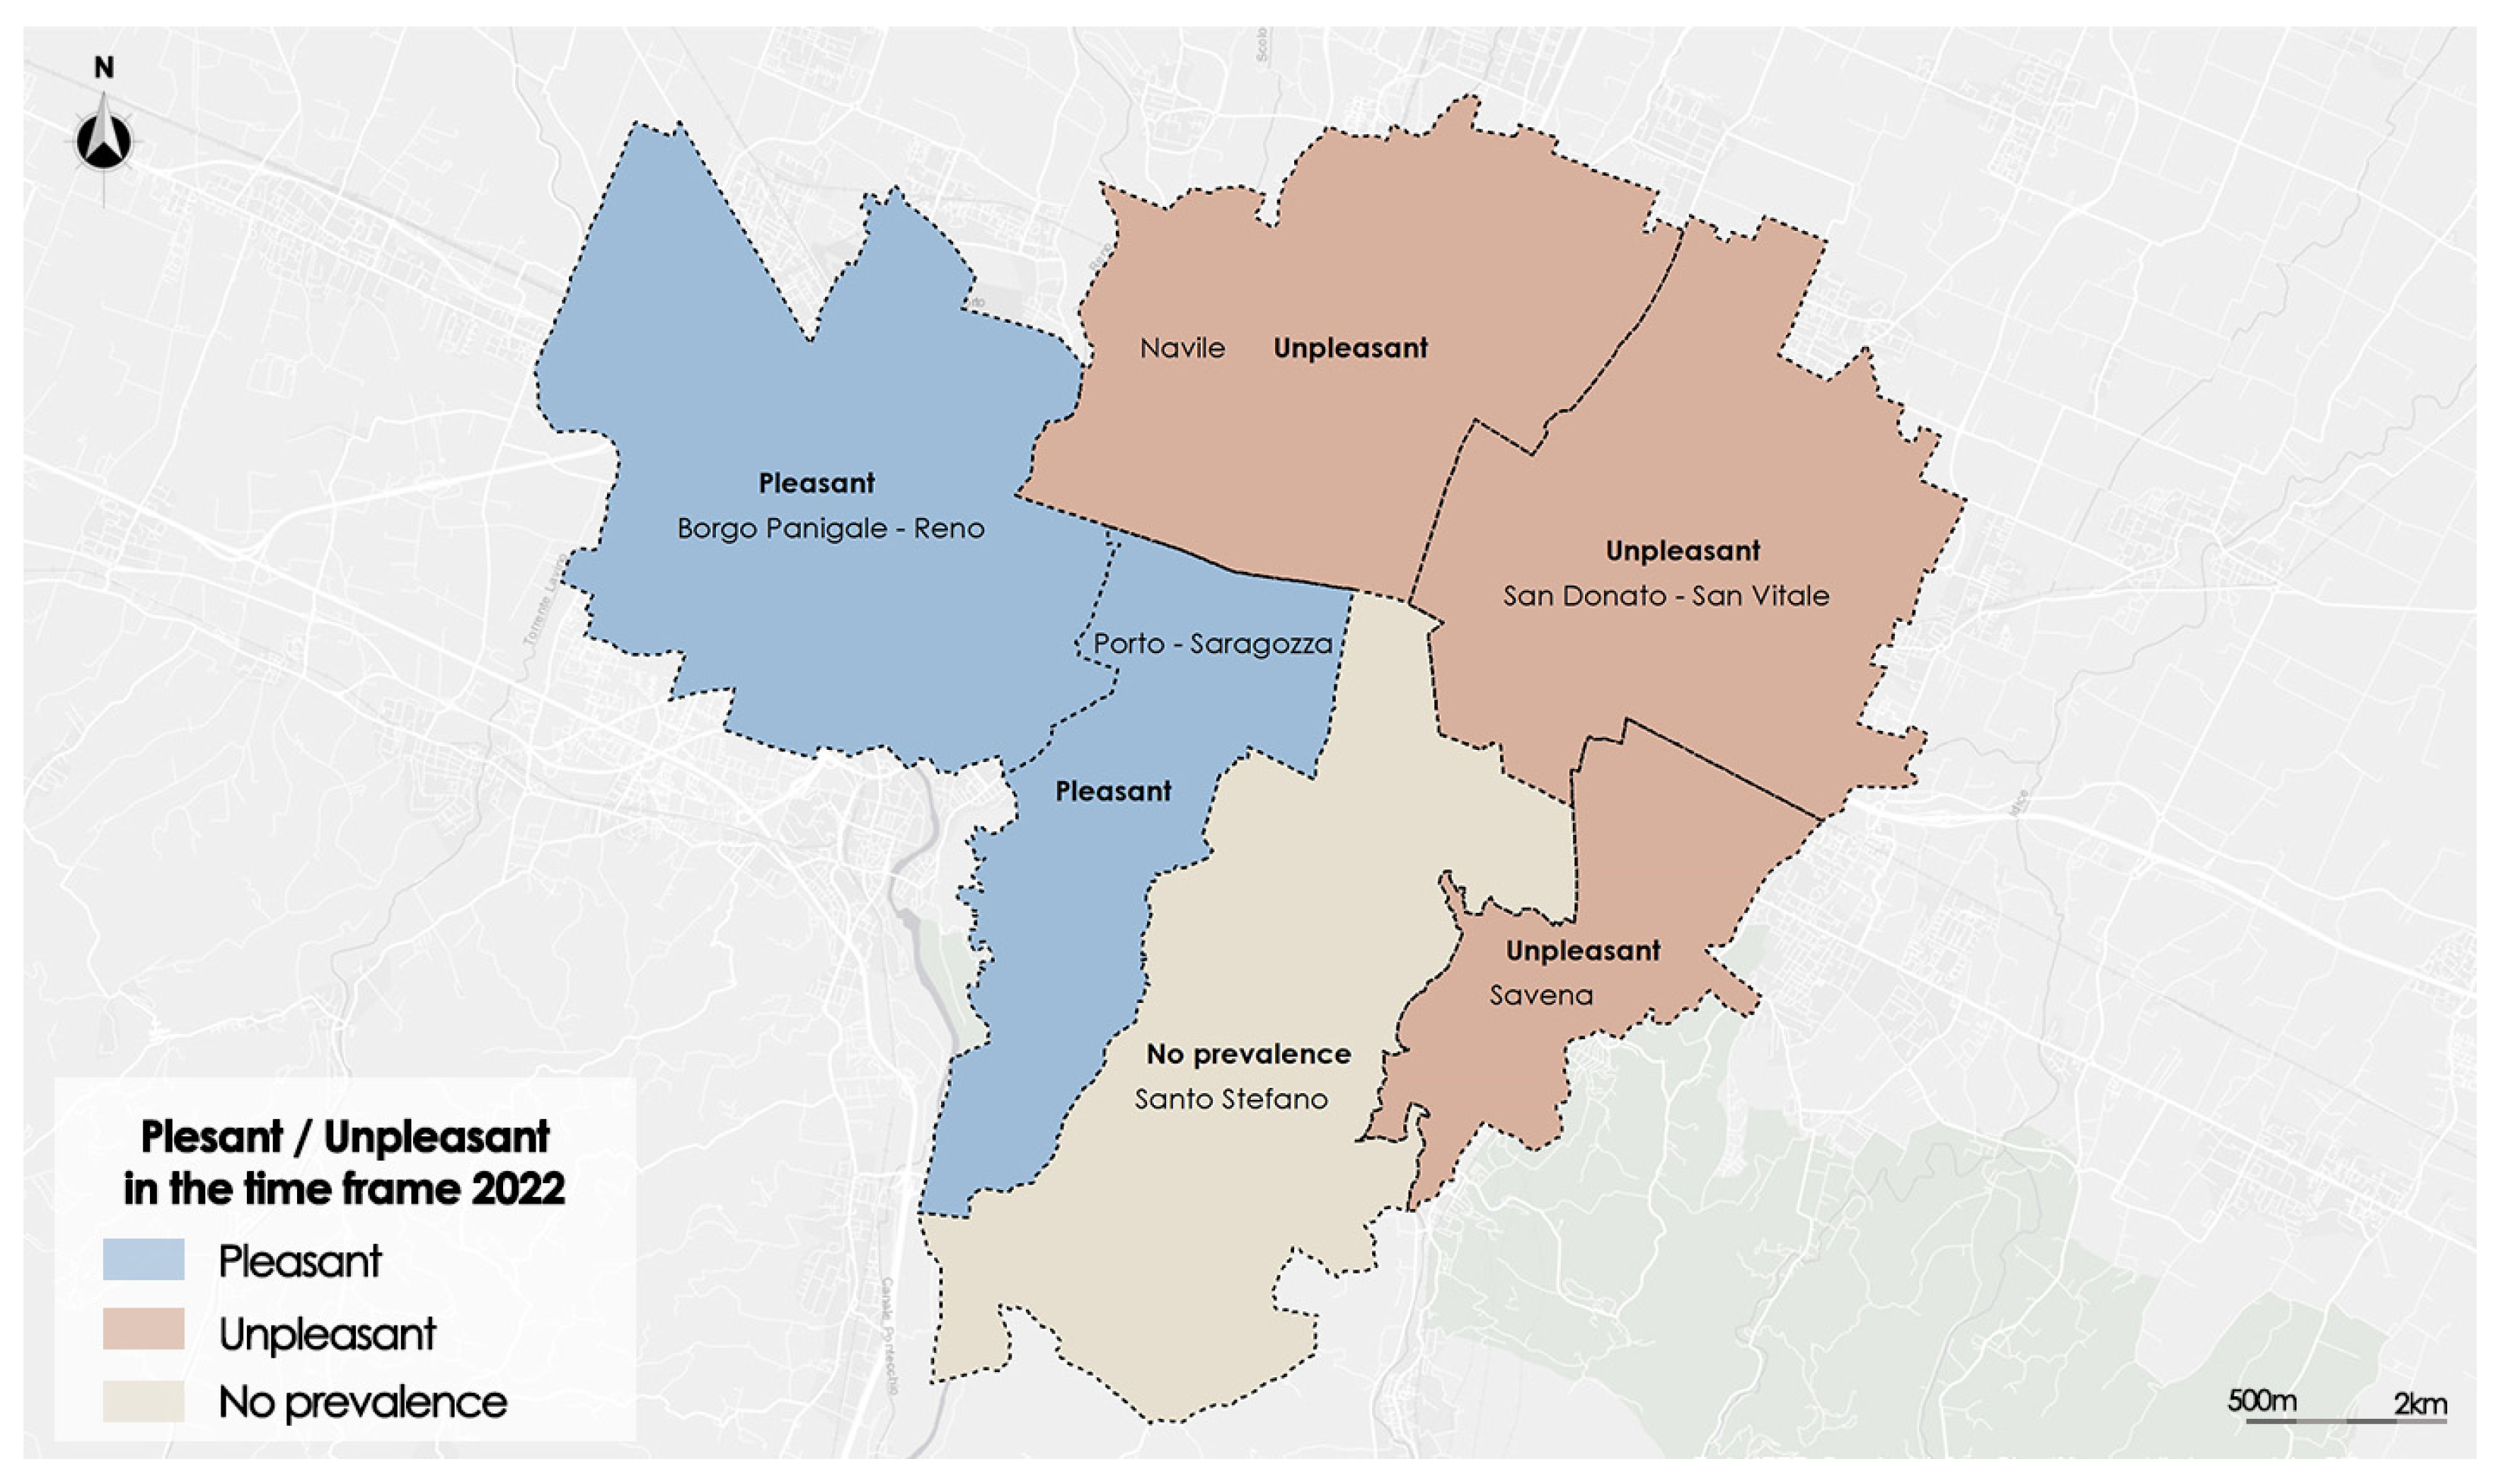
After the process of aggregation of the relevance of the pleasant and unpleasant emotional categories, the final thematic map of the relevance of pleasant or unpleasant emotions was constructed for each time frame. They are shown in
Figure 12,
Figure 13 and
Figure 14, respectively.
The thematic map in
Figure 12 shows that in the year 2020 in the Navile and San Donato districts, unpleasant emotions prevail; on the contrary, in the Borgo Panigale and Santo Stefano districts predominantly pleasant emotions were detected.
The thematic map in
Figure 13 highlights in the year 2021 a prevalence of unpleasant emotions in all the districts of the northern area of the city; the only district where pleasant emotions are prevalent is Porto–Saragozza.
In the year 2022, unpleasant emotions prevailed in the north-eastern and eastern areas of the city; on the contrary, in Borgo Panigale and Porto–Saragozza, pleasant emotions prevailed.
In
Table 5 are shown the classifications of the six districts in the three years based on the prevalence of pleasant or unpleasant emotions.
As highlighted in bold in
Table 5, in the Navile and San Donato–San Vitale districts, unpleasant emotions prevailed throughout the three-year period. The two districts represent the most critical areas with respect to the risk of heat wave hazard scenarios in the presence of pandemic periods.
Porto–Saragozza and Santo Stefano were the least critical districts, where in the three-year period, there were significant pleasant emotions or there were no prevailing types of emotions.
5. Conclusions
In this paper is proposed a new GIS-based framework for the multiclassification of subzones of a study area based on the relevance of pleasant and unpleasant emotions detected in the posts inserted in the social network by residents in a specific period in the presence of two or more environmental and climatic phenomena.
The framework was tested on the six districts of the urban settlement of Bologna (Italy), in order to analyze, from a multi-risk perspective, the relevance of pleasant and unpleasant emotions expressed by residents in the time span from 2020 to 2022 in the presence of a period during the COVID 19 pandemic and in conjunction with summer heat wave phenomena.
The results highlighted that unpleasant emotion categories prevailed in the north-eastern region of the city over the entire period; this region represents a more critical city area in which predominantly unpleasant emotions expressed by residents over the three-year period were detected.
The proposed framework can represent a tool to support decision makers and urban planners to evaluate which urban areas are the most critical in the presence of multiple environmental and climate hazard scenarios and determine where it is most appropriate to plan resilient strategies and actions.
Further testing of the framework will be necessary in the future to evaluate its usability and its adaptability to evaluate critical issues in urban areas in the presence of multiple environmental and climate risks and its use in integration with multi-risk scenario assessment models.


