1. Introduction
The rapid growth of populations, urbanization, and socioeconomic changes have led to an alarming increase in noise pollution within metropolitan regions [
1], posing significant risks to human health [
2,
3]. Recent estimates from the European Environment Agency (EEA) suggest that about 20% of Europe’s population is exposed to hazardous noise levels on a daily basis [
4]. Moreover, it is important to highlight the correspondence to the United Nations Sustainable Development Goals (SDGs), as noise is an issue that is linked to all the goals [
5], especially SDG 3, which targets improving the global health outcomes and well-being of citizens, and SDG 11, which includes notable strides in making cities resilient, reducing pollution, and investing in public spaces or streets [
6].
To safeguard human well-being, the World Health Organization (WHO) has issued noise level recommendations, most recently updated in 2018 [
7]. These regulations refer to diverse environments, including outdoor living areas in cities. Additionally, various regulations have been introduced in recent years to establish safe exposure levels for individuals, identify suitable auditory indicators, and propose noise management strategies. For example, the European Union (EU) enacted a directive in 2002 urging member states to develop noise maps and action plans for their urban environments [
8]. It is proposed to produce noise maps to be integrated into land use plans as a basis for noise reduction plans, along with sustained development policies, which are designed to improve the quality of life for citizens [
9].
In this regard, a noise map can translate noise levels into a dB scale value presented on a map for analysis. Consequently, the examination of noise levels in cities at different times is required to predict noise levels at surrounding locations. However, the prediction of noise levels as a map requires integration with a prediction model in a geographic information system (GIS) environment [
10]. Traditionally, these noise maps have been generated using specialized software that combines noise emission and acoustic dispersion models with geospatial and traffic data [
11,
12,
13,
14,
15]. While they offer a general overview of the noise distribution and the impact of noise reduction initiatives, they are often criticized for being unrealistic, especially when considering the temporal fluctuations in noise levels [
16].
A more recent and increasingly popular approach involves public engagement in data collection. By utilizing smartphones and tablets equipped with global navigation satellite system (GNSS) tracking, individuals can actively contribute to gathering environmental noise data [
16,
17]. These findings can then be displayed on interactive maps and used to create noise maps within a GIS-based model. Although this participatory sensing approach may not offer the same level of accuracy as traditional methods, it presents a low-cost alternative to extensive and expensive sensor infrastructures [
18,
19]. By combining data from various sources and accounting for temporal dynamics, this method has the potential to produce more realistic noise maps [
20].
Moreover, the growing trend of engaging citizens in data collection, enhancing public participation in the process, coupled with the vast number of people possessing mobile devices, has brought attention to the potential of using smartphones as a significant solution to conduct large-scale evaluations of environmental noise [
21]. Additionally, the ongoing development of smartphone features and the production of useful applications enable the quick and simple building of spatial and temporal noise observations. An illustration of this is the NoiseTube project, which introduces an affordable sensor designed for citizens to gather noise data [
22,
23]. Additionally, by adopting a soundscape perspective, information shared by individuals on location-based social networks can be utilized to create sound environment maps.
Briefly, this research aims to introduce the concepts discussed in the previous paragraphs in a framework that has the ability to compare more than one case study area. The collaboration between research teams from different cities also supports this idea for a better understanding of the context and circumstances of the two case study areas, especially in Egypt vs. Croatia. It is also important to mention the struggles that large cities face because of the effects of the central business districts (CBDs), which influenced the choice of the case study areas in Alexandria and Zagreb by focusing on noise problems in the centers of both cities. This study seeks to contribute to the field of urban planning and design, and the discussion of its presented knowledge should improve decision-making processes in this field.
2. Literature Review
Recently, urban planners have realized the importance of how cities can promote health. Frequent evaluation analyses have aimed to quantify the potential health impacts of urban planning actions in cities. Thus, the planning of a healthy city requires the creation and improvement of the physical and social environments so as to enable the public to experience all functions of life with the maximum benefits for health as the highest priority [
24].
Health issues related to noise pollution are especially alarming in cities. This is because noise in the built environment consists of many harmful unwanted sounds surrounding citizens, which is considered a form of air pollution. It can be severe, and this severity increases with population growth and urbanization. In this regard, urban planning and design actions must be implemented to prevent major threats posed by noise, such as hearing loss, cardiovascular diseases, reduced productivity, traffic accidents, and chronic stress [
25]. An awareness of these dangers has led to the necessity to measure, analyze, and map noise levels while engaging the public in the monitoring process [
26].
Noise in urban settings can relate to a variety of activities and land uses. The main sources of noise in this case include road and railroad traffic, construction sites, industrial districts, and noise from public leisure activities. It can be noticed that road traffic is the greatest contributor to noise in cities. Scientifically, sound waves are influenced by the medium that they spread in, which eventually affects their absorption and reflection; this includes factors such as the wind speed, direction, and temperature. For instance, highly vegetated areas can contribute to decreasing noise levels because of their absorption of sound waves and disruption of their spread [
27].
Noise regression models based on land use have been developed to predict the noise levels over large areas where noise levels are not measured in order to generate noise maps. These models can be helpful in cities where official noise mapping is difficult to perform; however, the analysis is essential to guide noise pollution interventions [
27]. In recent years, the amount of accumulated data, affecting life on Earth, has increased notably. Big data bears great potential in providing enhanced insights and improving decision-making processes. This is why modern urban planning needs to address big data concepts as well as the principles of smart cities in order to improve the lives of residents. With the continued growth and redevelopment within cities, urban planners are responsible for designing cities that better mitigate noise and solve urban challenges. It has been found that obtaining public data through passive data acquisition and active public participation supports planning decisions. In particular, active civic participation generates higher levels of interaction and enhances the public’s acceptance of urban planning decisions [
28]. Big data technologies influence urban planning because they match theories and concepts with real issues [
29].
To obtain insights into the relation between noise levels and urban land use, the research by [
30] compared two areas in the Halifax region in Canada. The first study area encompassed residential land use (single-family homes), while the second study area was a mixed-use area. Differences in terms of the noise distribution and levels of environmental noise reflected greater variability in the first area than the second one. This difference was related to greater variability in traffic volumes, background noise, and pedestrian activity. It was also noted that the noise was located near major roads.
It is important to mention that the noise levels in the mixed-use area were higher than in the residential area. In comparison, the residential area encountered noise levels caused by normal conversation ranges comfortable for human hearing. Meanwhile, the mixed-use area encountered annoying ranges of noise due to the higher presence of vehicular and pedestrian traffic, combined with louder background noise caused by different sources all at once, such as delivery trucks, pick-ups, and air conditioning systems [
30]. This study provides encouragement to focus on mixed-use districts in cities as case studies to introduce urban design solutions to solve noise pollution problems.
The design of a public open space in the city with acoustic perception in mind is rarely practiced in architectural and urban design. However, alliances between architects, acousticians, and urban planners to plan the urban environment must consider noise control to achieve a comfortable setting for the public to practice their day-to-day activities in the city [
31]. Moreover, soundscape perception is influenced by the age, education, companionship, performed activity, cultural background, gender, and length of stay of users in an open space [
32].
For more insights, in the study performed by [
33], the large majority of the public in the experiment reported the detection of bird sounds and traffic sounds during their visit to an urban park in Australia. The results of their perceptions of these two sounds were that 56.6% of participants found the bird sounds pleasant, whilst 41.2% were annoyed by the traffic sounds. This could be due to a preference for sounds that remind one of nature and the annoyance caused by the noise of busy urban life. This also encourages urban design to investigate a connection to nature approach when aiming to maintain human comfort in open spaces.
Currently, urban planners address the soundscape in a reactive manner, focusing on noise as part of environmental impact assessments. The primary goal is to minimize human exposure to high sound pressure levels from existing sources. The current legislation reflects a societal perspective that sees sound primarily as an environmental threat requiring protection [
8]. Several studies have dealt with the connection between land use and the noise distribution [
34,
35,
36,
37].
An interesting approach by [
34] presents a methodology with the potential to achieve successful participation in the identification and evaluation processes of quiet areas. Using the Hush City app, users were encouraged to collect a noise measurement for 30 s, therefore contributing to the improvement of their listening abilities. Upon answering 20 noise-related questions within the app, a valuable dataset was created, which could be used to develop interdisciplinary and valuable evaluations of the sonic environment.
Ref. [
38] states that users learn how to recognize different noise levels that they are exposed to by repeated participation in noise collection processes; thus, it is crucial to explore the possibilities of spatial relationships between detected noise levels and the sources from which they are produced. The regrouping of data with similar spatial and temporal characteristics is known as spatio-temporal clustering. Ref. [
39] suggests that an increase in the spatial and temporal density of measurement points suggests that clustering-type methods would be well suited to detect them.
Due to advances in software, big data, and acoustic models, operations that aid noise mapping are easily available. This is also affected by the fundamentals of statistical analysis that lead to several cluster profiles. Cluster analysis methods include the partitioning method, hierarchical method, density-based method, grid-based method, and constraint-based method. For instance, ref. [
40] highlights the importance of comparing clustering methods and discussing the results in the context of the site’s conditions. Their findings also confirm that the results of one method can assure and strengthen the results of another method for the sake of better recommendations. In all methods, the phase before clustering is important and it includes data measurements and collection. Since the 1970s, about 75% of the published work has depended on clustering by hierarchical algorithms. Nowadays, modern clustering methods analyze larger datasets. For instance, density-based spatial clustering is associated with noise applications, as proposed by [
41,
42].
Moreover, several limitations have been addressed by researchers. For example, ref. [
43] mentions that noise studies in cities are mainly carried out by city officials by collecting data at certain locations using professional sound level meters. Short periods of data collection in this case can produce errors. Moreover, the cost of these noise mapping operations is high. Official noise maps require high levels of expertise, human resources, and expensive devices. Consequently, cities with low budgets are restricted from carrying out accurate analyses of noise pollution.
3. Problem Definition and Research Aim
Noise maps are a valuable tool in understanding and addressing noise pollution in cities. These maps describe the spatial distributions of noise levels and allow the efficient visualization of the noise distributions in areas where the land uses are sensitive to noise. For large cities, challenges have to be met in terms of data management, data reduction, calculation methods, optimization procedures, validation techniques, and the presentation of results so that the maps can serve as powerful tools to be used for urban noise planning and design. Noise management and reduction plans must be based on a general strategy for the management of urban areas, considering the land uses, the means of transportation, and the dynamic development of the city [
44].
In light of the above-mentioned aspects, this research aims to associate sources of noise in cities related to noise levels using crowdsourcing applications and spatial analysis techniques to be able to recommend realistic solutions. Starting from these considerations, this study aims to assess city noise levels and associated sources of noise through a framework that enables a comparative scheme between two cities that are subject to different regulations. The study focuses on the differences between the two cities regarding their morphologies, urban schedules, and legislation. The cities chosen for the comparison are Alexandria, Egypt and Zagreb, Croatia, since they share many similarities, especially when comparing their downtown areas. The differences between the cities’ agglomerations, populations, morphologies, and other characteristics are also taken into consideration when analyzing noise sources and measuring their levels in both case study areas.
The adopted methodology depends on a combination of crowdsourcing techniques and geographic information system (GIS) tools for the detection and analysis of noise. This is achieved through the utilization and combination of the following tools: the open-source mobile application Noise Capture, ESRI ArcGIS Pro, the ESRI Field Maps application, and Google Forms for online questionnaires. These tools help in the classification of the detected noise sources from the data gathered through noise capture in a GIS environment to comprehend the sound distribution, both spatially and temporally. The noise sources detected during measurements, as well as the questionnaire’s outcomes, help to provide insights into the association of sound sources with human activities and their perception in the urban setting. Therefore, the proposed methodology introduces the detection and analysis of the relationships between noise and the community in the built environment.
4. Materials and Methods
This study proposes an adopted methodology framework that combines crowdsourcing techniques reinforced by GIS. The usage of spatial analysis and statistical models to associate captured noise levels with the detected sources of noise can help to generate noise maps that incorporate the concepts of geostatistics and proximity analysis to associate the relationships in the study area and can be applied to different sites. This can be achieved by means of clustering methods in future research to aid the detection of outliers in datasets; however, IDW interpolations in geostatistics are recommended to obtain noise maps in the meantime.
Environmental assets and activities follow Tobler’s First Law of Geography, which declares, “Everything is related to everything else, but near things are more related than distant things.” This law implies that observations that are positioned adjacent each other in space or time are more related than those farther apart [
45]. Many interpolation and approximation processes have been built to predict the quantities of spatial events in unsampled positions [
46]. Regardless, the process of spatial interpolation with a computer program involves converting discrete point data to obtain a continuous prediction. A noise map is an example of interpolation as it is a representation of the sound levels measured at a number of points to create surfaces for analysis.
Inverse distance weighted interpolation (IDW) is one of the easiest and most available methods recommended for noise mapping. It applies multiplier values to the data points so that the influence of any point decreases with distance (d), using the weighting function w(d) = 1/d
p, where the weight power “p” can typically be specified by the user and is set to 2 by default. IDW is simple to understand and implement; however, it cannot estimate the uncertainty of the interpolated values at unsampled locations. Therefore, it is essential to take accurate measurements of points to obtain the prediction that most closely matches the reality [
45].
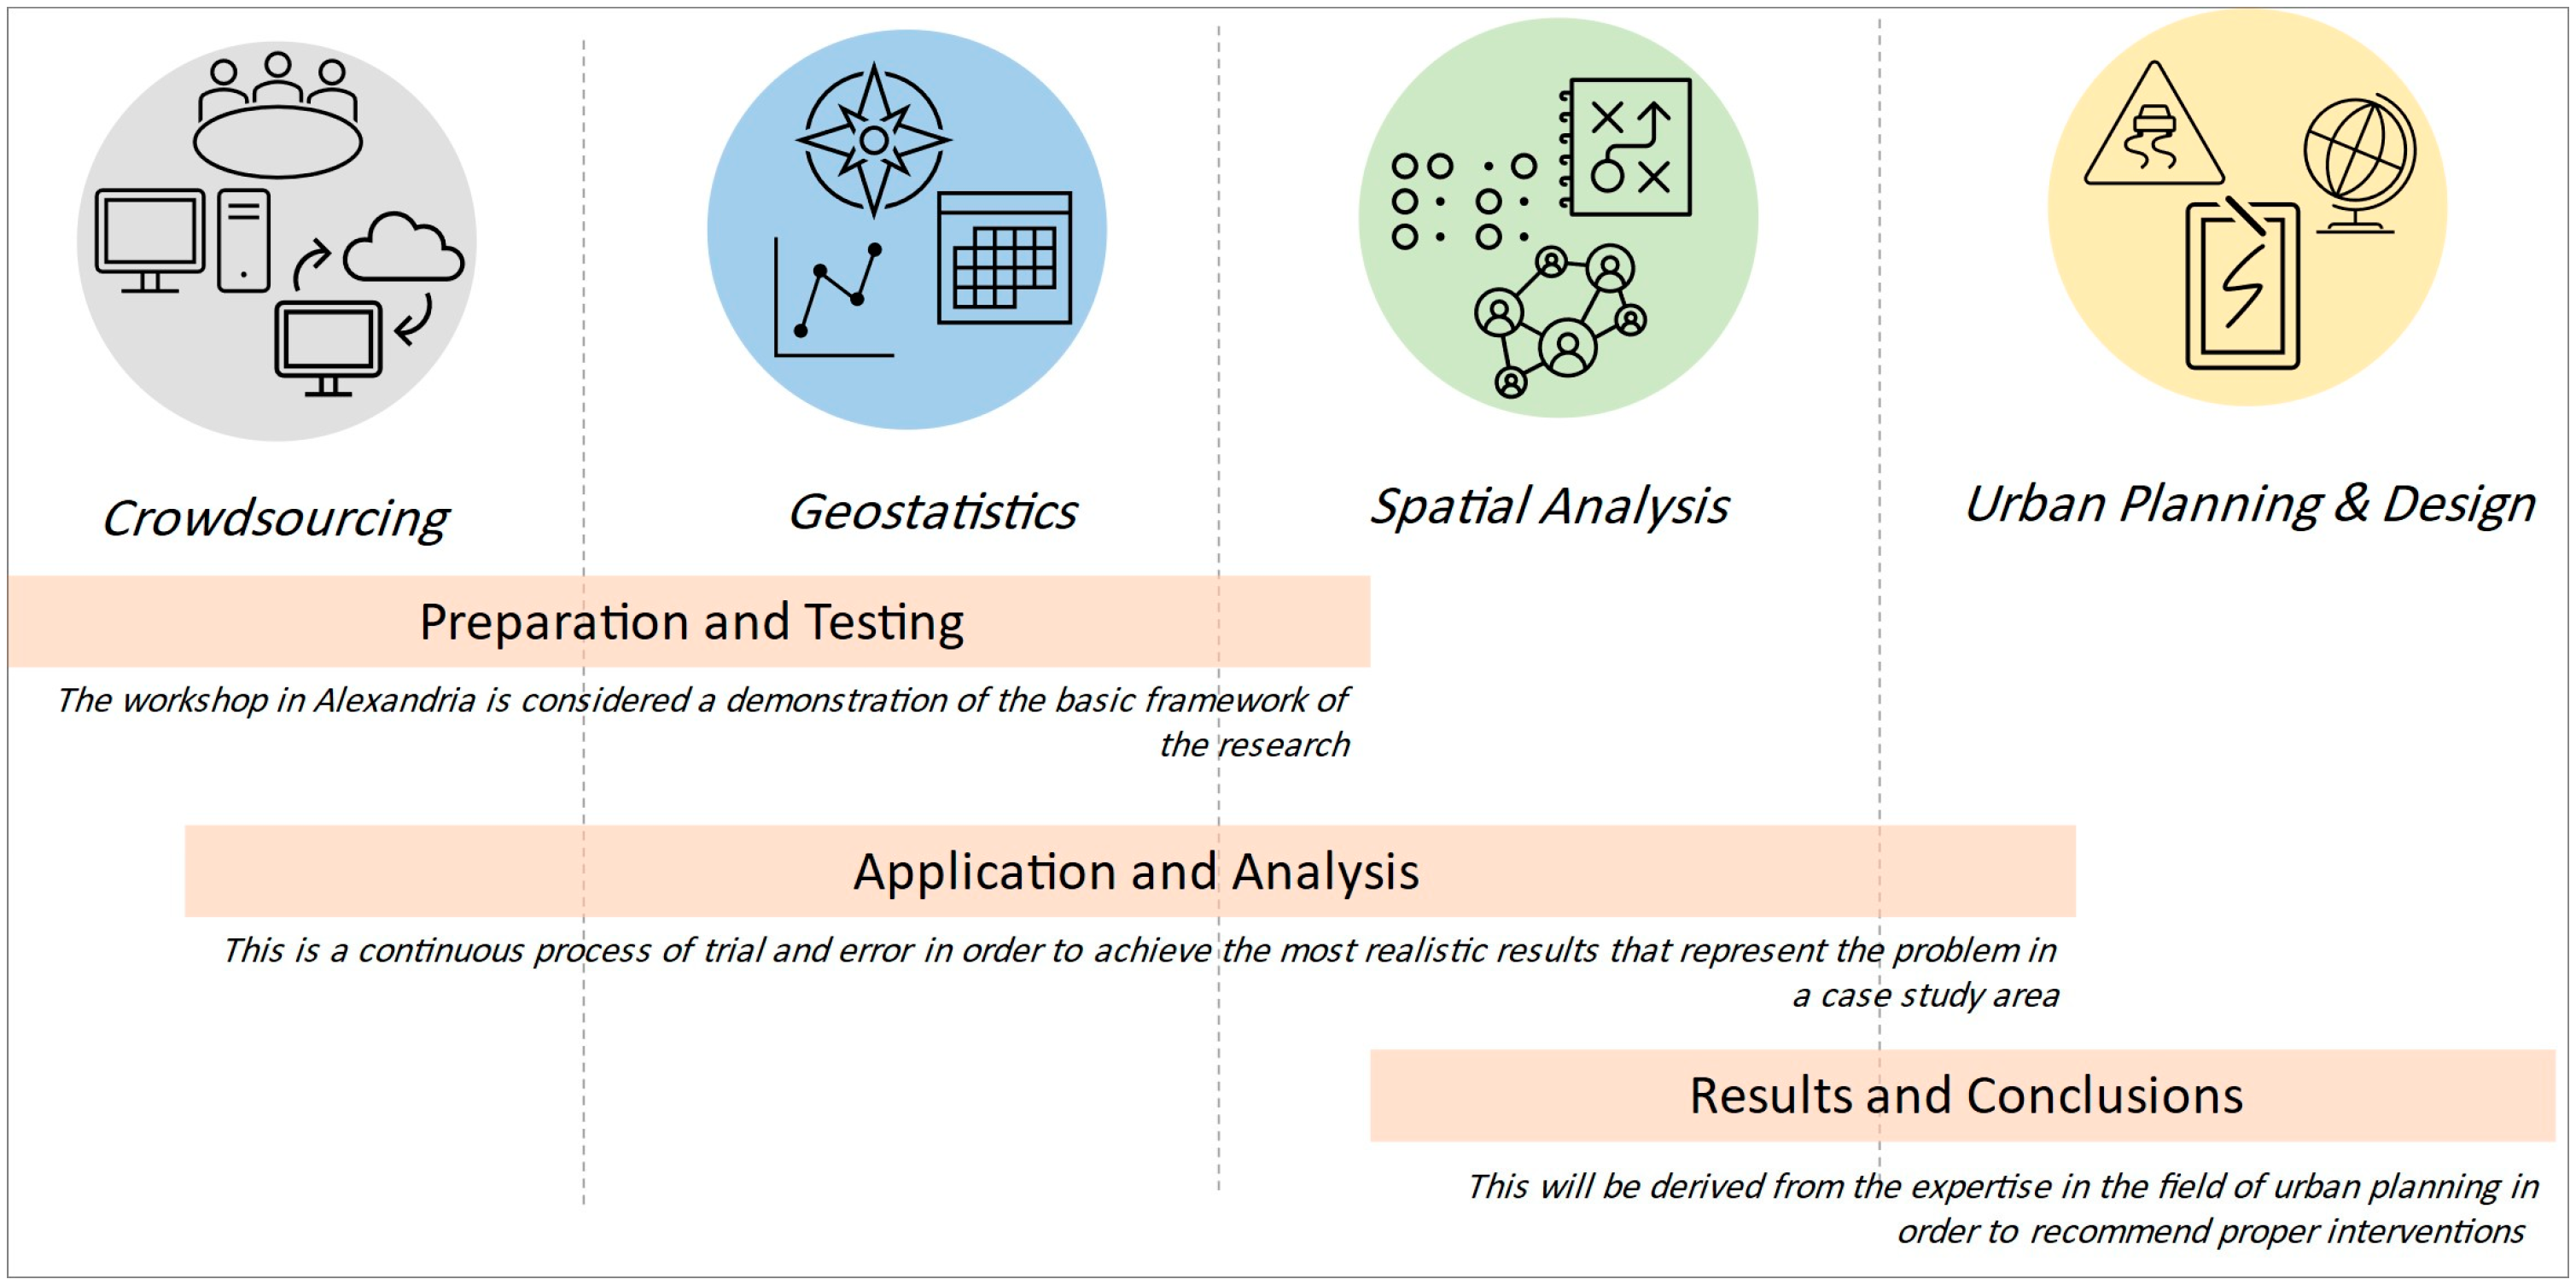
This methodology can be used to provide decision makers with a policy framework within which integrated noise measures can be identified and promoted across the government and society. Furthermore, the proposed noise reduction strategy can be linked to the United Nations Sustainable Development Goals mentioned previously [
47]. This methodology is summarized in the following workflow in
Figure 1.
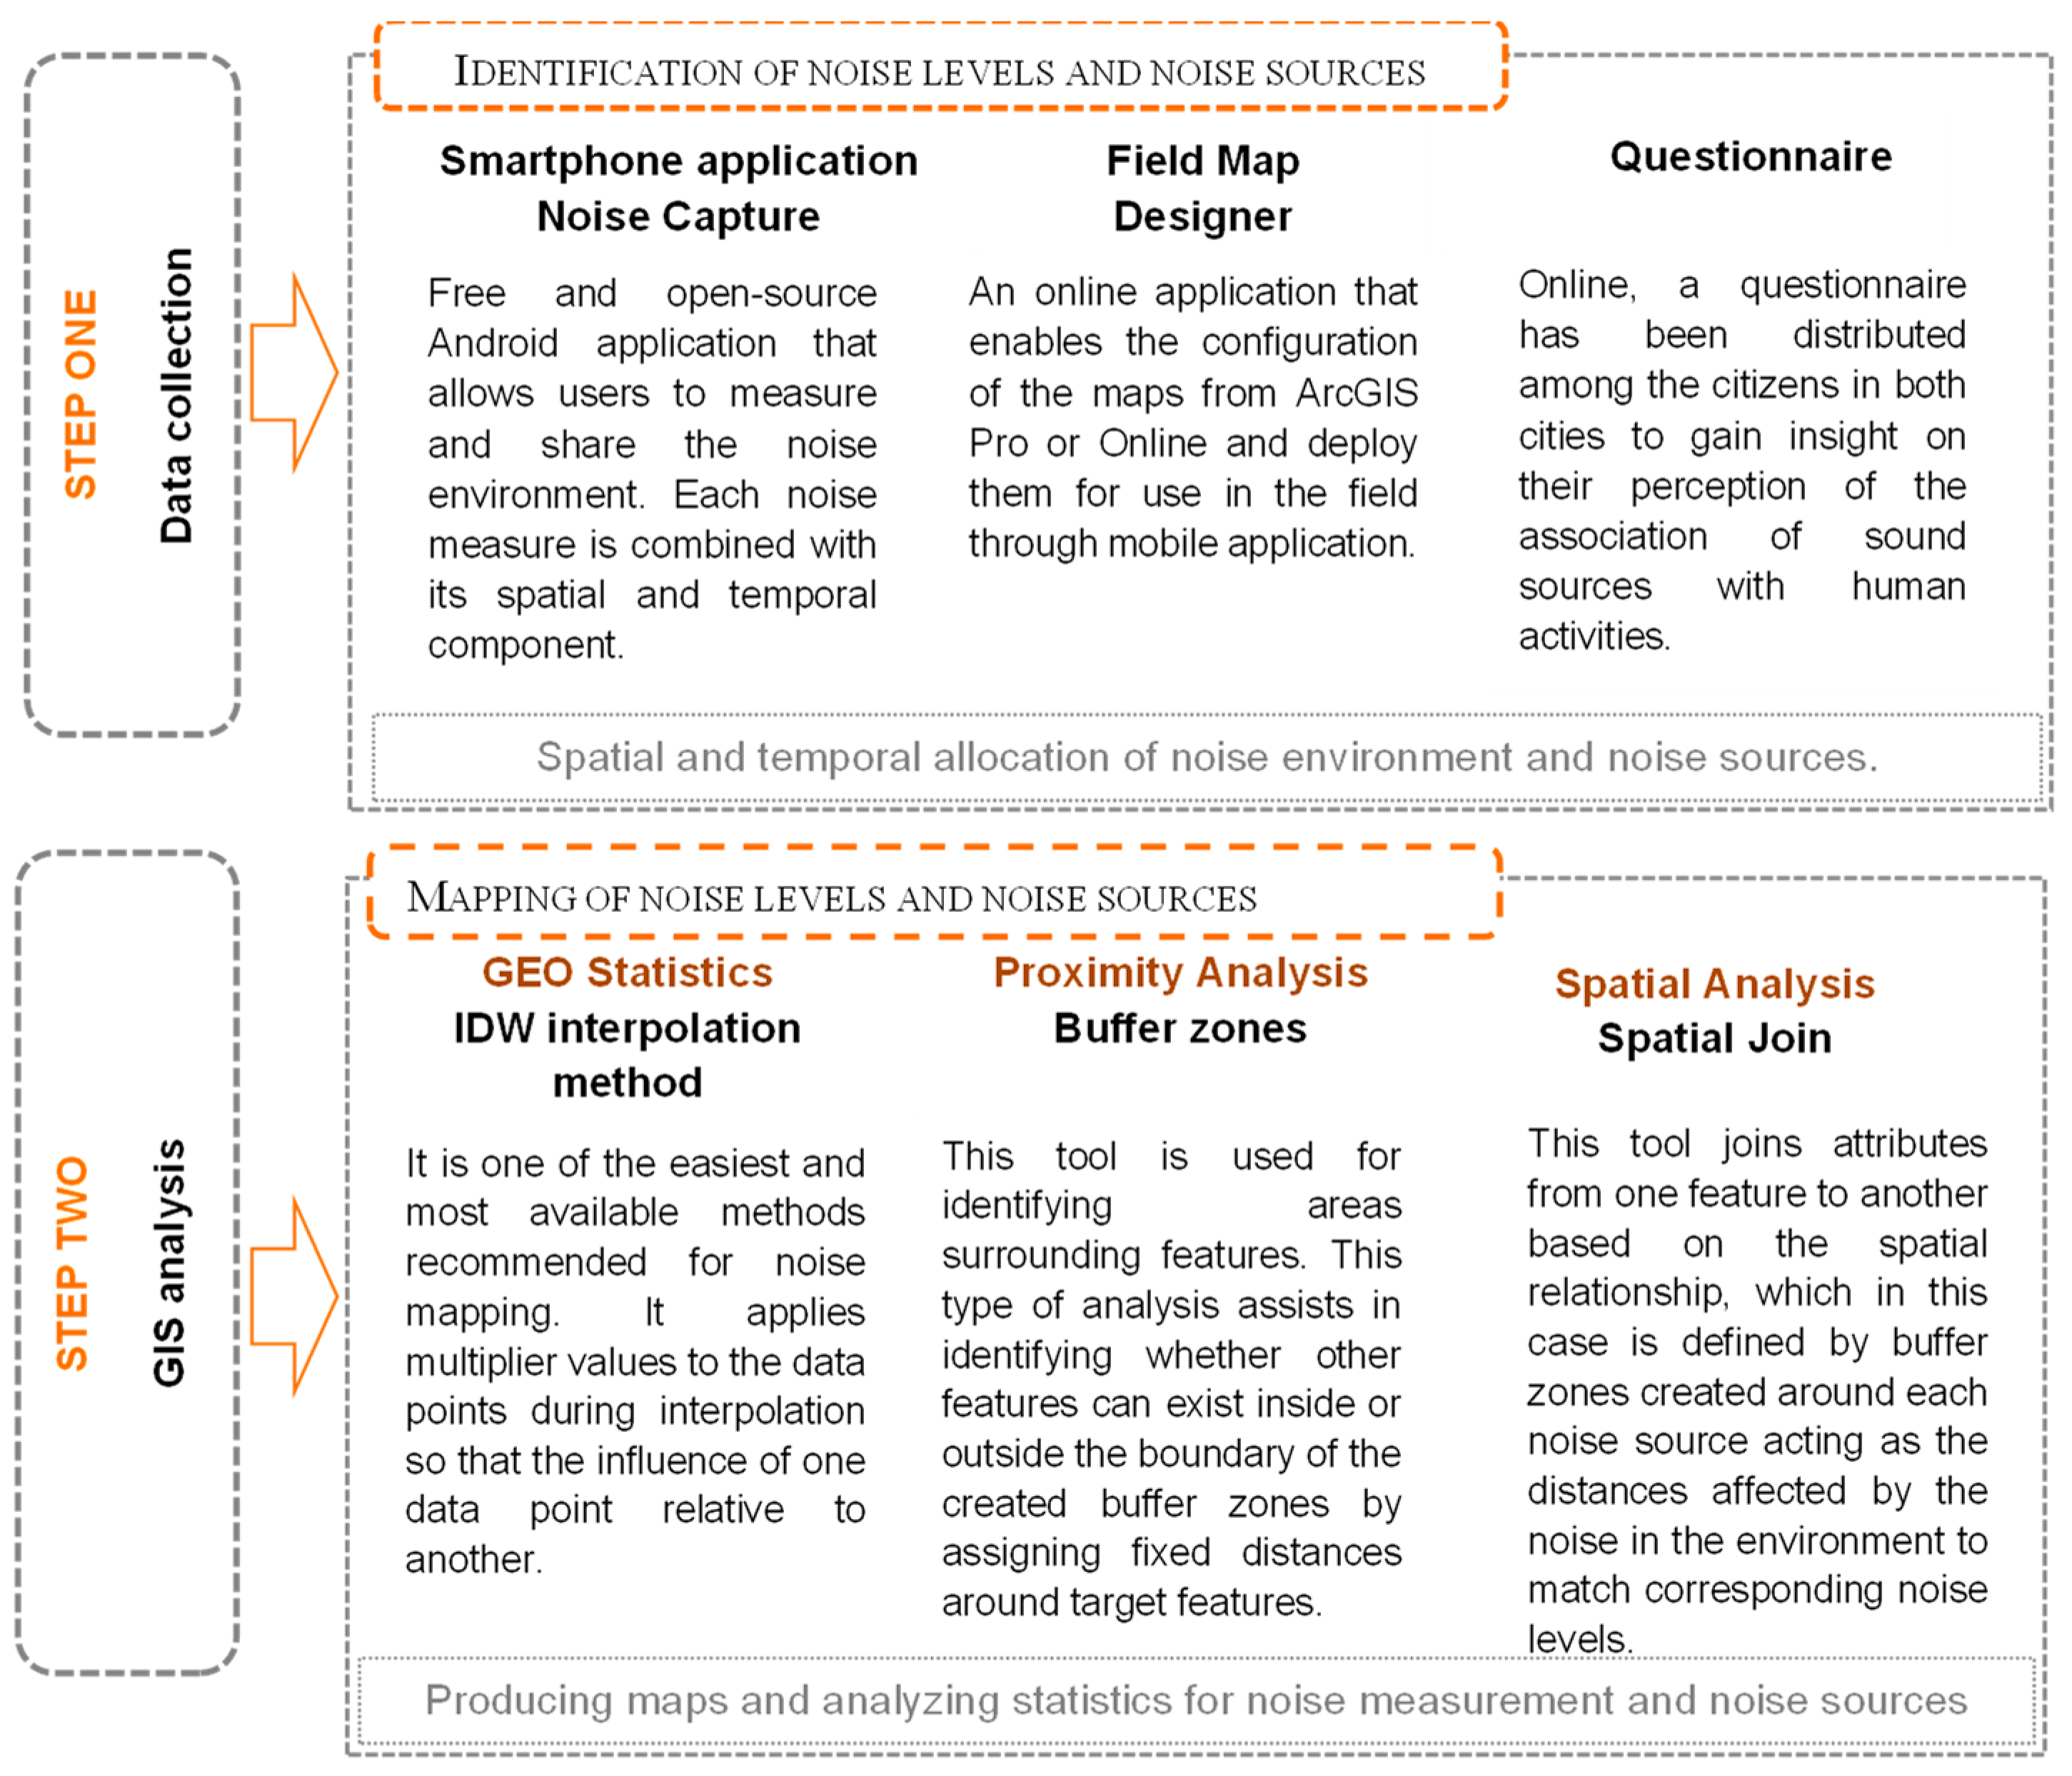
To fulfil the proposed framework, a set of tools is used to allow the process of data collection using crowdsourcing techniques to detect noise levels and noise sources related to the existing context. To continue the process, new approaches reinforced by GIS can be used to further develop the quality of noise maps [
21]. In this regard, the research workflow can be divided into two steps (
Figure 2). The first step is dedicated to data collection, through collecting existing noise levels in the study area, to determine the noise sources that are present in the measurement area and gather people’s opinions regarding the noise levels in their surroundings. Therefore, the first step can be named data collection. The goal of the second step is to generate noise maps based on field data collection, to incorporate the concepts of geostatistics and proximity analysis to identify the relationships between the noise levels and noise sources in the study area, and to summarize the situation with recommendations to improve the regulation of noise in the area.
4.1. Data Collection Using Noise Capture
The ongoing development of smartphone features and the production of useful applications enable the quick and simple building of spatial and temporal noise observations. An illustration of this is the Noise Capture application, developed within the “Noise-Planet” project. It is a free and open-source Android application that allows users to measure and share the noise environment. Each noise measure is combined with its spatial and temporal components so that the result can be displayed in an interactive map within the application [
20].
Upon installation, all users are required to allow access to the device’s memory, microphone, camera, and location. These are essential for the proper utilization of the application. After manually starting the measurement, an acoustic measurement takes place every second. Along with the measurement data, other details, such as the date and time, the GNSS location, and the accuracy and speed of each measurement point, are also recorded. The location of the user is given in WGS84. Once the measurement is marked as valid, it is saved within the device memory and can be accessed through the results page. Each measurement can be shared in JSON format. If the user has given his consent, the anonymous data are also transferred to a remote server, controlled, and then integrated into an open database, which is available for free [
20].
4.2. Public Input Regarding Noise Pollution
The need for public information is important to track the public’s behaviors, experiences, needs, and preferences. The use of questionnaires for these purposes has increased dramatically in recent years [
48]. Therefore, an online form was established and distributed to the public to gain insights into their observations of the noise disturbances. Participants were gathered from the study areas and via social networks. Questionnaires usually collect responses that are generally straightforward to present or analyze. The questionnaire conducted in this research contained a mixture of the three forms. It contained 30 questions inquiring about general information, opinions, and comparisons using multiple choice or numeric criteria.
4.3. Building a Noise Source Database
In order to gain insights into the various noise sources that people in urban areas are exposed to, a customized list was developed of the most common sound sources found in the urban landscape and assigned to each detected measurement for our specific purposes. The research utilized Field Maps Designer, an online application within the ESRI community that enables the configuration of the maps from ArcGIS Pro or Online and deploys them for use on the field through the Field Maps mobile application [
49]. In this case, a point layer was created with 25 possible noise sources. The mentioned layer was used in the Field Maps mobile application, which allows the capturing of data, taking of notes, and sharing of information in real time within an organization. A list of noise sources is given in
Table 1.
4.4. GEO Statistics: Classification and Interpolation
After collecting the noise sources and noise level measurements, the data are imported to be analyzed in a GIS environment. One of the main steps that is required to perform further analysis is to agree on a classification scheme that can be applied to the noise levels.
Table 2 displays the developed natural breaks classification. The values are influenced by the minimum and maximum values that include the extent of values in the study area. These colors are also adopted for the interpolation maps in the next part of the application.
Interpolation is important for local analysis in GIS. In this research, the inverse distance weighted (IDW) method is examined for the production of noise maps. Interpolation techniques are based on the principles of geostatistics and spatial autocorrelation, proposing that close objects are more similar than objects that are far apart. By this means, areas can be predicted based on points. The research performed other types of interpolation, such as spline, regularized, and tension, before deciding on IDW interpolation as the ideal method to present noise data accurately.
4.5. Proximity and Spatial Analysis: Association of Noise Sources with Different Noise Levels
It is proposed by this research that the association of noise sources with the detected noise levels can address specific problems that can be introduced into urban action plans. This association is a result of several steps. First, after classifying the noise thresholds, based on the experiment, a buffer distance of 10 m around each noise source is proposed as the average distance at which the noise can be heard. Consequently, the second step includes the spatial analysis tool: spatial joining is used to associate each noise source with the noise level measurements within this buffer. In this way, the detected noise sources can be connected with the detected noise levels, which can be further analyzed for better urban planning processes and to enhance noise mitigation and management.
5. Application Phase
This research applies the proposed methodology to assess the noise levels in the city through a framework that enables a comparative scheme between two cities that are subject to different regulations and morphologies, urban schedules, and legislation. The cities chosen for the comparison are Alexandria, Egypt and Zagreb, Croatia, since they share many similarities, especially when comparing their downtown areas. The differences between the cities’ agglomerations, populations, morphologies, and other characteristics are also taken into consideration when analyzing the noise sources and measuring their levels in both case study areas.
5.1. Case Study Area Definition
Firstly, Alexandria is the second-largest city in Egypt after Cairo. Alexandria’s urban development is influenced by the proximity of the Mediterranean Sea in the north. Alexandria is not pedestrian-friendly; however, near the downtown region, many trips are encouraged on foot. Additionally, street vendors occupying public spaces frequently conflict with the transport system. The goal of the strategic plan named Alexandria 2030 is to become more responsive to local needs, communicate with stakeholders, and implement projects [
50].
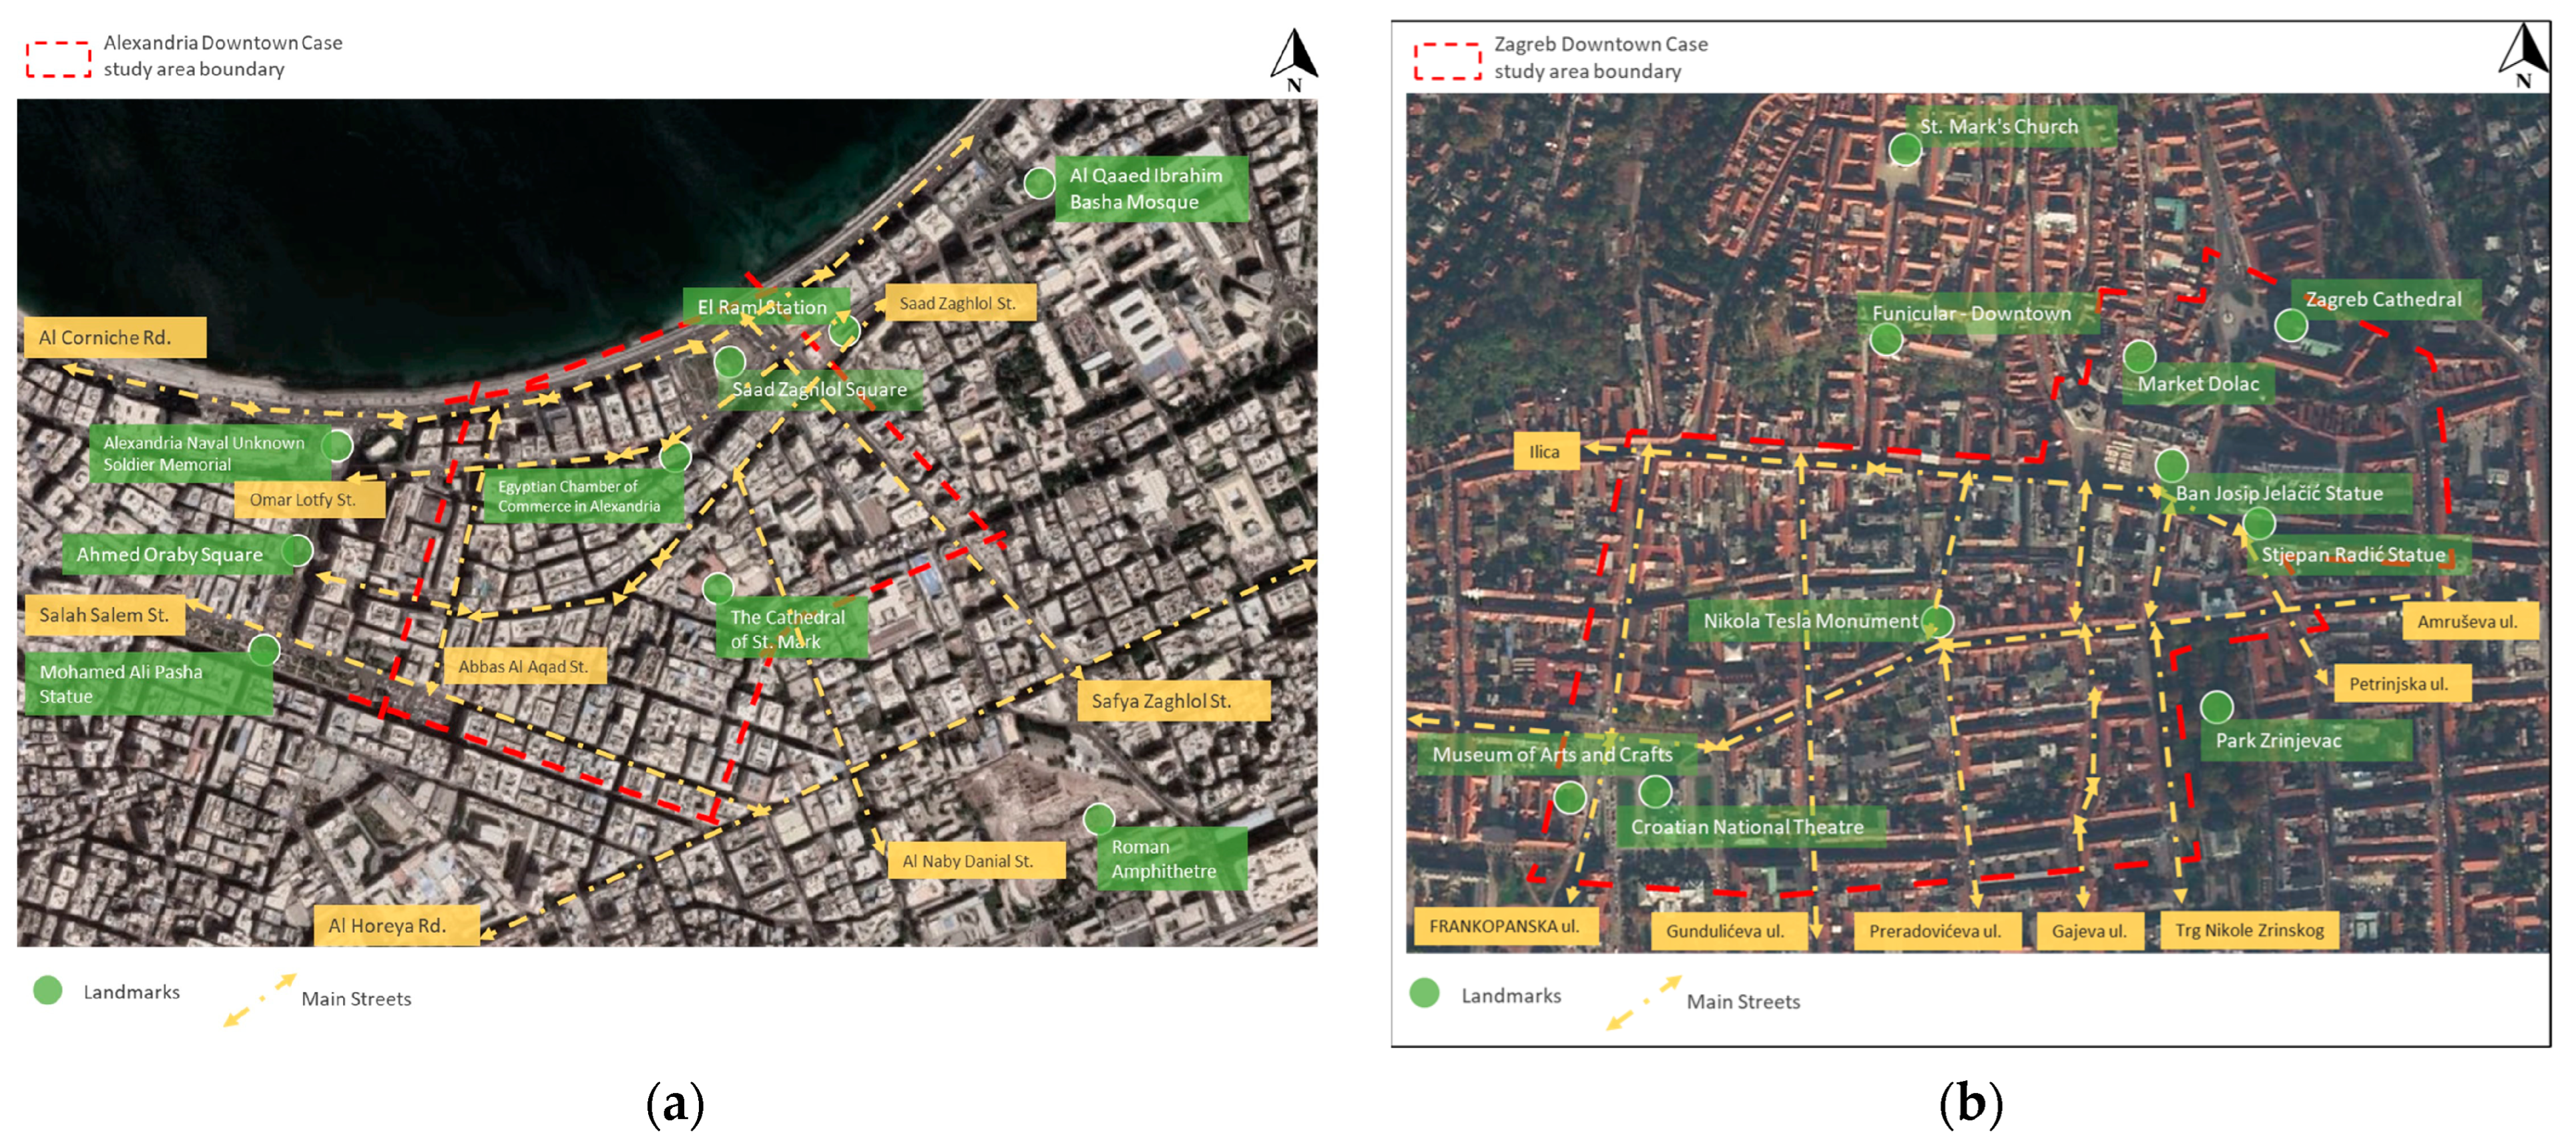
The proposed case study area in Alexandria corresponds to 0.35 km
2 in Ramleh Station District contained by Saad Zaghloul Street between Omar Lotfy Street and Salah Salem Street. The area is known for Saad Zaghloul’s square, with his statue facing the sea. As shown in the following figure, Saad Zaghloul Street intersects with Safeya Zaghloul and Al Nabi Daniel Street, two of the main commercial streets in Alexandria. Nowadays, the high population density, commercial activities, and intense vehicular traffic disturb pedestrian movement in the area. Moreover, there are many parking areas in public spaces in the area because a large number of visitors reach the area by private cars or vehicular public transport [
51]. The area also contains important landmarks such as Le Metropole Hotel and Trianon, one of the oldest coffee shops in Alexandria, in addition to the Egyptian Chamber of Commerce overlooking the main bus station in the zone.
Secondly, Zagreb is the largest city in Croatia and its capital. Zagreb’s urban development is closely related to the proximity of the Medvednica Mountain in the north and the Sava River in the south. Noise pollution, particularly road traffic noise, is one of the main issues that impacts the quality of life in Zagreb [
52].
The proposed case study area in Zagreb corresponds to 0.48 km
2. This area is a part of the historical district of the city, which can be also experienced on foot. To the north of the area, St. Mark’s Church exists in the part known as the upper town (Gornji Grad), where it is the focal point of St. Mark’s Square. On the opposite side of the square, to its east, is Zagreb Cathedral. Below the upper town, Ban Jelačić Square is located south of the Dolac Market on the intersection of several streets, with tram stations that are usually busy. To the southwest of the area, the Croatian National Theatre and the Museum of Arts and Crafts are among the main attractions in Zagreb. It is important to note that the urban fabric in Alexandria is denser than in Zagreb, where Zagreb’s urban fabric utilizes the superblock, which is larger than the traditional grid iron blocks in Alexandria. This difference results in more courtyards in Zagreb than in Alexandria. This validates the difference in the case studies’ areas, where they are more likely to be compared according to their components and their unique role in the entire city. It is also crucial to note that the research is concerned with accessible open spaces such as streets and public squares. In
Figure 3, some landmarks in both areas are displayed, as well as their main streets.
5.2. Legislation Similarities and Differences
In Egypt, the current environmental legislative framework was established under Law No. 4 of 1994, as amended in 2005 and 2009, and Law No. 102 of 1983 (on Natural Protected Areas), according to the Egypt Human Development Report 2021. At the same time, environmental policy in Egypt is formulated and implemented by many national institutions, including the Ministry of Environment, the Environmental Affairs Agency, the Ministry of Health and Population, and others. Article 42 of Law No. 4 of 1994 states that all organizations and individuals must keep the volume below the permissible sound intensity levels or fines will be applied in case of violations upon inspections or due to reports, according to Article 87 of the same rule. Furthermore, the maximum permissible limits for noise intensity in the different areas of cities are determined as shown in
Table 3 [
53]. The international laws advised by the WHO are sometimes applied in Egypt when the law does not specify regulations, such as in the cases of squares and highways.
Since the Republic of Croatia is part of the European Union, regulations in the country are aligned with the aforementioned Directive 2002/49/EC of the European Parliament and the Council of 25 June 2002, on the assessment and management of environmental noise [
8]. The Law on Noise Protection (Official Gazette 30/09, 55/13, 153/13, 41/16, 114/18, and 14/21) [
54] determines measures to protect against noise on land, water, and in the air, as well as the supervision of the implementation of these measures to prevent or reduce noise and eliminate hazards to people’s health. According to the law, regulations in the Republic of Croatia prescribe the highest allowed noise levels in working and residential areas to improve the situation in areas of high noise exposure, together with the protection of quiet areas. To summarize, as seen in
Table 3 and
Table 4, it is concluded that the maximum permissible level of noise in an open space in Alexandria’s downtown region and Zagreb’s city center is 65 dB.
5.3. Practical Development
The field survey in Alexandria took place on 3 March 2023. A total number of 8155 measurements were collected in four hours (from 13:00 to 17:00), covering approximately 0.35 km2. In total, 16 different noise sources were detected. Measurements in Zagreb, Croatia were collected on 12 April 2023. A total number of 9220 measurements were collected in a timespan of four hours (from 13:00 to 17:00). The case study area in Zagreb corresponded to 0.48 km2. In total, 16 different noise sources were detected; however, they were not exactly the same as the ones in Alexandria. A further analysis of the results will be provided.
For this type of measurement application, it is very important to note the reliability and quality of the device used, i.e., its sensors. In order to avoid any possible posterior calibration of the acoustic data—for example, based on hardware-related information—for the purpose of this study, the same device was used for the measurements collected at both sites: a Redmi 7 Android mobile phone. Before starting the activity, the device needed to be calibrated. In this measurement campaign, the calibration was performed by cross-calibration between two devices. During the measurement campaign, several aspects were considered.
The duration of one measurement session should be around 10–15 min. This is to avoid losing the collected data due to, for example, a phone call, loss of GNSS connection, low battery, etc.
A constant, natural walking speed should be maintained during track recording. It was necessary not to walk too fast, run, or cycle with the intention of saving time, since this can give false noise levels.
The phone should be held in front of the person, pointing “away”, with as little movement and shaking as possible, to gain the best possible results.
If possible, in narrow streets, it was necessary to walk at the center of the street to improve the signal, i.e., the accuracy of localization.
During the measurement process, several challenges were encountered. One significant obstacle was the strength of the GNSS signal, which notably diminished, particularly in the narrow and densely packed streets of Downtown Alexandria. This attenuation can be attributed to the presence of high buildings and constrained streets, which obstructed proper GNSS signal reception. Additionally, the collection of measurements was impacted by adverse weather conditions, particularly rain. Consequently, the repetition of the measurements on the following day was carried out to ensure accurate and reliable data collection.
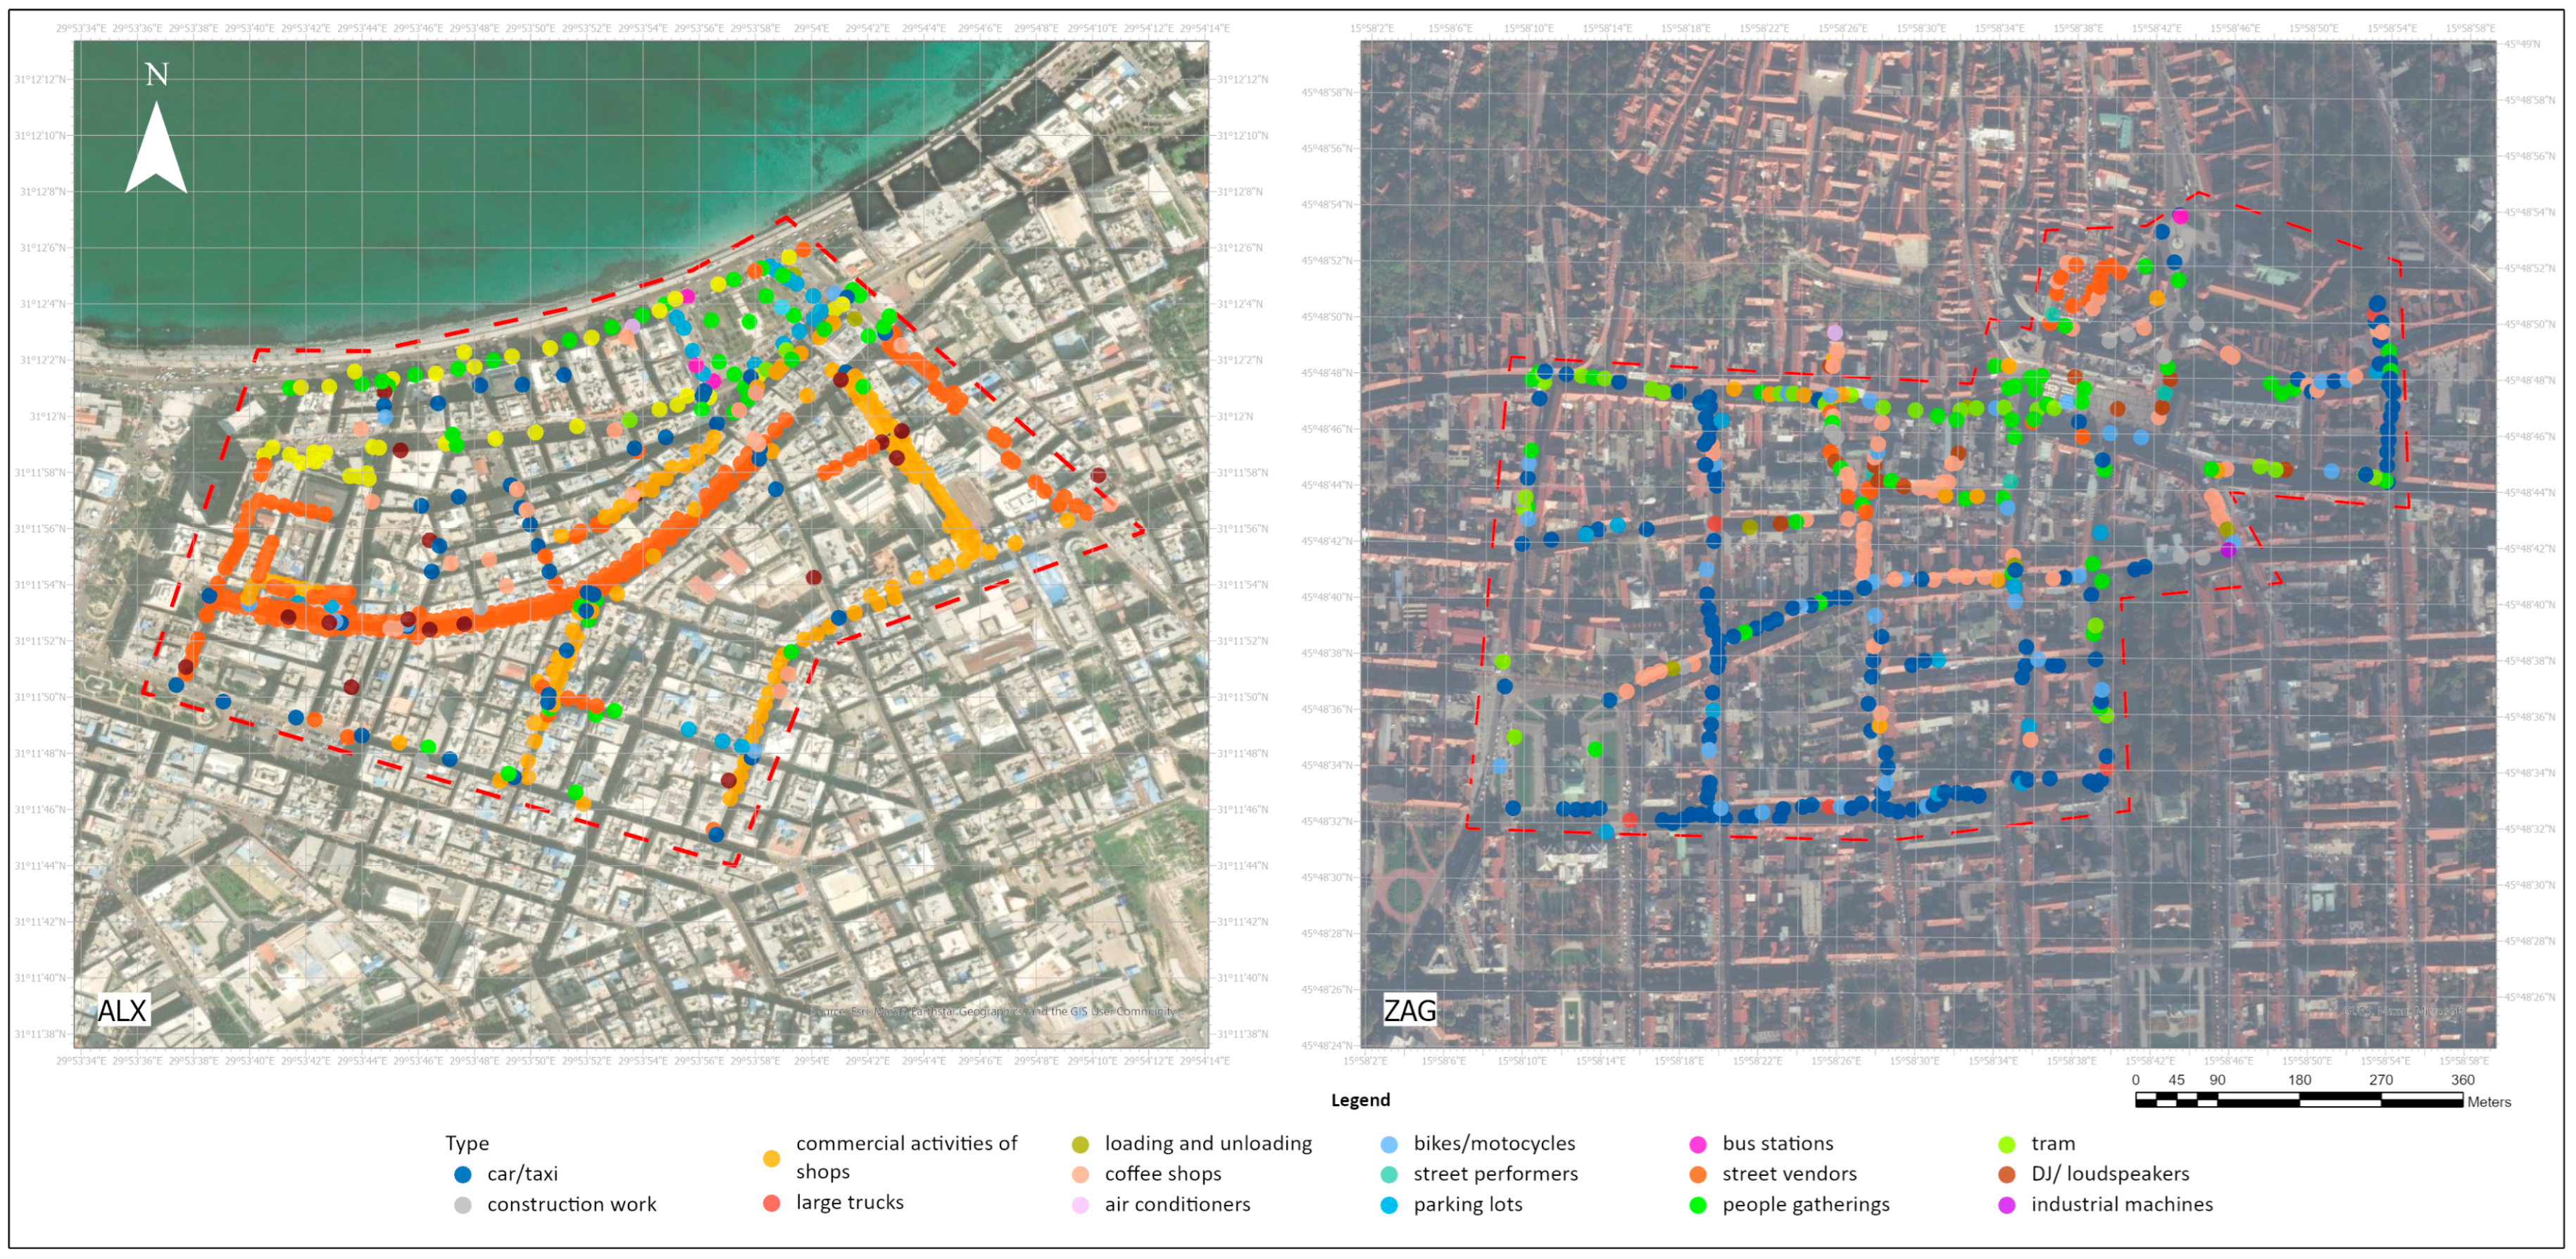
The measurement campaign required a team of two individuals to carry out data collection. One person utilized the Noise Capture application on a Redmi 7 mobile phone to capture noise levels, while, simultaneously, the second person identified various sound sources and recorded them using a different device with the Field Maps application. The data recorded through Field Maps were automatically saved in the ArcGIS database, making them instantly accessible on the platform. The detected noise sources for both cities are demonstrated in
Figure 4.
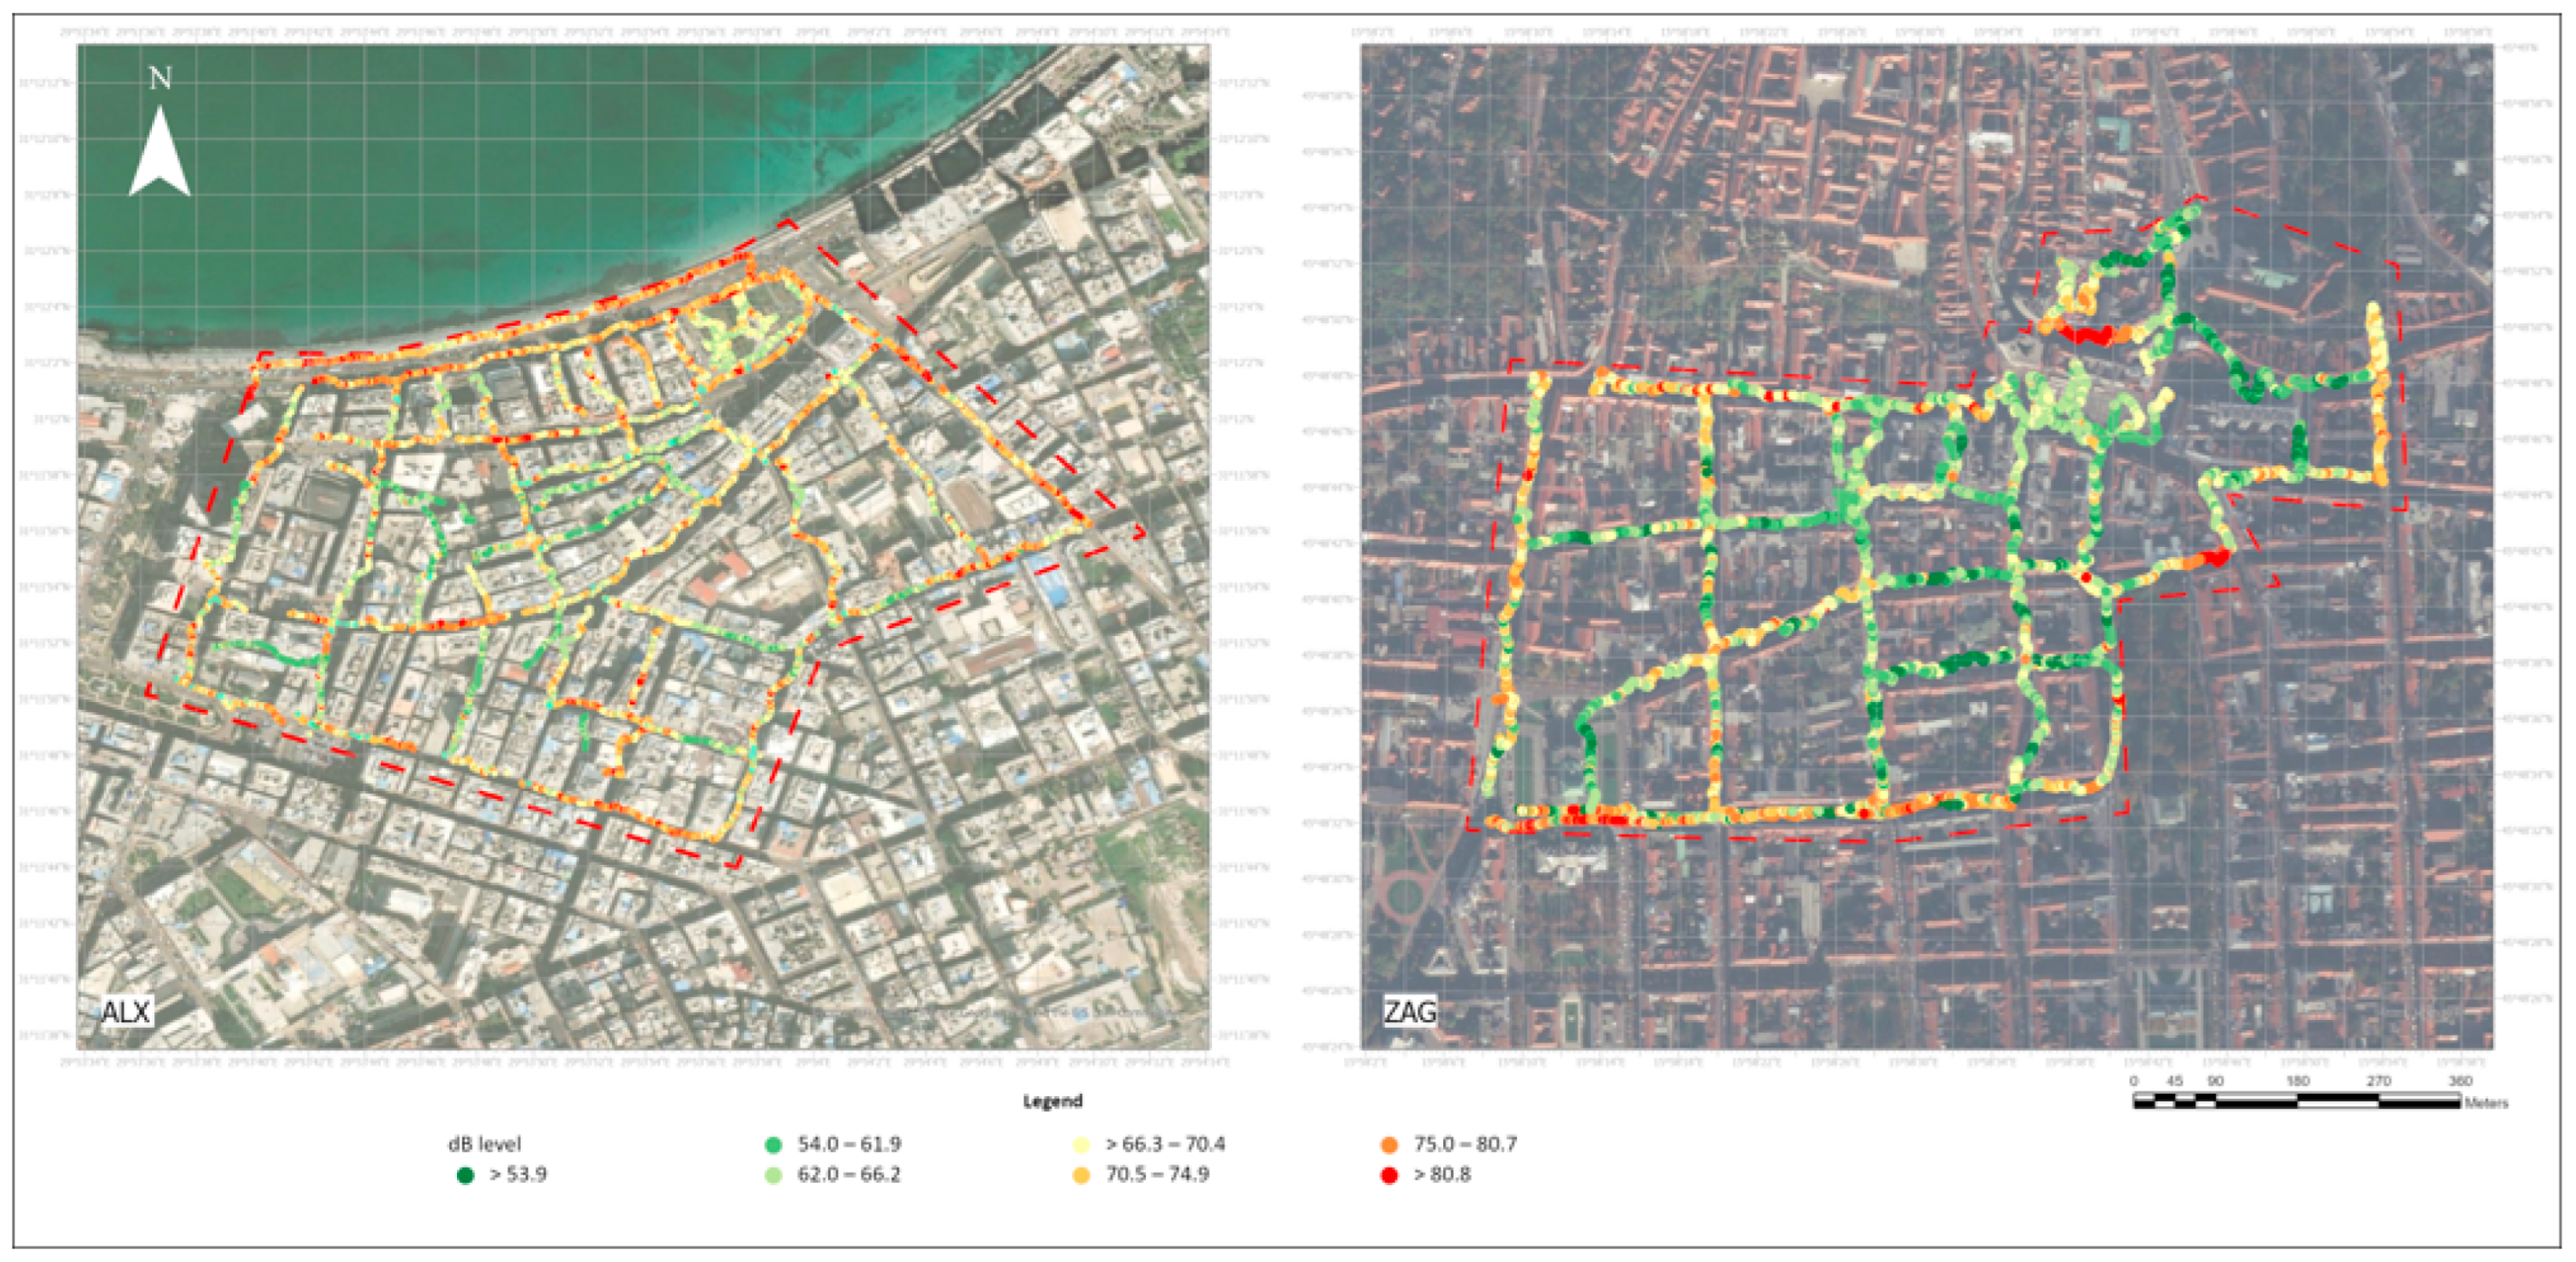
After collecting the noise sources and noise level measurements, the data were imported to be analyzed in the GIS environment. Each noise level measurement was shared in JSON format and uploaded in the ArcGIS Pro 3.0.2 software. Measurements were classified according to the natural breaks classification (
Figure 5).
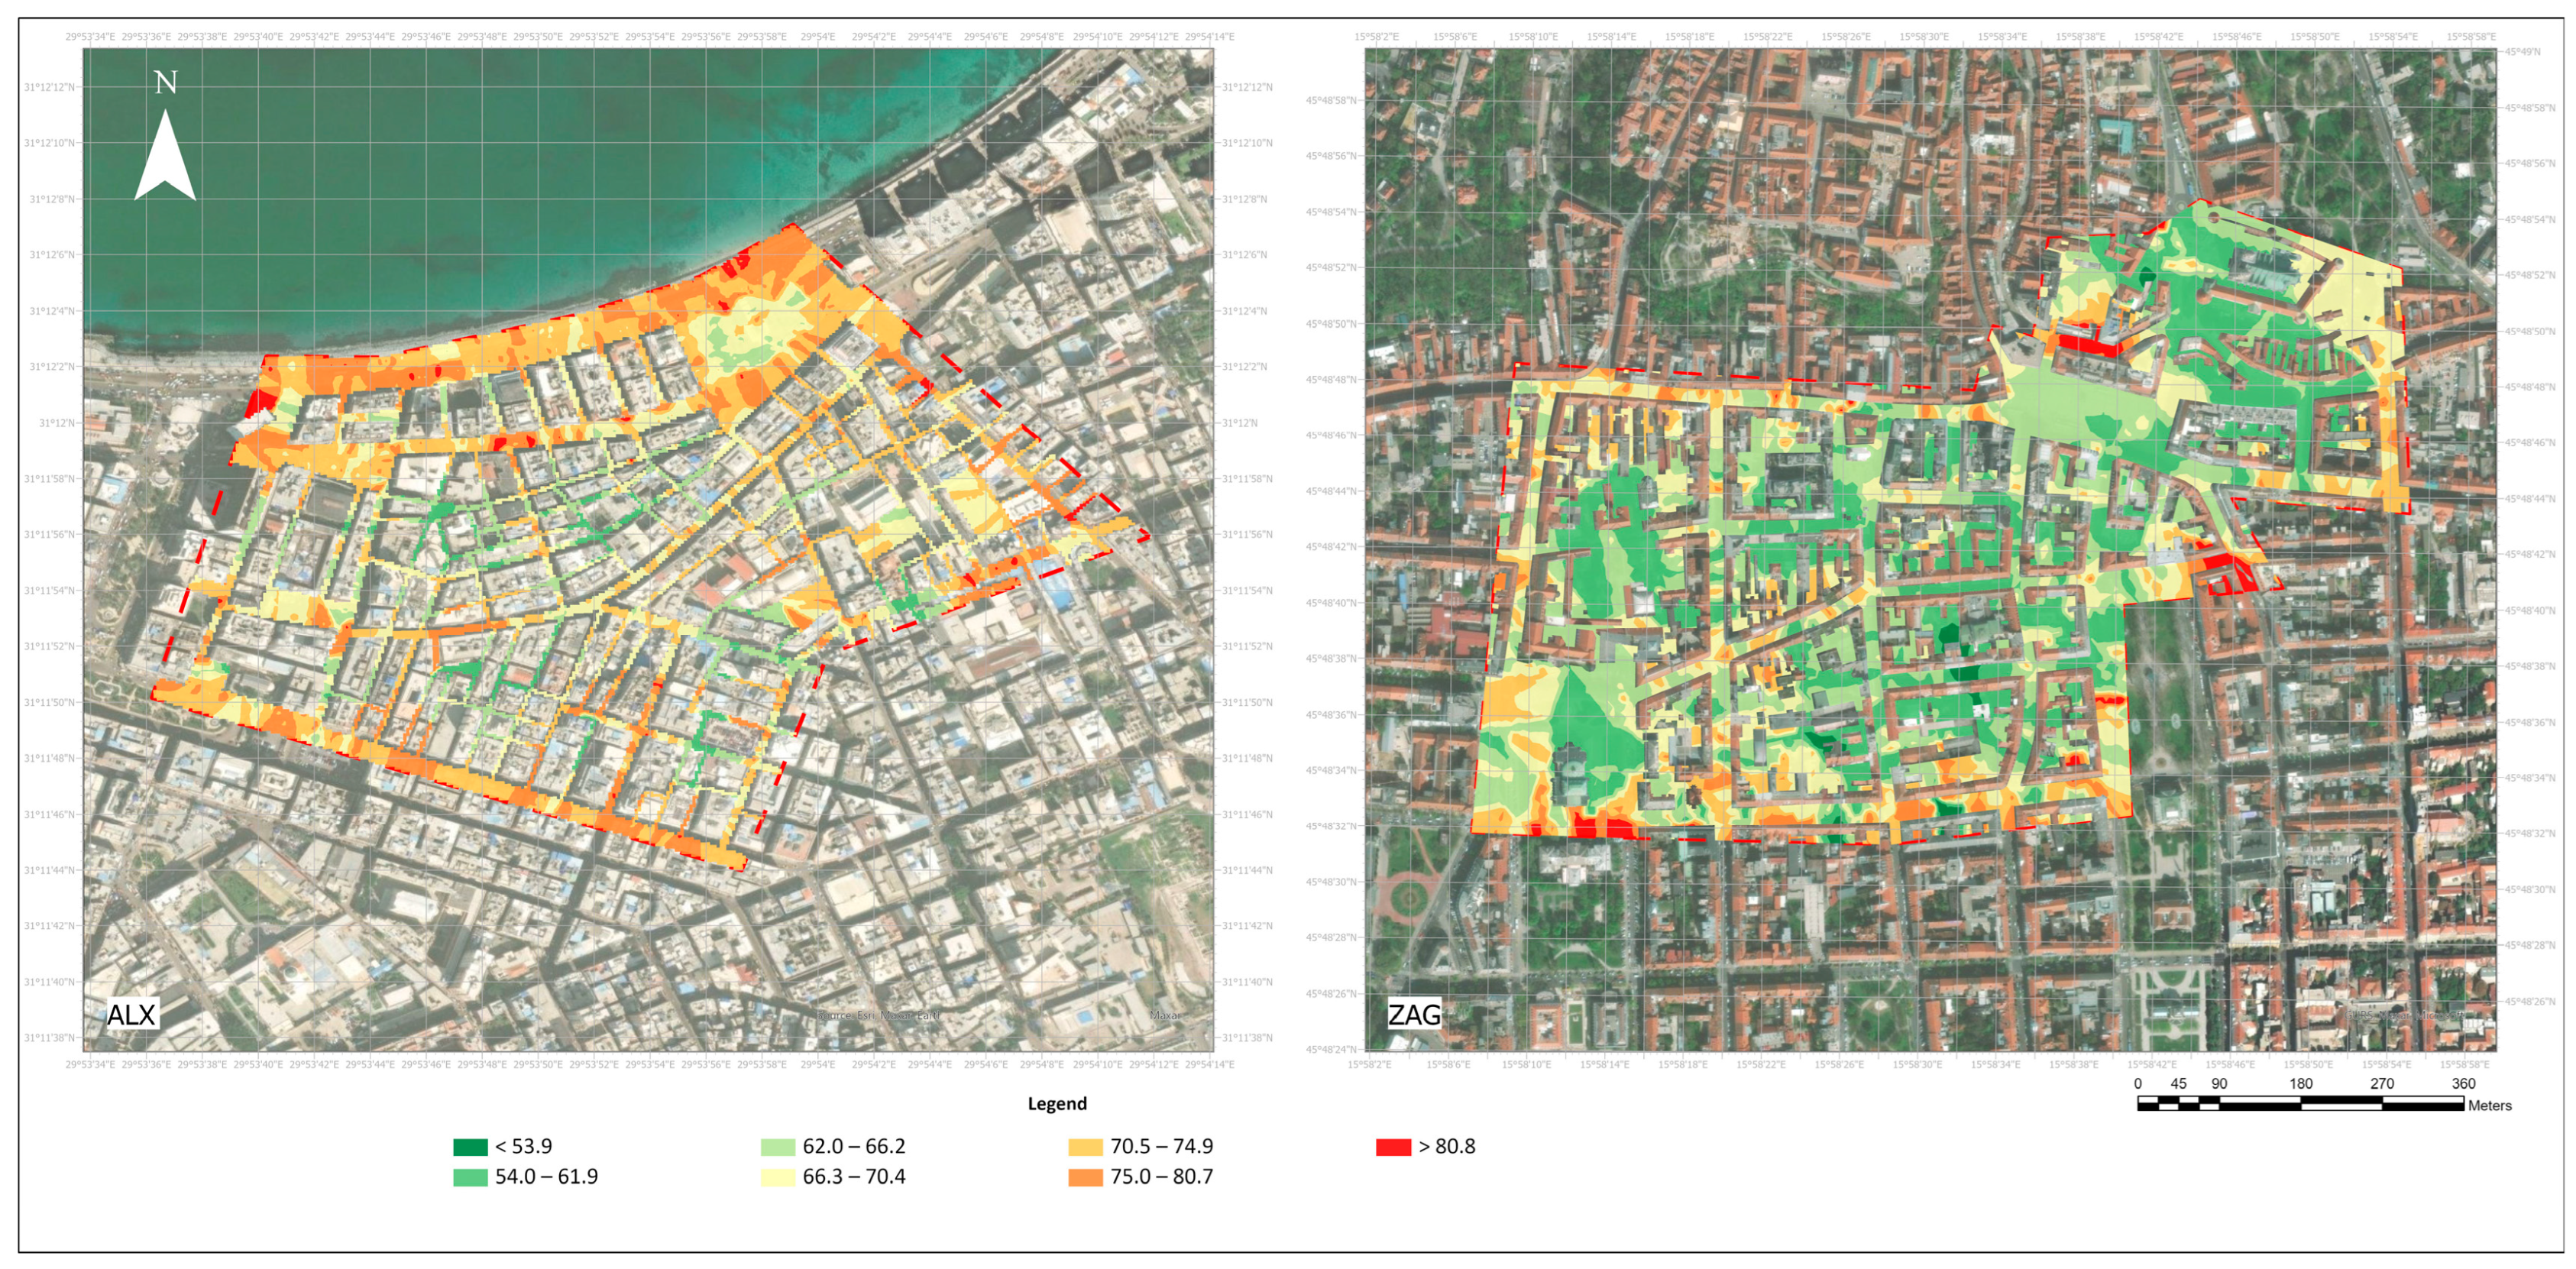
Corresponding to the previously proposed classification scheme in
Table 2, the following interpolation maps were produced to represent the noise level measurements. The research excluded buildings from the interpolation area to gain better insights into the results. For Alexandria’s downtown area, a building layer from OpenStreetMap (OSM) was used. In Zagreb, an OSM layer was not sufficient; therefore, an EUBUCCO layer was downloaded from [
55] and used in the analysis. The interpolation of measurements at both sites can be seen in
Figure 6.
6. Results
6.1. Association of Noise Sources with Noise Level Measurements
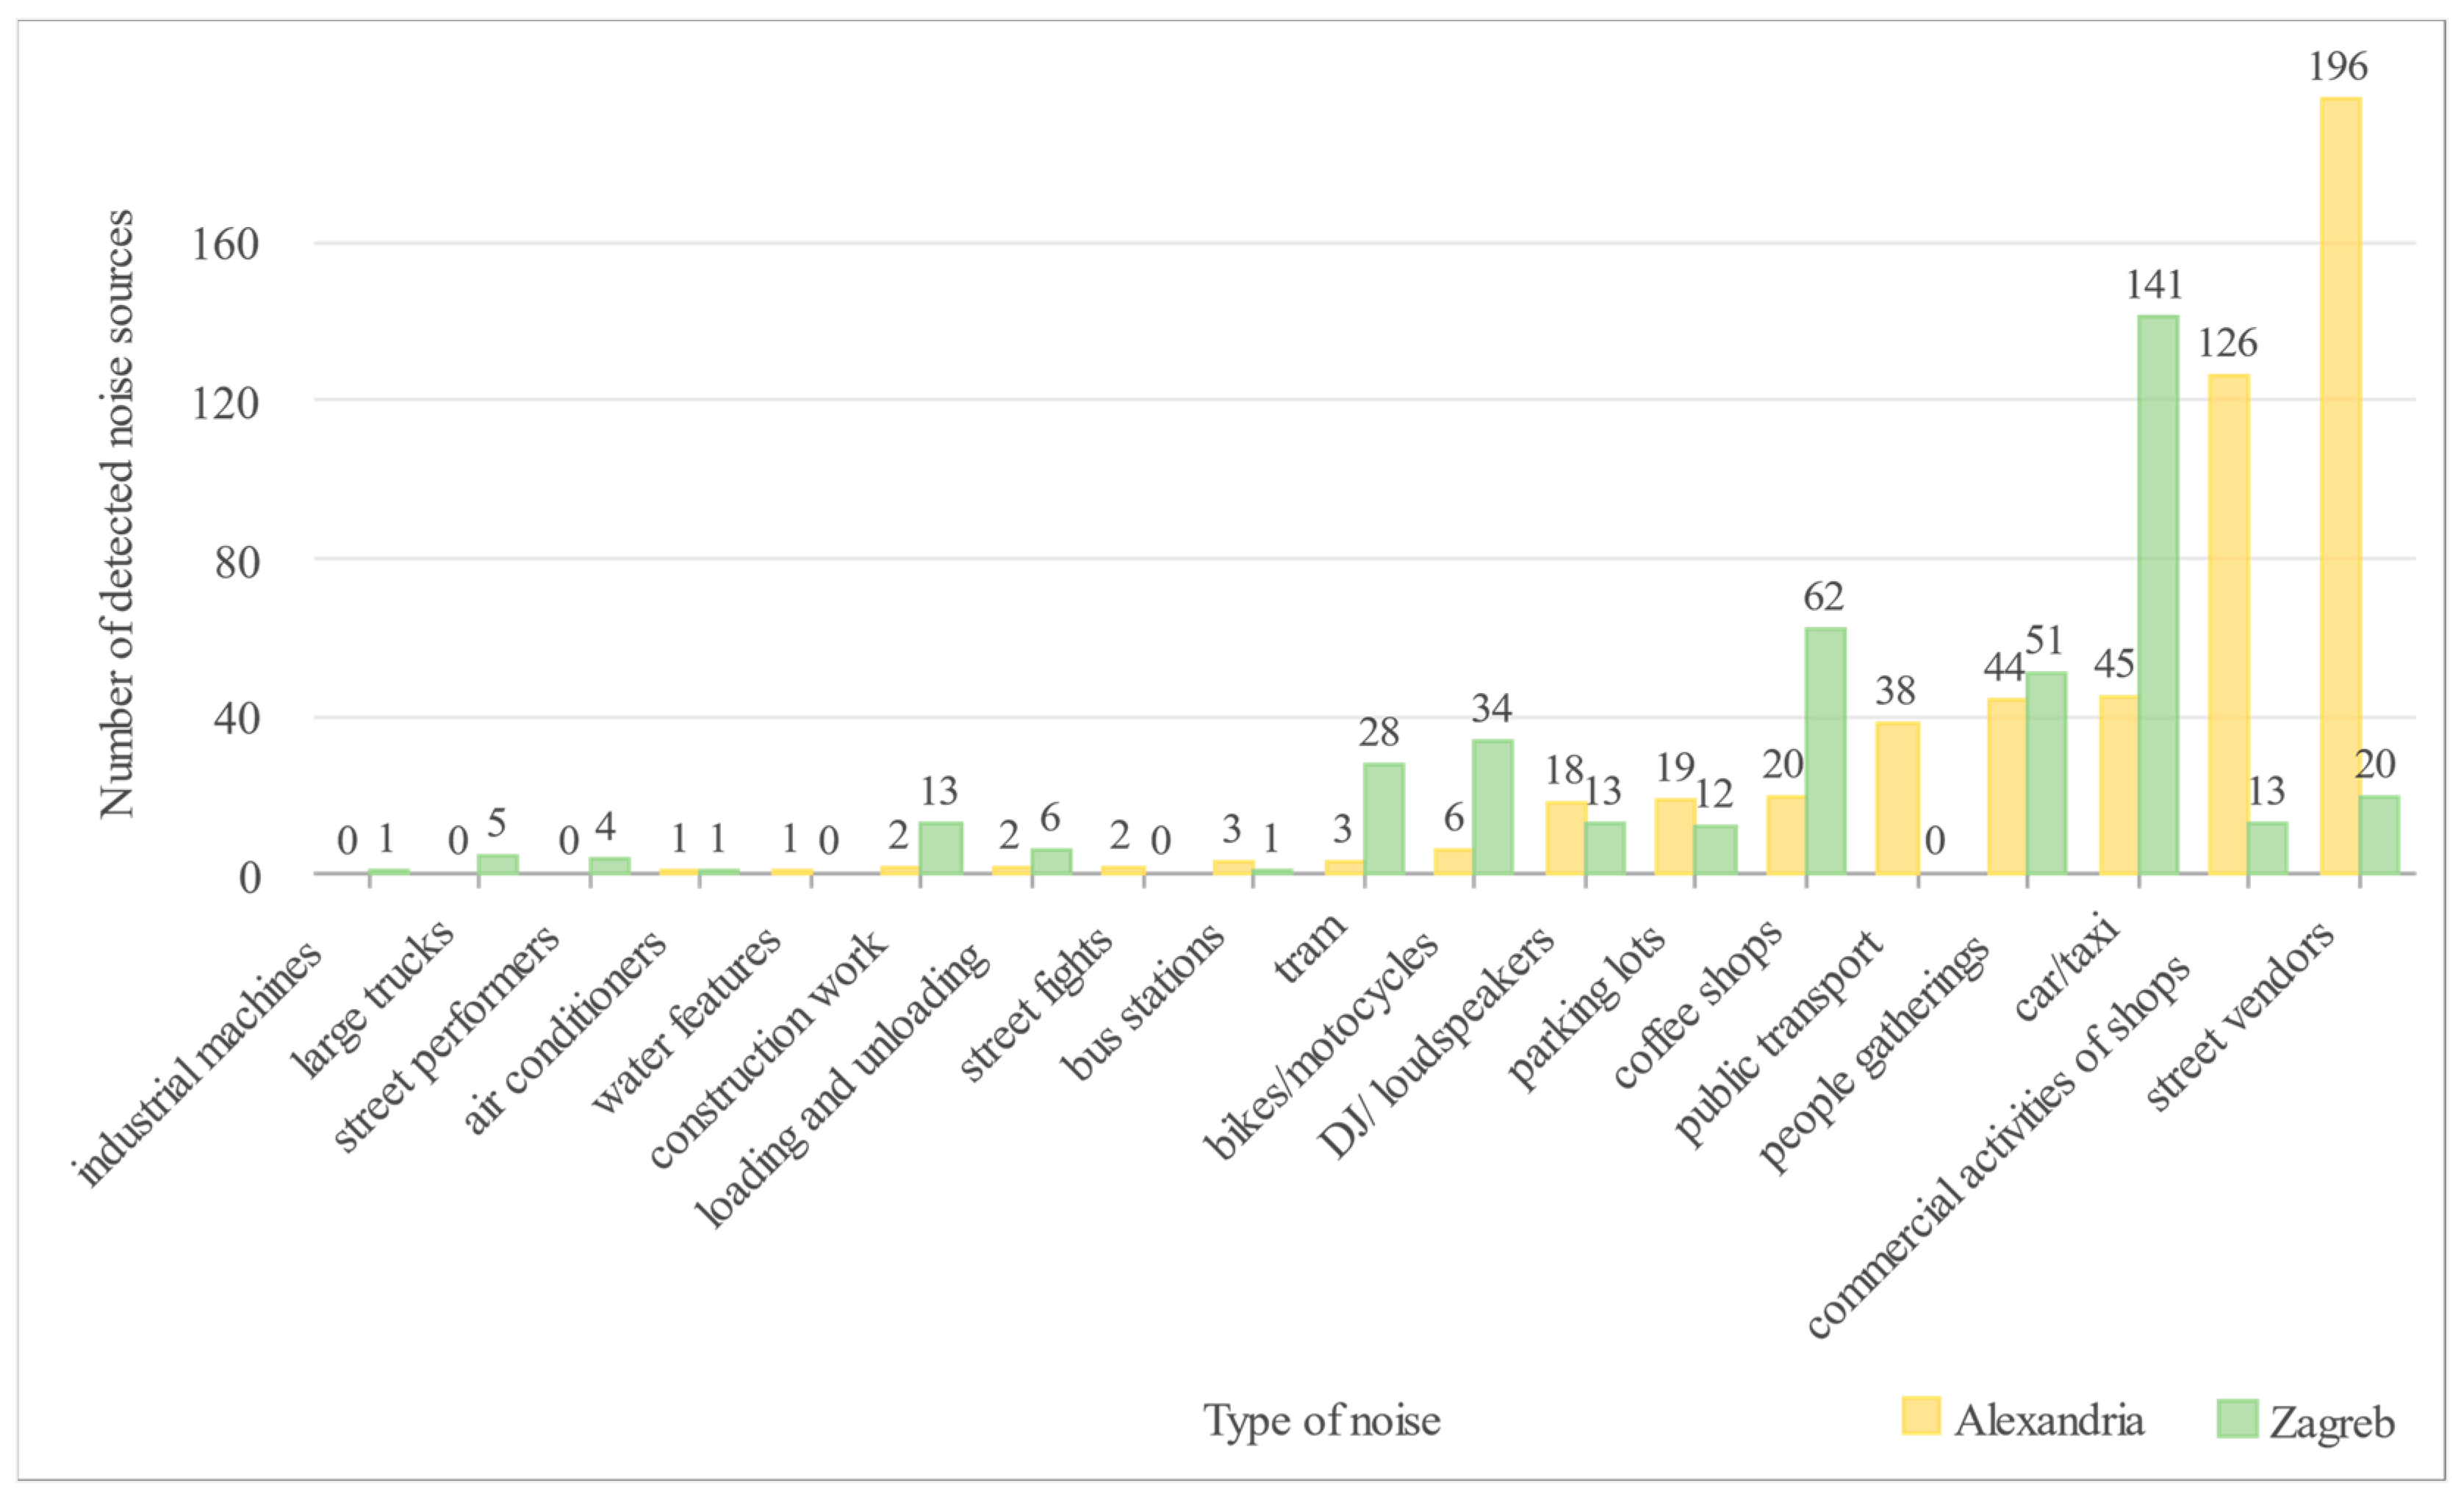
For insights into the dferences between the two cities’ noise sources,
Figure 7 shows the detected counts for each noise source. It is important to acknowledge noise sources that are observed only in one of the cities and not the other. For example, Downtown Alexandria reports several observations related to public transport. This is due to some modes of transport in Egypt, such as the microbus, that do not exist in Zagreb. This type of transportation can cause traffic congestion in several locations, with drivers calling for passengers, loud honking, waiting stations, and drop-off points. The larger number of commercial activities alongside public transport can lead to several occasions where people argue violently, especially during the day and rush hours. This explains the number of street fights reported at the time of the field survey.
Moreover, in Alexandria, the regulations specify times at which large trucks can use certain roads in the city. They are only allowed to enter the city at times between 11 p.m. and 6 a.m. This is why noise due to large trucks was not recorded in Alexandria during the field survey; however, some was observed in Zagreb. Additionally, street performers were witnessed in Zagreb, especially music performers and singers at various spots. This type of entertainment is rare in Alexandria and unfortunately was not witnessed at the time of this research.
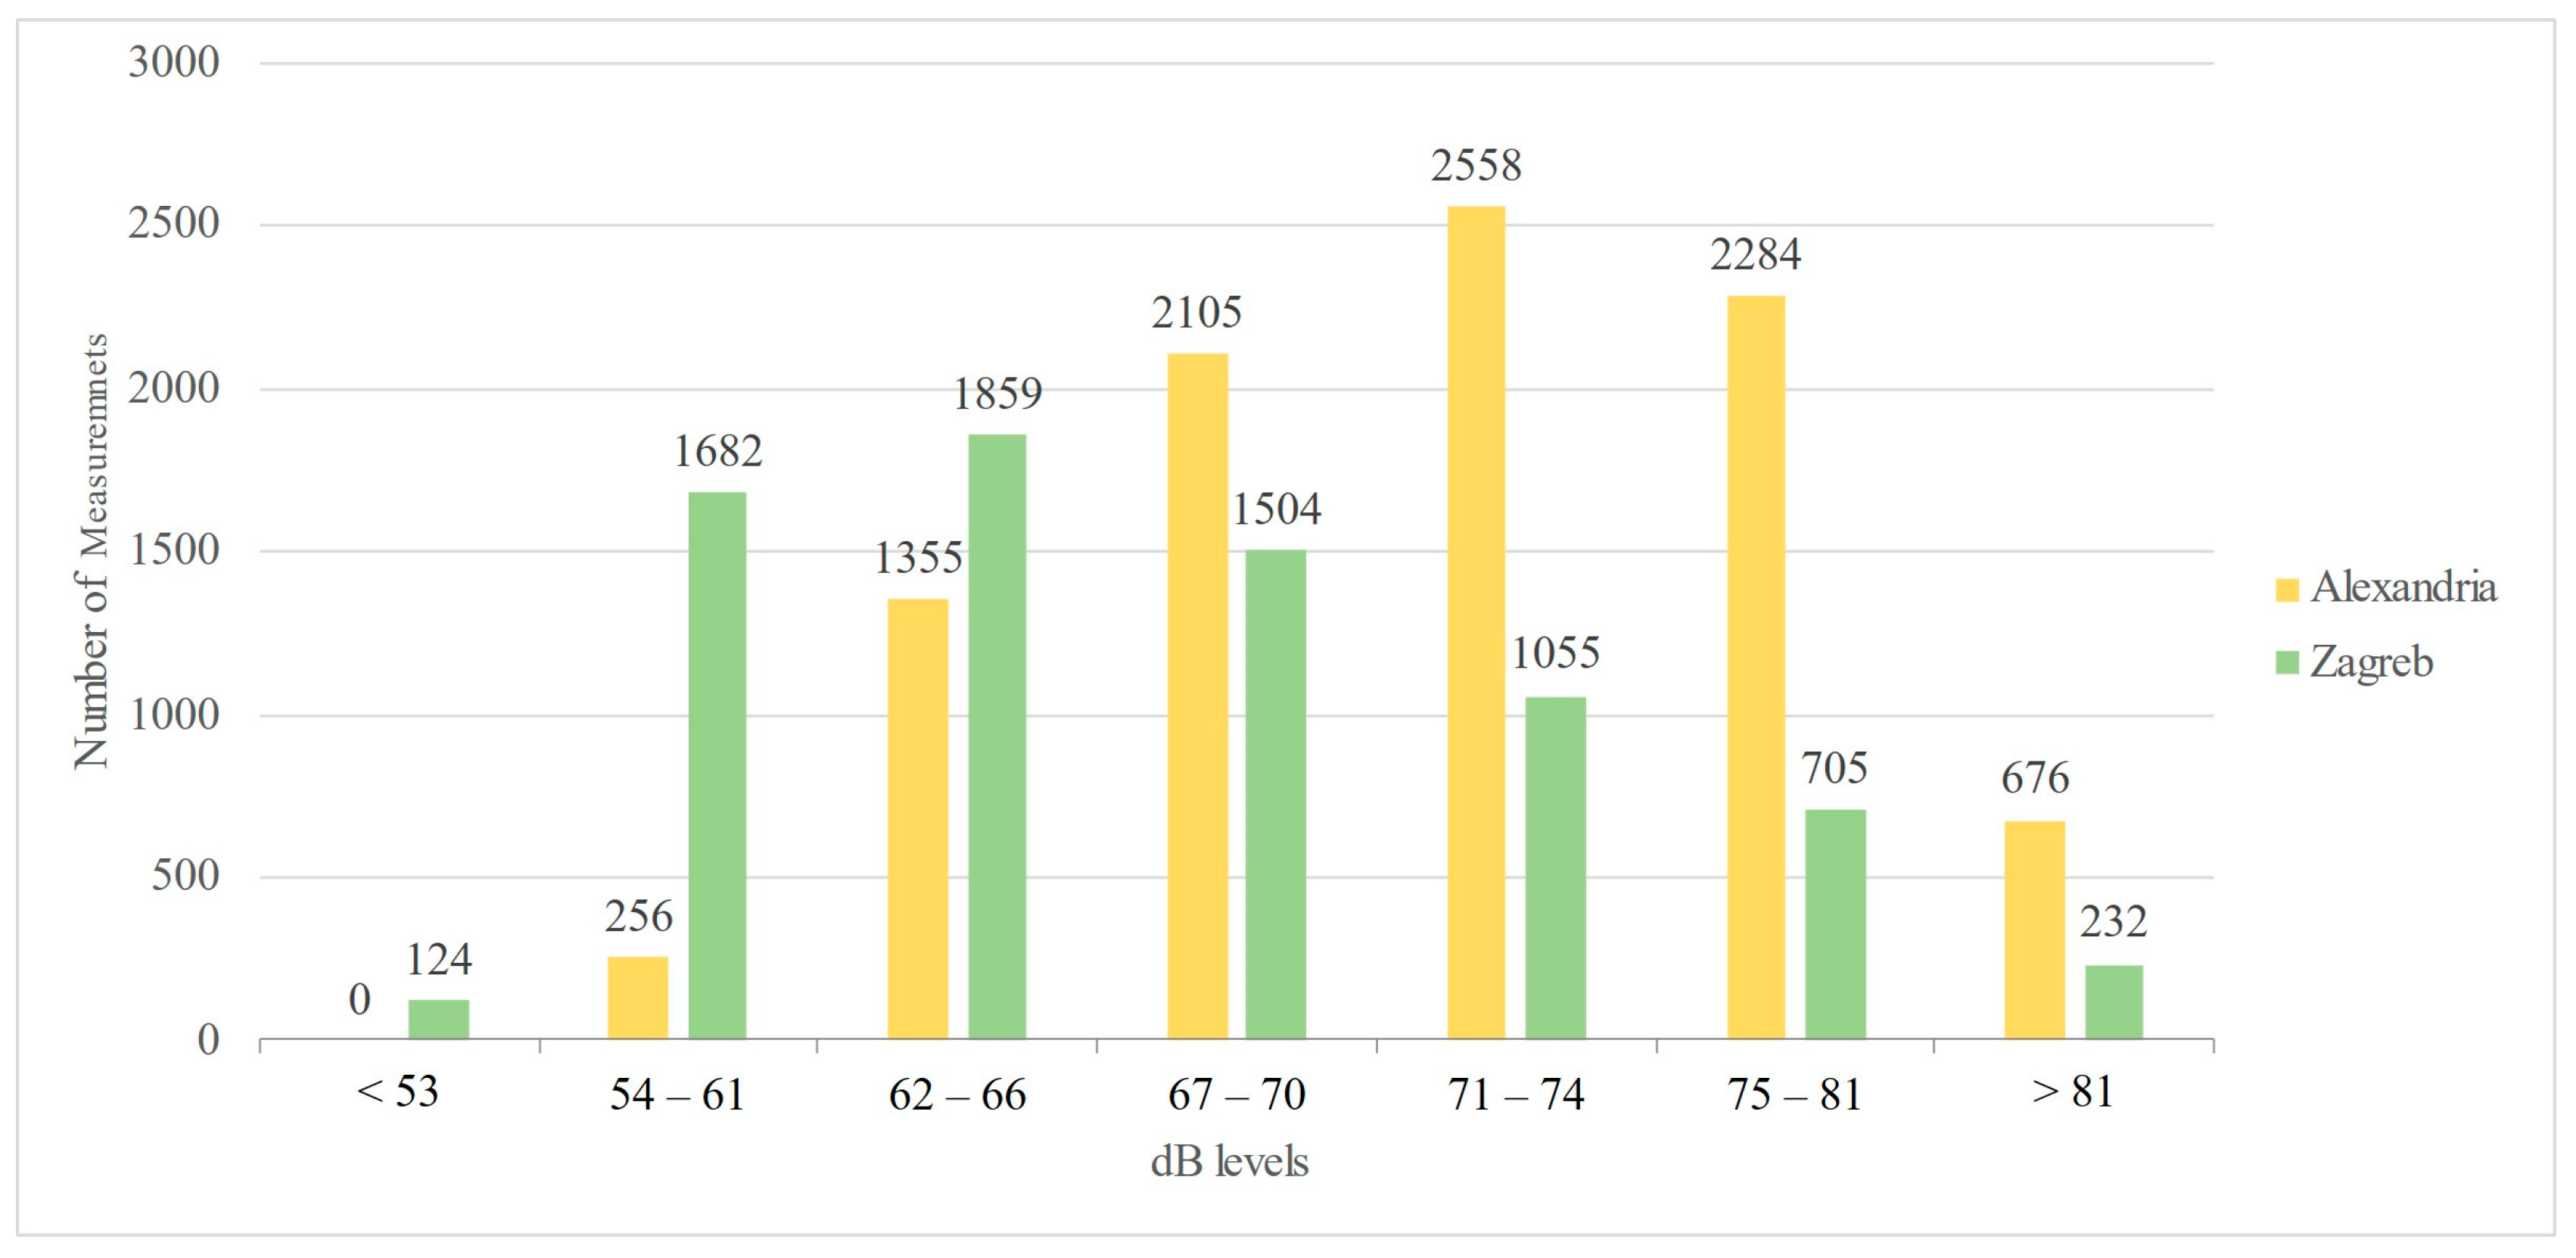
Furthermore,
Figure 8 shows the distribution of noise level measurements across the adopted classification for both cities. It can be seen that Alexandria does not report values below 53 dB. It can also be seen that the category starting from 67 dB is occupied by more measurements from Alexandria than Zagreb, whereas the lower categories are more occupied by measurements from Zagreb.
One of the most common observations in both areas was the higher noise values measured on the main streets, such as the Corniche in Alexandria (north) and Hebrangova Street in Zagreb (south). Another similarity was the lower noise values within local streets with smaller widths that do not encourage the presence of cars and public transport.
According to
Table 5, it can be observed that the highest counts of noise sources are for social gatherings in Alexandria, between 67 dB and 81 dB. Following this, car/taxi noise in Zagreb is the most commonly reported, ranging from 54 dB and 81 dB, as opposed to being the third highest in Alexandria, between 62 dB and 81 dB. Meanwhile, street vendors are the second most common source in Alexandria, between 62 dB and 81 dB, as opposed to coffee shops in Zagreb, between 54 dB and 70 dB.
One of the observations noted during the field survey was the greater presence of cycling as an activity and a mode of transport in Zagreb compared to Alexandria. However, both cities’ average values exceeded the permissible noise limits.
Overall, the lowest average value corresponds to 65.3 dB for coffee shops, and the highest average value is caused by industrial machines. Although the lowest minimum noise levels are reported in Zagreb, the commercial activities of shops in Alexandria also report some of the lowest minimum values, corresponding to 54 dB. Moreover, the car/taxi noise levels are the highest maximum values in Zagreb, corresponding to 92 dB.
Table 6 provides information on all noise sources.
According to these findings, the major contributors to the noise levels in Alexandria are traffic and transportation, with a total of 21.6%, and commercial use between shops and street vendors, with a total of 30.7%. Meanwhile, in Zagreb, the major contributors to the noise levels are traffic and transportation, with a total of 37.9%, and social activities, with 18.8%.
6.2. Questionnaire Results
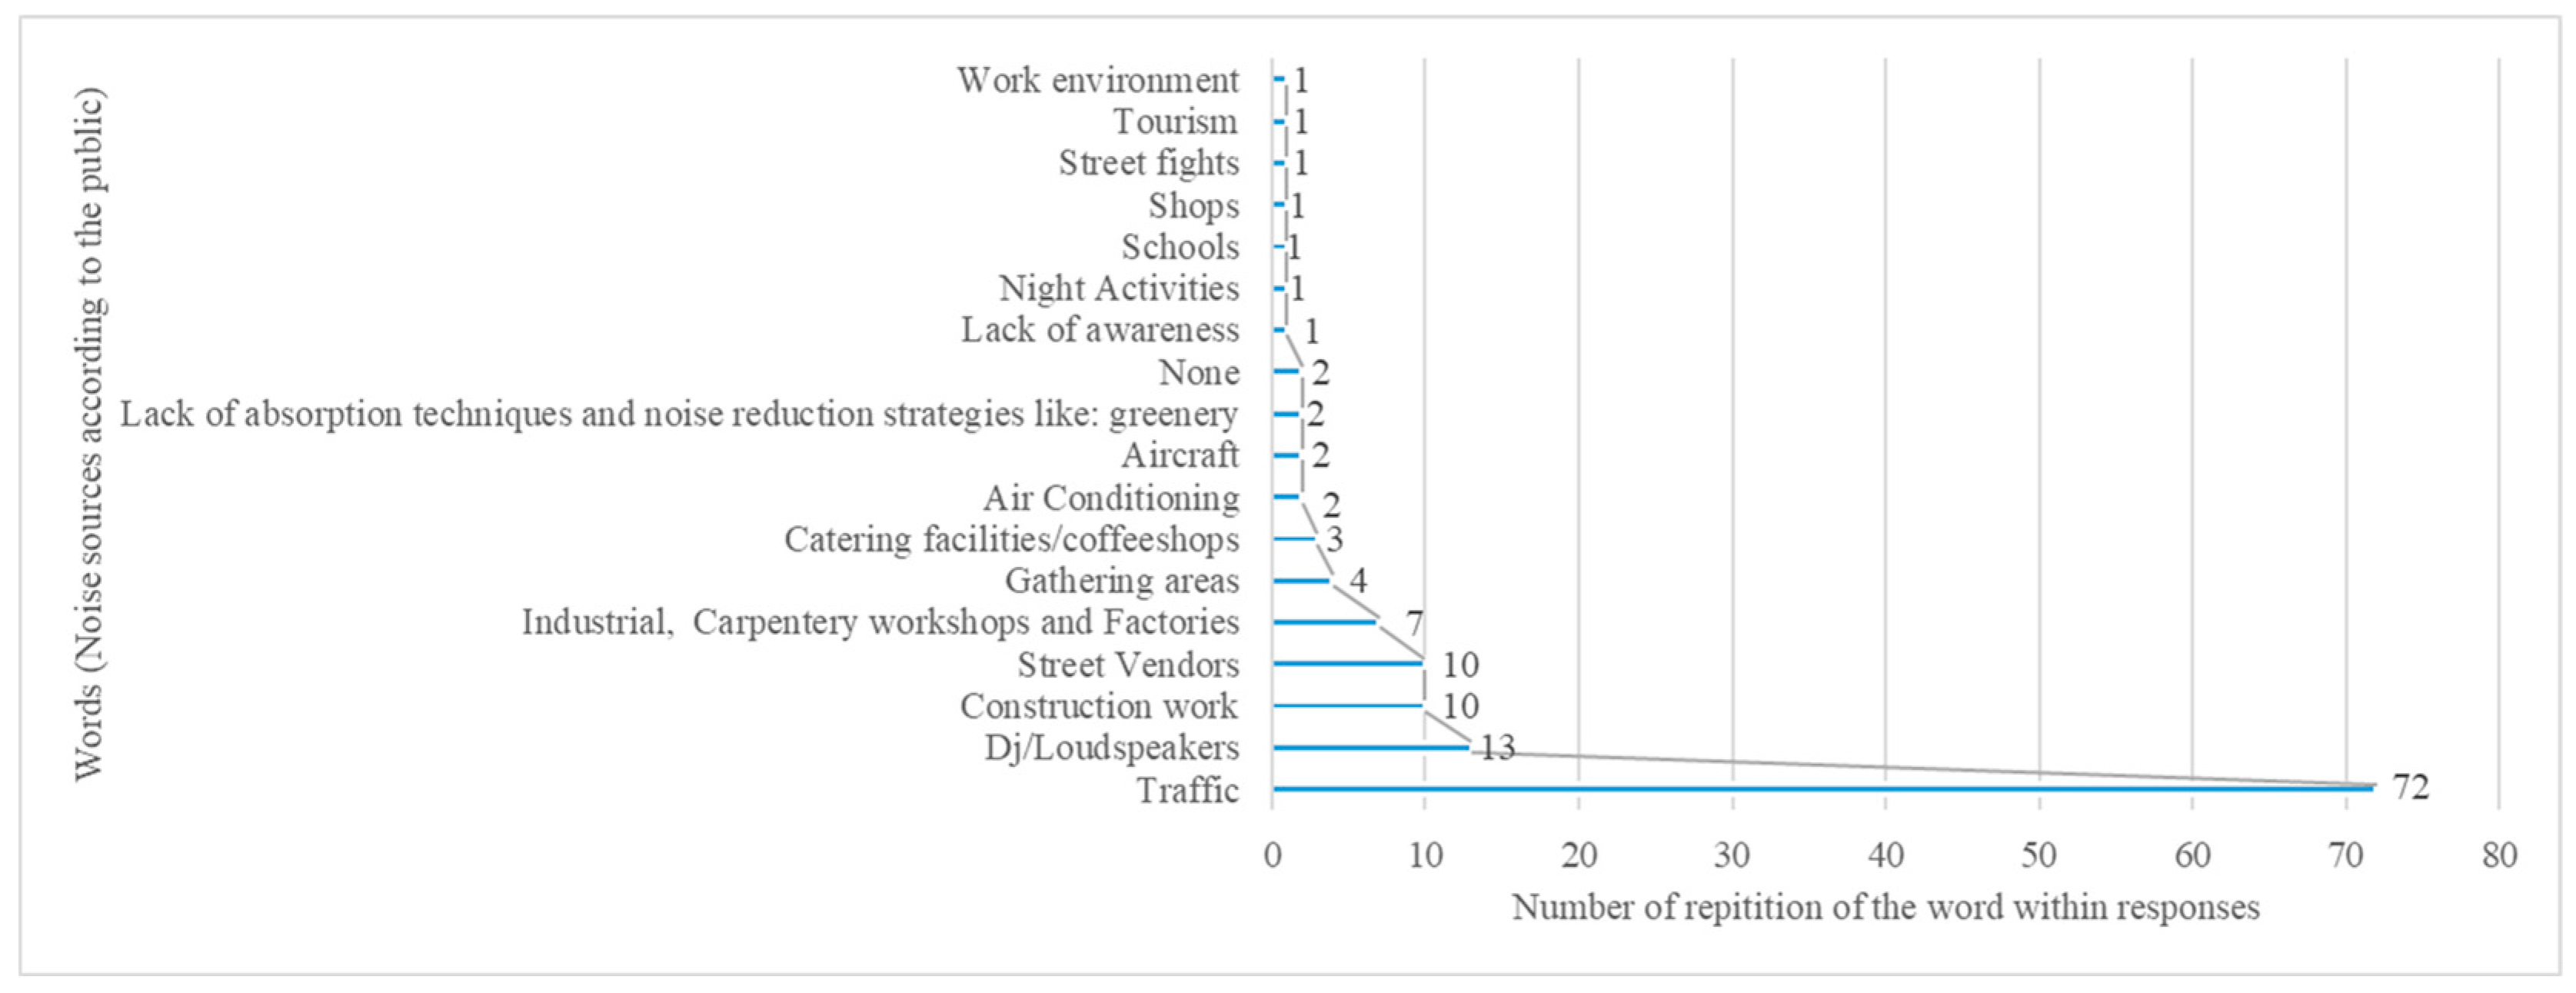
To gather the public’s input in this research, with the aid of Google Forms, participants were encouraged to take part in a survey. Participants were gathered from the study areas and via social networks. The questionnaire was answered by 96 participants aged between 18 and 60. Most of them were not familiar with noise regulations and did not have previous knowledge of noise mapping. An important advantage of public input is that it can give insights into the most commonly perceived noise sources by people in both cities. Based on the results of the question, “What noises are the most hazardous ones in the city you live in?”, the most common answer was traffic, followed by street vendors and loudspeakers (
Figure 9).
7. Discussion
Considering that 65 dB is the permissible level of noise defined by law in the downtown areas in both cities, it was important to compare the research measurements to this level. This comparison showed that 83% of the noise levels in Alexandria exceeded this limit. On the other hand, 49% of the noise levels in Zagreb exceeded this limit. Therefore, the proposed methodology managed to detect the major sound sources in both cities regarding the exceeding of permissible noise levels. These findings showed that the major contributors to the noise levels are transportation and transportation modes for both cities, while, in Alexandria, commercial activity and street vendors are considered the main contributors, requiring different polices regarding the location of street vendors and commercial shops. Meanwhile, in Zagreb, the second contributor is social activities, where coffee shops are a major contributor, requiring different polices to reduce the noise level. Prioritizing noise source mapping according to the sources of noise will allow policymakers to prioritize noise mitigation measures based on the severity of noise pollution in different areas. This will allow for the efficient allocation of resources to implement noise reduction strategies where they are most needed.
The field observation detected that the accuracy tends to increase when the measurement duration increases. This is due to the fact that a sufficient duration may be required for the GPS receiver within the smartphone to detect GPS satellites, and then to obtain the best accuracy of location. This suggests that a NoiseCapture user should wait a few seconds after starting the application; for example, ref. [
56] mentions a duration of 4 s before performing a measurement, to obtain the best geolocalization.
The buffer radius used to allocate the detected noise sources to noise levels should also be considered. According to several studies [
12,
13], the buffer distance should be sufficient to gain insights into the spatial distribution of the noise. Further research can deal with this open question.
On the level of urban planning, such interventions help planners with decision making aimed at introducing new action plans, to recommend areas in which the public can spend quality time outdoors without being disturbed by transport noise or construction work. New land use management and distribution policies are needed according to the existing current situation in each city. Moreover, trees and hedges that can isolate gathering spaces from street noises should be encouraged, and tranquil green spaces and areas with a relaxing social atmosphere, as opposed to congested traffic intersections, should be provided. By incorporating noise considerations into the design and layout of urban spaces, one can create more harmonious and livable environments. This can be achieved by official authorities and by encouraging community gardens in public spaces, which also have possible environmental and social advantages.
For the future enhancement of the research, it is recommended that local interventions are involved. These interventions might incorporate the public and interested stakeholders. The interventions might be a group of workshops that raise awareness about the dangers of noise for human health. Researchers are encouraged to participate to suggest innovative ideas to solve such problems in both cities. Noise mapping can be used to raise public awareness about noise pollution. By sharing noise maps and data with the public, individuals can better understand the impact of noise on their daily lives and actively participate in noise reduction efforts.
According to the literature review in [
57], most noise levels are due to transportation and street activity, which aligns with the research findings both in Alexandria (21.6%) and Zagreb (37.9%). Therefore, planners should develop transportation schedules that aim at reducing the noise levels during peak hours. For instance, the arrival of buses and trams at stations should be spaced 10–15 min apart. This problem arises as the stations are spatially placed near each other; therefore, the revision of the schedule might improve the distribution of the noise levels across the day.
8. Conclusions
The goal of this paper was to apply the proposed framework to two cities that are subject to different regulations and morphologies, urban schedules, and legislation through the following phases and to compare the obtained results. In the first phase, carried out in early 2023, the NoiseCapture mobile application was explored as a tool to measure noise levels and the Field Maps ESRI mobile application was used to allocate noise sources. In this phase, crowdsourcing allowed for a person-centric approach to gathering data. The second phase aimed to produce a noise map for the area utilizing the IDW interpolation tool in GIS. Repeating the same steps for both the city center in Alexandria and Zagreb allowed comparisons in the third phase of the application.
This research paper has addressed the critical issue of noise pollution in urban downtown areas, emphasizing the significance of community involvement and crowdsourcing techniques. The primary objective was to assess noise levels, identify noise sources, and engage the public in the process through a comprehensive framework that incorporates noise mapping and awareness-raising strategies.
By applying an innovative methodology in two distinct cities, Alexandria, Egypt and Zagreb, Croatia, the study has effectively demonstrated the potential of this approach. The combination of crowdsourcing techniques facilitated by mobile applications and GIS tools has proven to be a powerful means of noise detection and analysis. The analyzed data have been used to create noise maps that illustrate the noise levels across the city using an applicable adopted methodology. These maps provide visual representations of noise hotspots, areas with excessive noise, or areas that require noise mitigation measures. Moreover, the generated noise maps can be used by city authorities and urban planners to assess noise pollution levels, identify problem areas, and develop strategies for noise reduction. This information can also be shared with the public to raise awareness about noise pollution. The research findings provide valuable insights into the noise pollution landscapes of these two cities, highlighting the areas where improvements are needed. Moreover, the methodology offers a replicable model for other urban centers facing similar challenges. Overall, noise source mapping plays a vital role in managing and mitigating noise pollution on a city level. It provides a scientific basis for decision making, facilitates targeted interventions, and promotes a healthier and more peaceful urban environment for residents. By employing noise source mapping alongside other urban planning strategies, cities can work towards creating more sustainable and livable spaces for their inhabitants. Furthermore, addressing the limitations and challenges faced and presented in the discussion will certainly result in more accurate results in similar research campaigns.
Consequently, this research contributes to the broader conversation on urban planning, public health, and environmental sustainability. The comparative analysis of Alexandria and Zagreb serves as a foundation for evidence-based recommendations aimed at enhancing urban planning decisions and, ultimately, the quality of life of residents. Through collaborative efforts and community engagement, this enables us to work towards quieter cities and better designs for the urban environment.
Author Contributions
Conceptualization, I.C., E.O., D.S. and V.P.-P.; methodology, I.C., E.O., D.S. and V.P.-P.; formal analysis, E.O. and I.C.; investigation, E.O. and I.C.; validation, I.C. and E.O.; writing—original draft preparation, I.C., E.O. and D.S.; writing—review and editing, I.C., E.O., V.P.-P. and D.S.; visualization, E.O. and I.C.; supervision, D.S. and V.P.-P.; project administration, I.C. and E.O.; funding acquisition, V.P.-P. and D.S. All authors have read and agreed to the published version of the manuscript.
Funding
This research was funded by the STDF project “University Community Urban Lab for Interactive Learning and Innovative Societal Solutions (UC-Urban Lab)”, Grant ID 37172. The APC was funded by the STDF project “University Community Urban Lab for Interactive Learning and Innovative Societal Solutions (UC-Urban Lab)”, Grant ID 37172; “Curricula innovation in climate-smart urban development based on green and energy efficiency with the non-academic sector” (Project: 101081724-SmartWB-ERASMUS-EDU-2022-CBHE); and the “Collection of processing and visualization of spatial data” project of the Faculty of Geodesy.
Data Availability Statement
The data presented in this study are available on request from the corresponding author.
Conflicts of Interest
The authors declare no conflicts of interest. The funders had no role in the design of the study; in the collection, analyses, or interpretation of data; in the writing of the manuscript; or in the decision to publish the results.
References
- Schwela, D. Environmental noise challenges and policies in low-and middle-income countries. S. Fla. J. Health 2021, 2, 26–45. [Google Scholar] [CrossRef]
- Rossi, L.; Prato, A.; Lesina, L.; Schiavi, A. Effects of low-frequency noise on human cognitive performances in laboratory. Build. Acoust. 2018, 25, 17–33. [Google Scholar] [CrossRef]
- Basner, M.; Babisch, W.; Davis, A.; Brink, M.; Clark, C.; Janssen, S.; Stansfeld, S. Auditory and non-auditory effects of noise on health. Lancet 2014, 383, 1325–1332. [Google Scholar] [CrossRef]
- Eulalia, P. Noise Pollution Is a Major Problem, Both for Human Health and the Environment. Available online: https://www.eea.europa.eu/publications/environmental-noise-in-europe (accessed on 23 November 2023).
- King, E.A. Here, there, and everywhere: How the SDGs must include noise pollution in their development challenges. Environ. Sci. Policy Sustain. Dev. 2022, 64, 17–32. [Google Scholar] [CrossRef]
- The 17 Goals. Sustainable Development. Available online: https://sdgs.un.org/goals (accessed on 22 August 2023).
- Berglund, B.; Lindvall, T.; Schwela, D.H.; World Health Organization. Guidelines for Community Noise. Available online: https://apps.who.int/iris/bitstream/handle/10665/66217/a68672.pdf?sequence=1&isAllo (accessed on 12 March 2023).
- European Union. Directive 2002/49/EC of the European Parliament and the Council of 25 June 2002 relating to the assessment and management of environmental noise. Off. J. Eur. Communities 2002, 189, 2002. [Google Scholar]
- Coelho, J.B.; Alarcao, D. Noise mapping in large cities in Portugal. In Proceedings of the Twelfth International Congress on Sound and Vibration, Lisbon, Portugal, 11–14 July 2005. [Google Scholar]
- Dubey, R.; Bharadwaj, S.; Zafar, M.; Bhushan Sharma, V.; Biswas, S. Collaborative noise mapping using smartphone. Int. Arch. Photogramm. Remote Sens. Spat. Inf. Sci. 2020, 43, 253–260. [Google Scholar] [CrossRef]
- Grubeša, S.; Petošić, A.; Suhanek, M.; Đurek, I. Mobile crowdsensing accuracy for noise mapping in smart cities. Automatika 2018, 59, 286–293. [Google Scholar] [CrossRef]
- Graziuso, G.; Mancini, S.; Francavilla, A.B.; Grimaldi, M.; Guarnaccia, C. Geo-Crowdsourced sound level data in support of the community facilities planning. A Methodological Proposal. Sustainalbility 2021, 13, 5486. [Google Scholar] [CrossRef]
- Dubey, R.; Bharadwaj, S.; Zafar, M.I.; Mahajan, V.; Srivastava, A.; Biswas, S. GIS mapping of short-term noisy event of diwali night in lucknow city. ISPRS Int. J. Geo-Inf. 2021, 11, 25. [Google Scholar] [CrossRef]
- Zafar, M.I.; Dubey, R.; Bharadwaj, S.; Kumar, A.; Paswan, K.K.; Srivastava, A.; Tiwary, S.K.; Biswas, S. GIS Based Road Traffic Noise Mapping and Assessment of Health Hazards for a Developing Urban Intersection. In Proceedings of the Acoustics, Sydney, Australia, 4–8 December 2023; pp. 87–119. [Google Scholar]
- Adza, W.K.; Hursthouse, A.S.; Miller, J.; Boakye, D. Exploring the combined association between road traffic noise and air quality using QGIS. Int. J. Environ. Res. Public Health 2022, 19, 17057. [Google Scholar] [CrossRef]
- Picaut, J.; Boumchich, A.; Bocher, E.; Fortin, N.; Petit, G.; Aumond, P. A smartphone-based crowd-sourced database for environmental noise assessment. Int. J. Environ. Res. Public Health 2021, 18, 7777. [Google Scholar] [CrossRef]
- Brambilla, G.; Pedrielli, F. Smartphone-based participatory soundscape mapping for a more sustainable acoustic environment. Sustainalbility 2020, 12, 7899. [Google Scholar] [CrossRef]
- Poslončec-Petrić, V.; Cibilić, I.; Frangeš, S. Crowdsourcing Application in the Development of a Dynamic Noise Map. In Proceedings of the International Symposium on Innovative and Interdisciplinary Applications of Advanced Technologies, Tuzla, Bosnia and Herzegovina, 1–4 June 2021; pp. 676–683. [Google Scholar]
- Lokhande, S.K.; Chopkar, P.F.; Jain, M.C.; Hirani, A. Environmental noise assessment of Bhandara City in the adversity of COVID-19 pandemic: A crowdsourcing approach. Noise Mapp. 2021, 8, 249–259. [Google Scholar] [CrossRef]
- Picaut, J.; Fortin, N.; Bocher, E.; Petit, G.; Aumond, P.; Guillaume, G. An open-science crowdsourcing approach for producing community noise maps using smartphones. Build. Environ. 2019, 148, 20–33. [Google Scholar] [CrossRef]
- Zuo, J.; Xia, H.; Liu, S.; Qiao, Y. Mapping urban environmental noise using smartphones. Sensors 2016, 16, 1692. [Google Scholar] [CrossRef]
- Drosatos, G.; Efraimidis, P.S.; Athanasiadis, I.N.; Stevens, M.; D’Hondt, E. Privacy-preserving computation of participatory noise maps in the cloud. J. Syst. Softw. 2014, 92, 170–183. [Google Scholar] [CrossRef]
- Maisonneuve, N.; Stevens, M.; Ochab, B. Participatory noise pollution monitoring using mobile phones. Inf. Polity 2010, 15, 51–71. [Google Scholar] [CrossRef]
- Nieuwenhuijsen, M.; Khreis, H. Urban and transport planning, environment and health. In Integrating Human Health into Urban and Transport Planning: A Framework; Springer: Berlin/Heidelberg, Germany, 2019; pp. 3–16. [Google Scholar] [CrossRef]
- Jariwala, H.J.; Syed, H.S.; Pandya, M.J.; Gajera, Y.M. Noise pollution & human health: A review. In Proceedings of the Noise and Air Pollutions: Challenges and Opportunities, Ahmedabad, India, 17 March 2017. [Google Scholar]
- Zipf, L.; Primack, R.B.; Rothendler, M. Citizen scientists and university students monitor noise pollution in cities and protected areas with smartphones. PLoS ONE 2020, 15, e0236785. [Google Scholar] [CrossRef]
- Goudreau, S.; Plante, C.; Fournier, M.; Brand, A.; Roche, Y.; Smargiassi, A. Estimation of spatial variations in urban noise levels with a land use regression model. Environ. Pollut. 2014, 3, 48. [Google Scholar] [CrossRef]
- Ma, R.; Lam, P.T.; Leung, C. Big data in urban planning practices: Shaping our cities with data. In Proceedings of the 21st International Symposium on Advancement of Construction Management and Real Estate; Springer: Singapore, 2018; pp. 365–373. [Google Scholar]
- Ivanov, N.; Gnevanov, M. Big data: Perspectives of using in urban planning and management. In Proceedings of the MATEC Web of Conferences, International Science Conference SPbWOSCE-2017 “Business Technologies for Sustainable Urban Development”, St. Petersburg, Russia, 20–22 December 2017; p. 01107. [Google Scholar] [CrossRef]
- King, G.; Roland-Mieszkowski, M.; Jason, T.; Rainham, D.G. Noise levels associated with urban land use. J. Urban Health 2012, 89, 1017–1030. [Google Scholar] [CrossRef]
- Sheikh, M.; Mitchell, A. Design strategies for perceived acoustic comfort in urban environments—A literature review. In Proceedings of the Acoustics, Adelaide, Australia, 6–9 November 2018. [Google Scholar]
- Fang, X.; Gao, T.; Hedblom, M.; Xu, N.; Xiang, Y.; Hu, M.; Chen, Y.; Qiu, L. Soundscape perceptions and preferences for different groups of users in urban recreational forest parks. Forests 2021, 12, 468. [Google Scholar] [CrossRef]
- Uebel, K.; Rhodes, J.R.; Wilson, K.; Dean, A.J. Urban park soundscapes: Spatial and social factors influencing bird and traffic sound experiences. People Nat. 2022, 4, 1616–1628. [Google Scholar] [CrossRef]
- Radicchi, A.; Henckel, D.; Memmel, M. Citizens as smart, active sensors for a quiet and just city. The case of the “open source soundscapes” approach to identify, assess and plan “everyday quiet areas” in cities. Noise Mapp. 2018, 5, 1–20. [Google Scholar] [CrossRef]
- Margaritis, E.; Kang, J.; Aletta, F.; Axelsson, Ö. On the relationship between land use and sound sources in the urban environment. J. Urban Des. 2020, 25, 629–645. [Google Scholar] [CrossRef]
- Dopico, J.; Schäffer, B.; Brink, M.; Röösli, M.; Vienneau, D.; Binz, T.M.; Tobias, S.; Bauer, N.; Wunderli, J.M. How do road traffic noise and residential greenness correlate with noise annoyance and long-term stress? Protocol and pilot study for a large field survey with a cross-sectional design. Int. J. Environ. Res. Public Health 2023, 20, 3203. [Google Scholar] [CrossRef]
- Hong, J.Y.; Jeon, J.Y. Relationship between spatiotemporal variability of soundscape and urban morphology in a multifunctional urban area: A case study in Seoul, Korea. Build. Environ. 2017, 126, 382–395. [Google Scholar] [CrossRef]
- Becker, M.; Caminiti, S.; Fiorella, D.; Francis, L.; Gravino, P.; Haklay, M.; Hotho, A.; Loreto, V.; Mueller, J.; Ricchiuti, F. Awareness and Learning in Participatory Noise Sensing. PLoS ONE 2013, 8, e81638. [Google Scholar] [CrossRef]
- Boumchich, A.; Picaut, J.; Bocher, E. Using a Clustering Method to Detect Spatial Events in a Smartphone-Based Crowd-Sourced Database for Environmental Noise Assessment. Sensors 2022, 22, 8832. [Google Scholar] [CrossRef]
- Zambon, G.; Benocci, R.; Brambilla, G. Cluster categorization of urban roads to optimize their noise monitoring. Environ. Monit. Assess. 2016, 188, 1–11. [Google Scholar] [CrossRef]
- Murtagh, F.; Contreras, P. Algorithms for hierarchical clustering: An overview. Wiley Interdiscip. Rev. Data Min. Knowl. Discov. 2012, 2, 86–97. [Google Scholar] [CrossRef]
- Ester, M.; Kriegel, H.-P.; Sander, J.; Xu, X. A density-based algorithm for discovering clusters in large spatial databases with noise. In Proceedings of the KDD; AAAI Press: Washington, DC, USA, 1996; pp. 226–231. [Google Scholar]
- Maisonneuve, N.; Stevens, M.; Niessen, M.E.; Hanappe, P.; Steels, L. Citizen noise pollution monitoring. In Proceedings of the the 10th Interantional Digital Goverment Research Conference, Puebla, Mexico, 17–20 May 2009; pp. 90–103. [Google Scholar]
- Can, A.; Audubert, P.; Aumond, P.; Geisler, E.; Guiu, C.; Lorino, T.; Rossa, E. Framework for urban sound assessment at the city scale based on citizen action, with the smartphone application NoiseCapture as a lever for participation. Noise Mapp. 2023, 10, 20220166. [Google Scholar] [CrossRef]
- Interstate Technology & Regulatory Council (ITRC). Geospatial Analysis for Optimization at Environmental Sites. GRO-1. Washington, D.C.: Interstate Technology & Regulatory Council, Geostatistics for Remediation Optimization Team. 2016. Available online: http://itrcweb.org/Team/Public?teamID=62 (accessed on 1 March 2023).
- Mitas, L.; Mitasova, H. Spatial interpolation. In Geographical Information Systems: Principles, Techniques, Management and Applications, GeoInformation International; Wiley: Hoboken, NJ, USA, 1999; Volume 1, pp. 481–492. [Google Scholar]
- Karthik, K.; Partheeban, P.; Raju, P.; Anuradha, P. Development of noise prediction models using GIS for Chennai city. Int. J. Emerg. Technol. Adv. Eng. 2015, 5, 245–250. [Google Scholar]
- Krosnick, J.A. Questionnaire design. In The Palgrave Handbook of Survey Research; Springer: Berlin/Heidelberg, Germany, 2018; pp. 439–455. [Google Scholar]
- Field Data Collection App for Mobile Workers|ArcGIS Field Maps. Available online: https://www.esri.com/en-us/arcgis/products/arcgis-field-maps/overview (accessed on 13 March 2023).
- Barthel, P.; Davidson, L.; Sudarskis, M. Alexandria: Regenerating the City—A Contribution Based on AFD Experiences. Available online: https://inta-aivn.org/download/alexandria-regenerating-the-city/ (accessed on 10 April 2023).
- Ammar, A.M.S. Prospects of walkability in city neighborhoods case study: The city center of Alexandria. Archit. Plan. J. (APJ) 2018, 24, 3. [Google Scholar] [CrossRef]
- Dragčević, V.; Lakušić, S.; Ahac, S.; Ahac, M. Contribution to optimization of noise mapping procedures. Gradevinar 2008, 60, 787–795. [Google Scholar]
- Law Number 4 of 1994 Promulgating the Environment Law Amended By Law No. 9 for 2009, Egypt Signed by Hosny Mobarak. Available online: https://www.eeaa.gov.eg/Uploads/Laws/Files/20221010120915151.doc (accessed on 11 March 2023).
- The Law on Noise Protection (Official Gazette 30/09, 55/13, 153/13, 41/16, 114/18 and 14/21). Available online: https://www.zakon.hr/z/125/Zakon-o-za%C5%A1titi-od-buke (accessed on 9 November 2023).
- EUBUCCO. Available online: https://eubucco.com/data/ (accessed on 14 April 2023).
- Zamora, W.; Vera, E.; Calafate, C.T.; Cano, J.-C.; Manzoni, P. GRC-sensing: An architecture to measure acoustic pollution based on crowdsensing. Sensors 2018, 18, 2596. [Google Scholar] [CrossRef]
- Tang, J.-H.; Lin, B.-C.; Hwang, J.-S.; Chen, L.-J.; Wu, B.-S.; Jian, H.-L.; Lee, Y.-T.; Chan, T.-C. Dynamic modeling for noise mapping in urban areas. Environ. Impact Assess. Rev. 2022, 97, 106864. [Google Scholar] [CrossRef]
| Disclaimer/Publisher’s Note: The statements, opinions and data contained in all publications are solely those of the individual author(s) and contributor(s) and not of MDPI and/or the editor(s). MDPI and/or the editor(s) disclaim responsibility for any injury to people or property resulting from any ideas, methods, instructions or products referred to in the content. |
© 2024 by the authors. Licensee MDPI, Basel, Switzerland. This article is an open access article distributed under the terms and conditions of the Creative Commons Attribution (CC BY) license (https://creativecommons.org/licenses/by/4.0/).


