Article

Analysis of the Barriers to Smart City Development Using DEMATEL

by
Anas A. Makki
1,* and
Ammar Y. Alqahtani
2
1
Department of Industrial Engineering, Faculty of Engineering—Rabigh, King Abdulaziz University, P.O. Box 80204, Jeddah 21589, Saudi Arabia
2
Department of Industrial Engineering, Faculty of Engineering, King Abdulaziz University, P.O. Box 80204, Jeddah 21589, Saudi Arabia
*
Author to whom correspondence should be addressed.
Urban Sci. 2024, 8(1), 10; https://doi.org/10.3390/urbansci8010010
Submission received: 23 November 2023 / Revised: 29 December 2023 / Accepted: 16 January 2024 / Published: 1 February 2024
(This article belongs to the Special Issue Smart City and Well-Being)

Abstract

:
This study analyzes the barriers to developing smart cities (SCs) using the decision-making trial and evaluation laboratory (DEMATEL) approach. The primary objective is to identify, classify, and assess the main barriers hindering the progress of SCs. Through an extensive literature review, twelve main barriers were identified. The DEMATEL approach models and analyzes the relationships among these barriers based on expert input. The results reveal that technical problems, a lack of infrastructure, and high costs are classified as cause barriers. Security and privacy concerns and the absence of coordinated planning are classified as effect barriers. This study emphasizes the need for established criteria and iterative development requirements. Although the influence of knowledge and skills gaps and a lack of awareness is less significant, these aspects still require attention. The findings suggest that a comprehensive approach focusing on technical solutions, infrastructure development, strategic planning, and cybersecurity measures can effectively overcome barriers. Regular evaluation of barrier dynamics is crucial for implementing adaptive measures. The results provide decision-makers with a valuable model to address the challenges and foster the efforts of SC stakeholders.

1. Introduction

Rapid urbanization and the global rural-to-urban migration trend have led to an increased focus on smart cities (SCs) worldwide. SCs are envisioned as technologically advanced and sustainable urban environments that leverage innovative solutions and citizen participation to improve quality of life and address urban challenges [1]. Governments are keen to transform their cities into SCs to diversify their economies and reduce their dependence on traditional sectors [2]. However, the development of SCs is not without its challenges. Decision-makers and urban development leaders must address complex and multidisciplinary issues. Therefore, understanding and overcoming the barriers hindering the progress of smart urban areas is important [3]. To this end, governmental entities are implementing comprehensive plans to foster the growth and development of SCs.
In this context, this study aims to investigate and evaluate the barriers impeding SC development. By conducting an extensive literature review, we identify 12 main barriers that have been widely discussed in the context of SC development. These barriers encompass technical problems, a lack of infrastructure, high costs, security and privacy concerns, and the absence of coordinated planning, among others. To gain a deeper understanding of the relationships among these barriers and their underlying causes and effects, we follow the decision-making trial and evaluation laboratory (DEMATEL) approach. This approach allows us to model and analyze the complex network of interconnections among the barriers based on the input of experts in the field of SCs [4,5].
The findings of this research are expected to provide valuable insights for decision-makers involved in SC development. By elucidating the barriers and their interconnectedness, this study aims to equip decision-makers with important insights to help them overcome these challenges successfully. Emphasizing technical solutions, infrastructure development, strategic planning, and cybersecurity measures could effectively address the identified barriers. Furthermore, regularly evaluating changing barrier dynamics will enable the implementation of adaptive measures. This study contributes to the existing body of knowledge by comprehensively analyzing the barriers to SC development using the DEMATEL approach. The results offer decision-makers a valuable model that can inform their strategic efforts to foster SC development and overcome the challenges that various stakeholders face. By leveraging the potential of SCs, we can work toward creating sustainable, technologically advanced, and inclusive urban environments.

2. Literature Review

2.1. Barriers to SC Development

The concept of SCs is quite new; nevertheless, the pursuit of innovation has always been a prominent focus for urban areas and municipal administrations [6,7,8,9]. Cities are often given significant resources and autonomy to pursue and execute environmental and infrastructural initiatives, making cities potential hubs for groundbreaking innovation. This has been shown in several domains, such as migration, energy, and finance [10,11,12,13]. While public sector companies, such as municipal administrations, may not prioritize profit and market competition, pursuing efficient and high-quality services that meet the expectations of users (i.e., residents) makes innovation a significant endeavor [14].
Many factors are linked to the inventive performance of urban areas and are vital considerations for the advancement of SCs. One of the most well-researched factors influencing innovation at the municipal level is the population size of a city. Various arguments support the notion that large cities are more likely to exhibit higher levels of innovation. First, they commonly possess more resources, such as well-equipped workforces with advanced expertise [15]. Metropolitan regions often consist of a multitude of socioeconomic actors and intricate ecosystems, which may foster an atmosphere receptive to innovation [16]. An increased population size also correlates with a heightened need to enhance services [17,18,19]. Metropolitan areas often face obstacles to effectively providing services to a substantial population of individuals with varying requirements and preferences. Adapting to external factors, such as social or economic demands, can foster creativity.
Irrespective of a city’s precise dimensions, population growth is also strongly linked to innovation [8,9]. An increase in the population necessitates implementing more efficient services to meet the rising demand. The resulting residential and infrastructural growth presents opportunities to explore novel technologies and practices. Consequently, these newly created urban areas serve as experimental grounds for innovation.
Residents’ socioeconomic and professional characteristics are considered to be significant factors influencing innovation within local governments [20,21,22]. Socioeconomic characteristics might serve as an indicator of the resources available to communities. Additionally, a wealthy and well-educated populace can signify a heightened need for superior services, prompting municipalities to engage in higher levels of innovation [14]. According to recent research examining the innovativeness of Canadian towns, municipalities with higher levels of wealth, characterized by higher work-derived income and significant economic growth, tend to exhibit greater levels of innovation [23]. Although no correlation between economic inequality and innovativeness was observed, it was found that employment rates and the proportion of the population employed in the science, business, arts, and health sectors were positively associated with innovativeness. Conversely, it was shown that employment in the primary and industrial sectors had a detrimental impact on innovation [23].
One frequently cited rationale for the inventive nature of urban areas is the proximity of economic agents and research establishments, which facilitate the creation and dissemination of information [15]. The triple helix model is a conceptual framework that illustrates the generation of innovation via collaborative interactions among government, industry, and academia [24,25]. Traditionally, public–private partnerships were the prevailing form of collaboration in an industrialized society. However, as the service sector has grown and the manufacturing industry has declined, the role of universities in driving innovation has become increasingly significant. This is evidenced by numerous case studies conducted in Europe, the United States, and South America [26]. Universities also have a considerable role to play within the framework of SCs [27]. In addition to their role as sources of information and facilitators for startup companies [28], universities function as middlemen and gatekeepers of knowledge [27]. This involves facilitating knowledge management between organizations and local governments; promoting the engagement of many stakeholders, including the public; and facilitating the transfer of information throughout networks of entities. Consequently, universities are seen as a fundamental component of knowledge-driven urban economies that enable the development of SCs.
Geographical closeness among different socioeconomic actors is generally recognized as significant in the context of innovation [29]. Scholars have contended that densely populated metropolitan areas with shorter physical distances are advantageous for facilitating communication and the dissemination of information [30,31,32]. While information and communication technology development has diminished the necessity of geographic proximity for creativity and learning, such proximity remains essential, particularly for facilitating the transmission of tacit knowledge [33]. Physical closeness facilitates the formation of networks that exhibit a significant degree of trust and foster strong collaboration via close and robust connections [34]. These networks are advantageous for the exchange of intricate information [35], cooperative efforts, and possibly groundbreaking creativity [36]. In addition, it is worth noting that densely populated urban regions have been shown to exhibit economies of scale in terms of the production and distribution of products and services [37,38]. In highly inhabited urban areas, the cost of delivering essential services, such as education, housing, and water, can be 30–50% lower than in less densely populated regions [39].
This study aims to investigate and evaluate the barriers hindering SC development. A comprehensive literature review was undertaken to ascertain the barriers that impact the development of SCs. The review process included research studies published between 2010 and 2022, sourced from academic databases. The process started with the identification of relevant studies. The authors conducted a comprehensive literature search to identify relevant scholarly works on the subject of SCs. Then, the discovered studies were evaluated to exclude those unrelated to the study issue. Subsequently, data were extracted from the selected studies, including the barriers that influenced SC development. The data collected from the selected research studies were synthesized to extract the twelve most prevalent barriers that impact SCs, as listed in Table 1.

2.2. Multi-Criteria Decision-Making in SCs

Multi-criteria decision-making (MCDM) is a well-recognized approach that involves evaluating several potential alternatives and considering multiple competing criteria to arrive at a decision. MCDM has been extensively researched, and [76] provides a comprehensive discussion on many prominent MCDM approaches and their respective application domains. For example, in their research, Ozkaya and Erdin [77] evaluated several aspects of certain cities worldwide, such as transportation, smart living, and smart governance. This evaluation aimed to rate the characteristics that contribute to the development of smarter and more controllable cities. The criteria were assessed and prioritized using the analytic network process (ANP) and the technique for order preference by similarity to ideal solution (TOPSIS). The analytic hierarchy process (AHP) was used to assess and rank the key factors that significantly influence the transportation systems of SCs. These indicators include congestion, pollution, safety, and accident reduction [78].
The field of transportation has been studied extensively, particularly in terms of the use of MCDM methodologies for evaluating transport infrastructure quality [79,80,81,82]. Farooq et al. [83] used the AHP with geographic information system (GIS) data to determine the optimal transit choice. In addition to using the best-worst method (BWM) and PROMETHEE II approach, researchers [84] have used GIS data and strengths, weaknesses, opportunities, and threats (SWOT) analyses to ascertain the optimal transportation mode in Peshawar.
In previous research, the AHP has often been used to address intricate decision-making problems involving several criteria. The SC concept requires the involvement of residents, local governments, and other stakeholders. In order to efficiently allocate resources and provide effective services to the public, local government decision-makers prioritize implementing an SC product service system [85]. In the field of decision-making, the AHP and the TOPSIS are widely used methodologies. The AHP is used to determine the relative importance of each criterion, and the TOPSIS then utilizes these weights to rank the available options [86]. The AHP involves decomposing issues into a hierarchical structure of criteria and options. Subsequently, weights are determined for each alternative within this framework. TOPSIS determines the distance between each option, the ideal answer, and the negative ideal solution (NIS). This approach aims to identify the option that closely approximates the ideal solution while being the farthest away from the non-perfect solution.
Multiple methodologies may be used to ascertain the significance of sustainable indicators, such as a fuzzy AHP and data envelopment analysis (DEA). Galiardi et al. [87] and Lazaroiu and Roscia [88] used fuzzy logic to ascertain the respective weights assigned to each sustainable metric. Lee et al. [89] used a multi-case study methodology in their research and proposed using an integrated strategy to select appropriate sustainable indicators to create a SC. Lombardi et al. [90] used the ANP as a modeling technique to assess the performance of SCs. Auci et al. [91] used a stochastic frontier function to optimize the output function, namely urban productivity or urban efficiency. The efficiency score was used to rate European cities. Lee et al. [92,93] used an integrated fuzzy AHP and DEA to determine the relative efficiency of hydrogen energy systems. MCDM can generally solve any decision-making problem involving multiple criteria, such as cost, benefit, risk, and performance [94,95,96,97]. Demonstrating this, Hanine et al. [98] presented an intuitionistic fuzzy approach for evaluating SC development in developing countries, specifically focusing on the Moroccan context. Their study addresses the challenges unique to developing nations and provides insights into the assessment of SC initiatives. The paper contributes to our understanding of evaluation methods and offers guidance for policymakers and urban planners in similar contexts. These studies provide valuable insights into the barriers that hinder the development of SCs. MCDM methods are beneficial for investigating these barriers, as they can help identify and prioritize the most critical ones, and coping strategies for overcoming them can then be developed.
This study follows the DEMATEL approach to model the cause-and-effect structure of the extracted barriers to SC development (Table 1) in an understandable and systematically ordered framework. The modeling process starts with identifying barriers (Table 1) and then analyzing the relationships among them based on input data from experts in SCs. The barriers are categorized based on their cause-and-effect roles in SC development. The next section provides a comprehensive explanation of the materials used and the processes involved in following the DEMATEL approach to accomplish the purpose of the research.

3. Materials and Methods

This research aims to examine and assess the barriers that impede SC development. A total of twelve barriers were identified through an extensive review of relevant scholarly sources. These barriers were comprehensively compiled and presented in Table 1. The research goals are accomplished through following the DEMATEL approach, which involves analyzing and transforming the barriers model into a comprehensible digraph of the network of interconnections among the barriers. This is achieved by examining the causal linkages between the barriers. A questionnaire survey was devised to gather necessary data throughout the modeling process, using the barriers extracted (B1–B12) and listed in Table 1. A panel of 10 experts in SCs (Table A1, Appendix A) evaluated the effect of each barrier on the others. The evaluation was carried out using a pre-established scale and in a paired fashion until all potential pairs were assessed. The data gathered were used as inputs in the DEMATEL modeling approach. The DEMATEL methodology classified the barriers into cause-and-effect clusters, revealing their causal interconnections, relative significance weights, and ranks. The DEMATEL approach process, shown in 
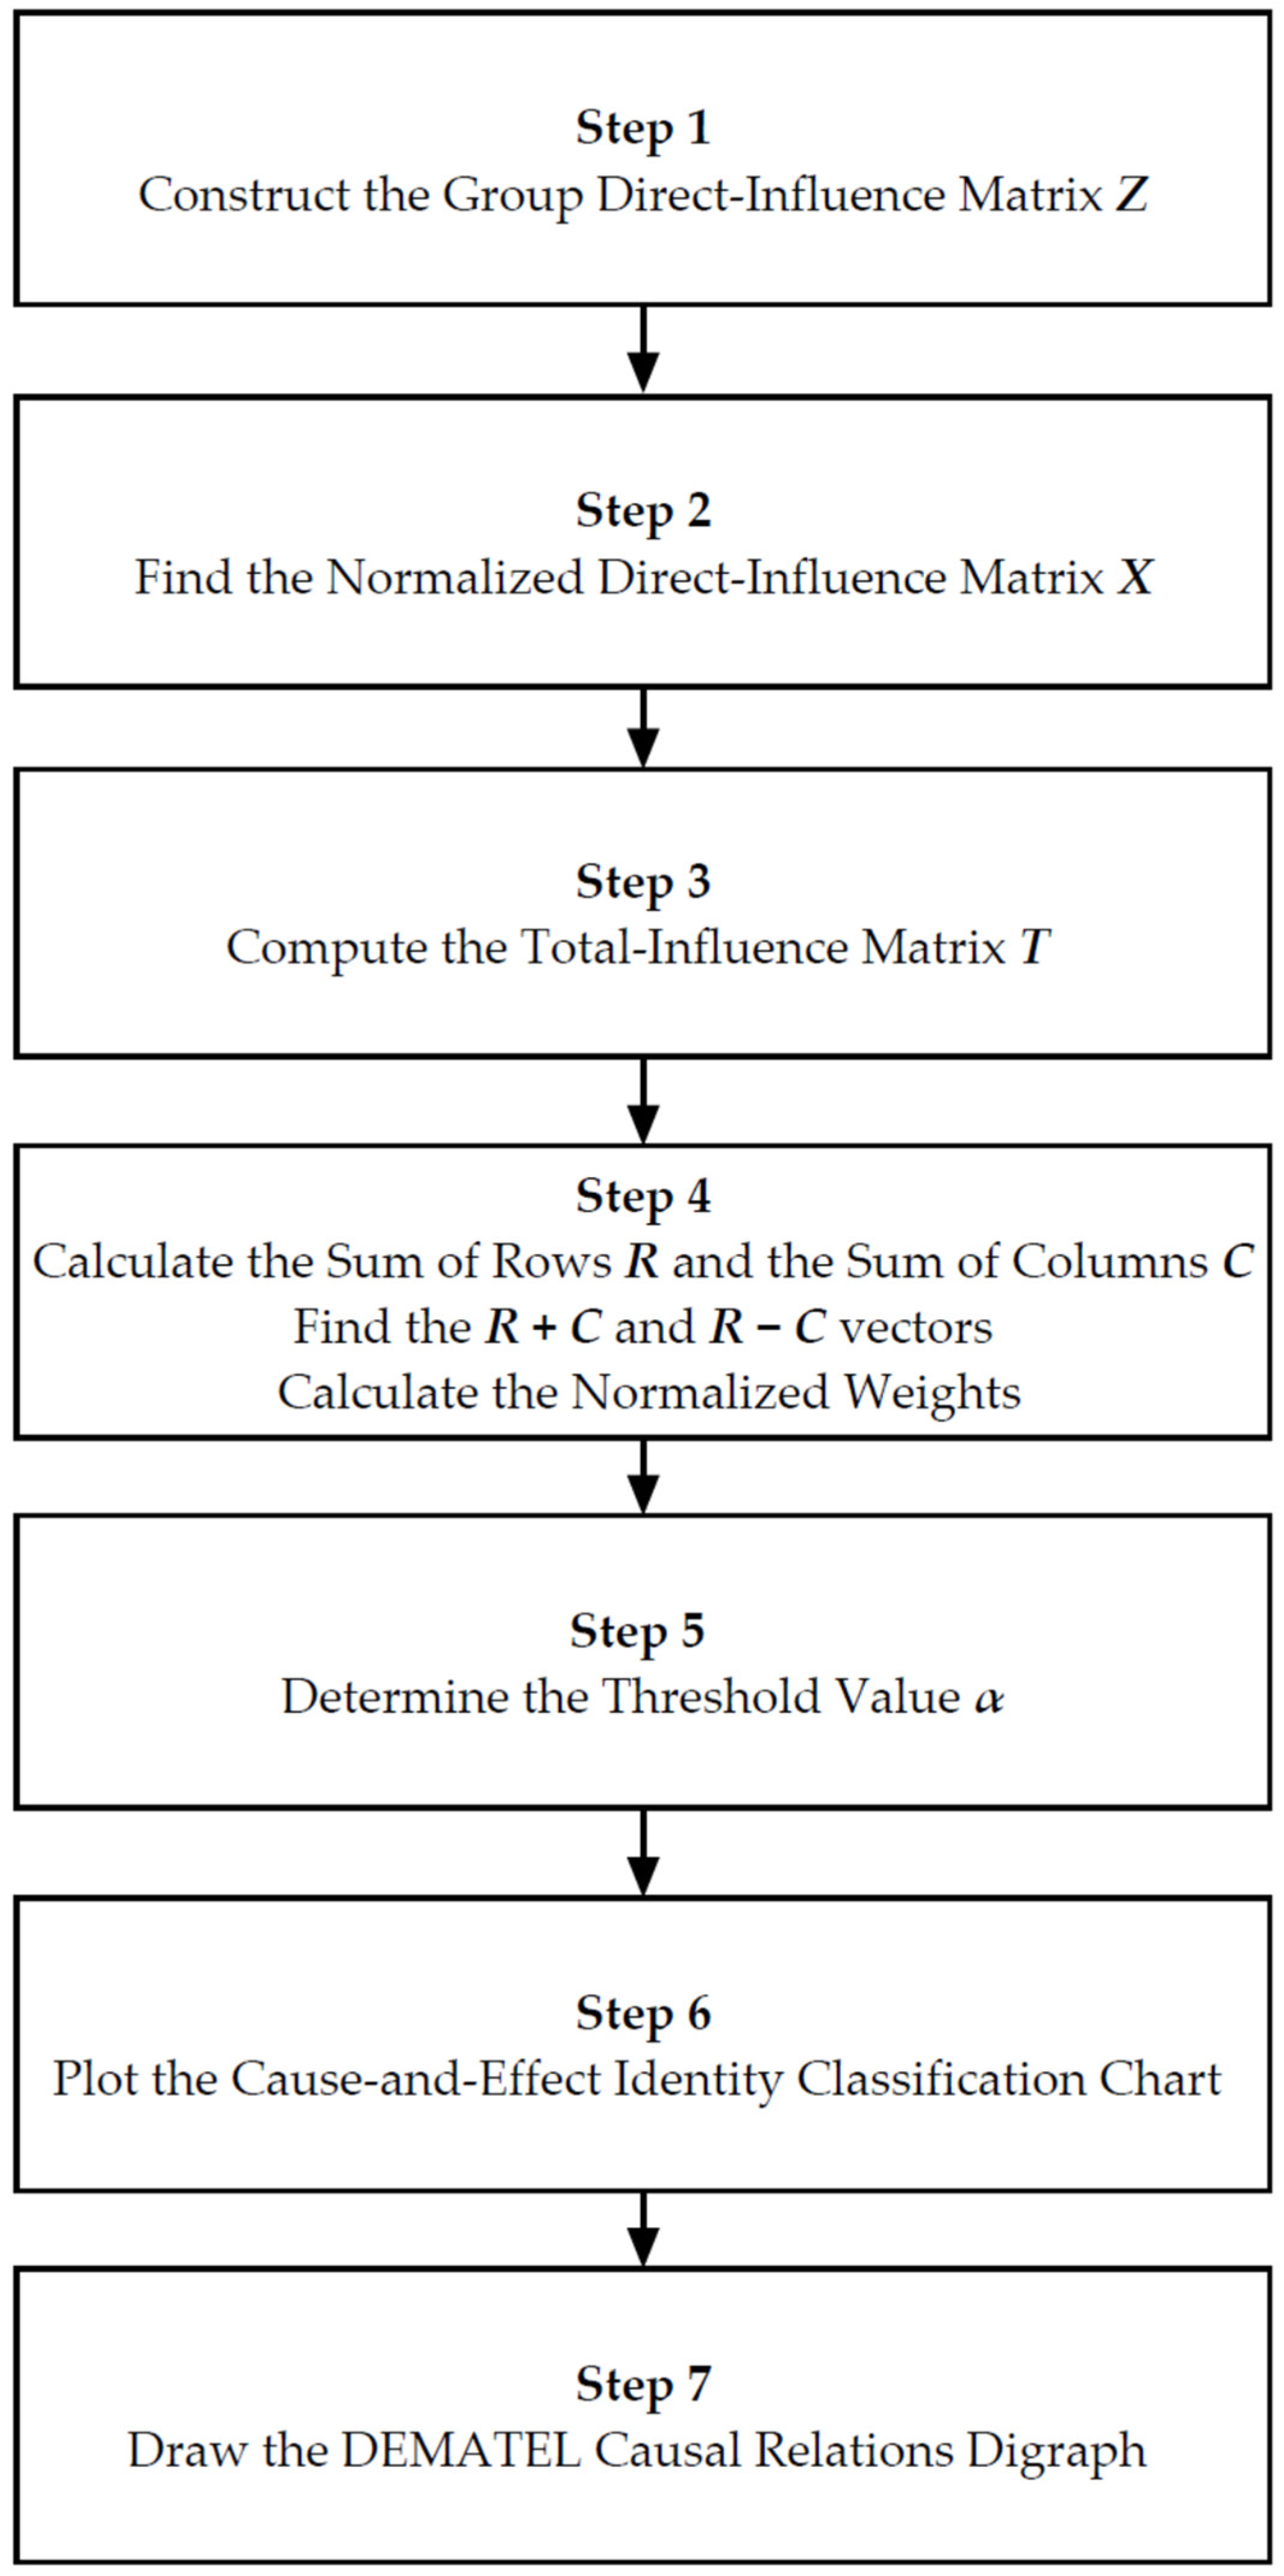
Figure 1, consisted of a sequence of seven phases [97,99].
The first step involved constructing the group direct-influence matrix Z, which entailed evaluating the connections among a set of n barriers B = {B1, B2, …, Bn}. Experts denoted as E = {E1, E2, …, El} assessed the relationships between the barriers under study. These experts were tasked with indicating the degree of direct effect of barrier Bi on barrier Bj pairs using the scale stated in Table 2.
The matrix Z k = z i j k n × n represents the opinions of experts Ek=1 to Ek=l on the direct impact of barrier Bi on Bj. Subsequently, the different influence evaluations of each participating expert, based on the comparison scale in Table 2, were consolidated to form a group direct-influence matrix Z = z i j n × n , as determined by Equation (1).
z i j = 1 l k = 1 l z i j k .                     i . j = 1 , 2 , . . . , n
The second step was to find the normalized direct-influence matrix X using the group direct-influence matrix Z computed in the first step. The normalized direct-influence matrix X, denoted as X = x i j n × n , was obtained by applying Equations (2) and (3). All the elements in set X adhere to the condition 0 x i j 1 , 0 j = 1 n x i j 1 , and at least one i such that j = 1 n z i j s .
X = Z s   .
s = m a x max 1 i n j = 1 n z i j , . max 1 i n i = 1 n z i j
In the third step of the procedure, the total-influence matrix T was computed using the normalized direct-influence matrix X created in the previous step. The computation of the total-influence matrix T, denoted as T = t i j n × n , was performed using Equation (4).
T = X + X 2 + X 3 + + X h = X I X 1             w h e n   h ,
where I is the identity matrix.
In the fourth step of the procedure, the sums of the rows and columns were calculated using the total-influence matrix T generated in the third step. The process involved determining the vectors R and C, representing the summation of the rows and columns in the matrix T. This was achieved by using Equations (5) and (6), respectively.
R = r i n × 1 = j = 1 n t i j 1 × n T
C = c j 1 × n = i = 1 n t i j 1 × n T ,
where ri: the ith row sum in the matrix T represents the effects emanating from barrier Bi to other barriers, and cj: the jth column sum in the matrix T represents the effects that barrier Bi receives from other barriers.
Afterward, let i = j, where i and j are elements of the set {1, 2, …, n}. The vector on the horizontal axis, denoted as (R + C) and referring to the prominence of barriers, and the vector on the vertical axis, denoted as (RC) and referring to their relations, were computed. The vector (R + C) indicates the level of significance of the barriers within the system. A greater (R + C) value indicates a stronger association with other barriers, whereas a lower (R + C) value suggests a weaker association with other barriers. The vector (RC) provides information on the relationships between the barriers. On the one hand, if the (rici) value is positive, the barrier Bi is recognized as a dispatcher barrier. It is then categorized into the cause group since it impacts other barriers within the system. On the other hand, if the (rici) yields a negative value, the barrier Bi is designated as a receiver barrier and is categorized under the effect group since other barriers within the system influence it.
Subsequently, the relative importance of each barrier was determined by computing the weight ωj of each barrier via the utilization of its (R + C) and (RC) values, denoting prominence and relation, respectively, as shown in Equation (7). Afterward, every discovered weight was normalized using Equation (8) and thereafter arranged in order of rank.
ω j = r j + c j 2 + r j c j 2
ω ´ j = ω j j = 1 n ω j
In the fifth step of the procedure, the threshold value α for distinguishing between insignificant and significant impacts of barrier relationships inside the matrix T was determined. Values in matrix T that were less than α were deemed insignificant, whereas values larger than or equal to α were regarded as significant impacts. The cause-and-effect identity classification chart (CEICC) and the DEMATEL causal relations digraph (CRD) use only strong influences. Typically, the determination of α depends on the decision-maker’s judgment in identifying all system barriers. This threshold value may be modified iteratively until a satisfactory CEICC and DEMATEL CRD are generated. In this study, the threshold value α was determined using Equation (9), which involves computing the mean value of all values within the matrix T, as described in Equation (4).
α = i = 1 n j = 1 n t i j n 2
The CEICC was plotted in the sixth step of the procedure. This chart was based on the cause-and-effect identity classification of the barriers, which was determined using the total-influence matrix T computed in the third step. The calculated sums of rows and columns from the fourth step were plotted in a chart format using (R + C, RC) as coordinates. The threshold value α determined in the fifth step was considered during this plotting process.
Finally, the DEMATEL CRD was created in the seventh step using the CEICC and the established threshold value α. This digraph illustrates the cause-and-effect links between barriers in the system. It offers valuable insights for decision-making pertaining to addressing the barriers to SC development.

4. Results

In the first step of the DEMATEL approach, a group of ten experts assessed the direct influences among the barriers to SC development listed in Table 1. The experts used the scale outlined in Table 2 for their evaluations. Therefore, a total of ten distinct impact matrices were generated, with each matrix derived from the perspective of a respective expert and encapsulating their unique viewpoints. Following this, each expert’s views were aggregated by computing the group direct-influence matrix Z using Equation (1), as shown in Table 3.
In the second step of the DEMATEL approach, the group direct-influence matrix Z (Table 3) was used to ascertain the normalized direct-influence matrix X. This calculation was performed utilizing Equations (2) and (3). According to Equation (3), the sums of the rows and columns of matrix Z (Table 3) yielded a maximum value of 32. This maximum value was used to normalize each value in matrix Z, as Equation (2) describes. Table 4 displays the normalized direct-influence matrix X obtained from the analysis.
In the third step of the DEMATEL approach, the normalized direct-influence matrix X, shown in Table 4, was used to derive the total-influence matrix T. This computation involved the application of Equation (4), whereby an identity matrix of size 12 was employed in this scenario. The total-influence matrix T is shown in Table 5.
In the fourth step of the DEMATEL approach, the total-influence matrix T (Table 5) was used to determine the summation of rows and columns vectors R and C. These calculations were performed using Equations (5) and (6). Subsequently, the vectors (R + C) and (RC) were computed to determine the significance and nature of the relationships among the barriers. Afterward, the relative importance and the normalized relative importance weights were calculated for each barrier using Equations (7) and (8), respectively, resulting in the ranking of the barriers. The data in Table 6 display the outcomes of the calculations. The findings presented in Table 6 indicate that seven of the twelve barriers examined (namely, B3, B5, B6, B7, B9, B11, and B12) fell within the category of dispatcher barriers. These barriers were identified as causal barriers to SC development. The five remaining barriers, B1, B2, B4, B8, and B10, were categorized as receiver barriers to SC development. The rankings of the barriers to SC development based on their relative relevance weights are also shown in Table 6. The presented data display a ranking system whereby barrier B2 was assigned the highest level of importance with a rank of 1. In contrast, barrier B11 was assigned the lowest level of importance, with a rank of 12 concerning the development of SCs.
In the fifth step of the DEMATEL approach, the threshold value α was determined using Equation (9), while Equation (4) was used to generate the total-influence matrix T, as shown in Table 5. The outcome yielded a threshold value α = 0.195. Based on the provided information, the values in the total-influence matrix T (Table 5) greater than or equal to α were shaded. These shaded values indicate barrier relationships with substantial impacts to be considered in the final model.
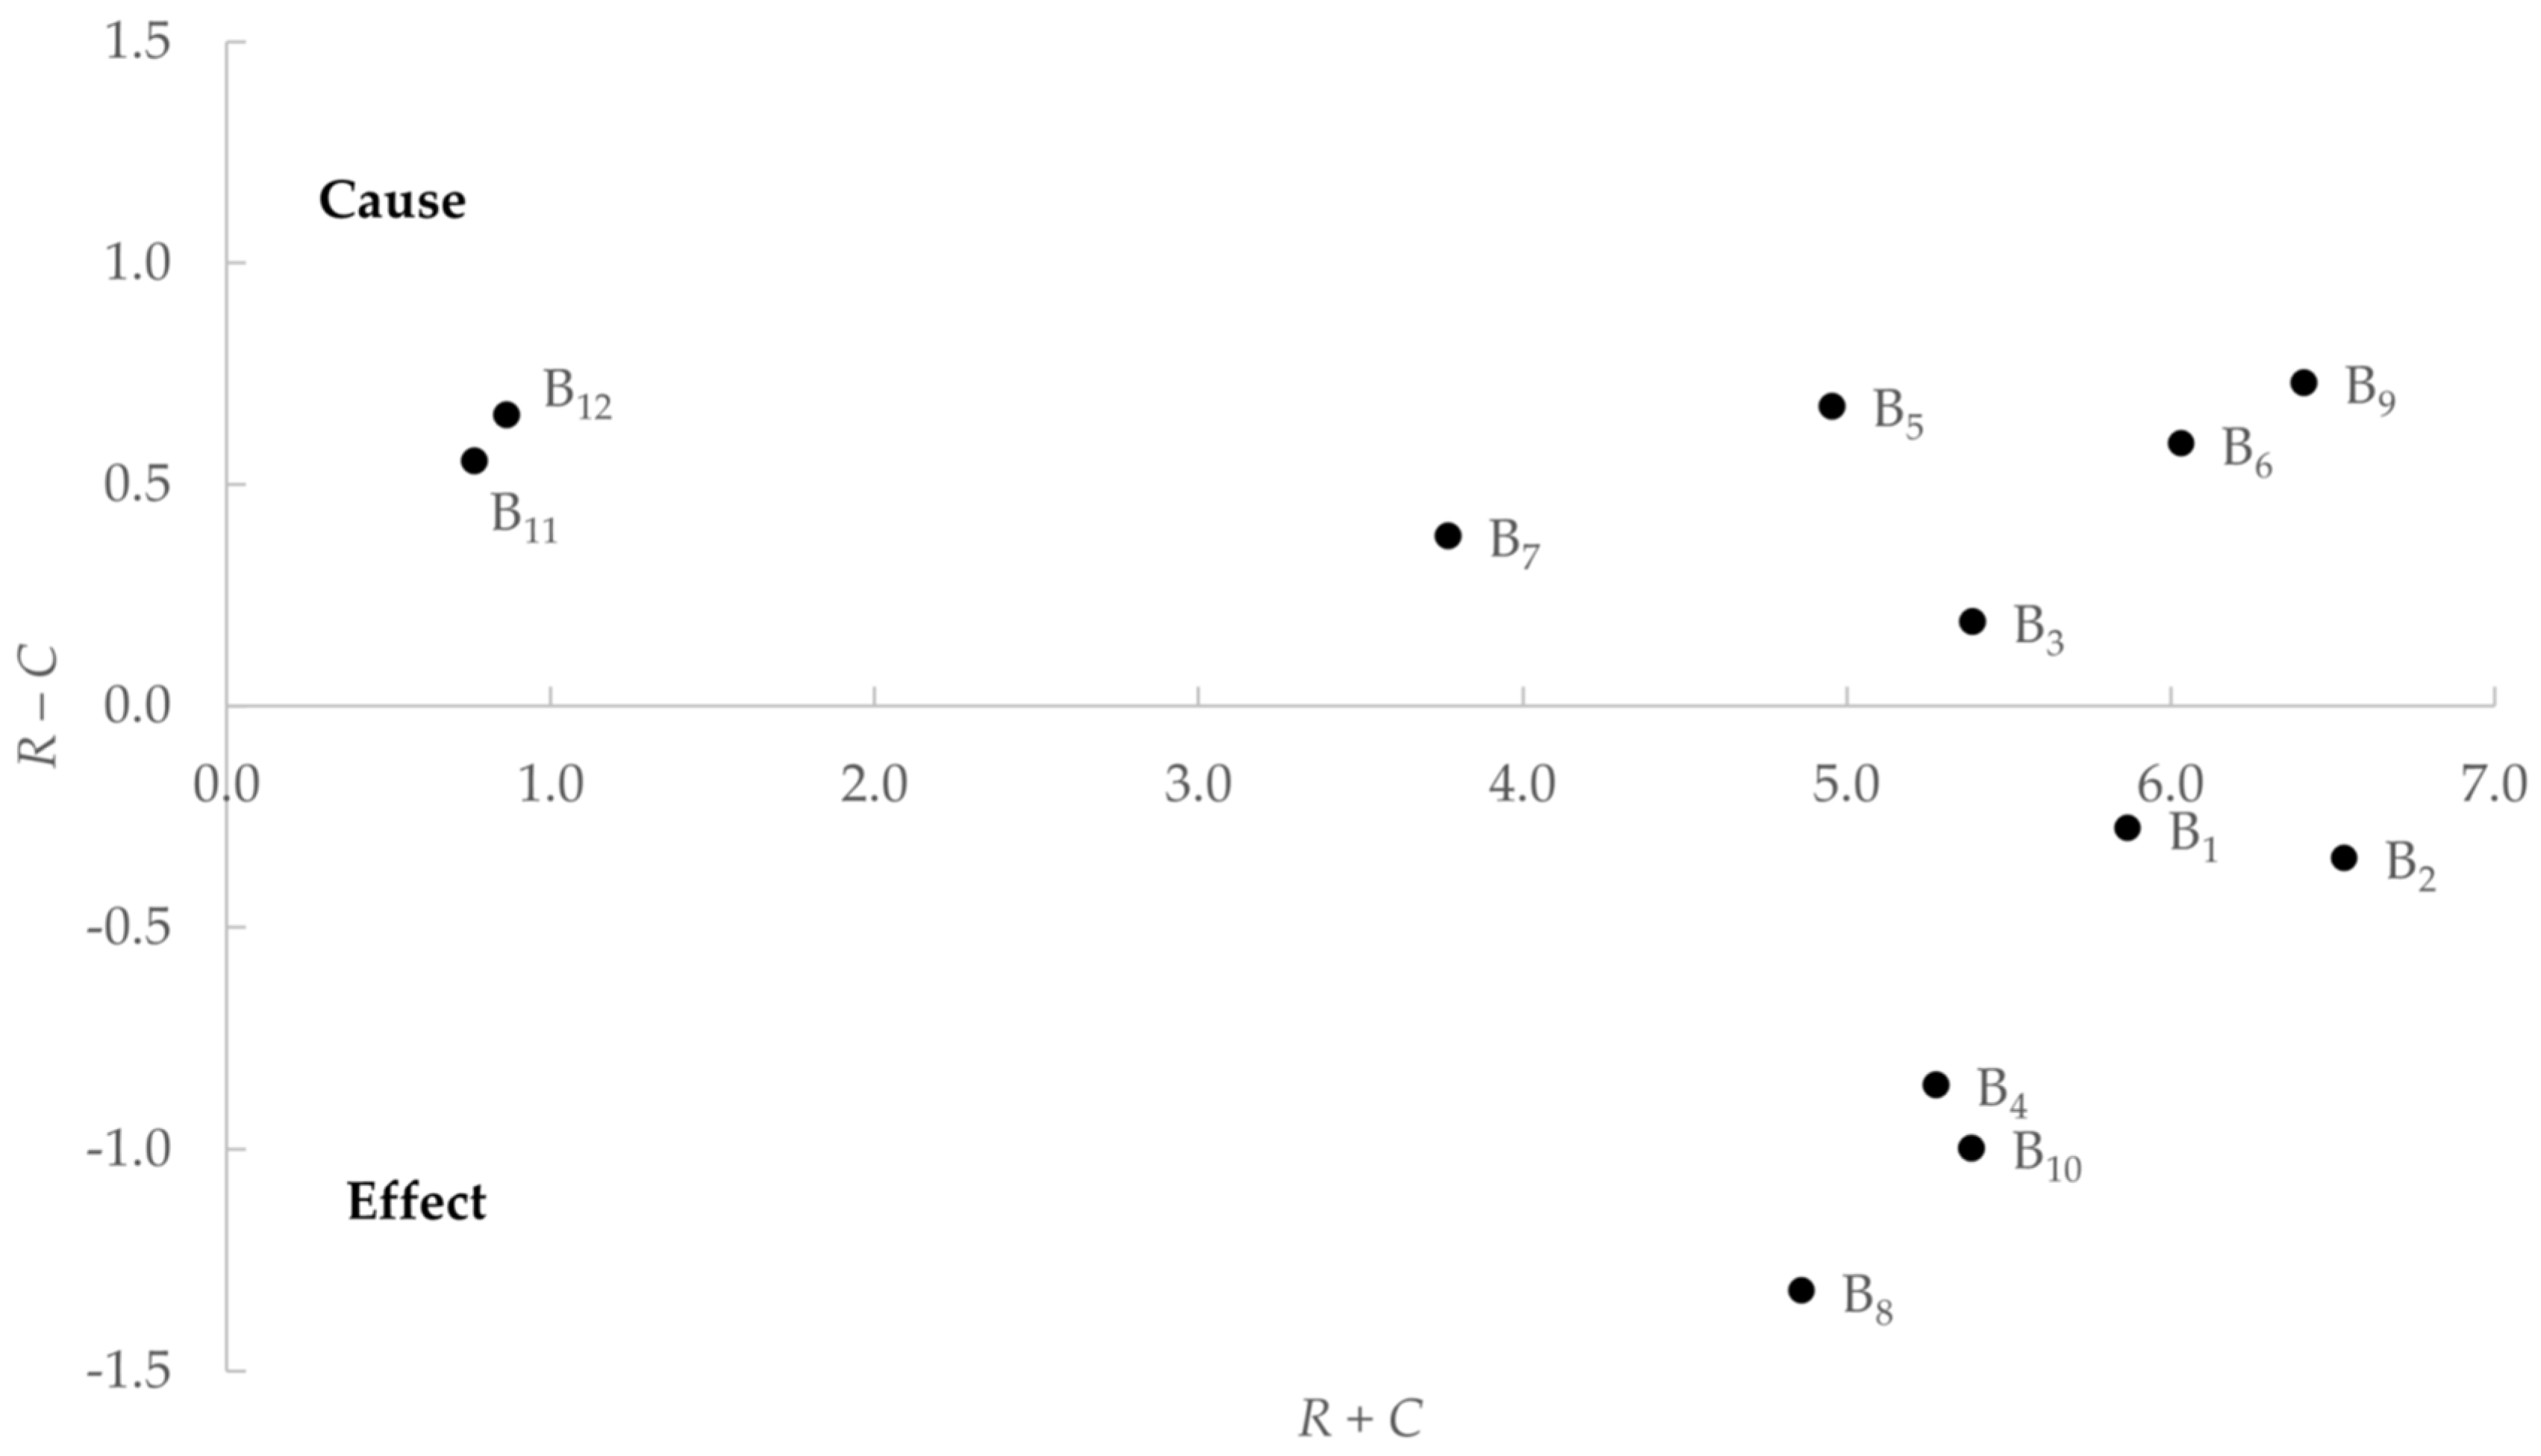
In the sixth step of the DEMATEL approach, the barriers were classified based on cause-and-effect relationships and represented using the coordinates (R + C, RC) in Table 6. This classification is shown in Figure 2 as the CEICC. The chart serves as a visual aid for understanding the division of barriers to SC development. Specifically, it illustrates that the seven barriers, namely B3, B5, B6, B7, B9, B11, and B12, are positioned above the axis, while the other five barriers, B1, B2, B4, B8, and B10, are located below the axis.
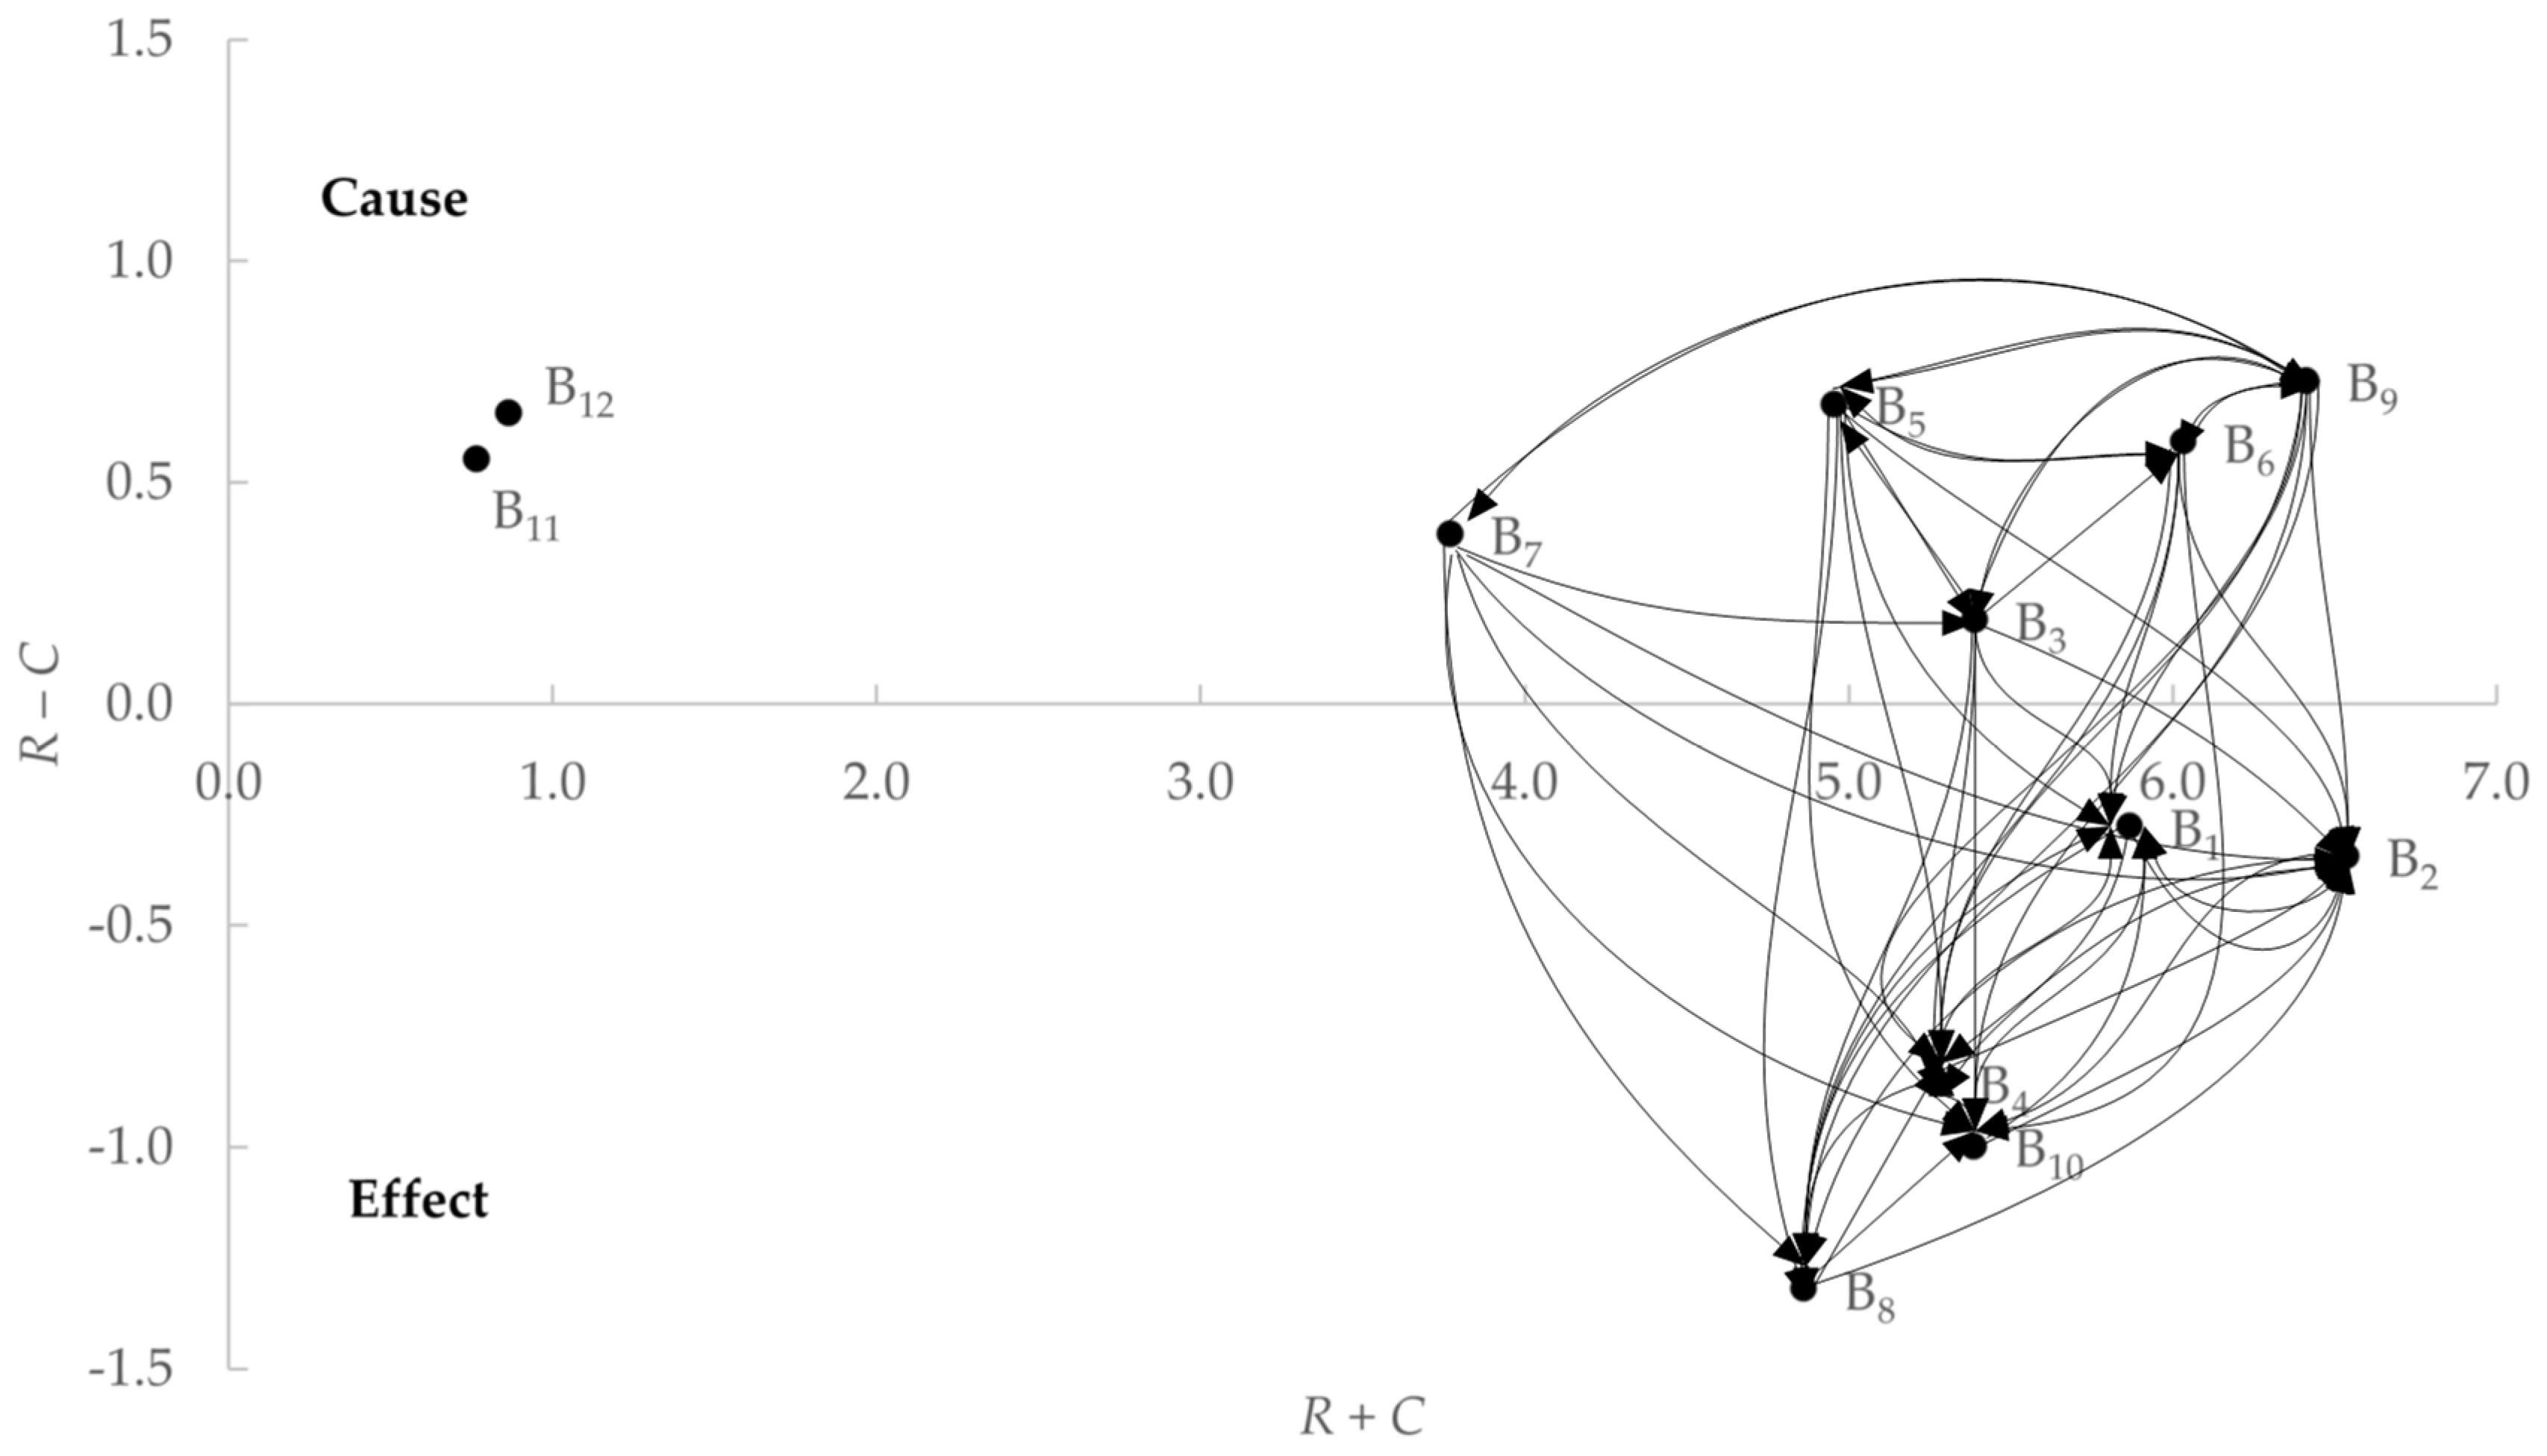
Finally, in the seventh step of the DEMATEL approach, the strong influences of barrier relationships were identified and represented by shaded T matrix cells in Table 5. The relative importance weights of these barriers and their corresponding ranks were determined and presented in Table 6. Additionally, the CEICC, depicted in Figure 2, was utilized to generate the DEMATEL CRD of barriers to the development of SCs, as illustrated in Figure 3.

5. Discussion

The findings derived from using the DEMATEL approach provide valuable insights for effectively resolving the primary barriers encountered in creating SCs. The causal diagram reveals the presence of several variables that exert substantial direct and indirect impacts. The primary factors contributing to hurdles include technical problems, insufficient infrastructure, and elevated implementation costs. These results are consistent with other research that has emphasized the challenges, in terms of both technology and finances, associated with the implementation of intelligent systems and digital infrastructure in diverse industries [100,101,102]. There is a need for an increased emphasis on developing advanced technologies appropriate for use in SCs and enhancing connection infrastructure inside urban areas. Governments must allocate significant resources to creating comprehensive information technology infrastructure, including general systems and specialized platforms tailored to specific activities.
The primary barriers identified were security and privacy issues, as well as a lack of coordinated planning. The interconnectivity inherent in SCs introduces novel security vulnerabilities that necessitate the implementation of advanced protective measures. Furthermore, it is essential to provide citizens with assurances about the ethical use of data and the safeguarding of their privacy. The continuous advancement of emerging technologies, such as the Internet of Things, artificial intelligence, and blockchain, gives rise to persistent concerns regarding privacy and security. This highlights the significance of implementing comprehensive cybersecurity policies, compliance structures, and supervision mechanisms. The engagement of stakeholders in the early phases of integrated planning is necessary for effective synergies across many domains. Conflicts among government departments and a lack of collaboration are long-standing concerns.
Notably, the absence of established norms and rules has a reciprocal relationship with other barriers, impacting them while also being affected by them. A lack of established rules creates difficulties in achieving interoperability, but developing suitable standards relies on insights gained through implementation and the active participation of all relevant parties. The cyclic nature of the connection emphasizes the iterative approach necessary for the gradual development of frameworks for SC initiatives.
Knowledge and skills gaps and a lack of awareness were identified as having comparatively minor effects. Nevertheless, it is essential to consider the indirect impacts of these variables on the overall outcome. Establishing human capital via educational and training programs is crucial for ensuring the long-term sustainability of SC projects. Enhancing public knowledge, particularly regarding the advantages of emerging technologies, is essential to foster engagement and acceptance of these technologies.
Collaborative governance models that entail the participation of individuals, private sector entities, and government agencies can address the limitations of isolated systems and facilitate the integration of diverse solutions. This intervention serves to mitigate barriers associated with insufficient coordination. The incentivization of innovation enables the stimulation of grassroots-level ideas via pilot financing, hackathons, and startup accelerators. The act of soliciting comments from a wide range of individuals via crowdsourcing serves to provide fresh and varied viewpoints. As technological advancements continue to accelerate, it is imperative to prioritize the continuous operability and maintenance requirements of deployed infrastructure. The consideration of life cycle costs is crucial in the development of sustainable business models.
The need for proactive risk assessment and the adoption of frameworks is evident. Not all barriers will diminish at the same rate. The implementation of transition management necessitates adopting a phased approach and periodically reassessing priorities in response to the changing dynamics and impacts of barriers over time. Regional and global relationships facilitate the acquisition of knowledge from exemplary practices used elsewhere in the world. The harmonization of standards across international boundaries further supports achieving interoperability and economies of scale. Establishing key performance indicators to measure progress and results is crucial in facilitating the adjustment of methods as necessary. Comparing and evaluating SC initiatives inside and between countries is also beneficial. Incorporating qualitative aspects, such as livability, social well-being, and environmental sustainability, in the assessment process offers a comprehensive overview of the effects of SC initiatives. Effective communication methods are essential for managing expectations, promoting openness in projects, and mitigating the hazards associated with exaggerated enthusiasm about new ideas. It is critical to have a long-term vision, political determination, and constant financial backing to maintain efforts in the face of problems within the complex transition sector.
Therefore, it is essential to adopt a comprehensive approach to effectively tackle the many types of identified barriers. The mitigation of the causal barriers may be facilitated by prioritizing technology and infrastructure development and allocating financial resources. Concurrently, it is essential to implement measures to mitigate the impact of barriers through integrated planning, stringent security protocols, and the development of participatory norms and regulations. Simultaneously, considering the human dimensions of skills, knowledge, and awareness might enhance endeavors to foster the sustainability of SCs.

6. Conclusions

This study has uncovered significant insights into the barriers to SC development using the DEMATEL approach. By identifying and analyzing the relationships among these barriers, we have provided a comprehensive understanding of their underlying causes and effects.
The practical implications of this research are twofold. First, the findings offer valuable guidance to decision-makers involved in developing SCs. By recognizing and understanding the barriers we have identified, policymakers, urban planners, and stakeholders can make informed decisions and develop targeted strategies. These strategies can address the specific challenges posed by inadequate infrastructure, limited funding, regulatory complexities, and cybersecurity concerns. Second, this study emphasizes the need for a holistic and integrated approach to overcome these barriers. Decision-makers can leverage our insights to develop comprehensive plans encompassing technical solutions, infrastructure development, strategic planning, and robust cybersecurity measures. By doing so, they can navigate the challenges and maximize the potential benefits of SC initiatives.
While this research contributes valuable insights, it is essential to acknowledge the study’s limitations. First, the analysis is based on expert opinions, which may introduce inherent biases and restrict the generalizability of our findings. Second, this research focuses primarily on identifying and analyzing barriers, leaving room for further investigation into potential solutions and their effectiveness. Additionally, the context-specific nature of the study necessitates careful consideration when applying the findings to different geographical regions or varying SC development stages.
We recommend exploring several avenues to address these limitations and foster future research. First, conducting empirical studies and engaging diverse stakeholders would help validate and expand upon the findings. Second, investigating innovative financing models, the leveraging of emerging technologies, and successful SC development strategies in different contexts would enhance the understanding of practical solutions. Third, evaluating the long-term impacts of overcoming barriers and assessing the scalability of successful SC initiatives would contribute to the broader knowledge base.
This study followed the DEMATEL approach due to its advantages, including its ability to (a) deal with the causality of complex system components, (b) use objective elements of a system that can be clearly defined to guide the analysis, (c) show how variables and constraints affect each other, (d) reveal the complex system’s features in detail, and (e) deal with causality, comparative strength, and network. However, the DEMATEL approach has some limitations, including its inability to uncover the barriers’ hierarchical structure. Therefore, using other structural approaches, such as interpretive structural modeling, is a future research direction. The fact that the input from the experts was based on their subjective judgments was also not considered. The DEMATEL approach bases the analysis on crisp values that do not reflect the ambiguity of the experts’ evaluations. Thus, it is recommended that future studies use the fuzzy extension of the DEMATEL approach. The study could also be replicated using input from another group of experts to validate and confirm the findings.
This study comprehensively analyzed the barriers to SC development, offering practical implications for decision-makers and stakeholders. While we acknowledge the limitations of this research, we believe that the findings can contribute to the advancement of sustainable and inclusive SCs. By leveraging these insights, decision-makers can navigate the complexities, address the challenges, and unlock the transformative potential of SC initiatives. We encourage further research in this field to build on this work and drive the progress of SCs toward a smarter and more sustainable future.

Author Contributions

Conceptualization, A.A.M. and A.Y.A.; methodology, A.A.M. and A.Y.A.; software, A.A.M. and A.Y.A.; validation, A.A.M. and A.Y.A.; formal analysis, A.A.M. and A.Y.A.; investigation, A.A.M. and A.Y.A.; resources, A.A.M. and A.Y.A.; data curation, A.Y.A.; writing—original draft preparation, A.A.M. and A.Y.A.; writing—review and editing, A.A.M. and A.Y.A.; visualization, A.A.M. and A.Y.A.; supervision, A.A.M. and A.Y.A.; project administration, A.A.M. and A.Y.A. All authors have read and agreed to the published version of the manuscript.

Funding

This research received no external funding.

Data Availability Statement

The data used in this study will be made available on request to the corresponding authors.

Acknowledgments

The authors would like to acknowledge and thank all participants.

Conflicts of Interest

The authors declare no conflicts of interest.

Appendix A

Table A1. Profiles of SC experts.
ExpertQualificationSectorYears of Experience *
E1Ph.D.National Cybersecurity Authority7
E2M.Sc.Ministry of Municipal Rural Affairs and Housing7
E3B.Sc.National Data Management Office7
E4Ph.D.Communication & Information Technology Commission6
E5M.Sc.Smart City Committee6
E6B.Sc.Smart City Committee6
E7Ph.D.Smart City Committee6
E8M.Sc.Smart City Committee4
E9B.Sc.National Cybersecurity Authority3
E10B.Sc.Ministry of Municipal Rural Affairs and Housing3
* Years of experience specific to SC-related roles only.

References

  1. United Nations, Department of Economic and Social Affairs, Population Division. World Urbanization Prospects: The 2018 Revision; Online Edition; United Nations: New York, NY, USA, 2018. [Google Scholar]
  2. Doheim, R.M.; Farag, A.A.; Badawi, S. Smart city vision and practices across the Kingdom of Saudi Arabia—A review. In Smart Cities: Issues and Challenges; Elsevier: Amsterdam, The Netherlands, 2019; pp. 309–332. [Google Scholar] [CrossRef]
  3. Albino, V.; Berardi, U.; Dangelico, R.M. Smart cities: Definitions, dimensions, performance, and initiatives. J. Urban Technol. 2015, 22, 3–21. [Google Scholar] [CrossRef]
  4. Dameri, R.P.; Cocchia, A. Smart city and digital city: Twenty years of terminology evolution. In Proceedings of the X Conference of the Italian Chapter of AIS, ITAIS, Milan, Italy, 14 December 2013; pp. 1–8. Available online: https://www.itais.org/proceedings/itais2013/pdf/119.pdf (accessed on 26 October 2023).
  5. Monzon, A. Smart cities concept and challenges: Bases for the assessment of smart city projects. In Proceedings of the International Conference on Smart Cities and Green ICT Systems, Lisbon, Portugal, 20–22 May 2015; pp. 1–11. Available online: https://ieeexplore.ieee.org/abstract/document/7297938 (accessed on 26 October 2023).
  6. Borins, S. Innovating with Integrity: How Local Heroes Are Transforming American Government; Georgetown University Press: Washington, DC, USA, 1998; Available online: https://scholar.google.com/scholar_lookup?title=Innovating+with+Integrity:+How+Local+Heroes+Are+Transforming+American+Government&author=Borins,+S.&publication_year=1998 (accessed on 26 October 2023).
  7. Light, P.C. Sustaining Innovation: Creating Nonprofit and Government Organizations that Innovate Naturally; Jossey-Bass: San Francisco, CA, USA, 1998; Available online: https://scholar.google.com/scholar_lookup?title=Sustaining+Innovation:+Creating+Nonprofit+and+Government+Organizations+that+Innovate+Naturally&author=Light,+P.C.&publication_year=1998 (accessed on 26 October 2023).
  8. Walker, R.M. An Empirical Evaluation of Innovation Types and Organizational and Environmental Characteristics: Towards a Configuration Framework. J. Public Adm. Res. Theory 2008, 18, 591–615. [Google Scholar] [CrossRef]
  9. Walker, R. Internal and External Influences on the Capacity for Innovation in Local Government. In Handbook of Innovation in Public Services; Osborne, S., Brown, L., Eds.; Edwar Elgar: Cheltenham, UK, 2013; pp. 496–513. Available online: https://scholar.google.com/scholar_lookup?title=Internal+and+external+influences+on+the+capacity+for+innovation+in+local+government&author=Walker,+R.&publication_year=2013&pages=496%E2%80%93513 (accessed on 26 October 2023).
  10. Hersperger, A.M.; Franscini, M.-P.G.; Kübler, D. Actors, decisions and policy changes in local urbanization. Eur. Plan. Stud. 2014, 22, 1301–1319. [Google Scholar] [CrossRef]
  11. Kaufmann, D. Comparing Urban Citizenship, Sanctuary Cities, Local Bureaucratic Membership, and Regularizations. Public Adm. Rev. 2019, 79, 443–446. [Google Scholar] [CrossRef]
  12. Kaufmann, D.; Sidney, M. Toward an Urban Policy Analysis: Incorporating Participation, Multilevel Governance, and “Seeing Like a City”. PS Political Sci. Politics 2020, 53, 1–5. [Google Scholar] [CrossRef]
  13. Kübler, D.; Rochat, P.E.; Woo, S.Y.; van der Heiden, N. Strengthen governability rather than deepen democracy: Why local governments introduce participatory governance. Int. Rev. Adm. Sci. 2020, 86, 409–426. [Google Scholar] [CrossRef]
  14. Shearmur, R.; Poirier, V. Conceptualizing nonmarket municipal entrepreneurship: Everyday municipal innovation and the roles of metropolitan context, internal resources, and learning. Urban Aff. Rev. 2017, 53, 718–751. [Google Scholar] [CrossRef]
  15. Rodriguez-Pose, A.; Wilkie, C. Understanding and Learning from an Evolving Geography of Innovation. In Handbook on the Geographies of Innovation; Shearmur, R., Carrincazeaux, C., Doloreux, D., Eds.; Edward Elgar Publishing: Cheltenham, UK, 2016; pp. 63–87. Available online: https://books.google.com.sa/books?hl=en&lr=&id=pvJ-DQAAQBAJ&oi=fnd&pg=PA63&dq=Understanding+and+learning+from+an+evolving+geography+of+innovation&ots=i6nONEeoam&sig=UYnL22KWJT9LgOSYmFofohEutd8&redir_esc=y#v=onepage&q=Understanding%20and%20learning%20from%20an%20evolving%20geography%20of%20innovation&f=false (accessed on 26 October 2023).
  16. Damanpour, F.; Schneider, M. Phases of the adoption of innovation in organizations: Effects of environment, organization, and top managers. Br. J. Manag. 2006, 17, 215–236. [Google Scholar] [CrossRef]
  17. Arduini, D.; Belotti, F.; Denni, M.; Giungato, G.; Zanfei, A. Technology adoption and innovation in public services the case of e-government in Italy. Inf. Econ. Policy 2010, 22, 257–275. [Google Scholar] [CrossRef]
  18. Gonzalez, R.; Llopis, J.; Gasco, J. Innovation in public services: The case of Spanish local government. J. Bus. Res. 2013, 66, 2024–2033. [Google Scholar] [CrossRef]
  19. Reginato, E.; Paglietti, P.; Fadda, I. Formal or Substantial Innovation: Enquiring the Internal Control System Reform in the Italian Local Government. Int. J. Bus. Manag. 2011, 6, 3–15. [Google Scholar] [CrossRef]
  20. Bhatti, Y.; Olsen, A.L.; Pedersen, L.H. Administrative professionals and the diffusion of innovations: The case of citizen service centres. Public Adm. 2011, 89, 577–594. [Google Scholar] [CrossRef]
  21. Hansen, M.B. Antecedents of Organizational Innovation: The Diffusion of New Public Management into Danish Local Government. Public Adm. 2011, 89, 285–306. [Google Scholar] [CrossRef]
  22. Kwon, M.; Berry, F.S.; Feiock, R.C. Understanding the Adoption and Timing of Economic Development Strategies in U.S. Cities Using Innovation and Institutional Analysis. J. Public Adm. Res. Theory 2009, 19, 967–988. [Google Scholar] [CrossRef]
  23. Shearmur, R.; Poirier, V. Exploring Municipal Innovation: Technological and Original Innovation in Municipalities; INRS: Quebec City, QC, Canada, 2016. [Google Scholar] [CrossRef]
  24. Etzkowitz, H. The Triple Helix: University–Industry–Government Innovation in Action; Routledge: New York, NY, USA; London, UK, 2008; 176p, Available online: https://mguntur.id/files/ebook/ebook_1605608206_cf742d707b4e0bf22bf3.pdf (accessed on 26 October 2023).
  25. Leydesdorff, L.; Deakin, M. The triple-helix model of smart cities: A neo-evolutionary perspective. J. Urban Technol. 2011, 18, 53–63. [Google Scholar] [CrossRef]
  26. Ranga, M.; Etzkowitz, H. Triple Helix Systems: An Analytical Framework for Innovation Policy and Practice in the Knowledge Society. Ind. High. Educ. 2013, 27, 237–262. [Google Scholar] [CrossRef]
  27. Ardito, L.; Ferraris, A.; Petruzzelli, A.; Bresciani, A.M.; Del Giudice, M. The role of universities in the knowledge management of smart city projects. Technol. Forecast. Soc. Chang. 2019, 142, 312–321. [Google Scholar] [CrossRef]
  28. Ferraris, A.; Belyaeva, Z.; Bresciani, S. The role of universities in the Smart City innovation: Multistakeholder integration and engagement perspectives. J. Bus. Res. 2020, 119, 163–171. [Google Scholar] [CrossRef]
  29. Ferru, M.; Rallet, A. Proximity dynamics and the geography of innovation: Diminishing returns or renewal? In Handbook on the Geographies of Innovation; Shearmur, R., Carrincazeaux, C., Doloreux, D., Eds.; Edward Elgar: Cheltenham, UK, 2016; pp. 100–126. [Google Scholar]
  30. Audretsch, D.B.; Feldman, M.P. R&D spillovers and the geography of innovation and production. Am. Econ. Rev. 1996, 86, 630–640. [Google Scholar]
  31. Feldman, M.P. The Geography of Innovation; Kluwer Academic: Dortbrecht, The Netherlands; Boston, MA, USA; London, UK, 1994; Available online: https://scholar.google.com/scholar_lookup?title=The+Geography+of+Innovation&author=Feldman,+M.P.&publication_year=1994 (accessed on 26 October 2023).
  32. Storper, M.; Venables, A. Buzz: Face-to-face contact and the urban economy. J. Econ. Geogr. 2004, 4, 351–370. [Google Scholar] [CrossRef]
  33. Boschma, R. Proximity and innovation: A critical assessment. Reg. Stud. 2005, 39, 61–74. [Google Scholar] [CrossRef]
  34. Coleman, J.S. Social capital in the creation of human capital. Am. J. Sociol. 1988, 94, S95–S120. [Google Scholar] [CrossRef]
  35. Uzzi, B. Social structure and competition in interfirm networks: The paradox of embeddedness. Adm. Sci. Q. 1997, 42, 35–67. [Google Scholar] [CrossRef]
  36. Mandell, M.P.; Keast, R. Innovation, networks and leadership. In Handbook of Innovation in Public Services; Edward Elgar: Cheltenham, UK, 2013; pp. 347–359. Available online: https://researchportal.scu.edu.au/esploro/outputs/bookChapter/Innovation-networks-and-leadership/991012821306102368 (accessed on 26 October 2023).
  37. The World Bank. High-Density Cities Hold the Key to Transforming Economic Geography. 2017. Available online: https://www.worldbank.org/en/news/feature/2017/01/26/high-density-cities-hold-the-key-to-transforming-economic-geography (accessed on 26 October 2023).
  38. Wenban-Smith, H. Economies of Scale, Distribution Costs and Density Effects in Urban Water Supply: A Spatial Analysis of the Role of Infrastructure in Urban Agglomeration. Ph.D. Thesis, The London School of Economics and Political Science (LSE), London, UK, 2009. [Google Scholar]
  39. McKinsey & Company. Urban World: Mapping the Economic Power of Cities. 2011. Available online: https://www.mckinsey.com/~/media/mckinsey/featured%20insights/urbanization/urban%20world/mgi_urban_world_mapping_economic_power_of_cities_full_report.pdf (accessed on 26 October 2023).
  40. Angelakis, V.; Tragos, E.; Pöhls, H.; Kapovits, A.; Bassi, A. (Eds.) Designing, Developing, and Facilitating Smart Cities; Springer: Cham, Switzerland, 2017. [Google Scholar] [CrossRef]
  41. Arif, A.; Barrigon, F.A.; Gregoretti, F.; Iqbal, J.; Lavagno, L.; Lazarescu, M.T.; Ma, L.; Palomino, M.; Segura, J.L.L. Performance and Energy-Efficient Implementation of a Smart City Application on FPGAs. Real-Time Image Process. 2020, 17, 729–743. [Google Scholar] [CrossRef]
  42. Xi, S.; Zhang, C.; Cai, Z.; Xu, Y. Cost Control and Project Cost Analysis of Intelligent Building under Internet of Things. Mob. Inf. Syst. 2021, 2021, 8217040. [Google Scholar] [CrossRef]
  43. Rodríguez-Molano, J.I.; Contreras-Bravo, L.E.; López-Santana, E.R. Big Data Tools for Smart Cities. In Data Mining and Big Data. DMBD 2018; Tan, Y., Shi, Y., Tang, Q., Eds.; Lecture Notes in Computer Science; Springer: Cham, Switzerland, 2018; Volume 10943. [Google Scholar] [CrossRef]
  44. Senturk, I.F. Cooperative mobile data collection in smart cities. Univ. Thought Publ. Nat. Sci. 2020, 10, 63–68. [Google Scholar] [CrossRef]
  45. Barnaghi, P.; Bermudez-Edo, M.; Tönjes, R. Challenges for quality of data in smart cities. J. Data Inf. Qual. 2015, 6, 1–4. [Google Scholar] [CrossRef]
  46. Bansal, N.; Mukherjee, M.; Gairola, A. Smart Cities and Disaster Resilience. In From Poverty, Inequality to Smart City; Springer: Singapore, 2017; pp. 109–122. [Google Scholar] [CrossRef]
  47. Alazawi, Z.; Alani, O.; Abdljabar, M.B.; Altowaijri, S.; Mehmood, R. A Smart Disaster Management System for Future Cities. In Proceedings of the 2014 ACM International Workshop on Wireless and Mobile Technologies for SMART Cities, Philadelphia, PA, USA, 11 August 2014; pp. 1–10. [Google Scholar] [CrossRef]
  48. Pacheco, J.; Tunc, C.; Hariri, S. Design and evaluation of resilient infrastructures systems for smart cities. In Proceedings of the 2016 IEEE International Smart Cities Conference (ISC2), Trento, Italy, 12–15 September 2016. [Google Scholar] [CrossRef]
  49. Raja, G.B. Chapter 3: Effective Waste Management System for Smart Cities. Intelligent Green Technologies for Sustainable Smart Cities. In Intelligent Green Technologies for Sustainable Smart Cities; Tripathi, S.L., Ganguli, S., Magradze, T., Kumar, A., Eds.; WILEY Online Library: Hoboken, NJ, USA, 2022; pp. 33–52. [Google Scholar] [CrossRef]
  50. Aithal, P.S. Smart city waste management through ICT and IoT driven solution. Int. J. Appl. Eng. Manag. Lett. (IJAEML) 2021, 5, 51–65. [Google Scholar]
  51. Singh, R.; Kumar, A.; Tripathi, R. Smart Waste Management System using IoT. Int. J. Res. Appl. Sci. Eng. Technol. 2020, 8, 275–278. [Google Scholar] [CrossRef]
  52. Kumar, M.; Kumari, N.; Tomar, S.; Kumar, T. Smart Public Transportation for Smart Cities. In Proceedings of the International Conference on Advances in Engineering Science Management & Technology (ICAESMT)—2019, Dehradun, India, 15 March 2019. [Google Scholar] [CrossRef]
  53. Legaspi, J.; Bhada, S.V.; Mathisen, P.; DeWinter, J. Smart City Transportation: A Multidisciplinary Literature Review. In Proceedings of the 2020 IEEE International Conference on Systems, Man, and Cybernetics (SMC), Toronto, ON, Canada, 11–14 October 2020. [Google Scholar] [CrossRef]
  54. Patil, R.R.; Honmane, V.N. Smart Transportation for Smart Cities. In Soft Computing Systems. ICSCS 2018; Zelinka, I., Senkerik, R., Panda, G., Lekshmi Kanthan, P., Eds.; Communications in Computer and Information Science; Springer: Singapore, 2018; Volume 837. [Google Scholar] [CrossRef]
  55. Myeong, S.; Shahzad, K. Integrating Data-Based Strategies and Advanced Technologies with Efficient Air Pollution Management in Smart Cities. Sustainability 2021, 13, 7168. [Google Scholar] [CrossRef]
  56. Myeong, S.; Shahzad, K. How to Integrate the Data-based Strategies and Advanced Technologies into Efficient Air Pollution Management in Smart Cities? Preprints.org 2021, 1–17. [Google Scholar] [CrossRef]
  57. Yoganand, S.; Nithya, A.; Chithra, S. A Low Cost Pollution Free System (PFS) for Smart Cities Using Internet of Things. J. Emerg. Technol. Innov. Res. 2019, 6, 266–270. [Google Scholar]
  58. Araral, E. Why do cities adopt smart technologies? Contingency theory and evidence from the United States. Cities 2020, 106, 102873. [Google Scholar] [CrossRef]
  59. Bremser, C.; Piller, G.; Helfert, M. Technology Adoption in Smart City Initiatives: Starting Points and Influence Factors. In Proceedings of the 8th International Conference on Smart Cities and Green ICT Systems (SMARTGREENS 2019), Heraklion, Greece, 3–5 May 2019; pp. 70–79. [Google Scholar] [CrossRef]
  60. Wahidayat Putra, Z.D.; van der Knaap, W. 6—A smart city needs more than just technology: Amsterdam’s Energy Atlas project. In Smart City Emergence. Cases from around the World; Elsevier: Amsterdam, The Netherlands, 2019; pp. 129–147. [Google Scholar] [CrossRef]
  61. Matova, N.I. The Problems and Conditions of Effective Public Participation in Creating a Smart Sustainable City. Sci. J. VolSU Glob. Econ. Syst. 2019, 21, 65–77. [Google Scholar] [CrossRef]
  62. Ghonimi, I.G. Smart City: A Question of Social Sustainability in Urban Spaces? Assessing The Impacts of ICT on Changing Urban Behavioral Patterns in Urban Spaces of Madinaty, Egypt. J. Urban Res. 2021, 42, 70–96. [Google Scholar] [CrossRef]
  63. Ferraris, A.; Santoro, G.; Pellicelli, A.C. “Openness” of public governments in smart cities: Removing the barriers for innovation and entrepreneurship. Int. Entrep. Manag. J. 2020, 16, 1259–1280. [Google Scholar] [CrossRef]
  64. Roche, S. Geographic information science II: Less space, more places in smart cities. Prog. Hum. Geogr. 2016, 40, 565–573. [Google Scholar] [CrossRef]
  65. Lara, A.P.; Da Costa, E.M.; Furlani, T.Z.; Yigitcanla, T. Smartness that matters: Towards a comprehensive and human-centred characterisation of smart cities. J. Open Innov. Technol. Mark. Complex. 2016, 2, 8. [Google Scholar] [CrossRef]
  66. Tabane, S.M.N.E.; Zuva, T. Survey of Smart City Initiatives Towards Urbanization. In Proceedings of the 2016 Third International Conference on Advances in Computing and Communication Engineering (ICACCE) 2016, Durban, South Africa, 28–29 November 2016. [Google Scholar] [CrossRef]
  67. Arora, R.U. Financial sector development and smart cities: The Indian case. Sustain. Cities Soc. 2018, 42, 52–58. [Google Scholar] [CrossRef]
  68. Soe, R.-M.; Mikheeva, O. Combined Model of Smart Cities and Electronic Payments. In Proceedings of the 2017 Conference for E-Democracy and Open Government (CeDEM), Krems, Austria, 17–19 May 2017. [Google Scholar] [CrossRef]
  69. Kumar, T.M.V. Smart Economy in Smart Cities: International Collaborative Research: Ottawa, St. Louis, Stuttgart, Bologna, Cape Town, Nairobi, Dakar, Lagos, New Delhi, Varanasi, Vijayawada, Kozhikode, Hong Kong; Springer: Berlin/Heidelberg, Germany, 2017. [Google Scholar] [CrossRef]
  70. Sánchez-Segura, M.; Dugarte-Peña, G.; Amescua, A.; Medina-Domínguez, F.; López-Almansa, E.; Reyes, E.B. Smart occupational health and safety for a digital era and its place in smart and sustainable cities. Math. Biosci. Eng. MBE 2021, 18, 8831–8856. [Google Scholar] [CrossRef]
  71. Lustosa, T.C.; Iano, Y.; de Oliveira, G.G.; Vaz, G.C.; Reis, V.S. Safety Management Applied to Smart Cities Design. In Proceedings of the 6th Brazilian Technology Symposium (BTSym’20). BTSym 2020; Iano, Y., Saotome, O., Kemper, G., Mendes de Seixas, A.C., Gomes de Oliveira, G., Eds.; Smart Innovation, Systems and Technologies; Springer: Cham, Switzerland, 2021; Volume 233. [Google Scholar] [CrossRef]
  72. Al-Dulaimi, J.; Cosmas, J. Smart Safety & Health Care in Cities. Procedia Comput. Sci. 2016, 98, 259–266. [Google Scholar] [CrossRef]
  73. Walser, K.; Haller, S. Smart Governance in Smart Cities. In Smart City; Meier, A., Portmann, E., Eds.; Edition HMD; Springer Vieweg: Wiesbaden, Germany, 2016; pp. 19–46. [Google Scholar] [CrossRef]
  74. Bolívar, M.P.R.; Meijer, A.J. Smart Governance: Using a Literature Review and Empirical Analysis to Build a Research Model. Soc. Sci. Comput. Rev. 2016, 34, 673–692. [Google Scholar] [CrossRef]
  75. Bolivar, M.P.R. Governance in smart cities: A comparison of practitioners’ perceptions and prior research. Int. J. E-Plan. Res. 2018, 7, 1–19. [Google Scholar] [CrossRef]
  76. Patel, M.R.; Vashi, M.P.; Bhatt, B.V. SMART-Multi-Criteria Decision-Making Technique for Use in Planning Activities. In Proceedings of the New Horizons in Civil Engineering, Surat, India, 25–26 March 2017; Available online: https://bvbhatt.com/wp-content/uploads/2018/04/NHCE-2017_SMART-Multi-criteria-decision-making-technique-for-use-in-planning-activities.pdf (accessed on 26 October 2023).
  77. Ozkaya, G.; Erdin, C. Evaluation of smart and sustainable cities through a hybrid MCDM approach based on ANP and TOPSIS technique. Heliyon 2020, 6, e05052. [Google Scholar] [CrossRef] [PubMed]
  78. Zapolskytė, S.; Burinskienė, M.; Trepanier, M. Evaluation criteria of smart city mobility system using MCDM method. Balt. J. Road Bridge Eng. 2020, 15, 196–224. [Google Scholar] [CrossRef]
  79. Broniewicz, E.; Ogrodnik, K. Multi-criteria analysis of transport infrastructure projects. Transp. Res. Part D Transp. Environ. 2020, 83, 102351. [Google Scholar] [CrossRef]
  80. Erdogan, M.; Kaya, I. Prioritizing failures by using hybrid multi criteria decision making methodology with a real case application. Sustain. Cities Soc. 2019, 45, 117–130. [Google Scholar] [CrossRef]
  81. Farooq, A.; Xie, M.; Stoilova, S.; Ahmad, F. Multicriteria evaluation of transport plan for high-speed rail: An application to Beijing-Xiongan. Math. Probl. Eng. 2019, 2019, 8319432. [Google Scholar] [CrossRef]
  82. Stankovic, M.; Gladovic, P.; Popovic, V. Determining the importance of the criteria of traffic accessibility using fuzzy AHP and rough AHP method. Decis. Mak. Appl. Manag. Eng. 2019, 2, 86–104. [Google Scholar] [CrossRef]
  83. Farooq, A.; Xie, M.; Stoilova, S.; Ahmad, F.; Guo, M.; Williams, E.J.; Gahlot, V.K.; Yan, D.; Issa, A.M. Transportation planning through GIS and multicriteria analysis: Case study of Beijing and XiongAn. J. Adv. Transp. 2018, 2018, 2696037. [Google Scholar] [CrossRef]
  84. Farooq, A.; Stoilova, S.; Ahmad, F.; Alam, M.; Nassar, H.; Qaiser, T.; Iqbal, K.; Qadir, A.; Ahmad, M. An integrated multi-criteria decision-making approach to evaluate traveler modes’ priority: An application to Peshawar, Pakistan. J. Adv. Transp. 2021, 2021, 5564286. [Google Scholar] [CrossRef]
  85. Rondini, A.; Lagorio, A.; Pinto, R.; Pezzotta, G. A multi-criteria decision making approach for prioritising product-service systems implementation in smart cities. Int. J. Manag. Decis. Mak. 2018, 17, 415–446. [Google Scholar] [CrossRef]
  86. Bhutia, P.W.; Phipon, R. Application of AHP and TOPSIS method for supplier selection problem. IOSR J. Eng. 2012, 2, 43–50. [Google Scholar] [CrossRef]
  87. Gagliardi, F.; Roscia, M.; Lazaroiu, G. Evaluation of sustainability of a city through fuzzy logic. Energy 2007, 32, 795–802. [Google Scholar] [CrossRef]
  88. Lazaroiu, G.C.; Roscia, M. Definition methodology for the smart cities model. Energy 2012, 47, 326–332. [Google Scholar] [CrossRef]
  89. Lee, J.H.; Hancock, M.G.; Hu, M.-C. Towards an effective framework for building smart cities: Lessons from Seoul and San Francisco. Technol. Forecast. Soc. Chang. 2014, 89, 80–99. [Google Scholar] [CrossRef]
  90. Lombardi, P.; Giordano, S.; Farouh, H.; Yousef, W. Modelling the smart city performance. Innov. Eur. J. Soc. Sci. Res. 2012, 25, 137–149. [Google Scholar] [CrossRef]
  91. Auci, S.; Mundula, L. Smart Cities and a Stochastic Frontier Analysis: A Comparison among European Cities. SSRN Electron. J. 2012, 2012, 1–39. [Google Scholar] [CrossRef]
  92. Lee, S.K.; Mogi, G.; Hui, K.S. A fuzzy analytic hierarchy process (AHP)/data envelopment analysis (DEA) hybrid model for efficiently allocating energy R&D resources: In the case of energy technologies against high oil prices. Renew. Sustain. Energy Rev. 2013, 21, 347–355. [Google Scholar] [CrossRef]
  93. Lee, S.K.; Mogi, G.; Li, Z.; Hui, K.S.; Lee, S.K.; Hui, K.N. Measuring the relative efficiency of hydrogen energy technologies for implementing the hydrogen economy: An integrated fuzzy AHP/DEA approach. Int. J. Hydrogen Energy 2011, 36, 12655–12663. [Google Scholar] [CrossRef]
  94. Alqahtani, A.Y.; Makki, A.A. Barriers to the Sustainable Implementation of Environmentally Conscious Manufacturing: A Contextual-Based Interpretive Structural Model. Sustainability 2022, 14, 10066. [Google Scholar] [CrossRef]
  95. Makki, A.A.; Alqahtani, A.Y. Modeling the Enablers to FinTech Innovation in Saudi Arabia: A Hybrid Approach Using ISM and ANP. Systems 2022, 10, 181. [Google Scholar] [CrossRef]
  96. Makki, A.A.; Alqahtani, A.Y. Modeling the Barriers Surrounding Digital Government Implementation: Revealing Prospect Opportunities in Saudi Arabia. Sustainability 2022, 14, 15780. [Google Scholar] [CrossRef]
  97. Alqahtani, A.Y.; Makki, A.A. A DEMATEL-ISM Integrated Modeling Approach of Influencing Factors Shaping Destination Image in the Tourism Industry. Adm. Sci. 2023, 13, 201. [Google Scholar] [CrossRef]
  98. Hanine, M.; Boutkhoum, O.; El Barakaz, F.; Lachgar, M.; Assad, N.; Rustam, F.; Ashraf, I. An Intuitionistic Fuzzy Approach for Smart City Development Evaluation for Developing Countries: Moroccan Context. Mathematics 2021, 9, 2668. [Google Scholar] [CrossRef]
  99. Thakkar, J.J. Multi-Criteria Decision Making; Springer: Berlin/Heidelberg, Germany, 2021; Volume 336. [Google Scholar]
  100. Manny, L.; Duygan, M.; Fischer, M.; Rieckermann, J. Barriers to the digital transformation of infrastructure sectors. Policy Sci. 2021, 54, 943–983. [Google Scholar] [CrossRef]
  101. Abutabenjeh, S.; Nukpezah, J.A.; Azhar, A. Do Smart Cities Technologies Contribute to Local Economic Development? Econ. Dev. Q. 2022, 36, 3–16. [Google Scholar] [CrossRef]
  102. Sahoo, S.S.; Kumar, A.; Decky, M.; Wong, S.C.; Merrett, G.V.; Zhao, Y.; Wang, J.; Wang, X.; Singh, A.K. Emergent design challenges for embedded systems and paths forward: Mixed-criticality, energy, reliability and security perspectives. In Proceedings of the 2021 International Conference on Hardware/Software Codesign and System Synthesis, Virtual, 10–13 October 2021; pp. 1–10. [Google Scholar] [CrossRef]
Figure 1. The DEMATEL approach procedure flowchart.
Urbansci 08 00010 g001
Figure 2. CEICC of barriers to SC development.
Urbansci 08 00010 g002
Figure 3. DEMATEL CRD of barriers to SC development.
Urbansci 08 00010 g003
Table 1. Barriers to SC development.
SymbolBarrierDescriptionReferences
B1Costs of Designing and Operating CitiesThe cost of designing a SC can be a one-time cost. However, the costs of operating and maintaining the city can build up over time.[40,41,42]
B2Excessive and Complex Data Collection and AnalysisData volumes in SCs tend to grow exponentially. Therefore, there is a need to transfer, store, and analyze enormous bulks of data.[43,44,45]
B3Lack of City Disasters and System Failures ManagementThe increasing number of disasters and the complexity of operations lead to failures, negatively affecting SC development.[46,47,48]
B4Resource Waste ManagementPoor consumer waste collection, unsustainable energy sources, and a lack of systems to prevent waste generation are essential barriers that SCs should consider while in development.[49,50,51]
B5Lack of Accessible Transportation MethodsThe lack of accessible transport methods causes a dependency on cars that not everyone can afford. Furthermore, it causes increased traffic in urban areas and simultaneously decreases air quality.[52,53,54]
B6Pollution (Gas, Liquids, and Solids)Rapid urbanization and population growth contribute to decreased air quality, an increase in landfills, and pollution in water bodies.[55,56,57]
B7Lack of Technology Adoption and ImplementationImplementing and adopting information technology is a major factor in the growth of any city’s economy. It allows for timely and efficient operations and satisfies industries and individuals.[58,59,60]
B8Lack of Social Awareness and ResponsibilityLack of citizen participation coupled with low community consciousness causes a lack of social awareness and responsibility in critical decision-making.[61,62,63]
B9Lack of Space Utilization (Houses, Schools, and Commercial Space)Space utilization is important for urban developers to understand how efficiently a place is being used to improve existing or future infrastructure.[64,65,66]
B10Undiversified Economy and FinancesDependence on exporting a dominant commodity makes the economy vulnerable to unpredictable factors. Having diversification helps manage stable growth and development.[67,68,69]
B11Infrastructure of Occupational Safety and HealthEstablishing SCs will require a lot of labor work; ensuring the occupational safety and health of all these workers is a critical factor that needs to be considered.[70,71,72]
B12Governance and Regulatory Environment and Associated CostsA critical factor that affects the economic development of SCs is the bureaucratic rules of the country. Low-scoring countries’ governance and regulatory environment indicators negatively impact foreign businesses’ attraction.[73,74,75]
Table 2. Comparison scale of the DEMATEL approach.
ScaleDefinition
0No influence
1Low influence
2Medium influence
3High influence
4Very high influence
Table 3. The group direct-influence matrix of barriers to SC development.
BarrierB1B2B3B4B5B6B7B8B9B10B11B12Sum
B103320414430024
B230331423440027
B343012313340024
B412101332330019
B523430123340025
B634343013440029
B721432102210018
B834043000100015
B944334343040032
B1034132303000019
B111210000000037
B122120000000308
Sum2831252618221426242733
Note: all values are approximated to the nearest integer scale value in Table 2.
Table 4. The normalized direct-influence matrix of barriers to SC development.
FactorsB1B2B3B4B5B6B7B8B9B10B11B12
B10.0000.0940.0940.0630.0000.1250.0310.1250.1250.0940.0000.000
B20.0940.0000.0940.0940.0310.1250.0630.0940.1250.1250.0000.000
B30.1250.0940.0000.0310.0630.0940.0310.0940.0940.1250.0000.000
B40.0310.0630.0310.0000.0310.0940.0940.0630.0940.0940.0000.000
B50.0630.0940.1250.0940.0000.0310.0630.0940.0940.1250.0000.000
B60.0940.1250.0940.1250.0940.0000.0310.0940.1250.1250.0000.000
B70.0630.0310.1250.0940.0630.0310.0000.0630.0630.0310.0000.000
B80.0940.1250.0000.1250.0940.0000.0000.0000.0310.0000.0000.000
B90.1250.1250.0940.0940.1250.0940.1250.0940.0000.1250.0000.000
B100.0940.1250.0310.0940.0630.0940.0000.0940.0000.0000.0000.000
B110.0310.0630.0310.0000.0000.0000.0000.0000.0000.0000.0000.094
B120.0630.0310.0630.0000.0000.0000.0000.0000.0000.0000.0940.000
Table 5. The total-influence matrix of barriers to SC development.
BarrierB1B2B3B4B5B6B7B8B9B10B11B12R
B10.2310.3460.2700.2950.1710.3220.1580.3480.3270.3280.0000.0002.796
B20.3390.2850.2920.3450.2140.3440.2010.3460.3490.3810.0000.0003.097
B30.3420.3450.1870.2650.2220.2960.1550.3230.3000.3560.0000.0002.790
B40.2100.2600.1810.1880.1630.2480.1900.2430.2530.2750.0000.0002.211
B50.2880.3430.3000.3180.1640.2400.1880.3220.2980.3560.0000.0002.817
B60.3540.4160.3070.3890.2790.2480.1850.3640.3670.4030.0000.0003.312
B70.2270.2180.2540.2550.1800.1840.0970.2330.2200.2110.0000.0002.078
B80.2240.2710.1230.2610.1830.1380.0900.1490.1740.1590.0000.0001.771
B90.3990.4350.3300.3830.3180.3490.2760.3850.2740.4200.0000.0003.572
B100.2610.3150.1750.2720.1820.2510.1000.2710.1770.1910.0000.0002.195
B110.0810.1110.0740.0440.0290.0460.0250.0480.0470.0510.0090.0950.659
B120.1170.0940.1080.0500.0340.0540.0280.0580.0550.0600.0950.0090.761
C3.0733.4402.6003.0652.1382.7201.6933.0902.8413.1910.1040.104
Note: Shaded cells represent values greater than or equal to the threshold value α of 0.195.
Table 6. Relative importance weights, ranks, and identities of barriers to SC development based on prominence and relation calculations.
BarrierRCR + CRCωώRankIdentity
B12.7963.0735.869−0.2765.8750.1034Effect
B23.0973.4406.537−0.3426.5460.1151Effect
B32.7902.6005.3890.1905.3930.0956Cause
B42.2113.0655.276−0.8545.3440.0947Effect
B52.8172.1384.9550.6795.0020.0889Cause
B63.3122.7206.0320.5926.0610.1063Cause
B72.0781.6933.7700.3853.7900.06610Cause
B81.7713.0904.861−1.3195.0370.0888Effect
B93.5722.8416.4130.7316.4540.1132Cause
B102.1953.1915.385−0.9965.4770.0965Effect
B110.6590.1040.7630.5550.9430.01712Cause
B120.7610.1040.8650.6571.0860.01911Cause
Disclaimer/Publisher’s Note: The statements, opinions and data contained in all publications are solely those of the individual author(s) and contributor(s) and not of MDPI and/or the editor(s). MDPI and/or the editor(s) disclaim responsibility for any injury to people or property resulting from any ideas, methods, instructions or products referred to in the content.

