1. Introduction
In the face of the formidable challenge of climate change, the urgency of transitioning to a more sustainable lifestyle has become a top priority for numerous cities worldwide. Central to this transformation is the concept of transit-orientated development (TOD), first proposed by Peter Calthorpe in the 1990s as a strategic approach to sustainable urban land development. After decades of experimentation and improvement, TOD has been recognised and widely adopted worldwide. It aims to create a multi-functional urban space within a 5–10 min walk (400–800 m) of a transit hub, coordinating transportation and land use to improve urban structure and enhance residents’ quality of life [
1,
2,
3]. However, many developments fall short of integrating diverse facilities and walkability, serving more as ‘bedroom communities’ than true TODs [
4].
As TOD gains attention for its potential to address urban sprawl, significant research has followed [
5,
6]. Bertolini’s node–place model (NPM) has offered a particularly useful framework for evaluating the sustainability of developments near public transit nodes. Before NPM, tools for such assessments were limited. Subsequent studies have expanded the model to incorporate comprehensive measures such as ‘design,’ centring on pedestrian accessibility [
7], and ‘spatial functionality’, which takes into account distances to public amenities [
8]. These enhancements deepen our understanding of TOD and facilitate cross-city comparisons [
9].
While these developments have enriched our comprehension of TOD’s physical and spatial aspects, a gap remains in terms of understanding how these factors influence human behaviour, especially mobility patterns. For example, key questions persist about how proximity to transit nodes shapes daily commuting decisions and personal mobility behaviour. This research aims to explore these questions by focusing on individuals who live within a 15 min walk of rail stations in Auckland, New Zealand. Unlike traditional TOD studies, which usually set a ¼-mile radius as the benchmark for proximity to transit stations, our research adopts a wider lens centred on local mobility. This broader focus includes accessibility not only to transit but also to essential services. By doing so, our study aligns with the “15 min city” concept, where all essential amenities are accessible within a 15 min walk. As a result, we have chosen a buffer radius of 1200 m—approximately a 15 min walk—as a more inclusive metric for evaluating local living conditions. Specifically, our research aims to determine whether this proximity to rail stations is associated with reduced annual travel distances and more localised mobility patterns, such as increased frequency of trips likely taken on foot.
Auckland City is known for its significant dependence on cars but is aiming for more sustainable future growth. Auckland is confronted with a pressing challenge of urban development growth, leading to significant traffic congestion due to the predominant reliance on private cars as the primary mode of transportation among its residents. To better manage the enormous pressure on Auckland’s urban growth, the Auckland Council has developed the ‘Unitary Plan’ operative in 2016, a comprehensive framework for managing the city’s natural and physical resources, including land development [
10]. As an embodiment of this plan, the City Rail Link (CRL) project brought electric trains and significant station upgrades starting in 2014. This project serves as a prime example of Auckland’s dedication to advancing more sustainable transit options, specifically through the TOD model [
11]. Given this backdrop, our research is particularly timely. We aim to delve into the current state of individual rail stations, thereby shedding light on whether Auckland’s urban development policies are indeed steering the city towards a more compact and sustainable lifestyle.
Specifically, to better understand the current state of the neighbourhood near Auckland city rail stations, we use mobile location data collected from 2019. By analysing visit frequencies of residents living within a 15 min walk of these stations and comparing these local visits to all other visits in Auckland City, we aim to gain valuable insights into local engagement and travel behaviours. This analysis will help assess the current effectiveness of neighbourhoods near trains in encouraging local living and reducing travel distance. The objective is to identify which areas are most conducive to local engagement and sustainable living practices, as well as those requiring significant improvements in their built environment.
The contribution of this study is multifaceted. First, we employ a ‘locality’ measure to provide an innovative lens through which to measure patterns of neighbourhood activities. While this methodology does not definitively measure engagement, its capability to identify higher levels of local movement is itself a pioneering step in urban research. Second, identifying neighbourhoods with more vital local movement and higher likelihoods of better-developed built environments can serve as positive examples and models for further research, offering promising leads that other communities can emulate. Third, pinpointing less effective neighbourhoods offers not just a challenge but an opportunity. Identifying these areas can empower policymakers and community stakeholders to direct targeted interventions and resource allocations more efficiently, thereby leveraging the data for maximal societal impact.
2. Review of the Literature
The literature on transit-oriented development (TOD) has grown significantly over the years, reflecting the increasing interest and attention to the concept among researchers, practitioners, and policymakers. TOD, which emerged as early as the mid-1800s in England and the US, gained popularity due to Peter Calthorpe’s pioneering work in the 1990s [
1]. His application of TOD principles to cities like Portland, Sacramento, and San Diego helped establish the importance of creating compact, mixed-use, and walkable urban environments around transit stations to reduce car dependency and improve the quality of urban life.
The success and effectiveness of TOD depend on various factors, such as the quality of transit services, diverse land uses, well-designed streets and public spaces, affordable housing, and supportive policies. Among these multifaceted critical dimensions, proximity is one of the most vital factors. Early researchers laid the foundation for TOD evaluation with the ‘3D’ principles proposed by Cervero [
12], which emphasised density, diversity, and pedestrian-friendly spatial design. Later, Cervero expanded on this with the ‘5D’ principle, adding ‘destination accessibility’ and ‘distance to transit’ as critical factors [
13].
Various methodologies have been employed to measure the effectiveness of TOD, but one model stands out for its comprehensive approach: the node–place model introduced by Bertolini [
14]. This model focuses on the interaction between traffic and land development in the areas around rail stations. The node–place model provides a framework for assessing the balance between transportation accessibility (node) and urban vitality (place) [
14], underscoring the criticality of both elements. Subsequent research has embraced and extended this model to include different contexts. For example, Peek et al. applied it to evaluate the development potential of station areas in the Netherlands [
15]. In another significant development, Pezeshknejad et al. found that street network connectivity, spatial structure density, and human activity intensity showed a positive relationship in BRT station areas in Tehran [
16]. The node–place model has also been combined with other methodologies to provide richer insights. Vale integrated it with walkability assessments to evaluate pedestrian accessibility in Lisbon [
7]. This incorporation of the node–place model adds a methodologically rigorous layer to the broader discussion of what constitutes an effective TOD.
Proximity in this context is the distance between transit stations and various destinations, such as residential, commercial, employment, recreational and civic uses. Several studies have found that proximity affects travel behaviour, mode choice, and trip generation of TOD residents, workers, and visitors [
17,
18,
19]. It also affects the value of land, properties, and the development potential of TOD areas [
20,
21]. However, there is yet to be a consensus on the optimal or standard proximity, as different studies have used different definitions and proximity measurements depending on the context, data availability, and research objectives.
The literature on TOD and proximity can be categorised into three main themes: the impact of proximity on (1) travel behaviour and mode choice, (2) planning and development, and (3) value of land and property value. Studies focussing on travel behaviour and mode choice have consistently found a positive relationship between proximity to transit stations and transit use and a negative relationship between proximity and car use [
22]. This means that people living or working closer to transit stations are more inclined to use public transit and are less likely to drive for their trips. However, several factors influence the strength and significance of this relationship. These include the type of transit service available (e.g., heavy rail, light rail, bus rapid transit), the purpose of the trip (e.g., work-related or non-work-related), the surrounding land use (e.g., residential or commercial), the density and diversity of land use around transit stations, the availability and quality of pedestrian and bicycle facilities, parking supply and pricing, the sociodemographic characteristics of travellers (e.g., income, age), and the overall regional context (e.g., urban form and travel behaviour) [
23,
24,
25]. Another line of research focuses on TOD’s objective of promoting compact, mixed-use, and walkable urban forms around transit stations to create liveable, sustainable, and equitable communities. Critical factors like market demand, policy incentives, institutional coordination, public participation, and social equity shape the land use planning and development of TOD areas [
26].
Lastly, many studies explore TOD’s goal of capturing the value of transit access and generating revenue for transit agencies, local governments, and private developers. These studies consistently report a positive relationship between proximity to transit stations and land or property value [
27]. In simpler terms, land or properties closer to transit stations generally have higher values than those farther away. As with travel behaviour and mode choice, the magnitude and significance of the proximity-land value relationship are influenced by various factors. These include the type of transit service available, the property type (e.g., residential, commercial, industrial), the density and diversity of land use around transit stations, the quality and availability of pedestrian and bicycle facilities, parking supply and pricing, the sociodemographic characteristics of buyers or renters (e.g., income, age), and the regional context (e.g., urban form and market conditions) [
17,
28,
29,
30].
Based on the existing literature, much has been understood about the various dimensions that contribute to the success of TODs, from travel behaviour and mode choice to land-use planning. However, a notable gap remains in the extent to which ‘locality’ or ‘local engagement’ plays a role in TOD effectiveness. While the literature delves into the broad issues of mobility patterns, property value, and planning aspects, it rarely focuses on how local factors and community engagement within a walkable buffer around a station contribute to the success or shortcomings of a TOD. This gap in understanding represents a critical missing link that our research aims to address. It stands to provide valuable insights for effective urban planning and development strategies, ensuring that TOD not only improves transportation but also positively impacts the daily lives of urban residents.
Therefore, our research objectives aim to address three main questions: (1) the relationship between living proximity to rail stations and travel patterns, (2) which transit stations support a higher locality trend in alignment with TOD principles, and (3) the influence of specific rail station characteristics on movement patterns. To complement these core questions, we will also examine the average travel distances of individuals residing near transit stations. To quantify the significance of each of these factors, we employ the ordinary least squares (OLS) regression model. The regression analysis results will enhance our understanding of how proximity to rail stations affects both mobility patterns and levels of local engagement across diverse rail station types.
3. Methodology
The research is centred around the concept of transit-oriented development (TOD). The aim of TOD initiatives is to create neighbourhoods where residents can easily access essential services by walking or cycling, promoting a more local lifestyle. In this study, the term ‘locals’ refers to people living within a 15 min walking distance (1200 m) from rail stations, and this term will be used throughout the paper. The analysis of the mobility patterns and local engagement of these locals provides valuable insights into how well the neighbourhoods align with TOD objectives. The study’s focus is to determine the current level of support that existing rail stations in Auckland City offer for promoting local living. A higher prevalence of localised movement patterns and reduced dependence on long-distance travel indicate better alignment with TOD principles. Such outcomes suggest that residents are likely to have convenient access to amenities and services within their immediate vicinity. To achieve this, the research methodology involves analysing human mobility patterns related to rail stations to assess their effectiveness in fostering local living in the city.
This section introduces the study area and the dataset used, along with the methodology for identifying the ‘home location’. It also compares visitor dynamics, specifically between activities within the 15 min walking area and those beyond this radius. Additionally, we calculate the average individual travel distance, followed by an analysis of the overall trend in mobility behaviour for each home grid and station area, followed by a discussion of their characteristics in the current urban context. To validate the findings, an ordinary least squares (OLS) regression model is employed to empirically examine the relationship between the average travel distance of residents and their mobility patterns categorised by rail station types.
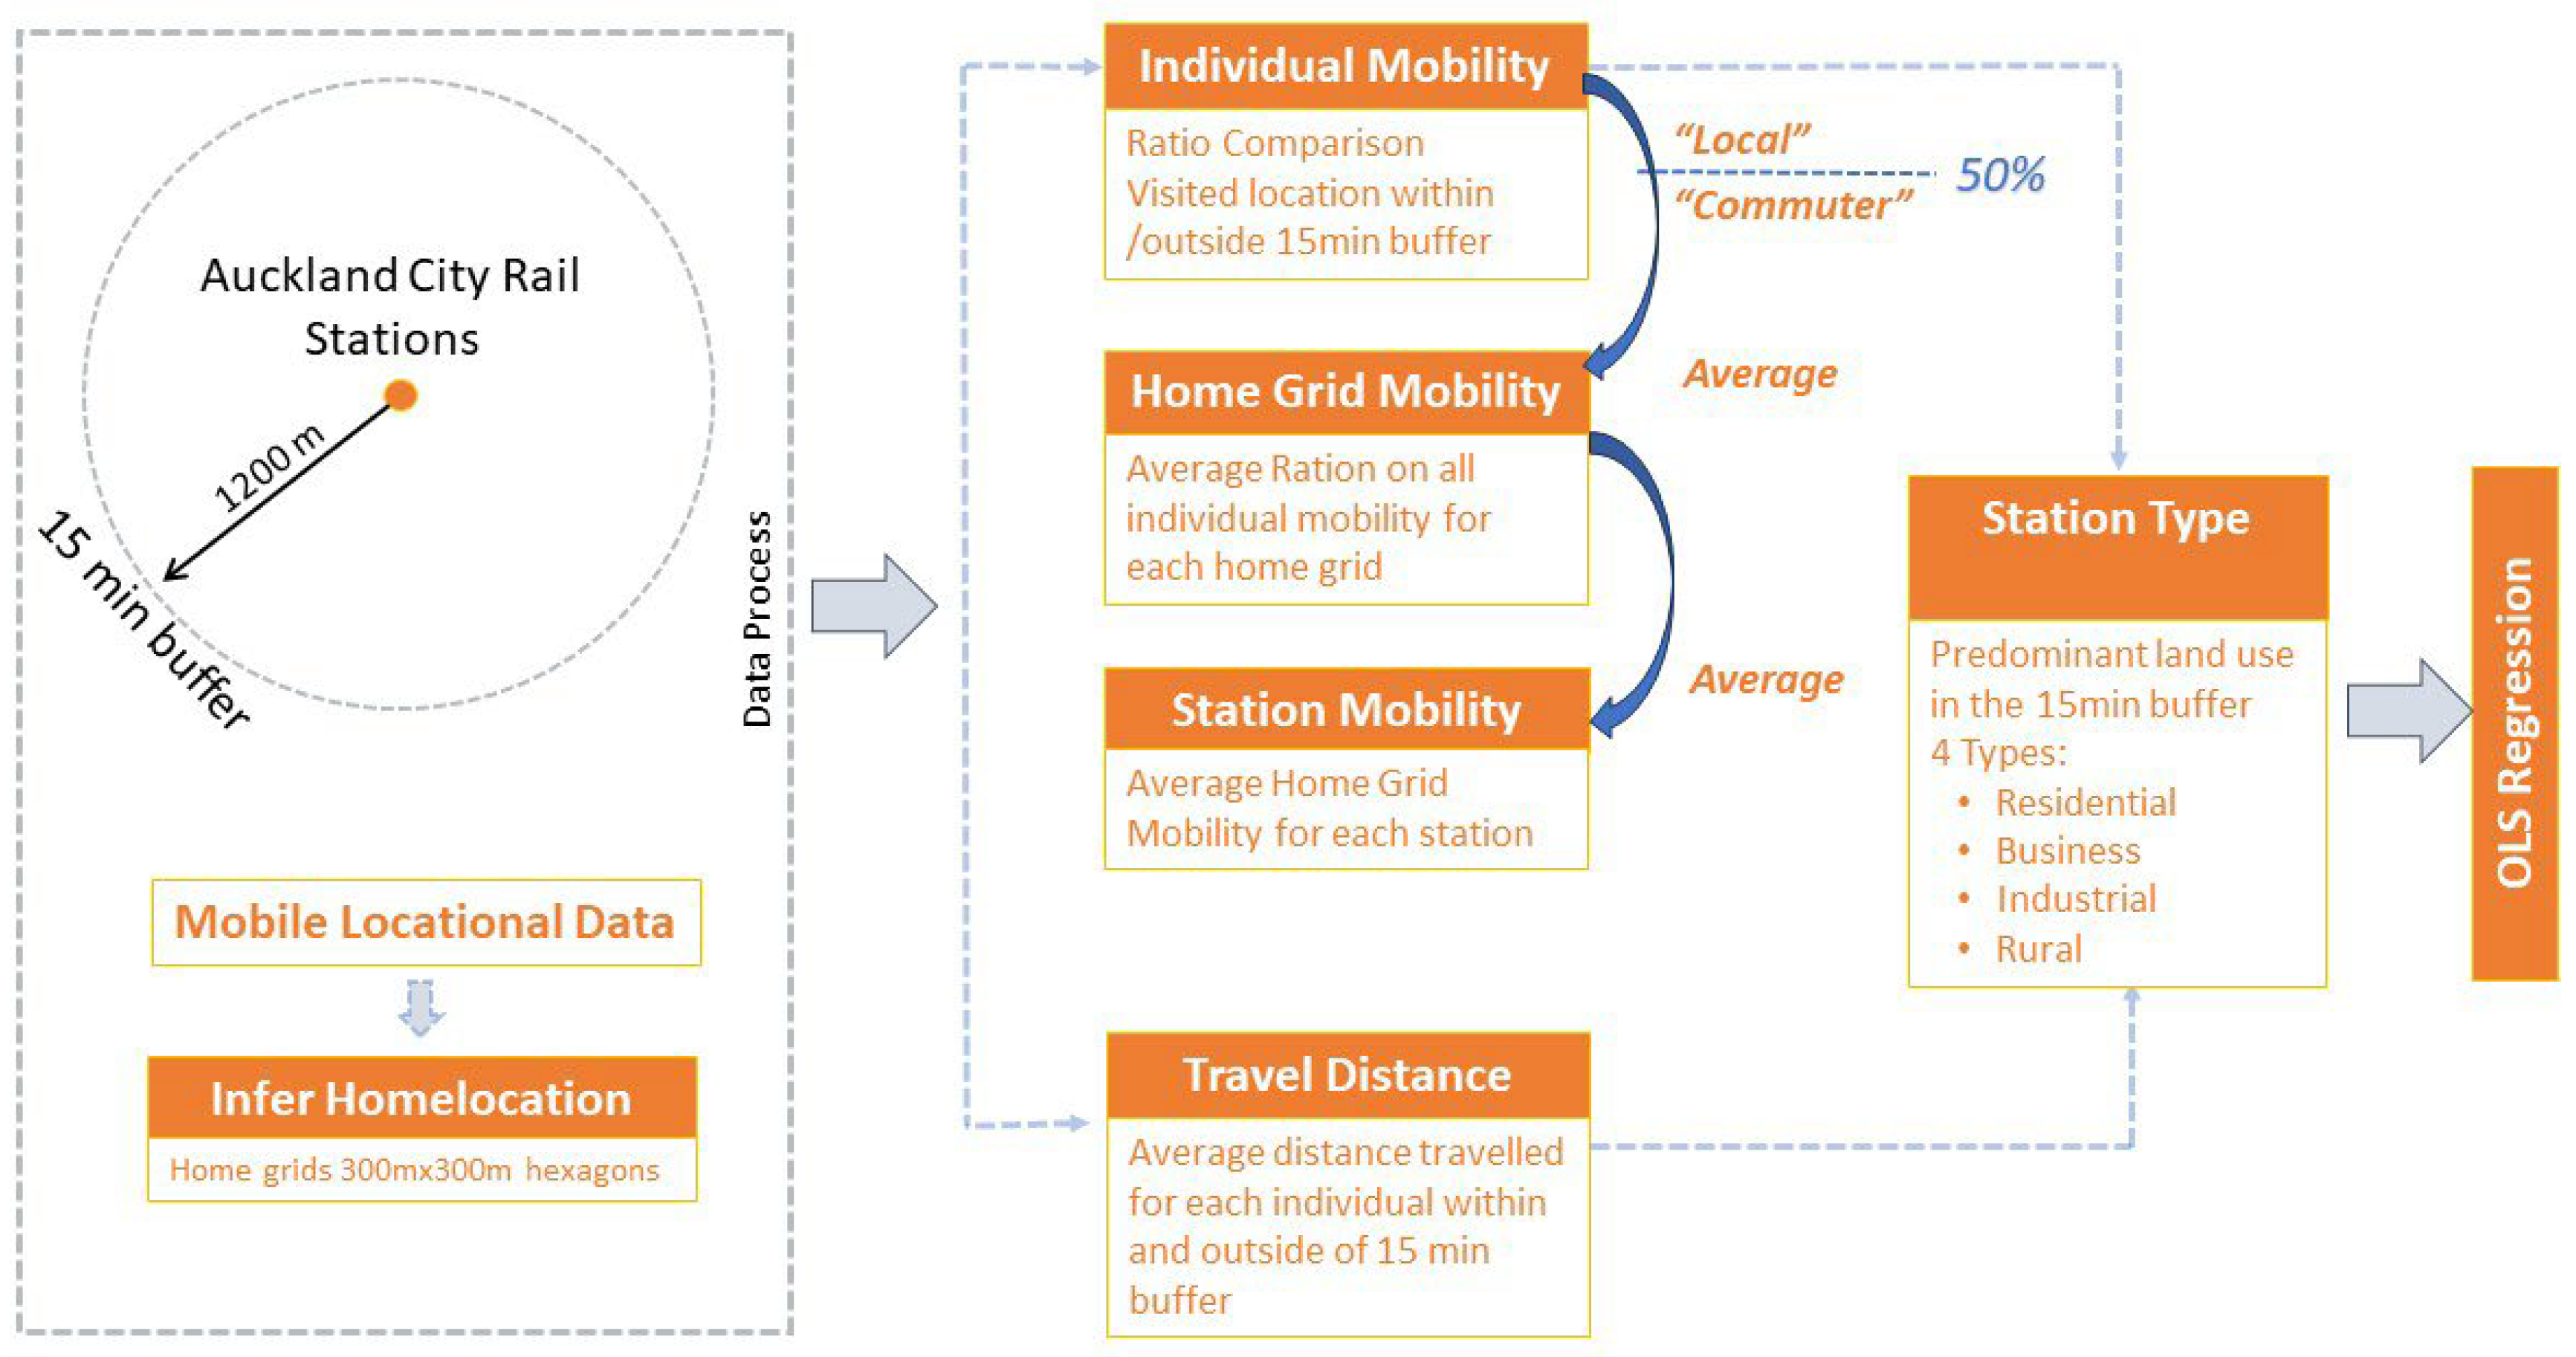
Figure 1 provides an outline of the structure of the study, illustrating the sequence of steps from the introduction of the study area and the data set to the implementation of the OLS regression analysis. Focusing on the mobility patterns and local engagement of ‘locals’ within the 15 min walking distance of rail stations, aiming to understand their alignment with TOD principles. Land uses within the 15 min walkable catchment are evaluated, and stations are categorised based on predominant land use, namely, residential, business, industrial, or rural. A higher prevalence of local activities and a reduced dependence on long-distance travel suggest better alignment with TOD objectives, indicating easier access to amenities and services within the immediate vicinity.
3.1. Study Area and Data
The Auckland City Rail System in New Zealand has a historical background dating back to the mid-19th century with the construction of the first rail network. However, patronage of the rail system increased significantly during the early twentieth century. In 2016, a substantial upgrade proposal for the rail network was confirmed, and funding was secured for implementation starting in 2020. The city rail link project is scheduled to be completed by 2025 [
11]. For our analysis of mobility patterns within urban areas, we used the city rail data set provided by the New Zealand data service, which the Government Information Services of the Department of Internal Affairs lead. This data set includes geolocation information for all city rail stations. In our study, we focus specifically on the 34 stations within the limits of Auckland City. To categorise these rail stations, the Auckland Unitary Plan was consulted. Issued by the Auckland Council, the plan offers comprehensive information on land uses within the city [
10]. We intersected this data with a 15 min walking radius around each station to determine the predominant land uses, thereby informing the characteristics of each station.
For mobility analysis, we obtained location data for mobile applications from a third-party vendor, Quadrant [
31], covering users in Auckland during 2019. To maintain consistency and exclude data influenced by the COVID-19 pandemic disruption on human mobility, we excluded data from 2020 onwards. The data set contained 14,410,353 location traces submitted by 64,034 users. To further ensure that the data have minimal skewness, we excluded ‘power’ users, defined as those within the top 1% based on the number of observations and users with fewer than ten observations, as meaningful activity space cannot be inferred in such cases. Following this process, we retained 4,220,351 observations from 11,569 users for our analysis.
Each data point in our data set contains three attributes: a unique user identifier, specific geographical information, and a timestamp that indicates when the data point was generated. To address the variations in geographical precision resulting from using different smartphones [
32,
33], we aggregated all data points into 300 m hexagonal grid cells. This choice of 300 m resolution serves multiple purposes: it resolves the issue of uneven geographical precision, ensures data privacy and ethical sensitivity, and provides sufficient observations in individual grid cells for subsequent analysis. It is important to note that the selection of this aggregation resolution was considered appropriate for the Auckland case. However, it is essential to emphasise that, considering its relevance to the research question, the decision on the grid cell size is ultimately at the researchers’ discretion.
After completion of the aggregation process, we obtained 12,032 grid cells within the Auckland city boundary, each cell representing an urban location and serving as the analysis unit. We applied the ‘homelocator’ R package [
34] using the temporal characteristics and frequency of the datapoint to infer the ‘home location grid’, a 300 m × 300 m area of the mobile users. Subsequently, we used the aggregated data set to construct home-to-destination networks for individual users based on their movement flows between their homes and various urban places. The analysis focuses on the difference between the proportion of local and distant visits from mobile location users who reside near the rail station. In this research, we define activity points within the 15 min buffer (1200 m radius) from the station as ‘local’ engagement, while activity points falling outside the walkable buffer are defined as ‘distant’ activity engagement. This approach allows us to assess the correlation between proximity to rail stations and behavioural patterns.
3.2. ‘Locality’ Measure
The methodology’s core revolves around analysing the percentage of local activity versus distant activity in the daily mobility patterns of residents who reside within the 15 min walkable radius. We develop the ‘locality’ index on three scales, employing the following metrics to achieve this.
Individual Mobility (IM)—calculated directly as the ratio of residents’ activity points falling within the 15 min walkable area relative to the total activity points detected.
Home Grid Mobility (HGM)—calculated as the average ratio of the total residents’ IM per home grid location.
Station Mobility (SM)—Calculated as the average ratio of the total HGM of each home grid location per station area.
Travel Distance (TD)—Calculated directly as the average distance of all trips from each user.
Leveraging home-to-destination networks derived from our aggregated mobile location data, our primary objective is to identify mobile phone users whose inferred home locations are near any of the rail stations in Auckland. Subsequently, we collect all data points sent by these anonymised users throughout 2019 within the Auckland boundary. For each user, we compare the total number of visits made within the 15 min walkable zone around their inferred home location and the total visits made in all surrounding neighbourhoods. Users with more than 50% of their visited locations within the 15 min buffer are classified as ‘local’. Conversely, those who travel beyond this distance for their daily needs are categorised as ‘non-local.’ The 50% benchmark is selected based on the judgment rooted in Auckland’s transportation landscape. In Auckland, the vast majority of households—around 80%—own a motor vehicle, and an equal percentage of travel time is spent in private cars [
35]. Given this context, we set a 50% benchmark for individual local mobility as a meaningful threshold. This approach allows us to analyse individual behaviour patterns around all the stations.
3.3. OLS Regression Analyst
To corroborate the relationship between proximity to rail stations and individual mobility behaviour, we use an OLS regression model, which allows a quantitative assessment of the statistically significant effects of each user’s proportion of local versus distant activity on the average travel distance of residents. Additionally, to highlight the significant effect of the contextual factors surrounding rail stations, a variable corresponding to rail station categories is incorporated into the model.
In the OLS regression model, we use the following variables (all variables are standardised to facilitate comparison analysis; the definition of the variables mentioned above will not be repeated here):
Explained variable:
Core Explanatory Variables:
Dummy Variable of Local (dum_local)—This is a 0–1 dummy variable judged by whether the proportion of all activities of this user that occur locally exceeds 50%. If, for example, the ratio exceeds 50%, then this user is labelled 1; otherwise, 0.
Individual Mobility (IM)—This variable could show an individual’s local activity, as it is the proportion of all observed activities that occur locally.
Control variables:
Home Grid Mobility (HGM)
Station Mobility (SM.)
Station Type—To categorise rail station types, we analysed various land uses within each station’s 15 min walkable radius and identified the predominant land use as the defining characteristic for that station. Based on this methodology, we classified the stations into four main types: ‘Residential’, ‘Business’, ‘Industrial’, and ‘Rural’. Among these, ‘Residential’ stations form the largest category, constituting approximately 70% of the total, followed by ‘Business’ stations at 15%, and ‘Industrial’ and ‘Rural’ stations making up 12% and 3%, respectively (see
Table S1).
4. Results
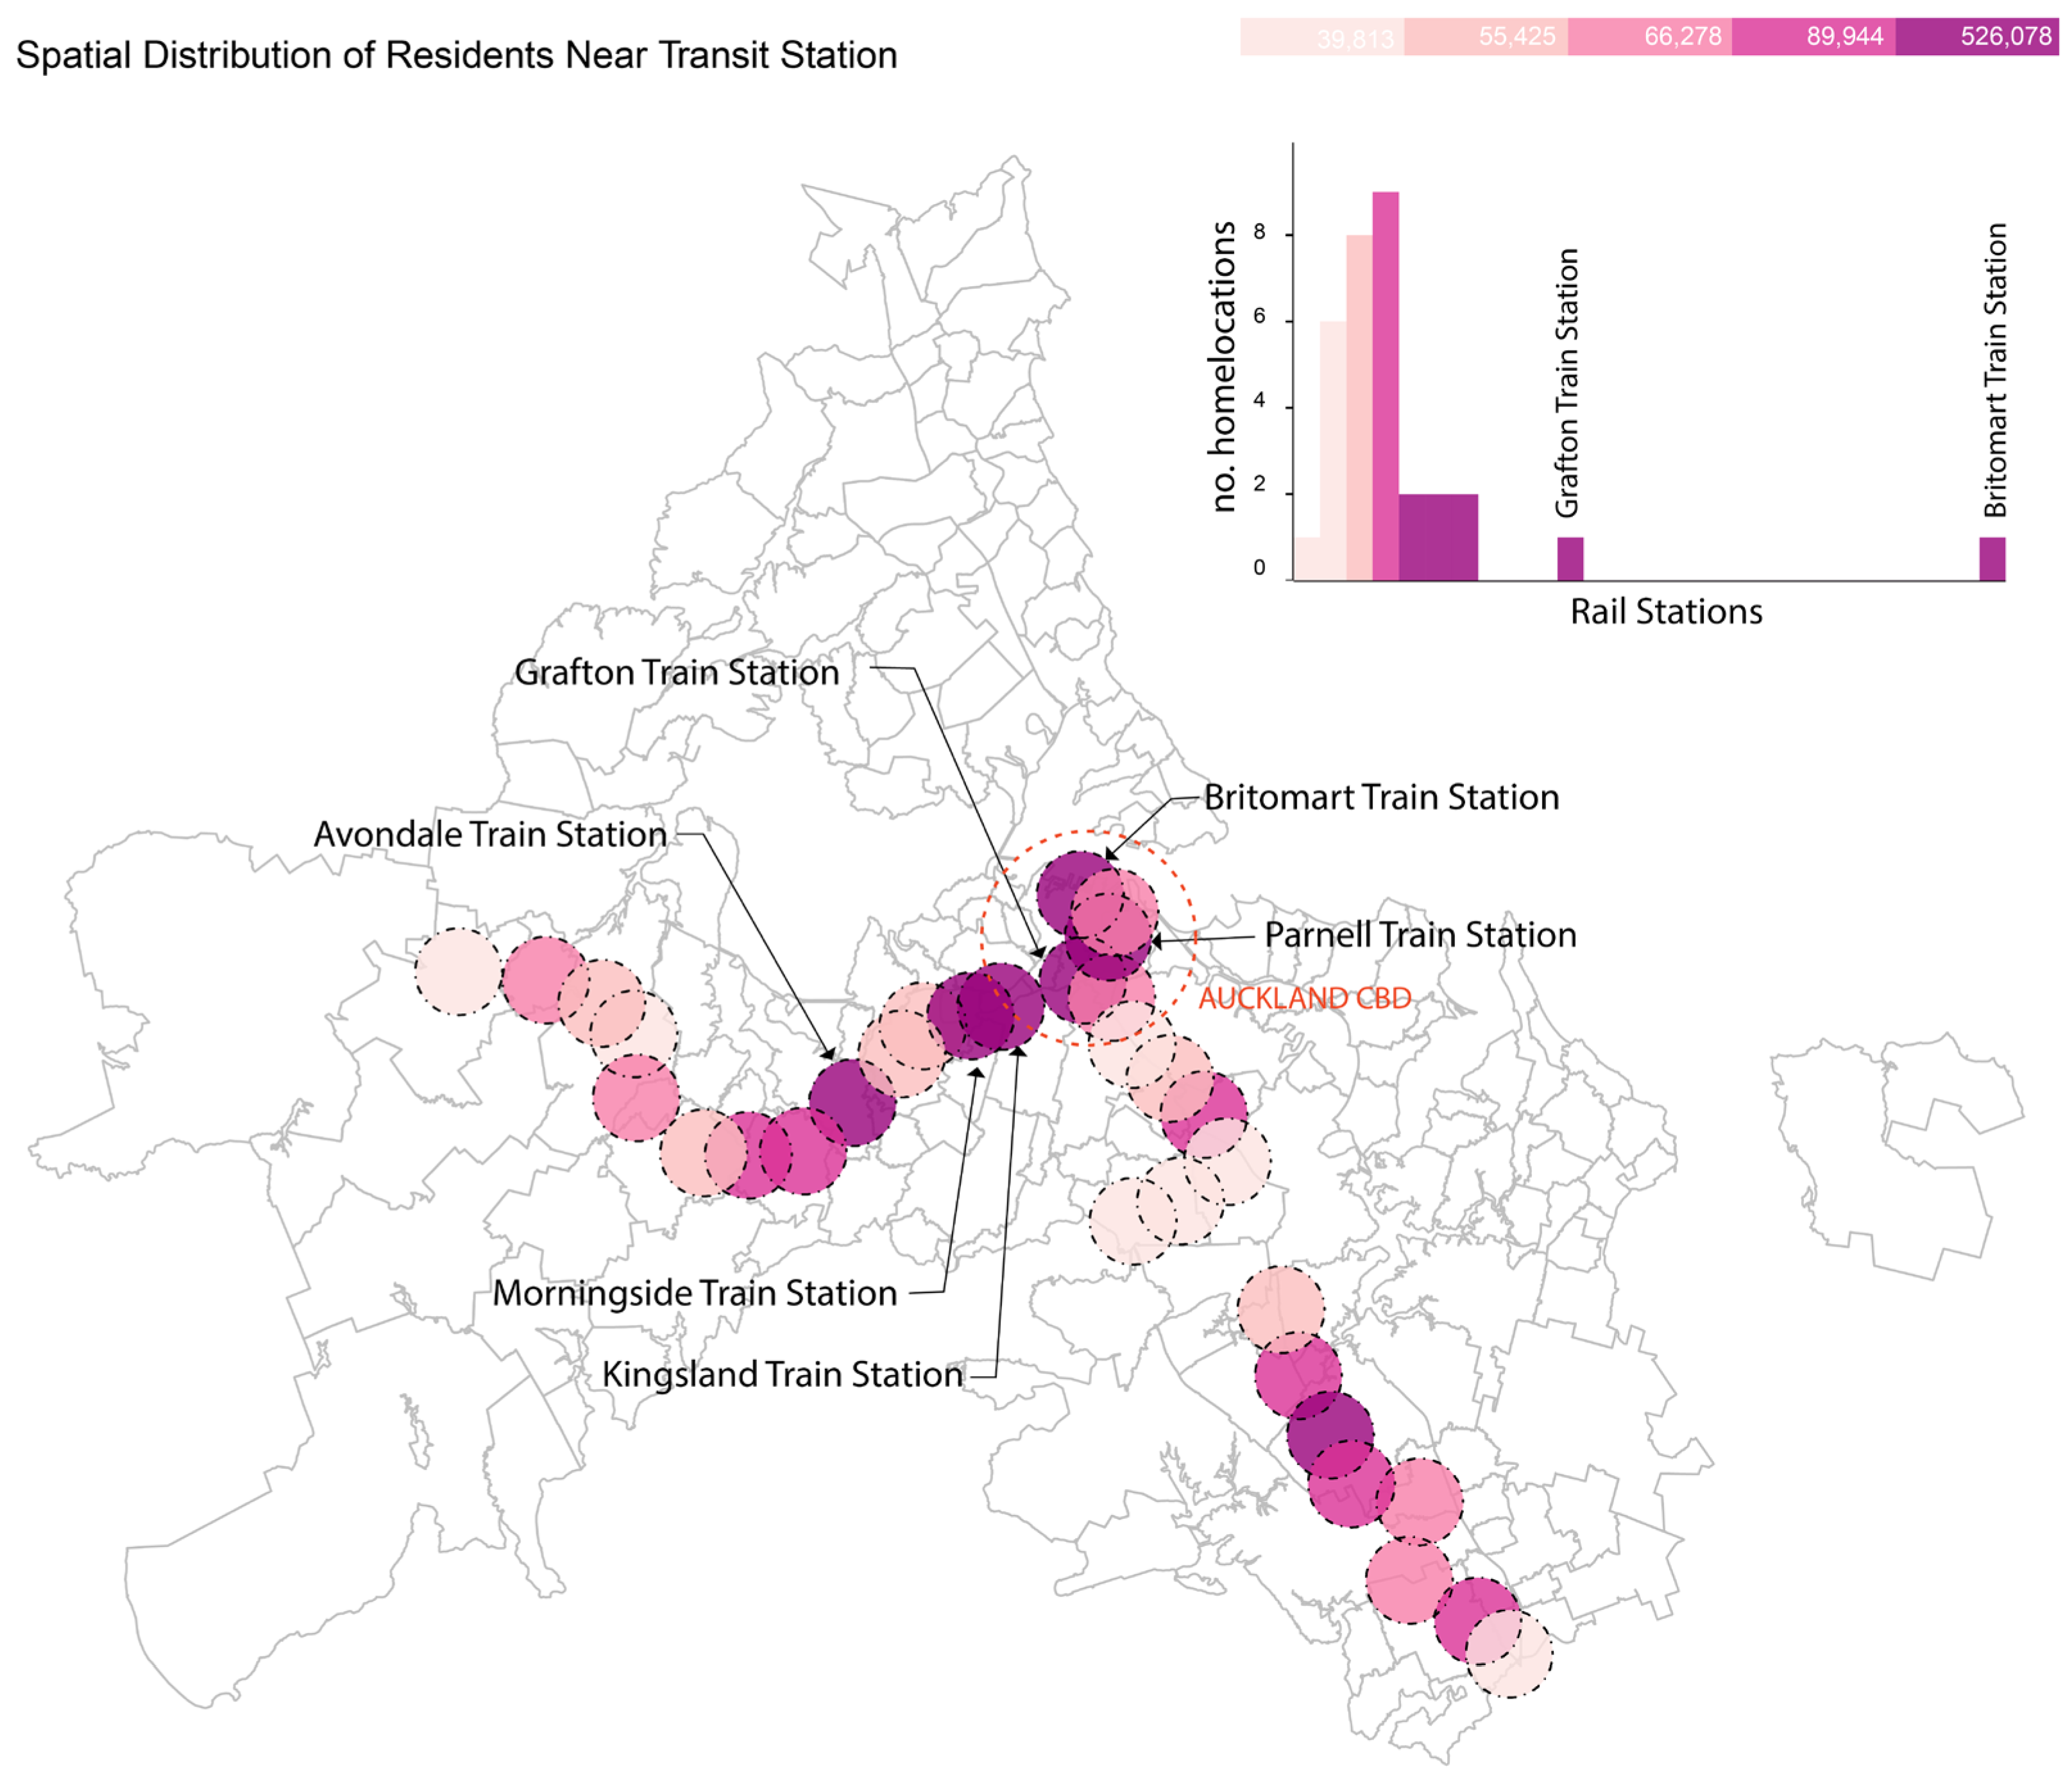
Using the data set we acquired for 2019, we identified the inferred home locations of 10,804 users near rail stations. The result shows a clear trend in which the CBD has the highest population, exemplified by stations such as Britomart, Grafton, and Kingsland. These areas are the highest housing density neighbourhoods [
36], and the population gradually decreases toward the city’s periphery.
Figure 2 shows the spatial distribution of residents near each rail station area.
4.1. The Ratio of ‘Local’ vs. ‘Distant’ Activities for Transit-Proximity Residents
To examine the influence of proximity to transit stations on residents’ daily mobility patterns, we evaluated the distribution of total visited locations for each identified resident. Specifically, we computed the percentage of visits made within the 15 min walking radius around the transit stations versus those made beyond. The result highlighted that approximately 54% of residents residing near transit stations predominantly visit locations within their local areas, accounting for more than 50% of their total visits. In this study, we refer to these individuals as ‘locals’, while the remaining residents are categorised as ‘commuters’.
To better understand the implications of residents’ mobility patterns in a geographical context, we averaged the percentage of all residents’ local trips in each home location grid. Each grid is a 300 m × 300 m hexagonal unit area, and each station’s 15 min walking buffer (1200 m radius) contains approximately 75–77 home location grids. The average ‘local’ visits percentage of the residents in each home location grid can reveal the collective mobility trend of the residents in the area.
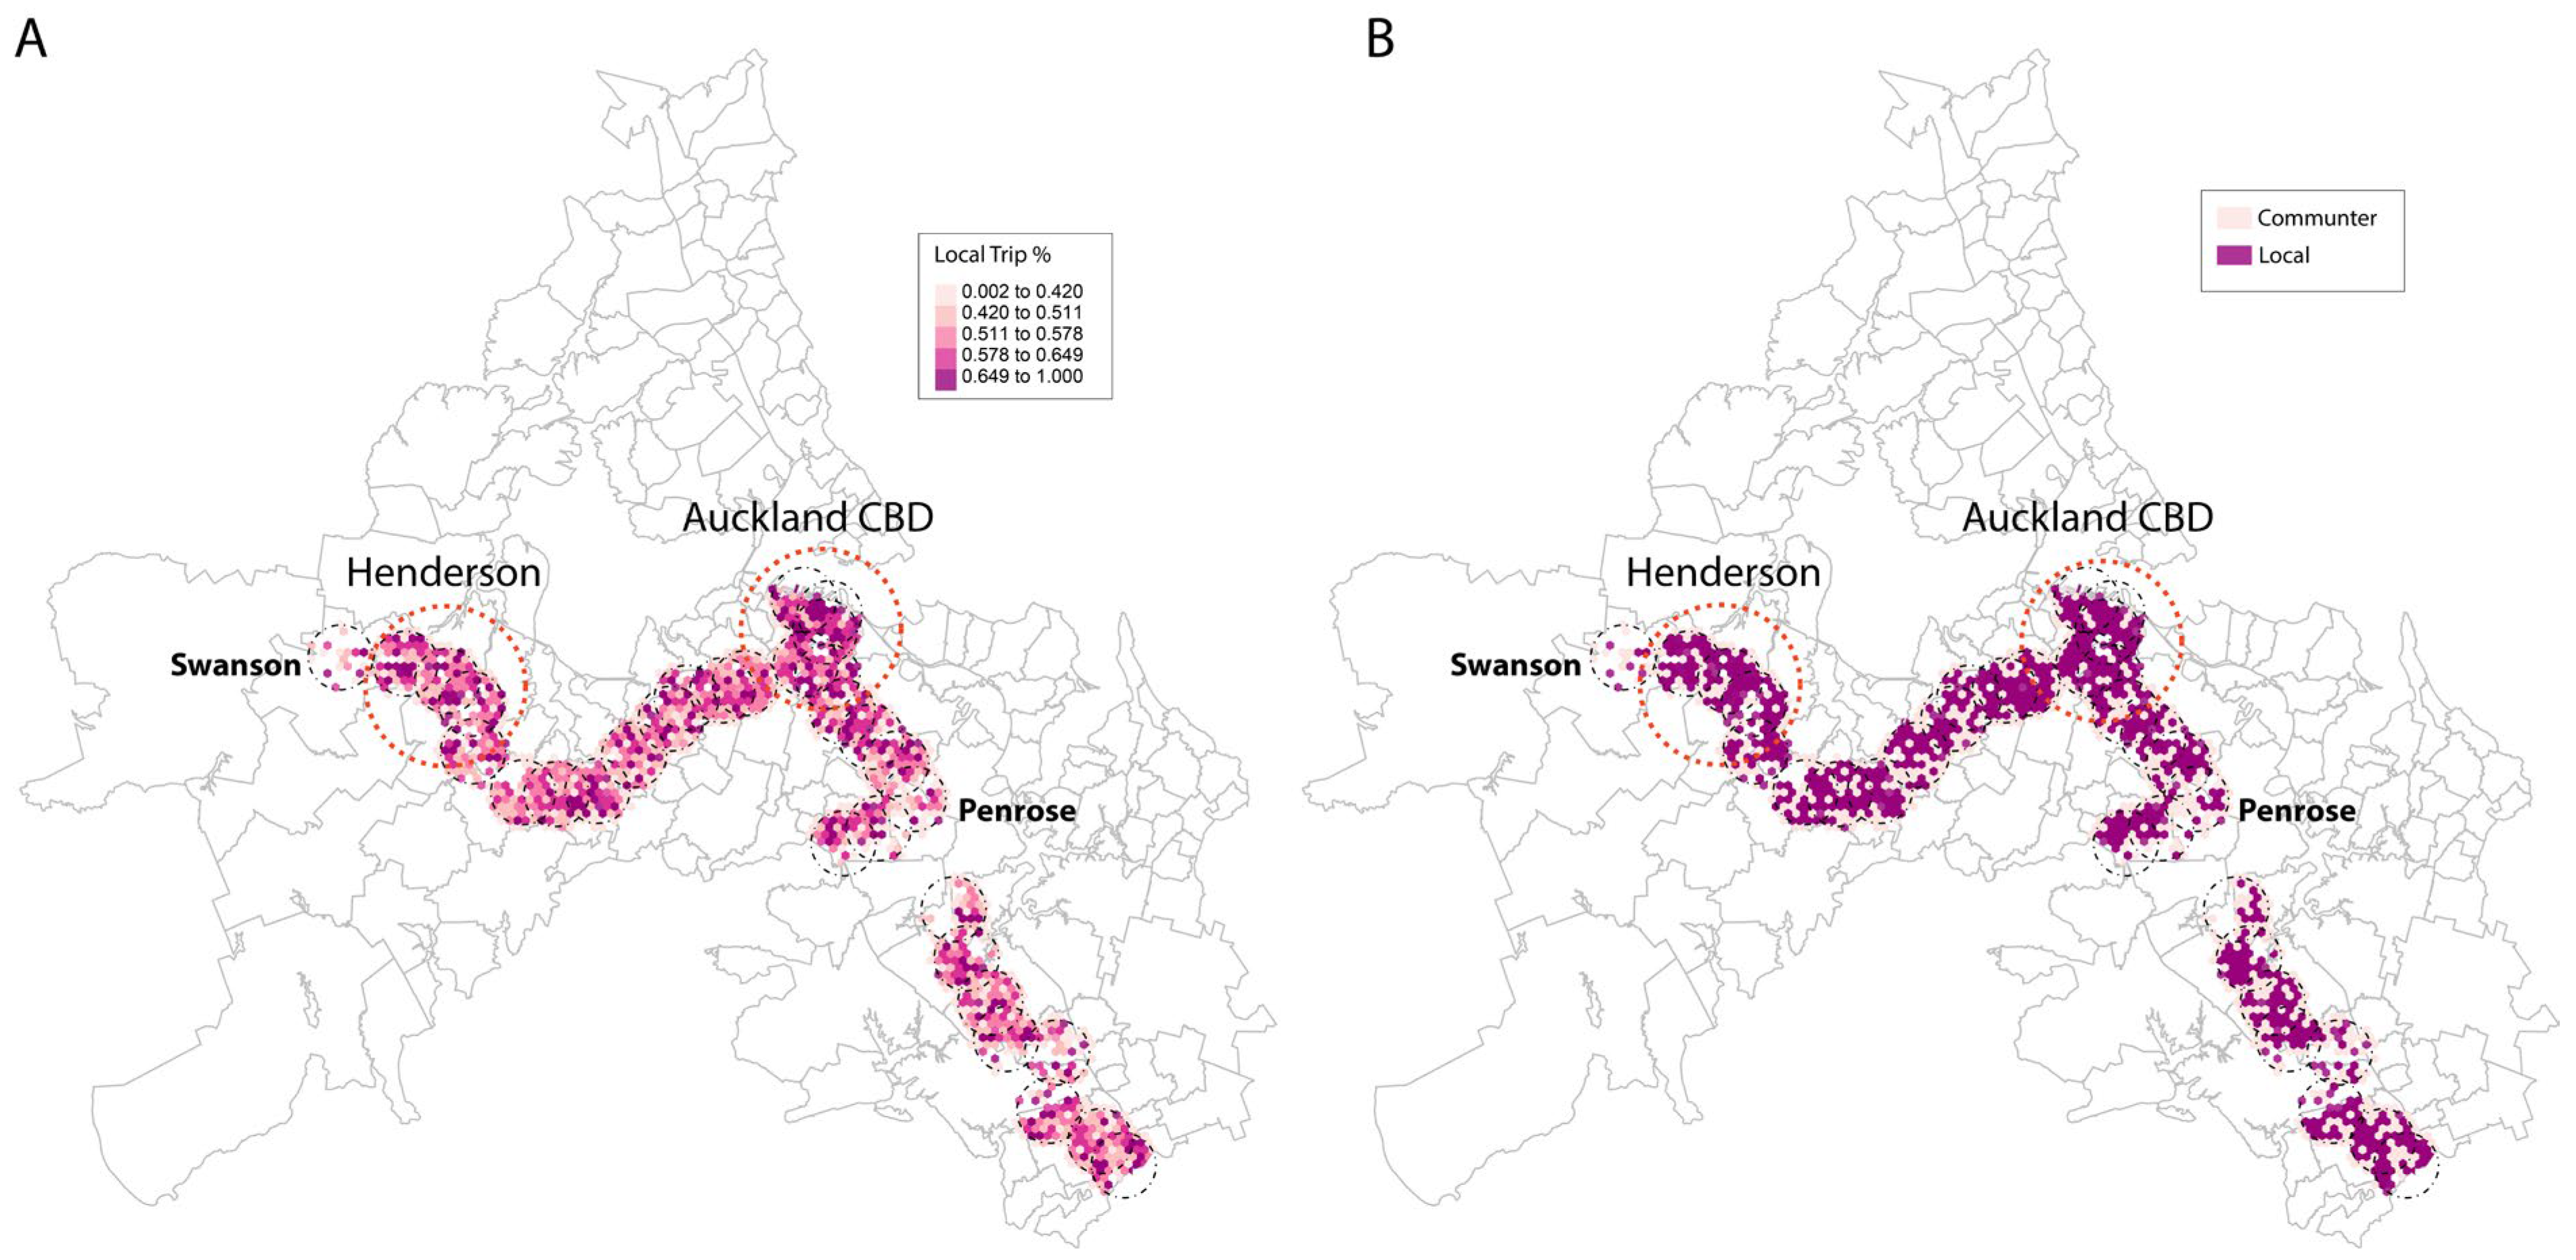
Figure 3A visualises the percentage of ‘locals’ in each home location grid, with darker shades indicating higher concentrations of ‘locals.’ The distribution of ‘locals’ appears to be somewhat random, with only a few strong clusters.
To enhance clarity, we further simplified the visualisations to distinguish between home location grids dominated by ‘locals’ and those dominated by ‘commuters. This clarified view, as illustrated in
Figure 3B, reveals that Auckland CBD and Henderson (West Auckland Centre) exhibit the highest levels of local engagement around rail stations.
We further evaluate the collective mobility pattern trends within each neighbourhood’s walkable buffer, acknowledging that multiple factors influence people’s mobility. The collective behaviour in each transit-adjacent neighbourhood provides insights into the area’s effectiveness in serving its local residents. In other words, a higher level of local trips can serve as a valid indicator that essential and leisure services are within close proximity, accessible via short trips, thus offering options for more sustainable modes of transportation. To assess this, we calculate the average percentage of local visits in which all residents within the 15 min walkable area engage. The result illustrates a powerful trend, highlighting that the areas that have the most highly concentrated ‘locals’ are primarily located in the Auckland CBD and its adjacent neighbourhoods, with a secondary cluster around Henderson, the main centre in West Auckland (see
Figure 4A). These findings suggest that such areas likely offer better access to essential amenities, thus encouraging more residents to adopt a local lifestyle. This outcome aligns with expectations, as metropolitan areas generally provide a wider range of amenities and services, along with easier access to them.
While the collective trend of averaging the prevalence of local visits has yielded meaningful results, it is limited in capturing the magnitude of the differences. In order to better understand the impact of living near a transit station, we further calculated the yearly average travel distance for each resident. As illustrated in
Figure 4B, the results align with previously observed local ratio trends, both by home location grid and by station. In particular, the Auckland Central Business Area (CBD) has a higher proportion of ‘locals’, which means that residents in this area generally travel shorter distances. This provides strong evidence that living near transit stations is related to a shorter annual travel distance for individuals. However, the situation in Henderson differs from that in the CBD. Although residents near transit stations in the Henderson area exhibit a higher percentage of locals, our statistical analysis reveals no significant correlation with shorter annual travel distances per individual. We believe this intriguing observation can be attributed to Henderson’s status as a metropolitan area that is not a central business district (CBD). Residents in Henderson are more likely to commute to the CBD or other areas for work. This contrasts with the CBD, which offers a range of essential services and employment opportunities, thereby reducing the need for longer trips.
4.2. Regression Analysis (OLS)
The results of our ordinary least squares (OLS) regression analysis are presented in
Table 1 below. The primary focus of this study is to differentiate between ‘locals’ and ‘commuters’. To represent these categories as indicator variables, we have introduced a dummy variable labelled ‘Local.’ In other words, these regression results allow us to examine the relationship between average travel distance and individual mobility behaviour, specifically differentiating between locals and commuters.
In order to avoid the problem of multicollinearity in the independent variables, we use the variance inflation factor (VIF) in this paper to measure the severity of multicollinearity in this multiple linear regression model. The results of the VIF analysis are shown in
Table 2.
The VIF value of each variable in
Table 2 is less than 10 (10 is usually used as a judgement boundary), from which it can be judged that there is no multicollinearity problem between the variables in this regression model.
Table 1 shows that in the overall sample (Regression 1), the coefficients for both the ‘dum_local’ and ‘IM’ variables are negative and statistically significant at the 1% level. This indicates that if the user is identified as ‘local’, they tend to have shorter average travel distances compared to commuters; this difference is statistically significant. Moreover, the coefficient for individual mobility (IM) indicates that, for every unit increase when the user is identified as ‘local’, the average travel distance decreases by 0.613 units. In other words, a higher percentage of local activities for ‘local’ users is associated with shorter average travel distances.
Regressions (2), (3), (4), and (5) show results for various types of rail stations. In these models, the dependent variable represents the average travel distance of residents within a 15 min walking radius of different station types. The negative and statistically significant coefficients for ‘dum_local’ and ‘IM’ confirm that the relationships observed in the overall sample hold true for each subgroup as well, albeit at varying levels of significance. For rural stations, each unit increase in individual mobility correlates with a significant decrease of 0.9 units in average travel distance. This trend may be explained by the limited infrastructure and walking accessibility in rural areas, meaning that an increase in local activity among residents can result in a significant reduction in average travel distances. Conversely, the impact of these variables is less pronounced for business and industrial stations, likely because these areas have well-developed infrastructure and central locations that can accommodate most resident activities.
In summary, the finding indicates that being classified as a ‘local’ correlates with shorter average travel distances, a trend that is especially pronounced in business and industrial settings. Similarly, a higher score in individual mobility (IM) generally leads to reduced travel distances. Conversely, ‘Home Grid Mobility’ tends to be associated with increased travel distances, although this effect is mitigated in rural locales. The impact of ‘Station Mobility’ varies by area type, most often resulting in decreased travel distances except in industrial zones. Overall, the model effectively elucidates the nuanced relationships between various factors and travel distances across diverse geographic settings. It is important to note that all variables have been standardised. Therefore, the absolute values of the regression coefficients do not convey real-world units, but instead reflect the relative strength of each variable’s impact on the dependent variable.
5. Discussion
Our study contributes significantly to understanding the impact on mobility patterns of people living near rail stations, employing a quantitative lens and harnessing the usefulness of mobility data in research. We created ‘locality’ measures based on the engagement level of residents living near rail stations, using their frequency of visits as a proxy for local activities. This approach sheds light on the influence of proximity to transit stations on individuals’ travel behaviour and annual travel distance in Auckland City, New Zealand. In line with existing theories on TOD and walkable environments, we quantified the concept of ‘locality’ at various spatial scales: the individual level, home location grids, and the 15 min walking radius around each rail station. The high degree of local mobility observed around stations such as Auckland CBD and Henderson substantiates the theoretical underpinnings of TOD, highlighting the importance of station-centric planning in fostering sustainable, walkable communities [
1].
Our research findings highlight that more than 54% of locals exhibit a higher level of participation in local activity. Specifically, our analysis of mobile phone locational data reveals that more than half of the recorded travels in 2019 occurred within the walkable vicinity of rail stations. Furthermore, when we examined the collective trend based on home location grids, we observed a robust radial pattern, indicating that a higher number of local residents are located closer to the station, and there is a gradual decrease in local involvement as we move toward the periphery of the walkable area. Similarly, the collective trend based on each station’s walkable neighbourhood reveals those stations near the CBD and Henderson—the largest suburb centre in West Auckland—house residents with a stronger inclination toward locality.
The observed high local mobility suggests that development around these rail stations aligns well with TOD concepts [
1]. It reveals that neighbourhood design and land use are effective in promoting active modes of transportation like walking and cycling, making essential services easily accessible. This trend aligns with the anticipated higher service levels in the CBD and major centres. Conversely, lower local mobility was found around Swanson and Penrose Station (
Figure 4A). Swanson is at the western end of the east–west line and has limited facilities, while Penrose station is in the middle of an industrial area with few essential services. Our classification scheme substantiates these observations, categorising Swanson as a rural-type station and Penrose as an industrial-type station. These findings closely align with the node–place index principles, underscoring the TOD concept’s multidimensional nature. However, this low mobility observation deviates from the general principles of TOD, thereby challenging its uniform applicability across all station environments. This divergence from existing literature suggests a need for more targeted urban planning strategies in these areas [
36].
Our study has also revealed an interesting pattern among locals for Auckland CBD and Henderson. We found that the locals there tend to have a shorter average travel distance, implying that they have not travelled long distances for their daily activities. This observation provides further evidence that, in these larger centres, essential amenities are easily accessible within a walkable distance, promoting local living and sustainable community development. In other words, our findings suggest that Auckland CBD and Henderson stations have urban developments around transit stations that better foster local living that is potentially more in line with the TOD principles. On the other hand, neighbourhoods such as the areas around Swanson and Penrose stations may require more significant investment and critical transformation to achieve a more sustainable community model.
Moreover, our regression results further indicate that well-supported neighbourhoods, in line with TOD principles, significantly impact residents’ travel behaviour. This finding corroborates numerous studies on sustainable communities, demonstrating that such environments can reduce car dependency and, consequently, travel distance [
37]. A more nuanced understanding of the relationship between average travel distance and individual mobility was found through our categorisation of land use around various station types, which we then grouped in regression analyses. Specifically, improvements in the infrastructure and walkability around rural stations are likely to significantly reduce average travel distances, providing valuable insights for government planners.
To bridge the gap between our empirical results and the theoretical framework, it is crucial to highlight that our findings both align and diverge from existing knowledge in the field. This mixed alignment provides a richer, more nuanced understanding of TOD and walkable environments, particularly in Auckland City, New Zealand.
We acknowledge the complexity of building a successful TOD and promoting sustainable urban living, which cannot be simplified to hinge solely on proximity. While proximity is the focus of our analysis, our study also explores the underlying concepts of TOD in the context of sustainable living within compact and walkable neighbourhoods. Using mobile locational data, our analysis was conducted with a much finer spatial resolution in a longitudinal study than other data sources such as travel surveys or census data [
38]. This approach allowed us to gain deeper insights into the dynamics of people’s movement, mobility patterns, and impacts on sustainable living with more comprehensive coverage of all the places individuals visit.
However, it is essential to note that the results of this study may be influenced by social, technical, and data-related challenges [
39]. Notably, data collected through mobile phones can be susceptible to social biases, especially if older individuals do not use or have access to mobile devices [
40]. Furthermore, the dataset used in this study may only partially represent a segment of the Auckland, New Zealand population, as it includes only mobile phone users who consented to share their location information, potentially introducing sample bias. Additionally, the mobility trajectory data do not provide socioeconomic details for each user. Moreover, the precision of the data may vary depending on the types of mobile phone devices and applications people use [
41]. The method used to identify possible home locations of mobile phone users, involving the ‘homelocator’ package in R [
34], has limitations, as accuracy depends on the reliability and resolution of location data, which may vary among users and mobile devices. As a result, the findings of the mobility analysis cannot lead to a definitive conclusion on whether a geolocated data point represents actual activity, so more information on the trip activities is required. Despite these data-related challenges, our results offer more detailed and up-to-date spatial information compared to traditional census data [
42]. This has allowed us to draw meaningful conclusions and gain valuable insights into the relationship between proximity, TOD, and sustainable living in compact, walkable neighbourhoods.
Future research could gain deeper insights by incorporating these aspects using additional data sources or conducting qualitative surveys. By examining the type of trips made locally or over longer distances and the level of local involvement among different demographics, researchers can obtain a more comprehensive understanding. Furthermore, refining the station classification to better reflect the typologies of the built environment could strengthen the analysis and facilitate a more nuanced sub-grouping of the impact on mobility patterns.
Similarly, while the collective local mobility pattern offers valuable insights, it cannot directly establish a connection with actual urban development. Instead, it provides an inferred likelihood of the condition. To improve the precision of the research findings, it would be beneficial to incorporate other data sources that contain more detailed information on the types of development. Despite these limitations, our study offers valuable insights into the impact of proximity on mobility patterns around transit stations. Future research should address these limitations by incorporating diverse data sources and conducting more comprehensive surveys to ensure a representative analysis of TOD and sustainable living in urban areas.
6. Conclusions
In conclusion, this study highlights the significant role of proximity to transit stations in shaping mobility patterns and promoting sustainable living in the specific context of Auckland City. The findings reveal that residents living closer to these stations in Auckland are more engaged at the local level. This is not merely a general observation; it suggests a likely preference for active transportation among this demographic, which in turn lessens the overall dependency on cars within the city. The study finds that these residents also tend to travel shorter distances individually, which is not only aligned with TOD’s broader ambitions but directly contributes to its practical implementation in Auckland City.
Although proximity to transit stations is a crucial determinant, it is vital to recognise that successful TOD and sustainable communities require a holistic approach considering various factors, such as land use, density of development, and connectivity. The data specific to Auckland indicate that existing rail stations are succeeding in their roles as catalysts for sustainable mobility and community interaction. In other words, the principles of TOD are not theoretical goals; they are actively being realised in the planning and design of Auckland’s neighbourhoods. This underscores the value of planning approaches that prioritise public transport and develop infrastructure within walkable distances to essential services, thus minimising car use in the city.
As we navigate through evolving transportation options and technologies, it is imperative to reassess the traditional half-mile or 15 min walking area as the sole measure of proximity. The emergence of e-mobility and other complex factors influencing human behaviour necessitates re-evaluating the concept of proximity within the context of TOD, a challenge that future research specific to Auckland should address. Our study recommends utilising diverse and qualitative data sources to refine the categorisation of station types further, again focusing specifically on their impact on Auckland’s mobility and sustainability.
In summary, this study makes a focused contribution to urban planning in Auckland by illustrating how proximity to transit stations has a measurable impact on fostering sustainable mobility patterns and enhancing community connectivity in this specific urban environment. By situating these findings within the evolving landscape of transportation technologies, our study lays the groundwork for locally relevant, actionable strategies for city development. The strategic planning of neighbourhoods with higher densities around transit stations will be crucial for the long-term sustainability and resilience of Auckland, as well as serving as a model for other cities.


