Article

Assessing the Urban Vacant Land Potential for Infill Housing: A Case Study in Oklahoma City, USA

by
Francesco Cianfarani
1,*,
Mohamed Abdelkarim
1,
Deborah Richards
1 and
Rajith Kumar Kedarisetty
2
1
Division of Architecture, Christopher C. Gibbs College of Architecture, University of Oklahoma, 830 Van Vleet Oval, Norman, OK 73019, USA
2
Division of Planning, Landscape Architecture and Design, Christopher C. Gibbs College of Architecture, University of Oklahoma, 830 Van Vleet Oval, Norman, OK 73019, USA
*
Author to whom correspondence should be addressed.
Urban Sci. 2023, 7(4), 101; https://doi.org/10.3390/urbansci7040101
Submission received: 8 July 2023 / Revised: 23 August 2023 / Accepted: 26 August 2023 / Published: 26 September 2023
(This article belongs to the Topic Urban Land Use and Spatial Analysis)

Abstract

:
Vacant land in residual urban areas is a crucial resource to tackle the current climate and housing crises. In this study, we present the development of a geodatabase to determine the occurrence of vacant land in the urban core of Oklahoma City, USA (OKC), and assess its potential for infill housing. As a starting point, we define urban vacant land through a literature review. We present a description of the case study’s social and urbanistic context by highlighting its relevance to this study. We explain the methodology for the development of the geodatabase to quantify residual urban land in OKC’s urban core. We examine the spatial distribution and recurring characteristics of vacant parcels using QGIS, Python scripting for Rhinoceros 3D, and aerial imagery. We find that small parcels have higher vacancy rates than average-sized parcels and there is a correlation between higher vacancy rates and proximity to downtown and brownfields. Finally, we discuss the implications of the findings by assessing the urban vacant land potential for residential development and its contribution to OKC’s housing provision. Under all the proposed scenarios, the considered developable vacant land in the urban core could entirely fulfill the need for new housing units for the entire city.

1. Introduction

1.1. Paper Urgency

Rising housing prices and the growing impacts of climate change demand a rethinking of the revision of consolidated paths to housing development in cities. The mutual influence between urban housing and climate resilience policies is indeed one of the most pressing topics to rediscuss the contemporary form of cities. Indeed, the literature widely agrees that a more environmentally conscious urban form implies denser, mixed-use neighborhoods than the mono-functional districts that have characterized most modern cities [1]. At the same time, the need for compact urban environments must coexist with the emergence of climate resilience features that require more open-to-nature layouts to implement passive strategies and on-site green infrastructure [2].
A particularly interesting scenario for discussion is represented by the current planning debate on infill developments in U.S. cities. Despite a modern history of planning policies and practices focused on sprawling urbanization, over the last decade, local U.S. governments have adopted, or proposed legislation to promote soft densification practices and compact urbanization patterns [3,4]. Across the USA, incremental, infill low-rise multifamily housing solutions are gaining momentum due to their compact scale, relative affordability, construction feasibility, and adaptability to green infrastructure strategies. As infill housing solutions grow in popularity, locating vacant urban areas for development has become a priority. Therefore, for the implementation of such projects, efforts of local municipalities are more and more focused on the inventory and classification of urban vacant land (UVL) suitable for development.
UVL is commonly perceived as a symbol of abandonment and neglect in cities. A high percentage of vacant land in urban cores is generally considered a symptom of urban decline, as it generates lower tax revenue, depresses nearby properties, and adds pressure on civic safety and other city services [5,6]. On the contrary, smaller percentages of UVL can be an indicator of healthy economic growth [7], and a valuable resource to serve community needs for green spaces [6,8,9] or vegetable production [10].
There is a vast number of academic studies on UVL in the U.S. context. However, while there are several contributions to classifying vacant land for ecological services [11], less attention is given to geospatial methods for developing UVL inventories to estimate infill housing potential [12]. To contribute to the existing literature, we propose a GIS-based workflow that decision-makers can consider to create a UVL inventory for housing developments. We identified Oklahoma City (OKC, WGS84 35.472989, −97.517054) as an ideal case study to develop such a framework (Figure 1).
In this study, we reconstruct land vacancy in OKC’s urban core in relation to its socioeconomic and urbanistic history. We assemble a vacancy geodatabase, which includes fields related to formal, functional, and fiscal data. In addition, we provide classification criteria to extract qualitative and quantitative data associated with UVL vacancy. Finally, we estimate the potential contribution of UVL for the current OKC housing need, by choosing site selection parameters that foster environmentally conscious, infill residential solutions. We conclude by discussing the limitations of our study and complementary approaches that can improve our methodology.

1.2. Objectives and Use-Cases

Our project aims to meet both global and local objectives. On a global scale, our study seeks to contribute to the contemporary interdisciplinary topic of UVL, discussing its characteristics and infill potential in relation to current housing and climate crises. Our detection methodology and workflow provide sources to build geodatabases to perform GIS analysis for UVL identification for a variety of housing providers, including planning officers, neighborhood associations, developers, and designers.
At the local level, the study contributes to the current debate on land vacancy in states located within the Central United States, hoping that the methodologies, data, and interpretations discussed below will support the creation of county or municipal authority land banks and a set of revised city policies and zoning rules for incentivizing infill housing developments.

2. Literature Review and Case Study Presentation

2.1. Definitions of UVL

There is no single, widely recognized definition of UVL [7,13]. However, the literature on UVL is vast and discusses the topics from different disciplinary angles, including urban geography, city planning, real estate, urban design, and landscape architecture [6,7]. Most recent definitions of vacant land encompass a variety of land conditions, including recently razed land, derelict land, land with abandoned buildings and structures, brownfields, bare soils, greenfields, and agricultural soils [6].
Academic interpretations traditionally diverge from definitions adopted by city planning offices to construct land inventories [14]. The latter defines vacant land primarily according to the following characteristics: tax parcels with zero-dollar building value in the local tax assessor’s records; tax parcels with no structures; and underutilized and developable city-owned properties, such as surface parking.
Our definition of vacant land stems from the above-mentioned ones, referring to UVL as residual public and private parcels located in a city core, with no area or width limitation and no permanent buildings. For this study, our description of UVL includes the case of formerly developed lots, never-developed parcels, and underutilized parcels with minimum developments, such as surface parking areas (Figure 2).

2.2. Causes and Characteristics of the UVL Phenomenon

The land vacancy phenomenon can be detected in both inner cores and suburban fringes, either in expanding or shrinking cities [15,16,17,18].
However, there is a broad academic consensus in identifying disinvestment (or lack of reinvestment of capital), suburbanization, annexation, and deindustrialization, as primary causes of land vacancy increase [15]. Similarly, changes in people’s preferences for new housing types, housing foreclosures, subsequent abandonment, demolition, and environmental issues, including contamination, can result in vacant land [13].
Conversely, among the reasons for low UVL rates, studies cite a growing local economy, city incentives that favor infill, population in-migration, and less restrictive city land-use policies [15].
In the past, research on the U.S. context has associated land vacancy with recurring urbanistic reasons. Indeed, studies on U.S. cities have often associated the UVL phenomenon with postwar federal policies that led to suburbanization, urban renewal, and interstate highway programs. Similarly, studies have discussed a correlation between redlining practices and land vacancy in U.S. urban cores [5,17].
Other reasons, specific to the nature of the single parcel, can lead to vacancy. Research identifies the size and shape of vacant parcels as potential development barriers, as small and odd-shaped parcels are usually the most difficult to develop [15,18,19]. In addition, zoning requirements can limit the development of small parcels [20]. Furthermore, either small or large parcels can manifest other development barriers related, for example, to a problematic location in the city [13,15,21]. Other recurring causes cited in the literature include real estate speculation, perceived contaminations, steep slopes, utility easements, infrastructure problems, or wetlands [13,21].
The definitions suggest that the UVL phenomenon is intrinsic to cities, and land vacancy’s impact on urban communities depends on cities’ demographic and economic trends. As a result of such interdependency, researchers are very cautious about identifying positive and negative thresholds for UVL area percentages. Limiting the discussion to the U.S. context, over the years, studies have calculated the average vacancy rate in U.S. cities. According to Newman, the average vacant land to total land percentage in large U.S. cities is 16.7% [15]. Another recent, comprehensive study on residential land vacancy in 65 American cities calculated a vacancy rate of 11.48% [18].
The variation of results is related to multiple reasons, including different definitions and analysis criteria for UVL detection and classification. Regional variations exist for the amount and typology of vacant land detected, as well as for the types of cities surveyed, which range from growing metropolises to shrinking mid-cities.

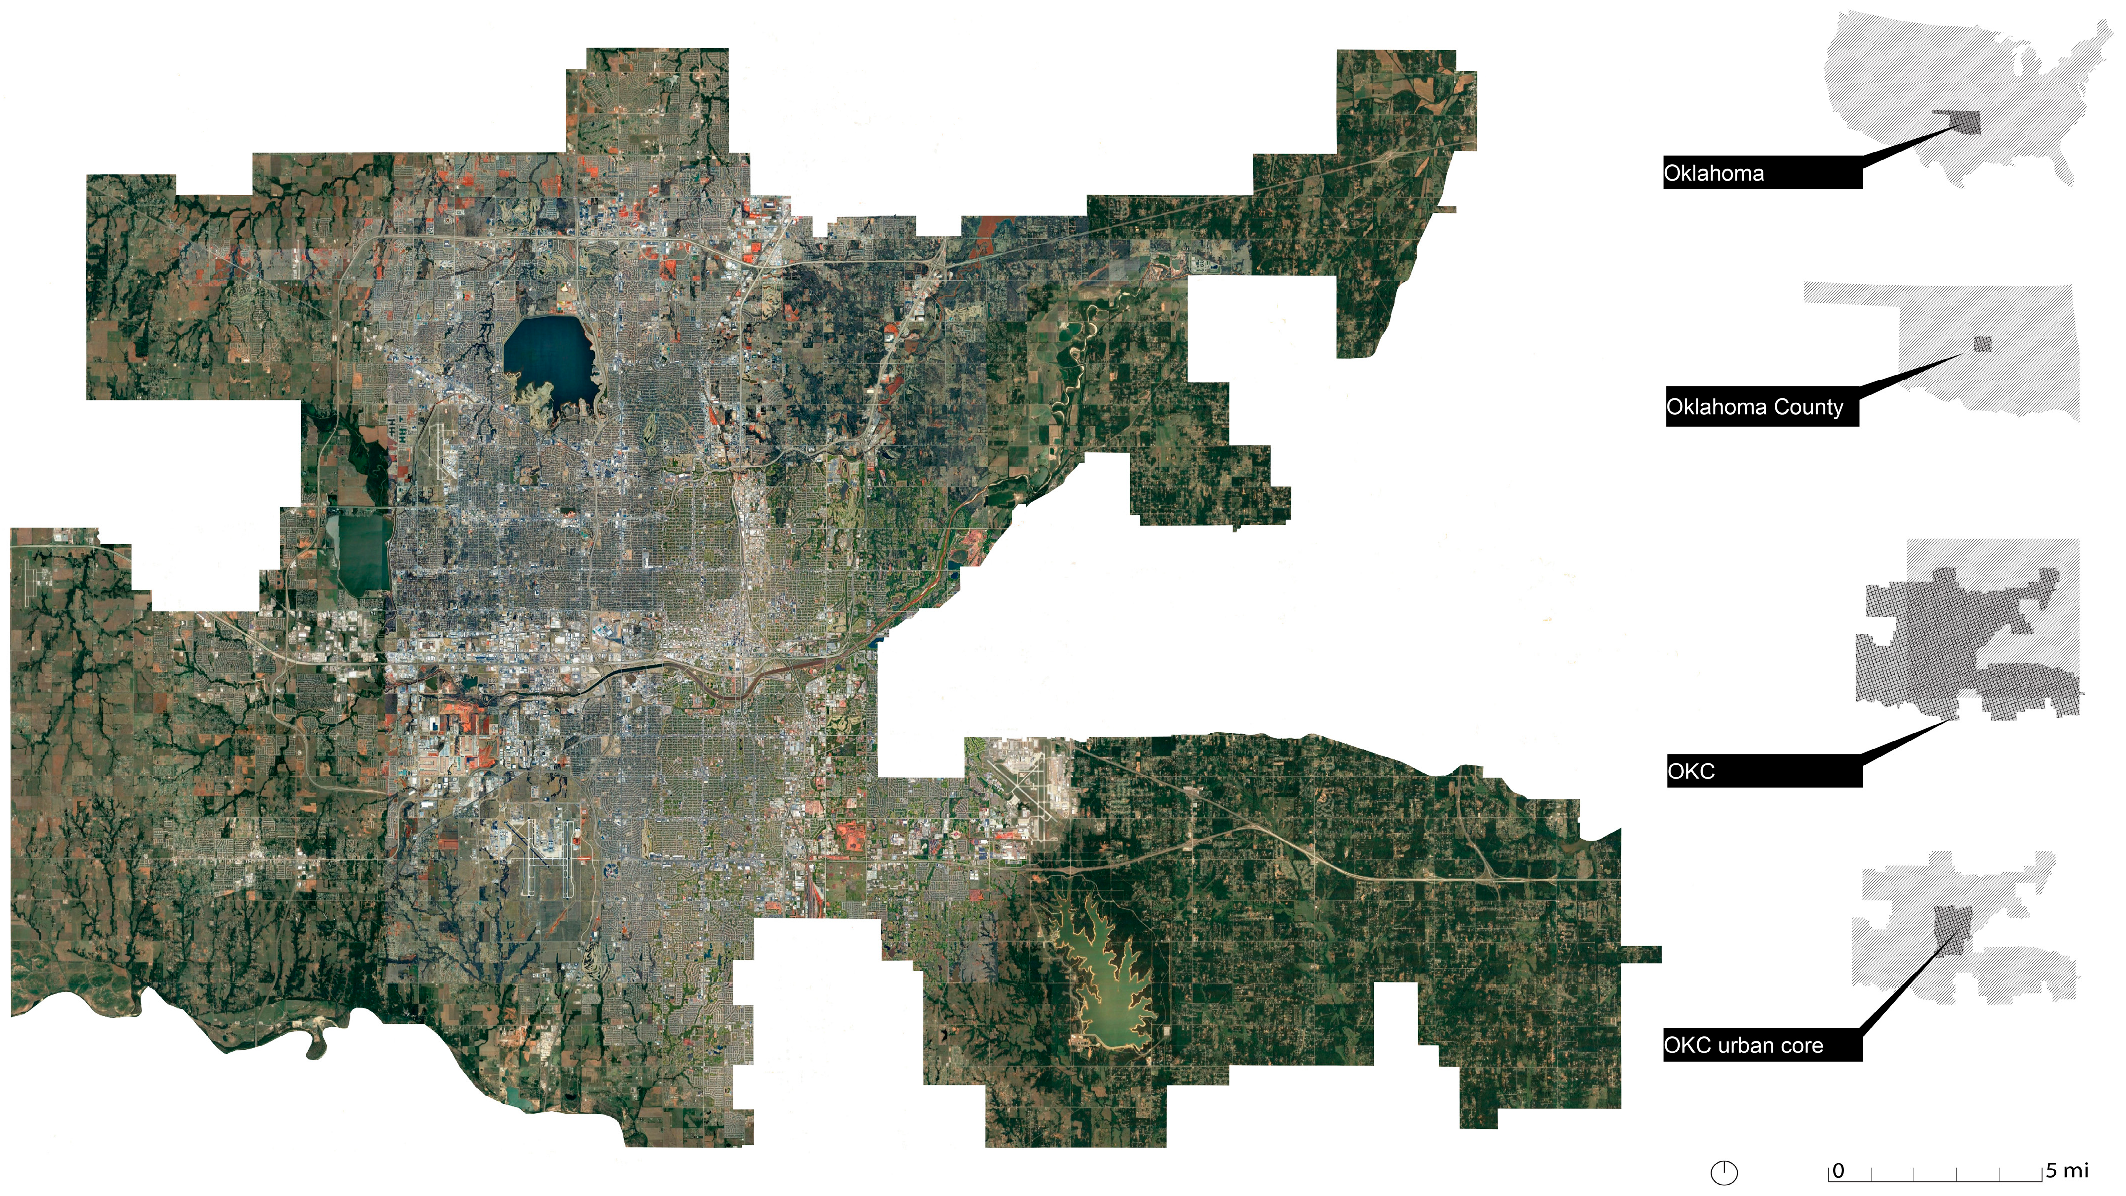
2.3. Reasons for OKC as a Case Study

OKC (pop. 688361, as of 2021) is an ideal case study to consider UVL, as it encapsulates the main features of a growing middle U.S. city [22]. The city was founded in 1889, at the intersection between the Southern Kansas Railway and the Oklahoma River. The first additions that further defined its original rectangular gridiron were made of walkable blocks (approximately 122 × 91 m), with sixteen 15 × 43 m parcels. Low-rise residential neighborhoods, connected to downtown by a robust streetcar network, and middle housing types, like duplexes or fourplexes, had characterized the city’s growth until the 1940s [23]. For most of the twentieth century, OKC has continuously expanded its boundaries. Such land annexation policy was exasperated during the postwar years. In 1941, the city had a physical extent of 65 km2. In the following twenty years, OKC launched an aggressive land annexation program, by adding about 1554 km2 to its area, to prevent surrounding towns from expanding their territories and reducing the city’s economic growth opportunities [14]. Like other U.S. cities, the rapid postwar migration of middle-class white households from downtown OKC towards the suburbs led to population loss and land vacancy in the urban core. In 1940, downtown OKC hosted roughly 54,000 residents. According to recent studies, the same area currently hosts about 9000 residents [24].
In the postwar years, the decline of OKC’s urban core was accelerated by extensive urban renewal programs, such as architect I.M. Pei’s downtown redevelopment plan [25]. Adopted in 1965, Pei’s plan aimed to turn approximately 200 hectares of mixed-use, walkable blocks into modern superblocks. However, due to financial restrictions, the renewal plan was only capable of implementing massive demolitions in the historic downtown and failed to rebuild its social and physical fabric (Figure 3). This disinvestment led to a landscape of abandoned properties and vacant land, negatively affecting the city for decades [26].
Like urban renewal, during the 1970s, the extent of the interstate highway network in OKC wiped out several downtown mixed-use neighborhoods with a fine-grained pattern of development. In particular, the implementation of Interstate 235 bisected downtown and hit particularly hard the historic African-American communities of Deep Deuce and Harrison-Walnut [27].
OKC’s great land area (1570 km2) and low population density (435 inhabitants per km2) make it an ideal example of a car-dependent city. Its considerable land extension and suburban development that happened in the last century have forced the city to stretch its vehicular infrastructure dramatically. Consequently, according to most recent municipality documents, 4% of the total OKC area is dedicated to parking lots, which corresponds to roughly 62 km2 (Figure 4), more or less the area of Manhattan in New York City [28].
Updated census data show that poverty in OKC’s core is concentrated in the east and south quadrants of the city, where, respectively, mostly African American and Hispanic communities live. Conversely, most of OKC’s white population lives in the northwest neighborhoods, usually inhabited by higher-income households [29]. This demographic sorting mirrors decades of exclusionary planning policies. An overlay of a redlining map with a 2020 OKC’s urban core income map shows that the wealth distribution in OKC is still affected by early twentieth-century discriminatory practices (Figure 5).
The housing market in OKC is still oriented towards single-family housing. Between 2010 and 2019, single-family homes accounted for 89% of all new units built, while 11% of new residential construction was multifamily projects. Only 5% of the new residential units between 2010 and 2019 were collectively built within the downtown and the central subarea [30].
These urbanistic and socioeconomic factors still significantly impact the quantity of vacant land in OKC’s urban core. However, over the last 20 years, OKC’s central core has experienced signs of growth. This was made possible by a general economic upturn in the city. A series of municipal capital improvement programs and private investments introduced new land uses and activities downtown [26]. Since then, the urban core has steadily continued growing until today, but slowly when compared to the suburban areas of the city [30].
Based on recent studies on land vacancy [15], OKC can be classified as a “compressing city,” or a city that has gained population while not gaining land area over the last 10 years. This situation makes vacant urban land a key competitive asset for the city’s growth. However, like other mid-size U.S. cities, in OKC, sustainable infill is made difficult by structural aspects. One reason for such a persistent land vacancy is related to the city’s tax revenue structure. Compared to national data, in OKC, property taxes for UVL are very low, resulting in owners who are encouraged to keep their vacant parcels underutilized for long periods. Additionally, few development incentives in the urban core area motivate landowners to develop or sell their properties.
The current zoning ordinance represents another obstacle to UVL development. Bulk standards for residential districts make affordable housing developments in parcels less than 557.41 m2 (6000 sq ft) and less than 15.24 m (50′) wide difficult [31].
Such financial and regulatory disincentives limit the city’s ability to tackle the housing shortage problem, especially for low- and moderate-income households. By relying on the most recent gap analyses for housing demand, Oklahoma City has a total current need for approximately 44,600 units, including 10,400 new housing units for rental and ownership [30].

2.4. Previous Inventories and Studies on OKC Vacancy

Currently, there is no comprehensive inventory of UVL for OKC. The only vacant public land inventory is managed by the Oklahoma City Urban Renewal Authority [32], the leading OKC public agency charged with the revitalization of the public land downtown. OCURA land inventory is accessible online and periodically updated. However, the inventory does not include all the vacant parcels owned by the City and other public authorities.
There are very few recent studies on privately owned vacant parcels in OKC. The most accurate study on the topic is the 2012 report drafted by GSBS Richman Consulting on vacant and abandoned properties. The study focuses on analyzing both vacant and abandoned buildings in OKC and provides aggregated data on land vacancy, classified by wards. According to this report, the average percentage of vacant lots in OKC is 9.2% [33].

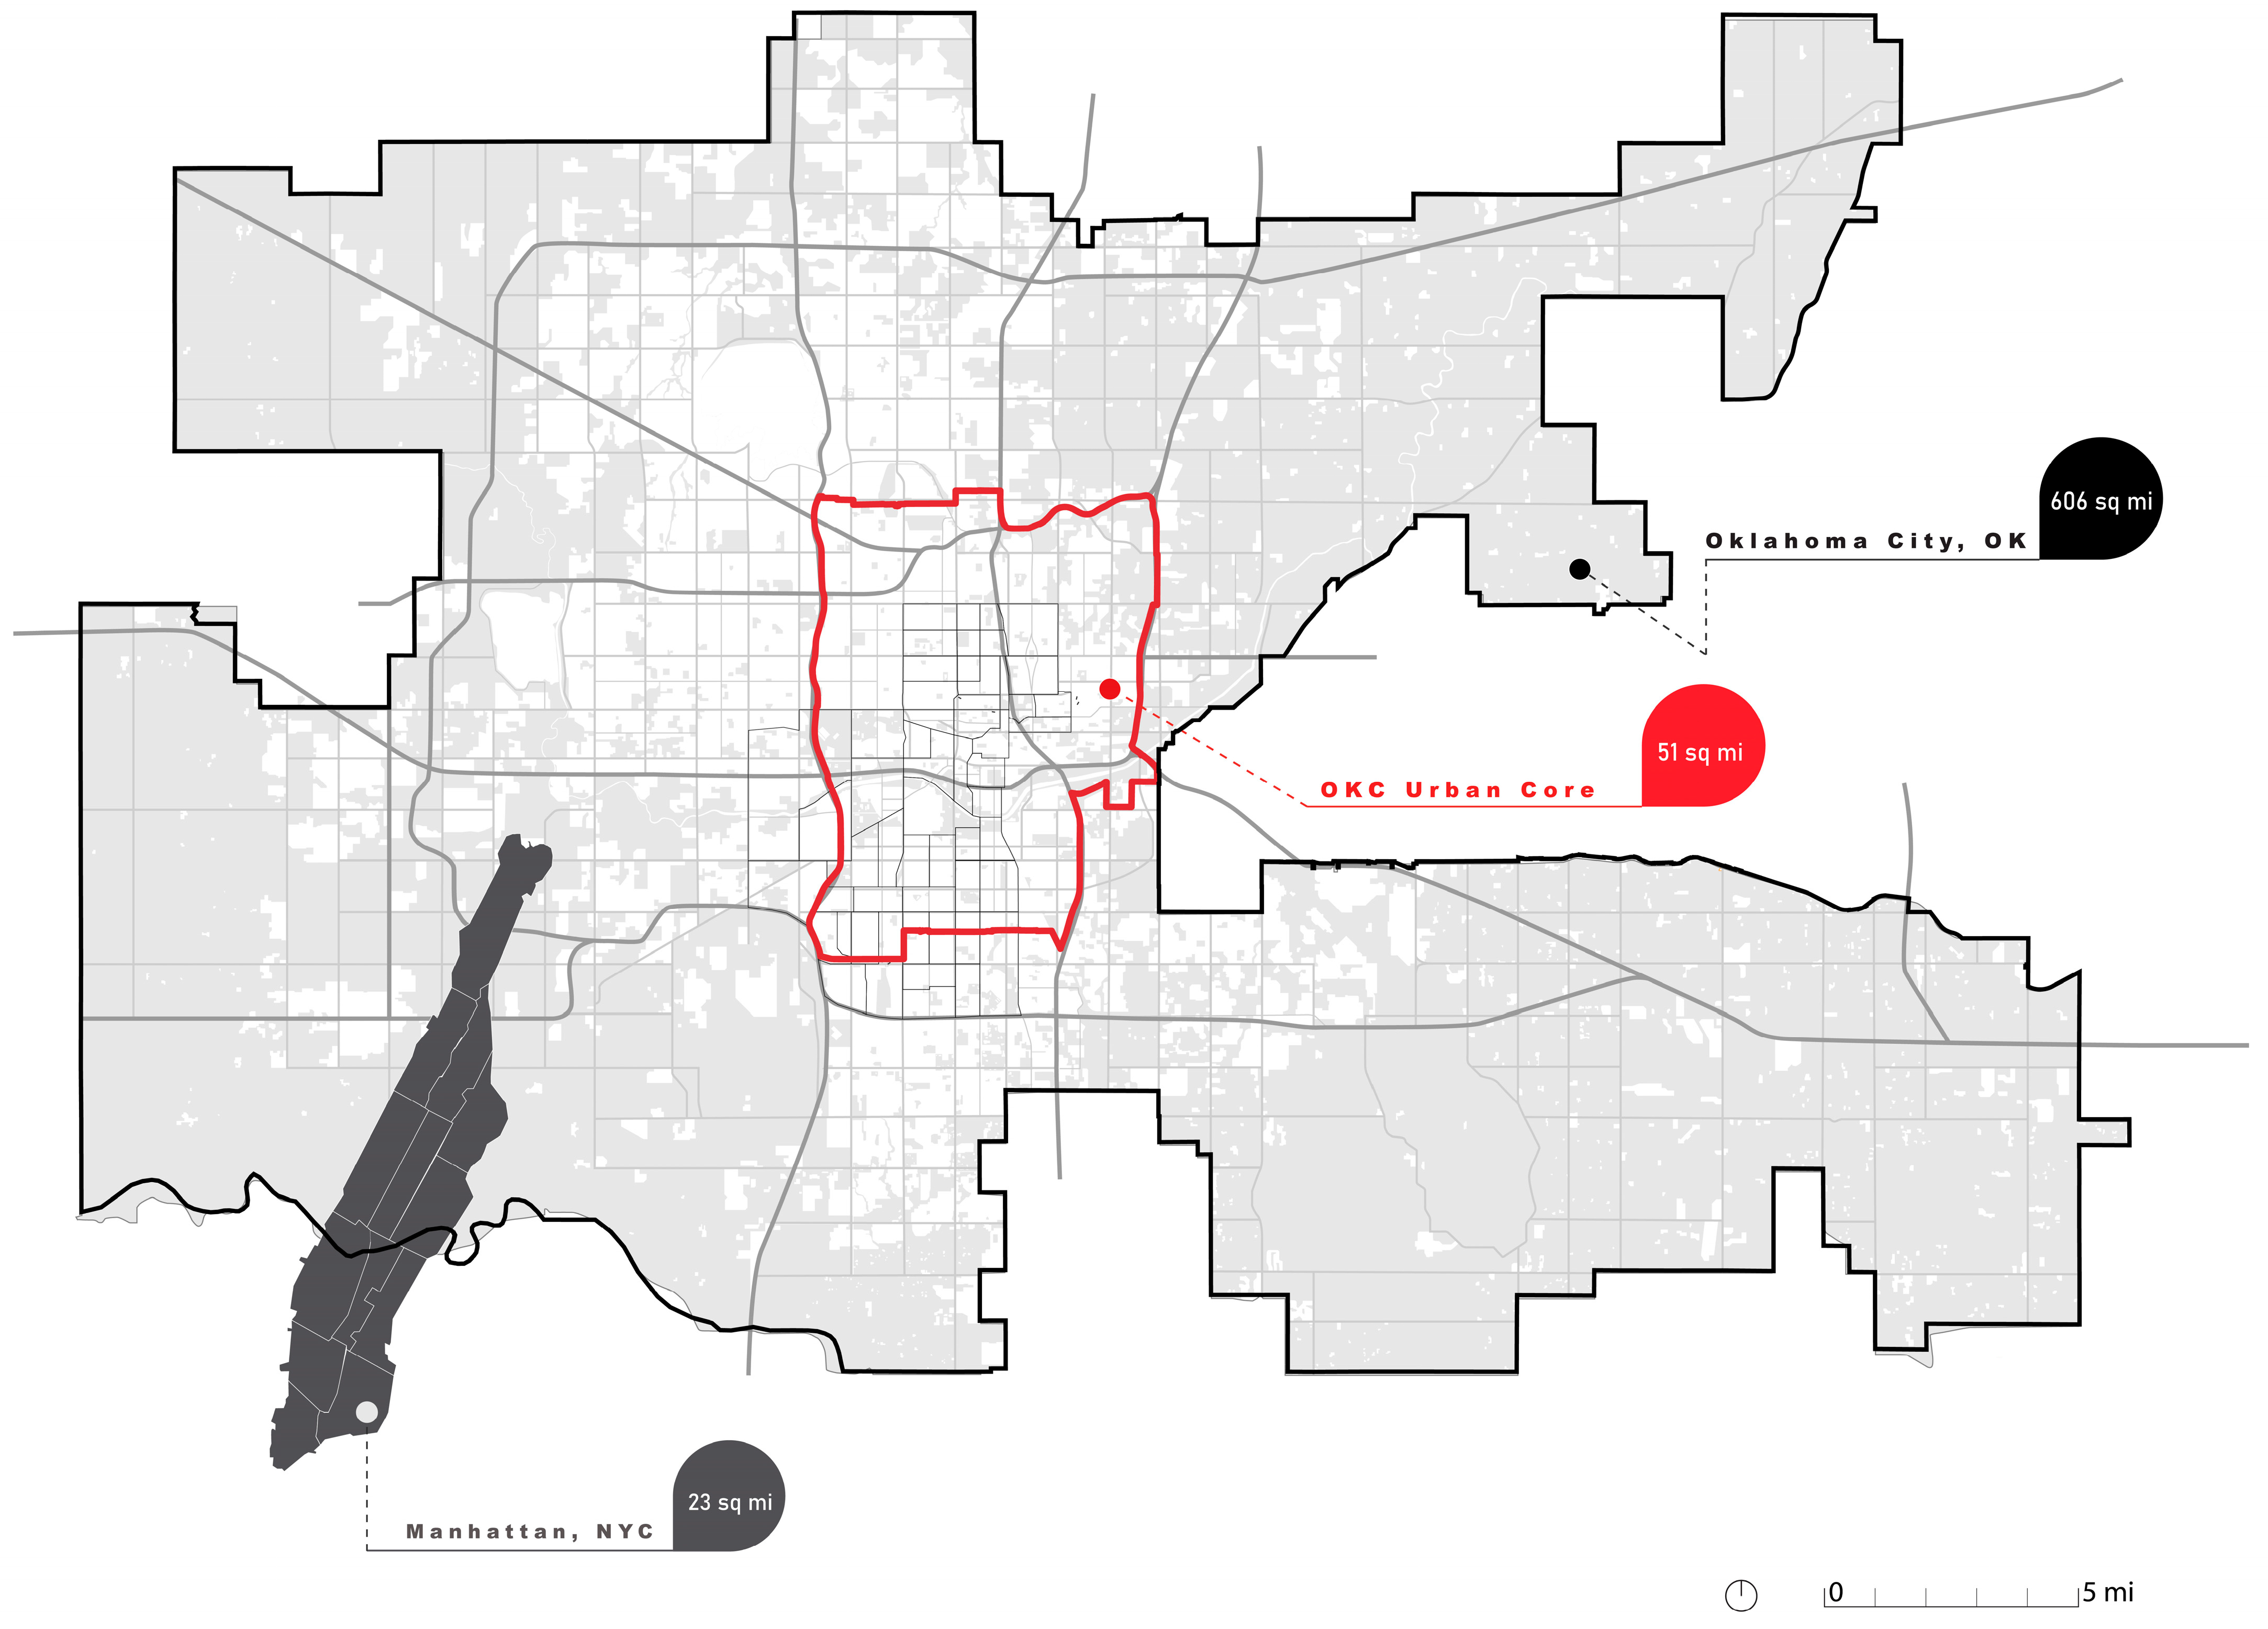
2.5. Analysis Extent

For the scope of this project, we focused on the urban core of OKC (132.28 km2, 65,940 tax parcels total). Our definition of urban core aligns with the area identified as “Urban: Medium Intensity (U.M.),” including the designated Urban High and Downtown areas by OKC’s current Comprehensive Plan [34], which approximately matches the urbanized areas of the city built before the land additions of the 1960s.
We defined a geographic center point to develop a spatial analysis of detected UVL. As a center, we identified the intersection between Gaylord Boulevard and Sheridan Ave, where the city’s N-S and W-E demarcation lines pass (35.466477, −97.512972).

3. Materials and Methods

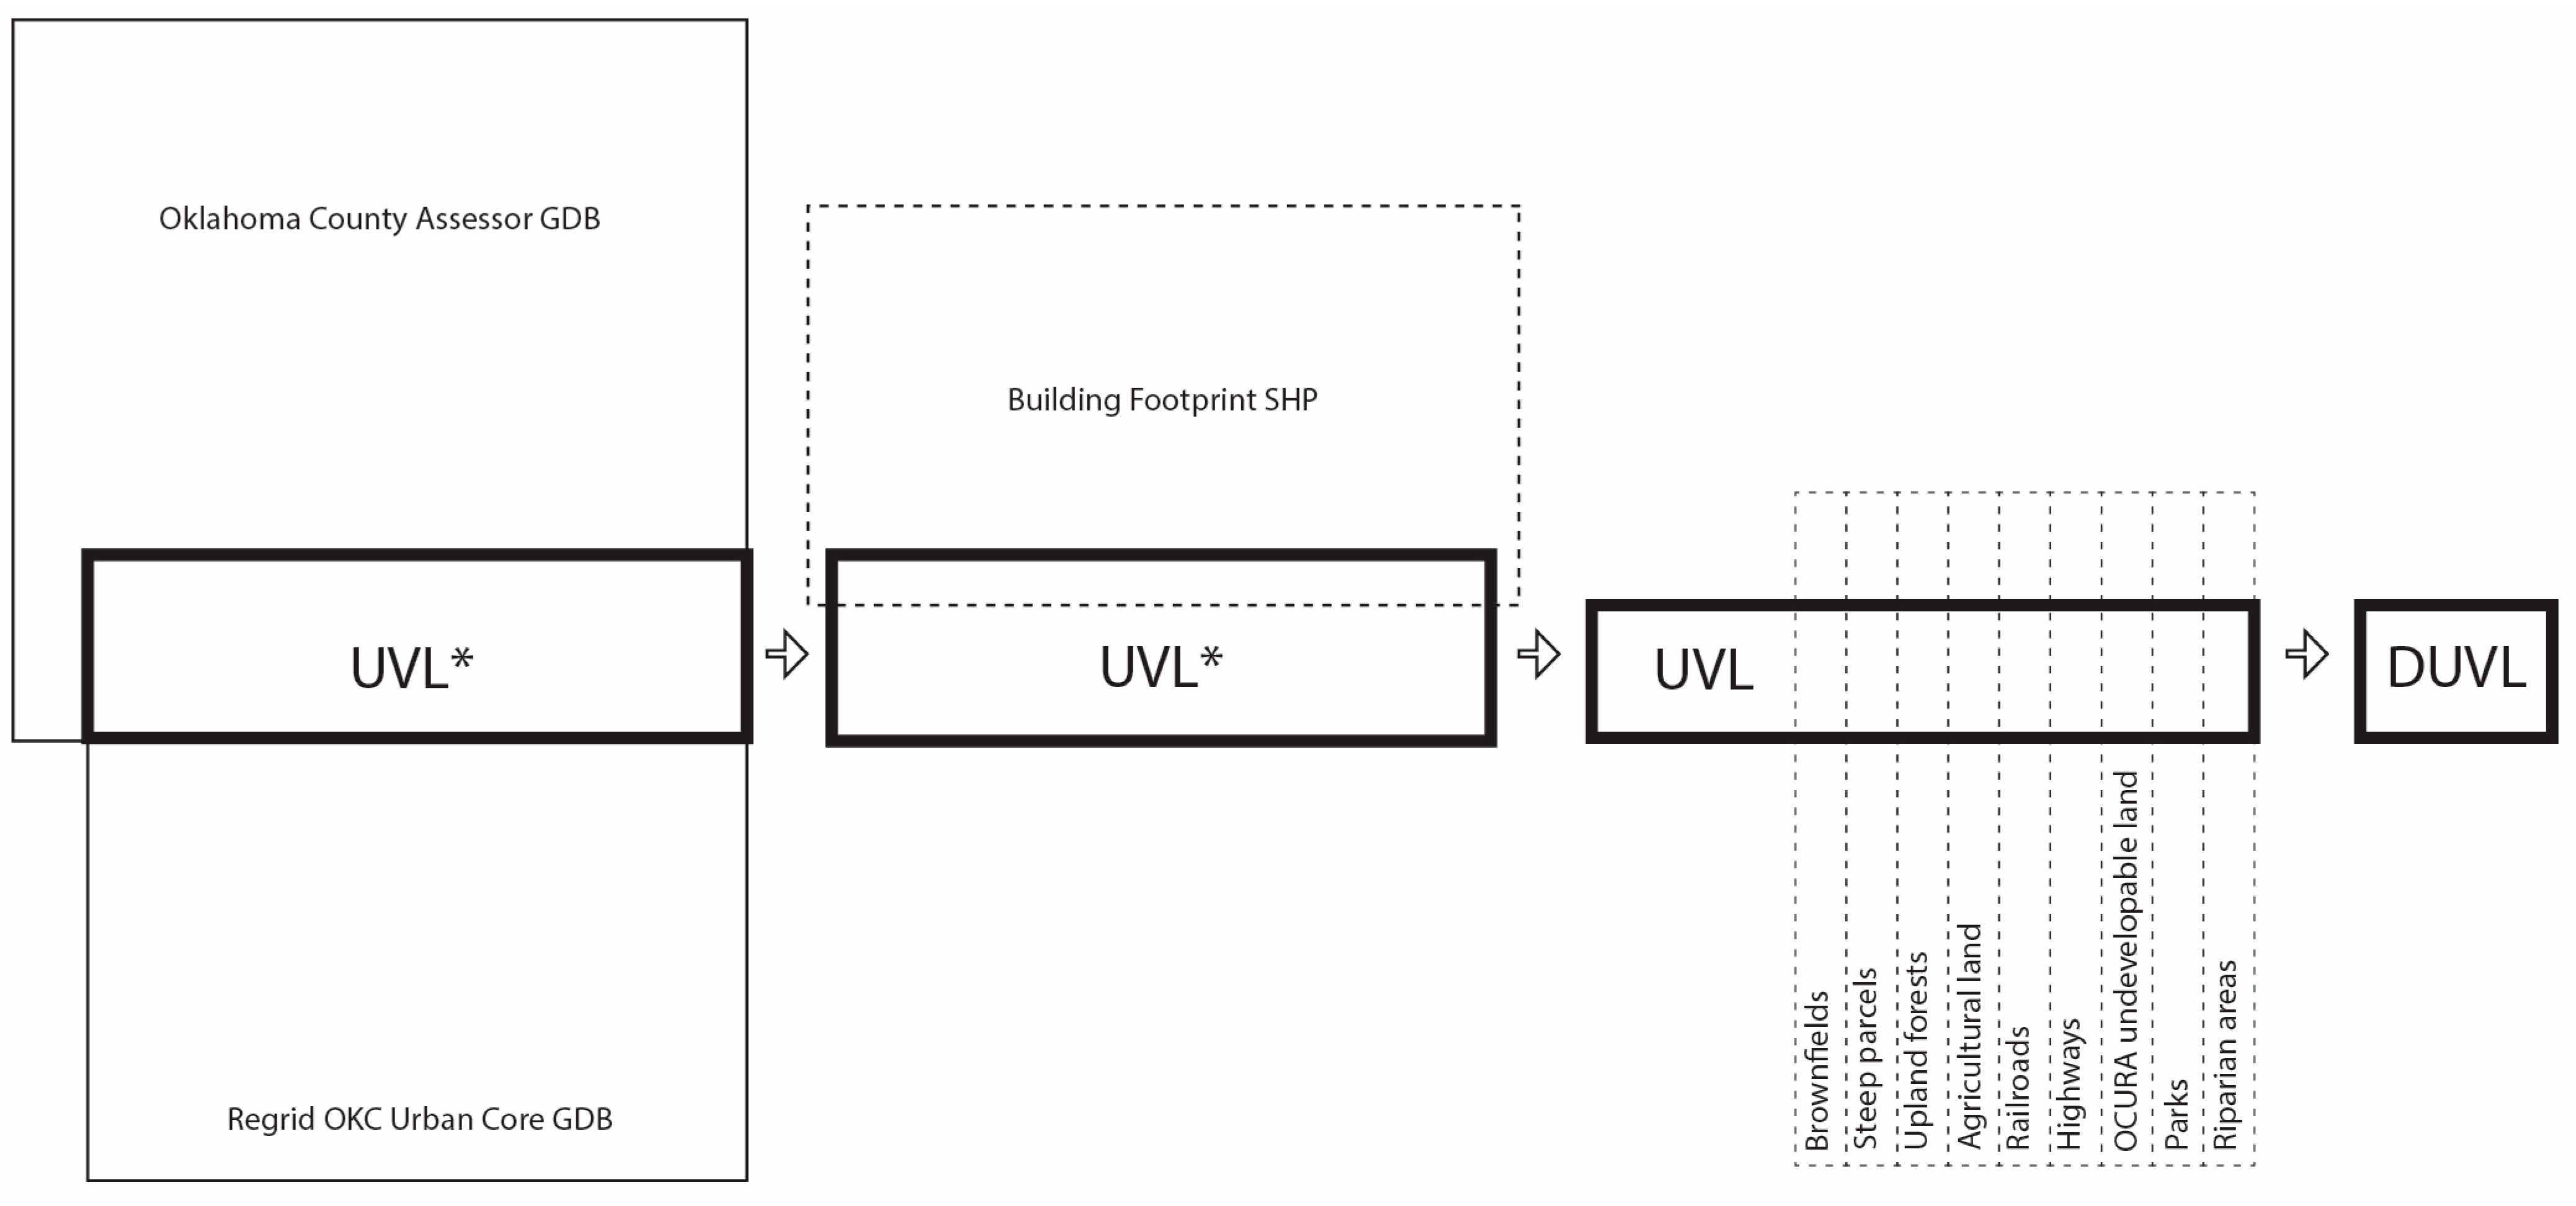
3.1. Geodatabase Construction

All the datasets adopted for this project are reported in Supplementary Materials (Table S1). Most of the datasets adopted for the geodatabase are from web resources managed by public institutions, mostly the Oklahoma City Open Data Portal and the Oklahoma County Assessor Database. Although OKC has not yet developed a vacant property database, the City Open Data Portal provides an extended and detailed set of environmental and urban data [35]. The Oklahoma County Assessor Database provides publicly accessible parcel-level cadastral data, including ownership, sale price, and tax information, but no information related to vacancy. The most recent update to the County Assessor Database was in September 2022 [36]. All the steps for the geodatabase construction were implemented in QGIS 3.26.
To build a preliminary land vacancy dataset, we consulted the web mapping tool Regrid from Loveland Technologies, which shares datasets on building counts for tax parcels [37]. The Regrid dataset used for this study was last updated in September 2022. First, we detected UVL through an overlay of Regrid Calculated Building Count data, with County Assessor data provided by the Oklahoma County Assessor. On Regrid Webportal, we filtered the online database by searching for parcels with no improvements. According to Regrid datasets, we found 9223 parcels (16.64 km2) with no buildings in OKC’s urban core, corresponding to 13.99% of total tax parcels. By randomly checking Regrid parcels with aerial images and street views from Google Maps, we found that results from Regrid included right-of-ways, parcels on railroads and highways, oil fields, riparian areas, and green spaces, such as parks, gardens, and golf courses. In addition, public and underutilized private parcels, or parcels with no buildings but minimum developments, such as side yards connected to residential properties, or dedicated surface parking lots for commercial activities, were included.
As complementary information to the one acquired from Regrid, we merged Regrid and County Assessor databases to combine spatial and fiscal data on QGIS. We filtered the attribute table of the County Assessor GDB, by searching for parcels in OKC’s urban core where the market value equaled the land value. We found 11,024 parcels (16.71% of total tax parcels) where the market value was equal to the land value. This table included tax-exempt parcels, such as city properties, and land held by religious ministries, educational institutions, or nonprofit organizations (3002 parcels, 4.55% of total tax parcels).
Since datasets are always behind actual counts, to validate our data, we intersected the Regrid parcel shapefile with the 2022 Oklahoma City Building Footprint shapefile from the OKC Data Portal. The intersected parcels were manually checked by using aerial images from Google Maps and eye-level views from Google Street View. We identified 287 parcels from the Regrid list (3.11% of the database), which did not conform to our definition of UVL and, therefore, could not be considered for infill developments. Most of the vacant parcels subtracted from the database were parcels under development in 2022, or small lots recently filled with a building.
We finally identified 8936 UVL parcels in OKC’s urban core (13.55% of total tax parcels), for an overall vacant area of 15.25 km2 (Table S2a).

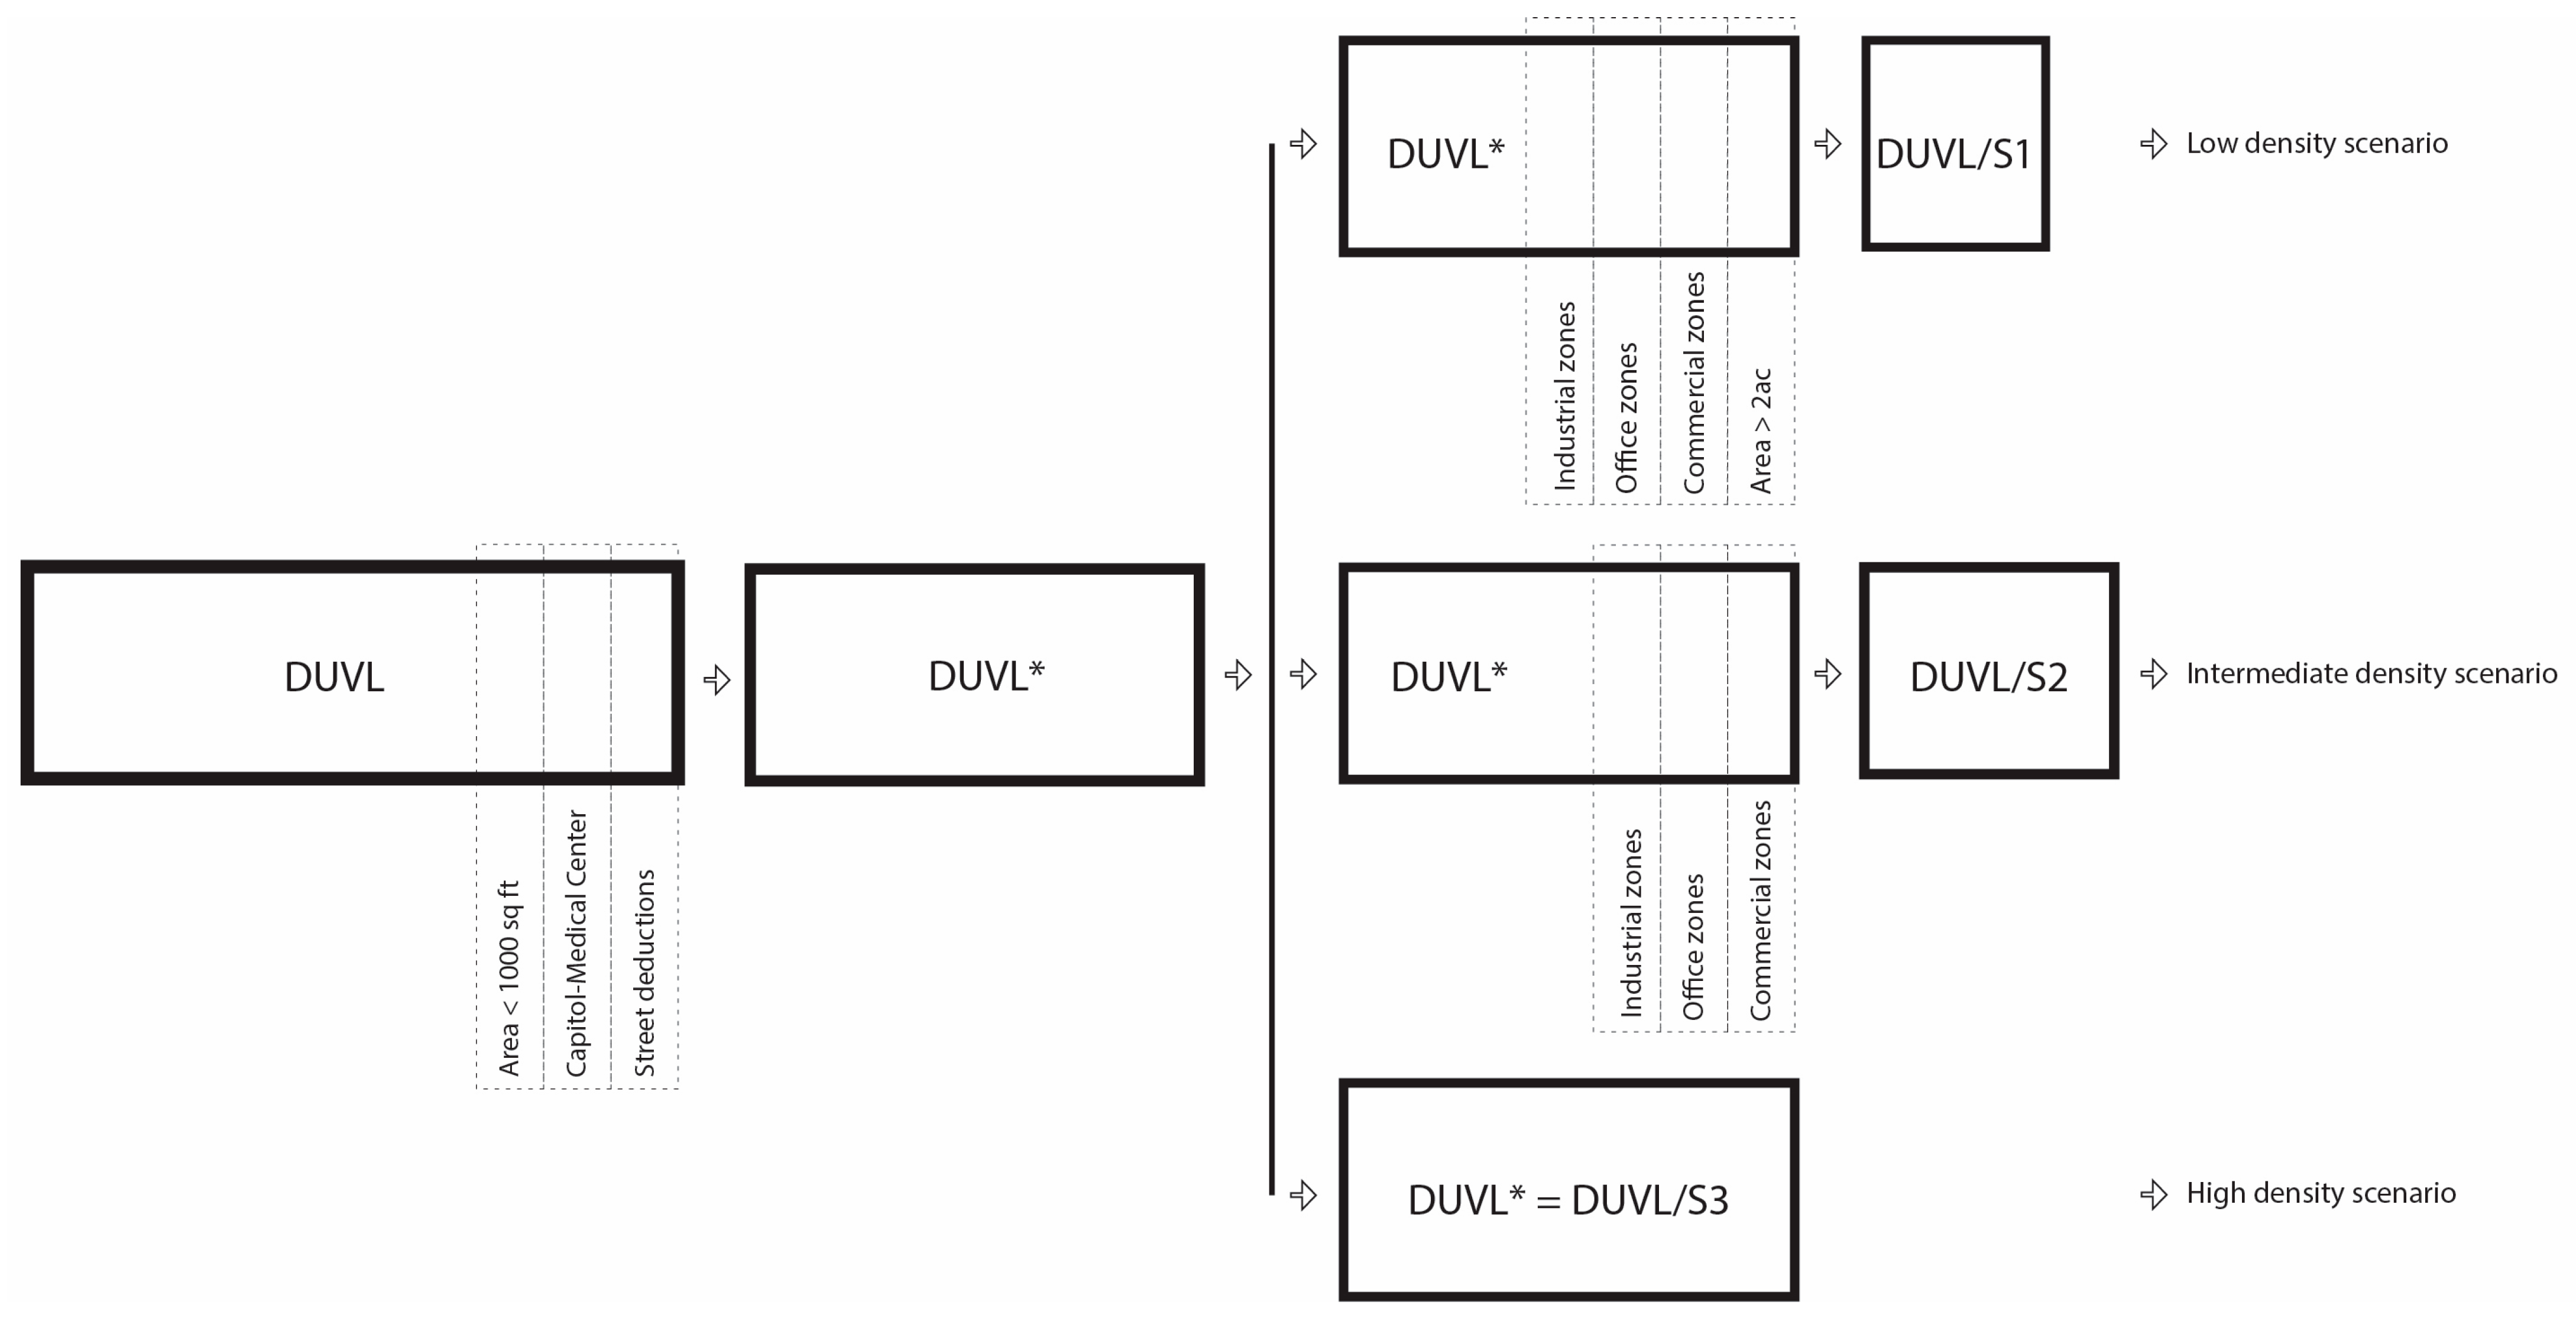
3.2. Detection of Developable UVL (DUVL)

The first research step detected all the public and private UVL in OKC’s urban core, including parcels with no permanent buildings used for recreational or productive purposes. Moving from GIS-driven identification methodologies developed by the literature [12,18,21,38], the second step identified developable urban vacant land (DUVL) for infill developments, including, but not limited to, residential uses.
To create the DUVL dataset, we excluded all the vacant parcels that usually are discouraged from development according to sustainable development criteria [34,39]. In this category, one can find vacant parcels with steep slopes (more than 25%), vacant parcels in upland forests or riparian areas, and green spaces, such as parks and reserves. In addition, vacant parcels with high potential conversion costs, such as brownfields, were excluded. Differences between datasets have been calculated by intersection and selection tools in QGIS.
The categories of vacant land subtracted to detect DUVL are reported in Table S2b. Most of the intersected shapefiles used in the analysis are from the City Open Data Portal. To analyze the slope, we created a Triangulated Irregular Network (TIN), which was used to extract elevation data. We first converted the contour line datasets from the OKC Data Portal into TIN format. Then we converted TIN into a raster Digital Elevation Model (DEM) image, with a resolution of 73 × 73 m, and used the slope and analysis tools from the 3D Analysis tools.
The number of DUVL parcels in OKC’s urban core is 7015, approximately 78.50% of UVL in the urban core, for a total area of 8 km2 (Figure 6). The percentage of DUVL in the total number of tax parcels is 10.64%, while the percentage of the DUVL area to the overall tax parcel area is 8.21%. The decision tree to detect UVL and DUVL is synthesized in Figure 7.

4. Results

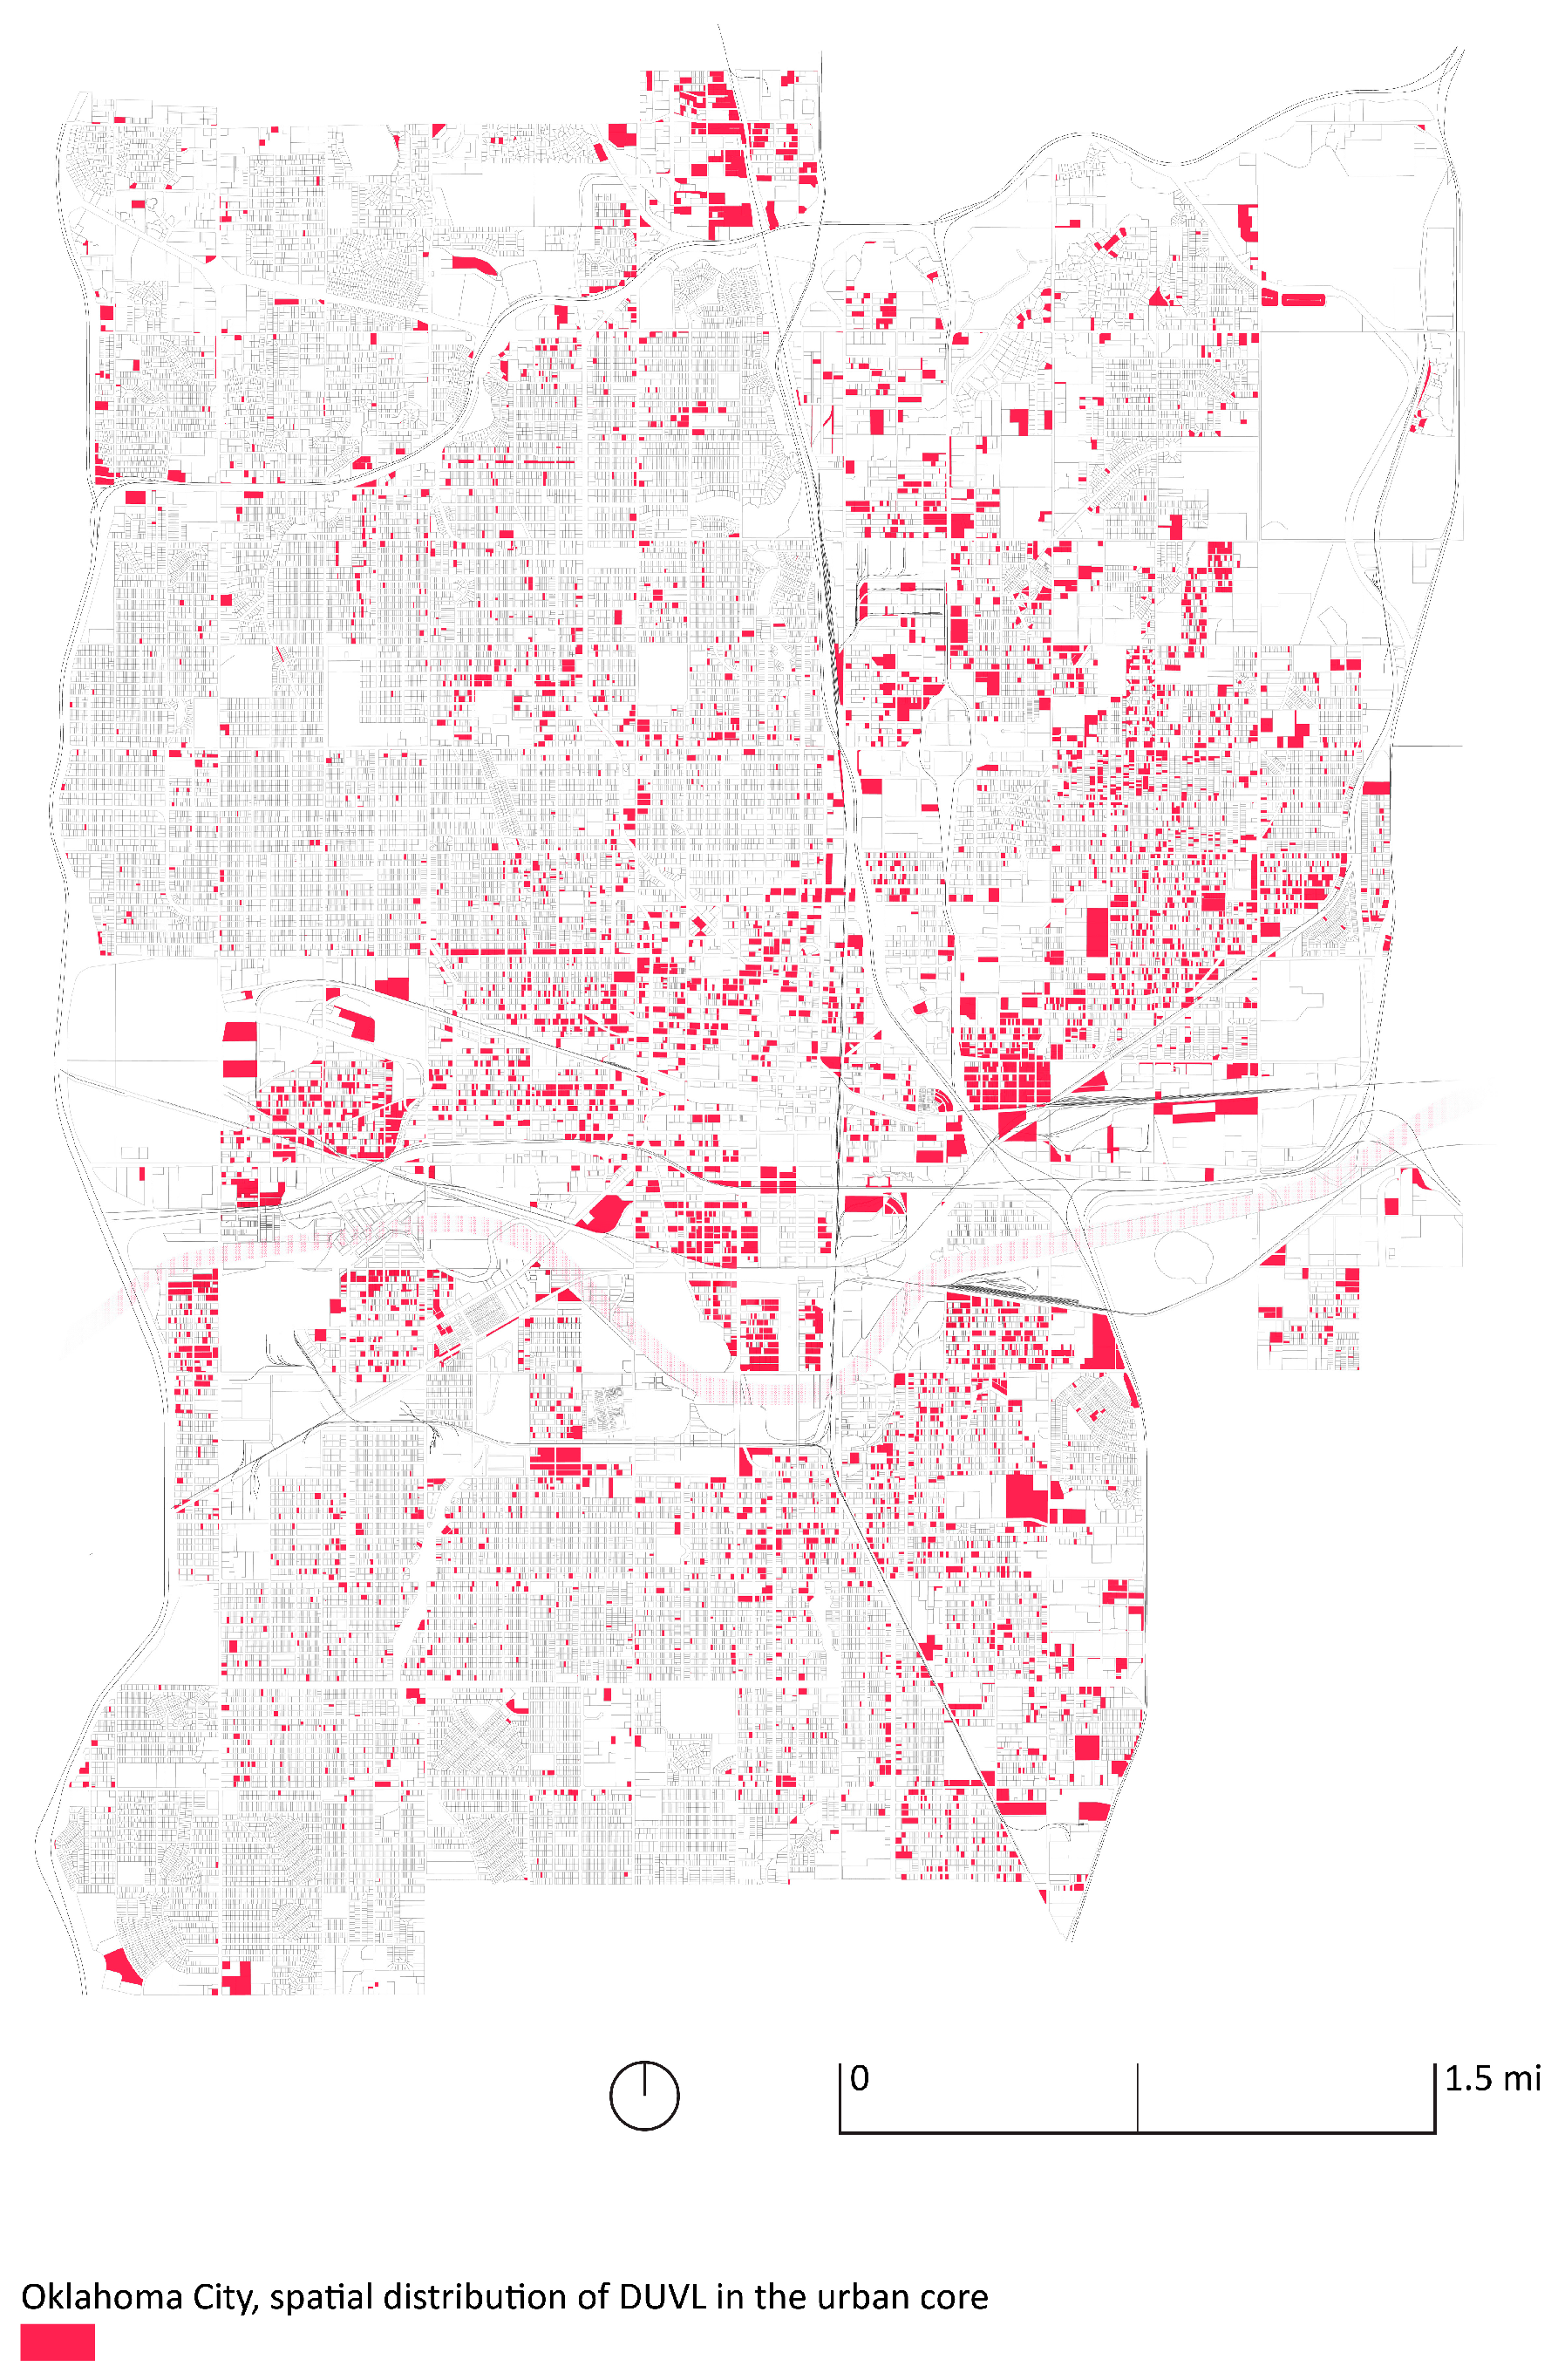
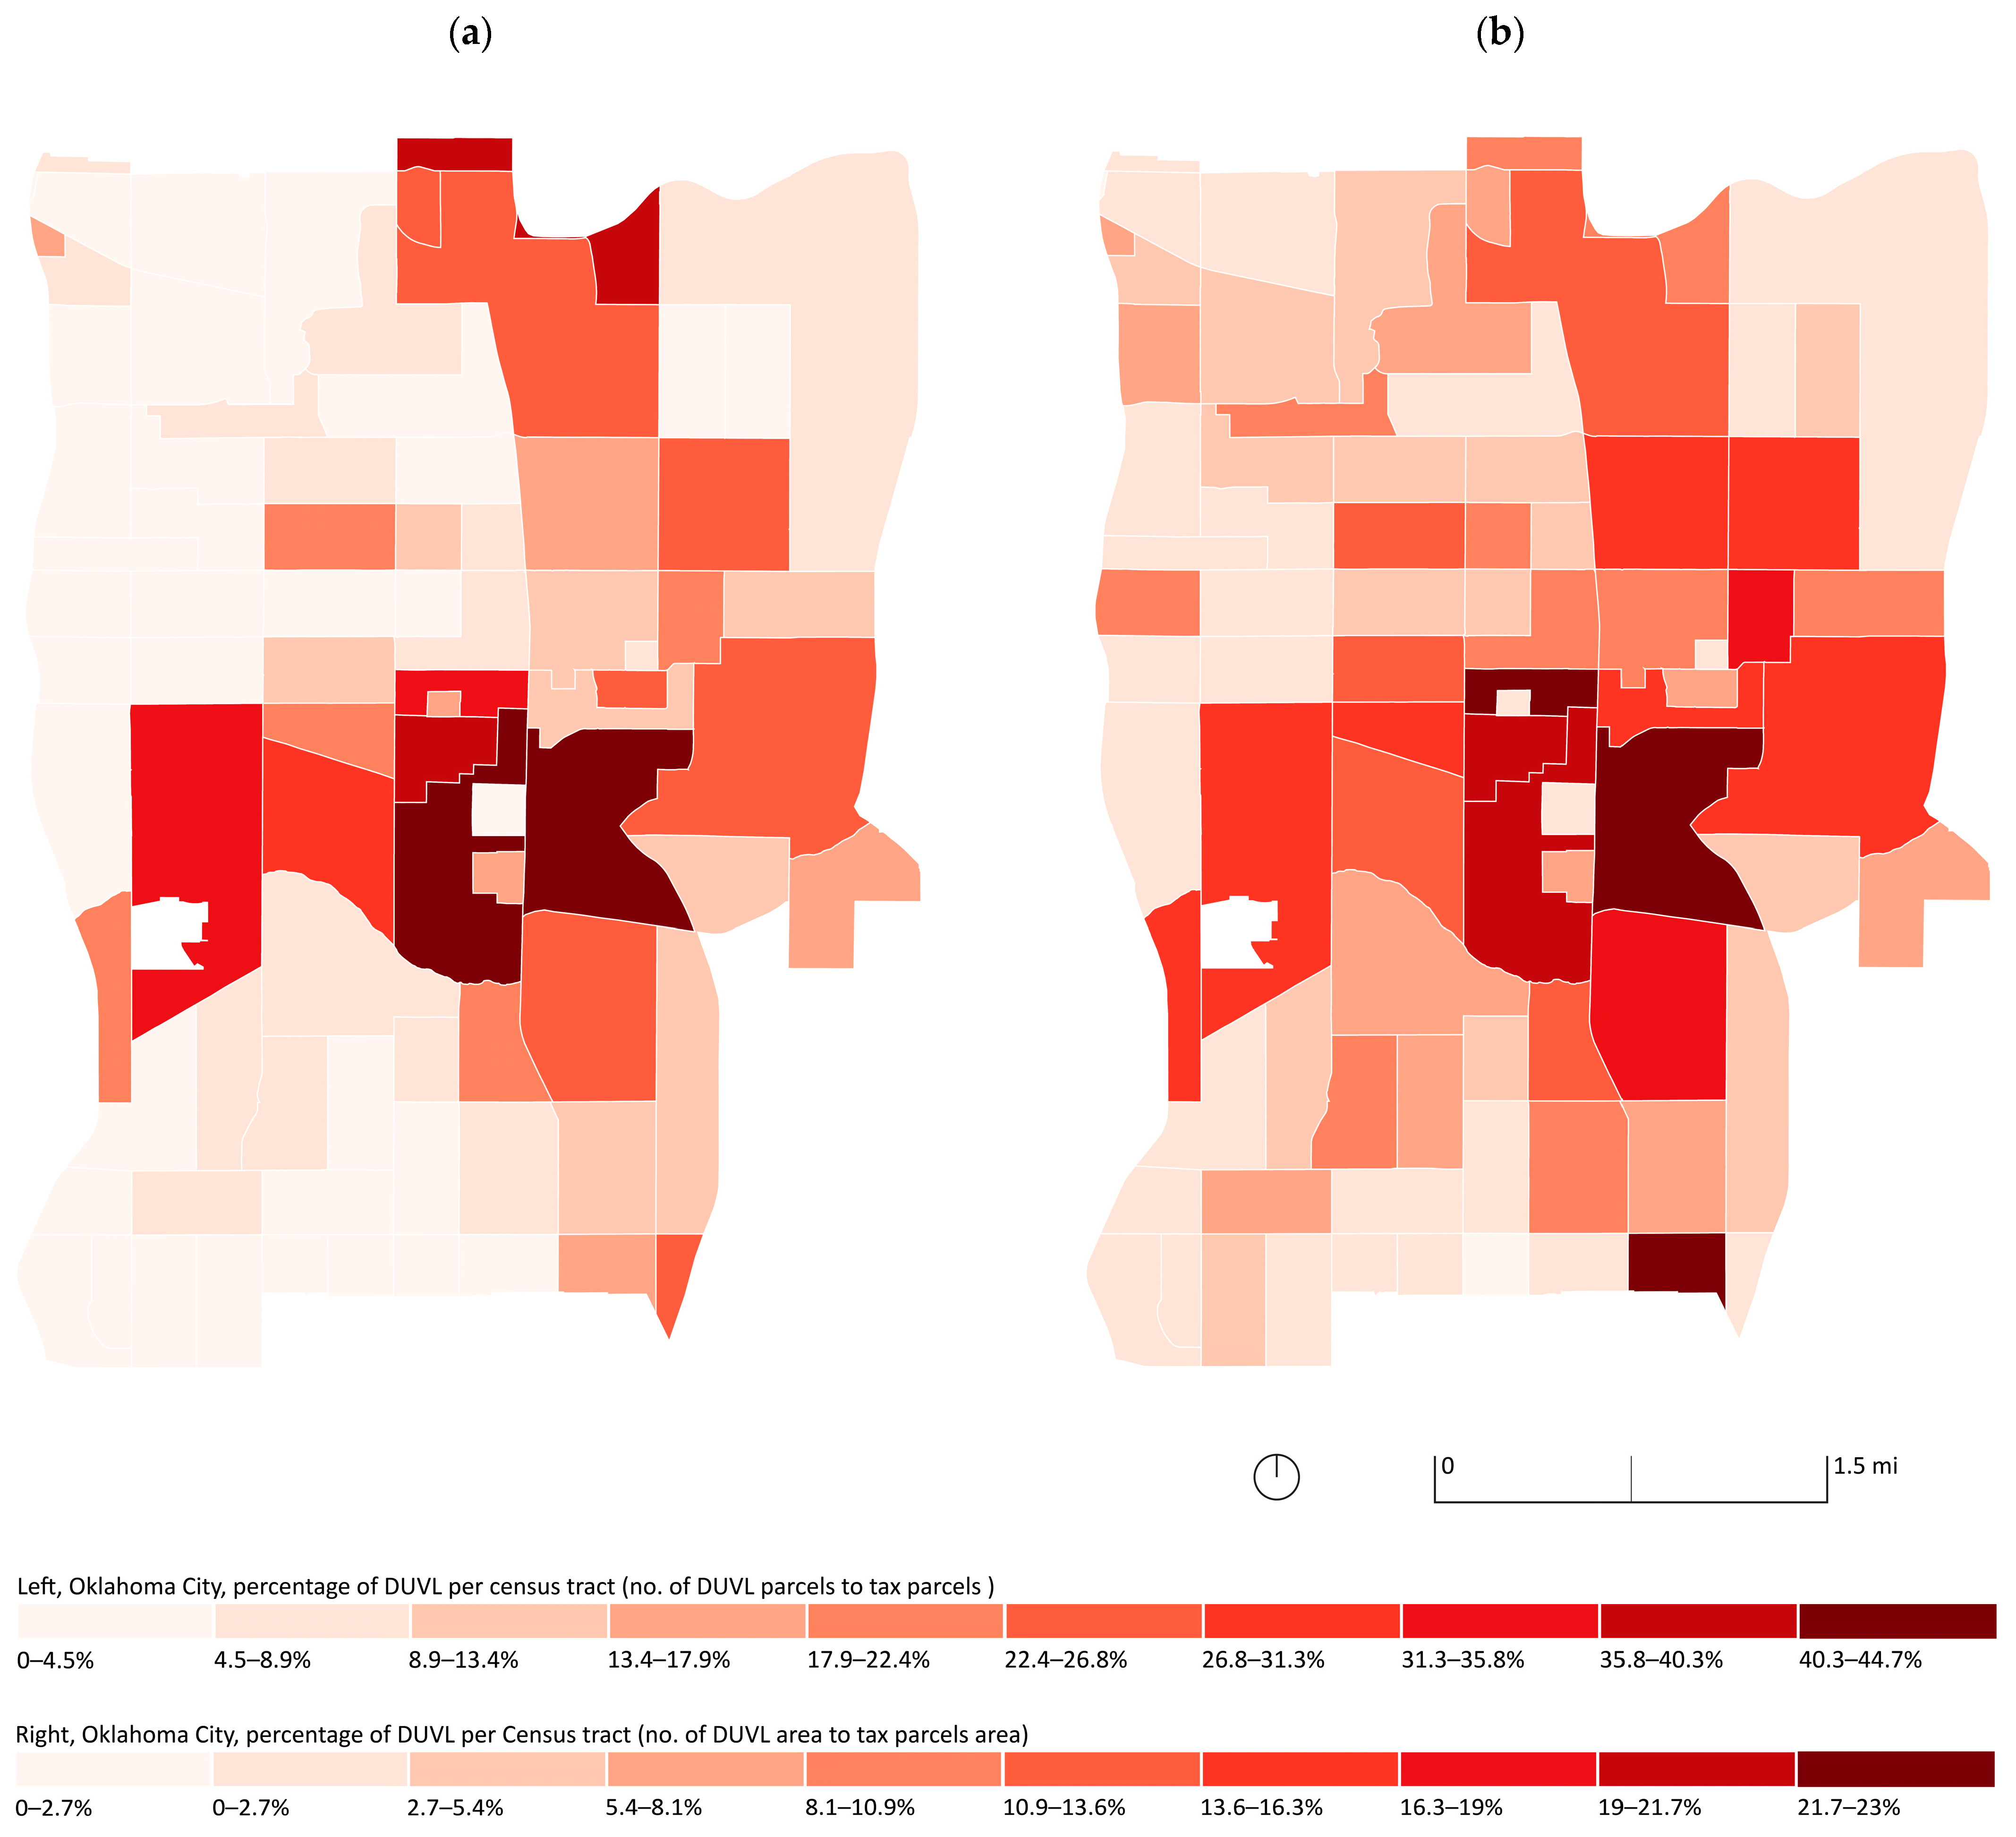
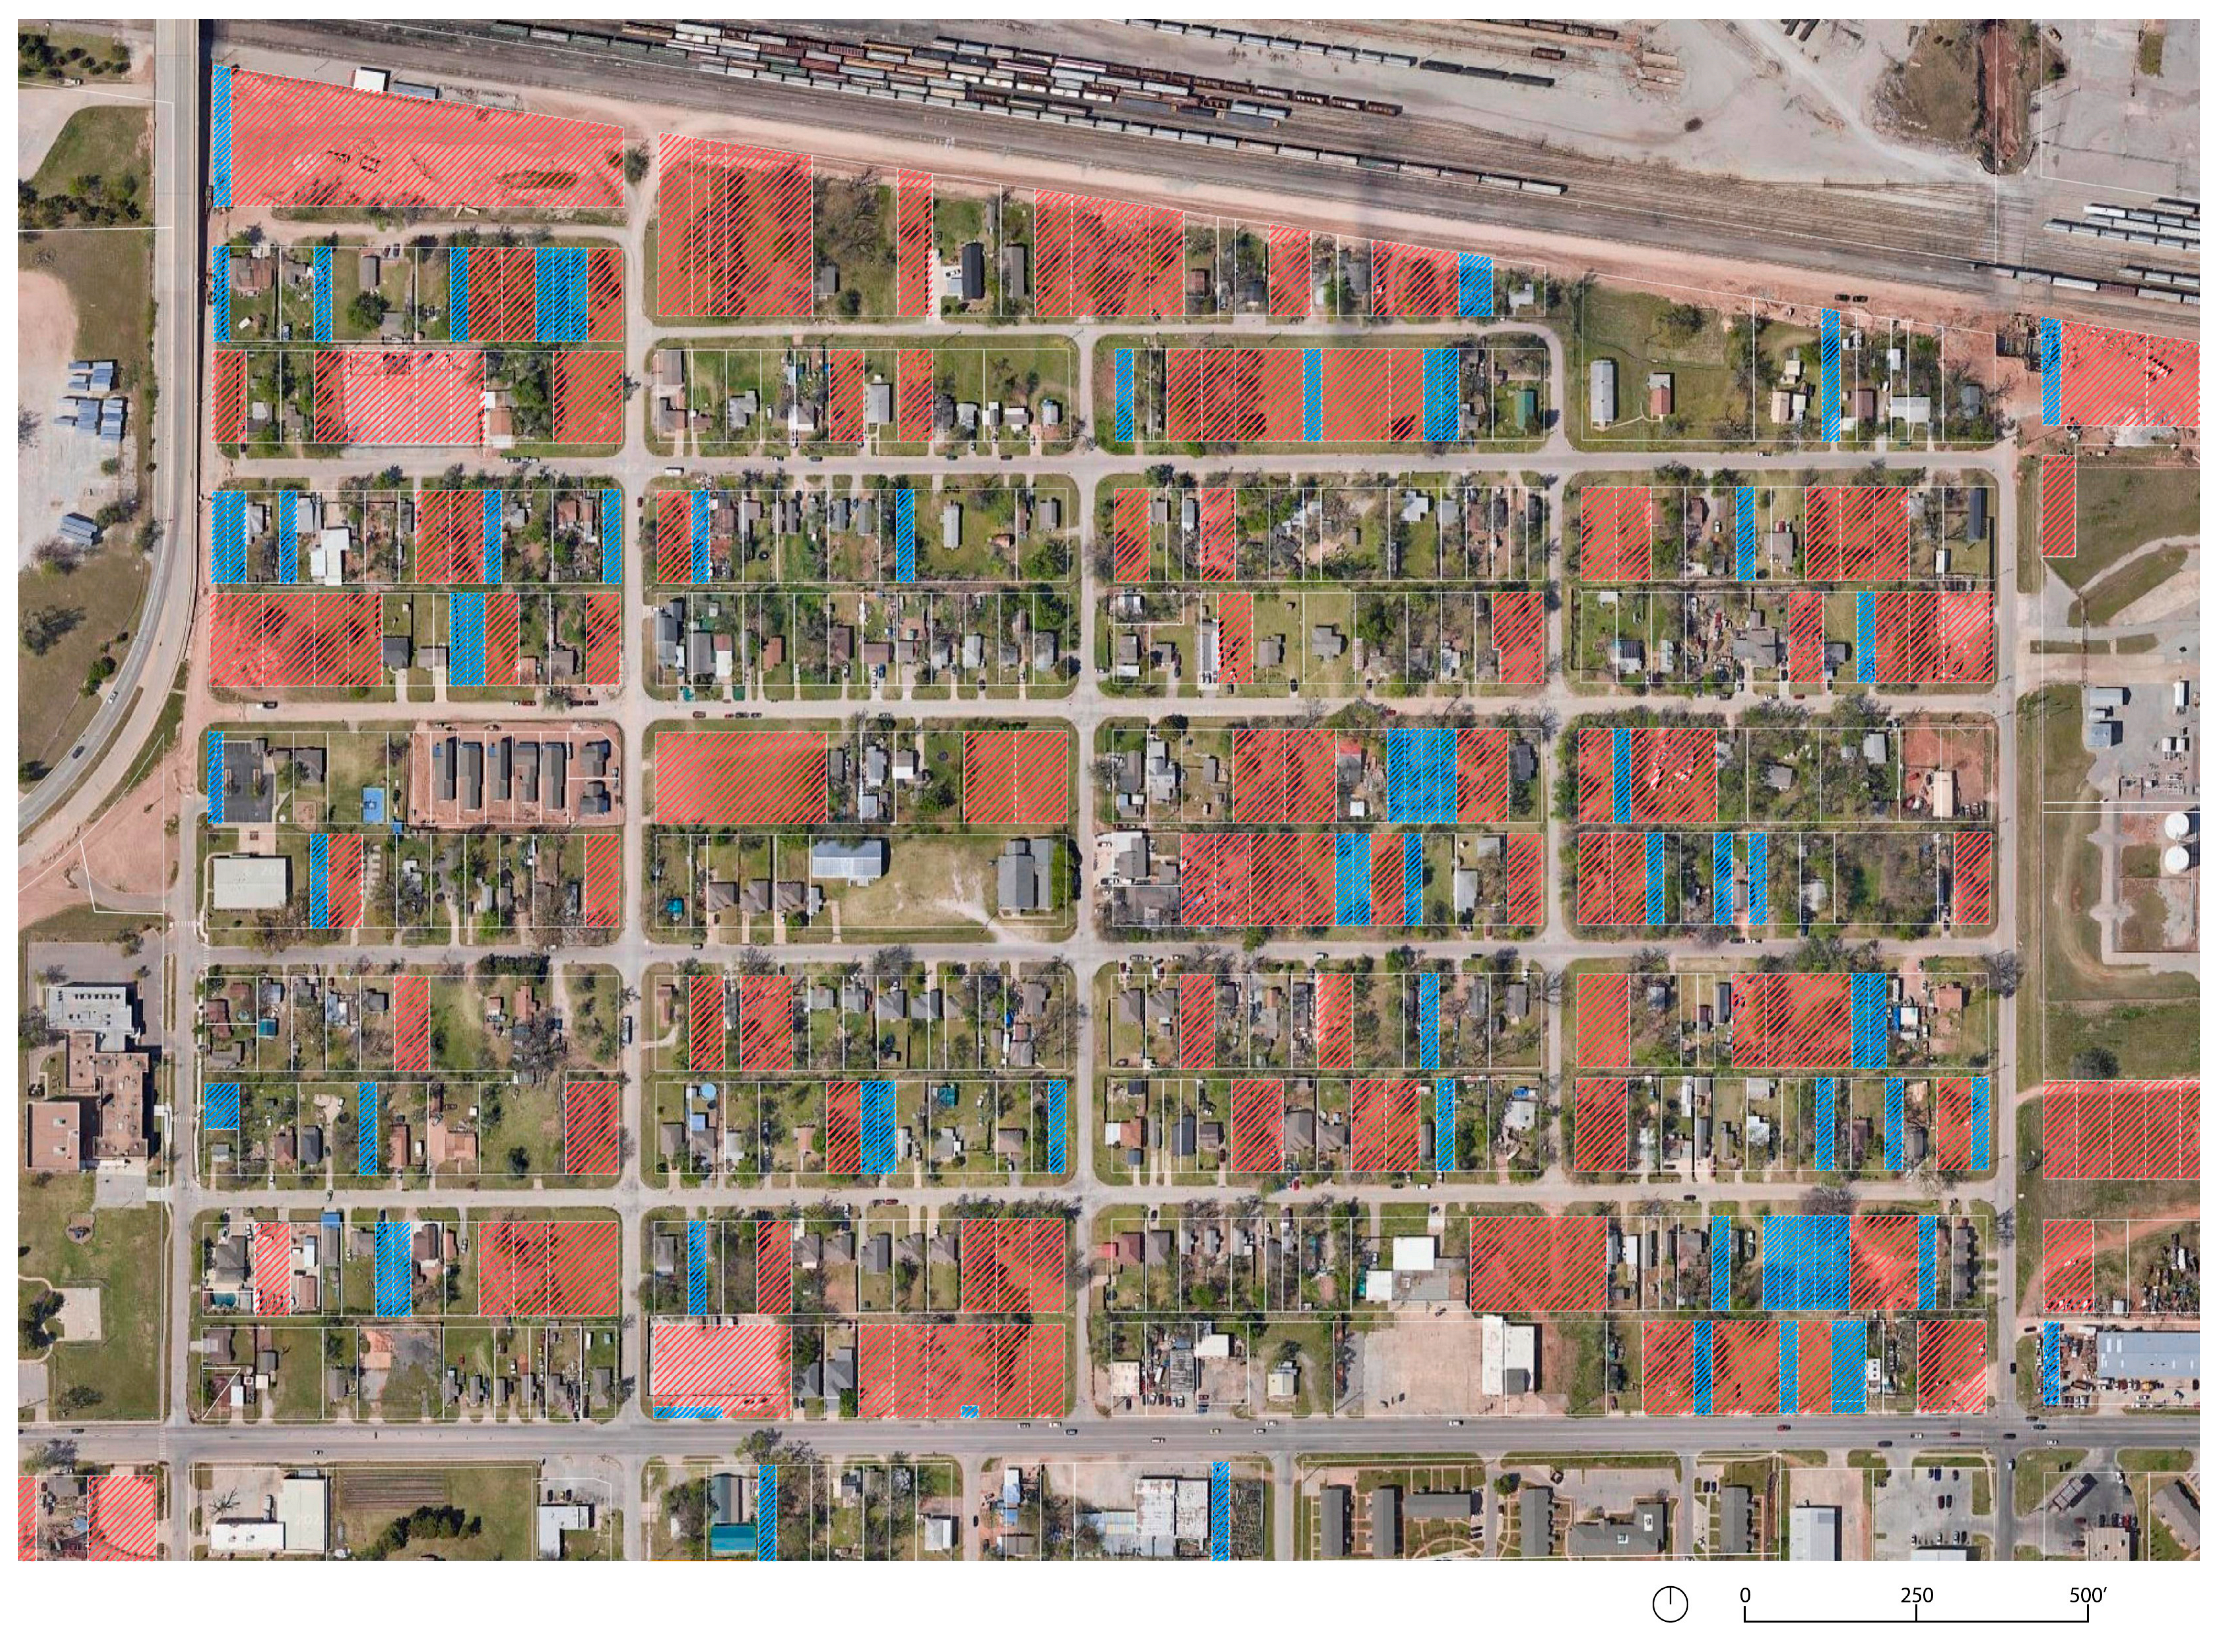
4.1. Spatial Distribution of DUVL

Once we completed the DUVL dataset, we started a statistical analysis. We first focused on analyzing the location of DUVL in the urban core by calculating the distribution of DUVL parcels per census tract (Table S3). Although vacant land is distributed across the urban core, we identified higher rates of vacant parcels in census tracts 1097 and 1099, located in the center-east part of downtown (>40% DUVL parcels). Most of the census tracts with more than 1/4 of DUVL parcels are concentrated in downtown OKC and along the Oklahoma River (Figure 8a). Lower rates of DUVL parcels are in the west quadrant of the urban core, especially on the northwest side of OKC. In addition, we developed a map with percentages of DUVL area for each tract. This map depicts three major census tracts, with more than 22% of DUVL area to total tax parcels area: census tracts 1025, and 1907, located downtown, and 1054, located on the south border of the urban core, along the former Southern Kansas Railway, now BNSF Railway (Figure 8b).

4.2. Ownership Characteristics

According to the literature, ownership characteristics play a role in urban land vacancy, as vacancy may be related to ownership type and owner’s history [19,40]. Due to data constraints, we focused on two main ownership types: private and public.
There are 5577 (79.50%) privately owned DUVL parcels in OKC’s urban core, while 1438 are publicly owned (20.50%). Among the public institutions, the greatest landowner is OCURA (41.05 ha, 28.20% of public DUVL area), followed by the City of Oklahoma City (36.93 ha, 25.37% of public DUVL area), and the State of Oklahoma (17.45 ha, 11.99%). Ownership data show that 43.20% of owners only hold one parcel. The top 10 private owners own 7.72% of the private DUVL parcels (10.90% of all private DUVL areas). By analyzing the County Assessor database, 79.32% of the DUVL owners are residents in OKC, 18.30% have their residents outside of OKC, and 2.38% are reported as “unknown”.

4.3. Property Type and Zoning Analysis

To support planning and decision-making processes addressing DUVL in private and public sectors, we created a framework for reviewing the property characteristics of vacant parcels, including land uses and property types, urban, environmental, and geometrical features. First, data on property types are fundamental to assessing the level of developability of UVL. As discussed in the literature, large commercial vacant parcels have greater development opportunities than small residential vacant properties. Conversely, large parcels zoned for industrial land uses are common sites for abandonment because most residents prefer industrial uses to be located outside of the urban core [19].
Property type was identified by relying on the Oklahoma County Assessor GDB table attributes. Approximately 46.27% of DUVL is fiscally classified as residential, 25.90% is tax-exempt, 19.74% is commercial, and 6.46% is industrial (Table S4).
The zoning classification was obtained by relying on data available on the OKC Data Portal and using selection and intersection tools on QGIS. As shown by Table S5a, 33.61% of all the DUVL parcels are zoned as R-1 (single-family residential district), 13.90% as R-2 (medium-low density residential districts), and 9.72% as I-2 (moderate industrial district), with the remaining 42.77% distributed in the other 22 zoning districts. We reviewed the percentage of vacant lots per zoning district in relation to the overall number of tax parcels per district. Higher vacancy percentages were located in downtown zoning districts, with 48.37% of the parcels in DTD-2, 35.43% in DTD-1, and 33.03% in DBD reported as DUVL.
To discuss the impact of zoning standards on vacancy, one can focus on R-1 districts, which implement the most restrictive rules for development. In R-1 zones, developments are limited for parcels less than 557.41 m2 and less than 15.24 m wide. Currently, in urban core R-1 zones, there are 552 parcels less than 557.41 m2 (24.03% of DUVL in R-1 zones), with 402 DUVL parcels between 278.70 and 557.41 m2. Additionally, 332 parcels are less than 15.24 m wide (14.45%). (Table S5b). By aggregating these data, in R-1 zones, there are 558 non-conforming vacant parcels (24.29% of DUVL parcels in R-1 zones) that cannot be developed according to R-1 minimum standards, and therefore need a variance or a rezoning to another suitable district in order to be developed.

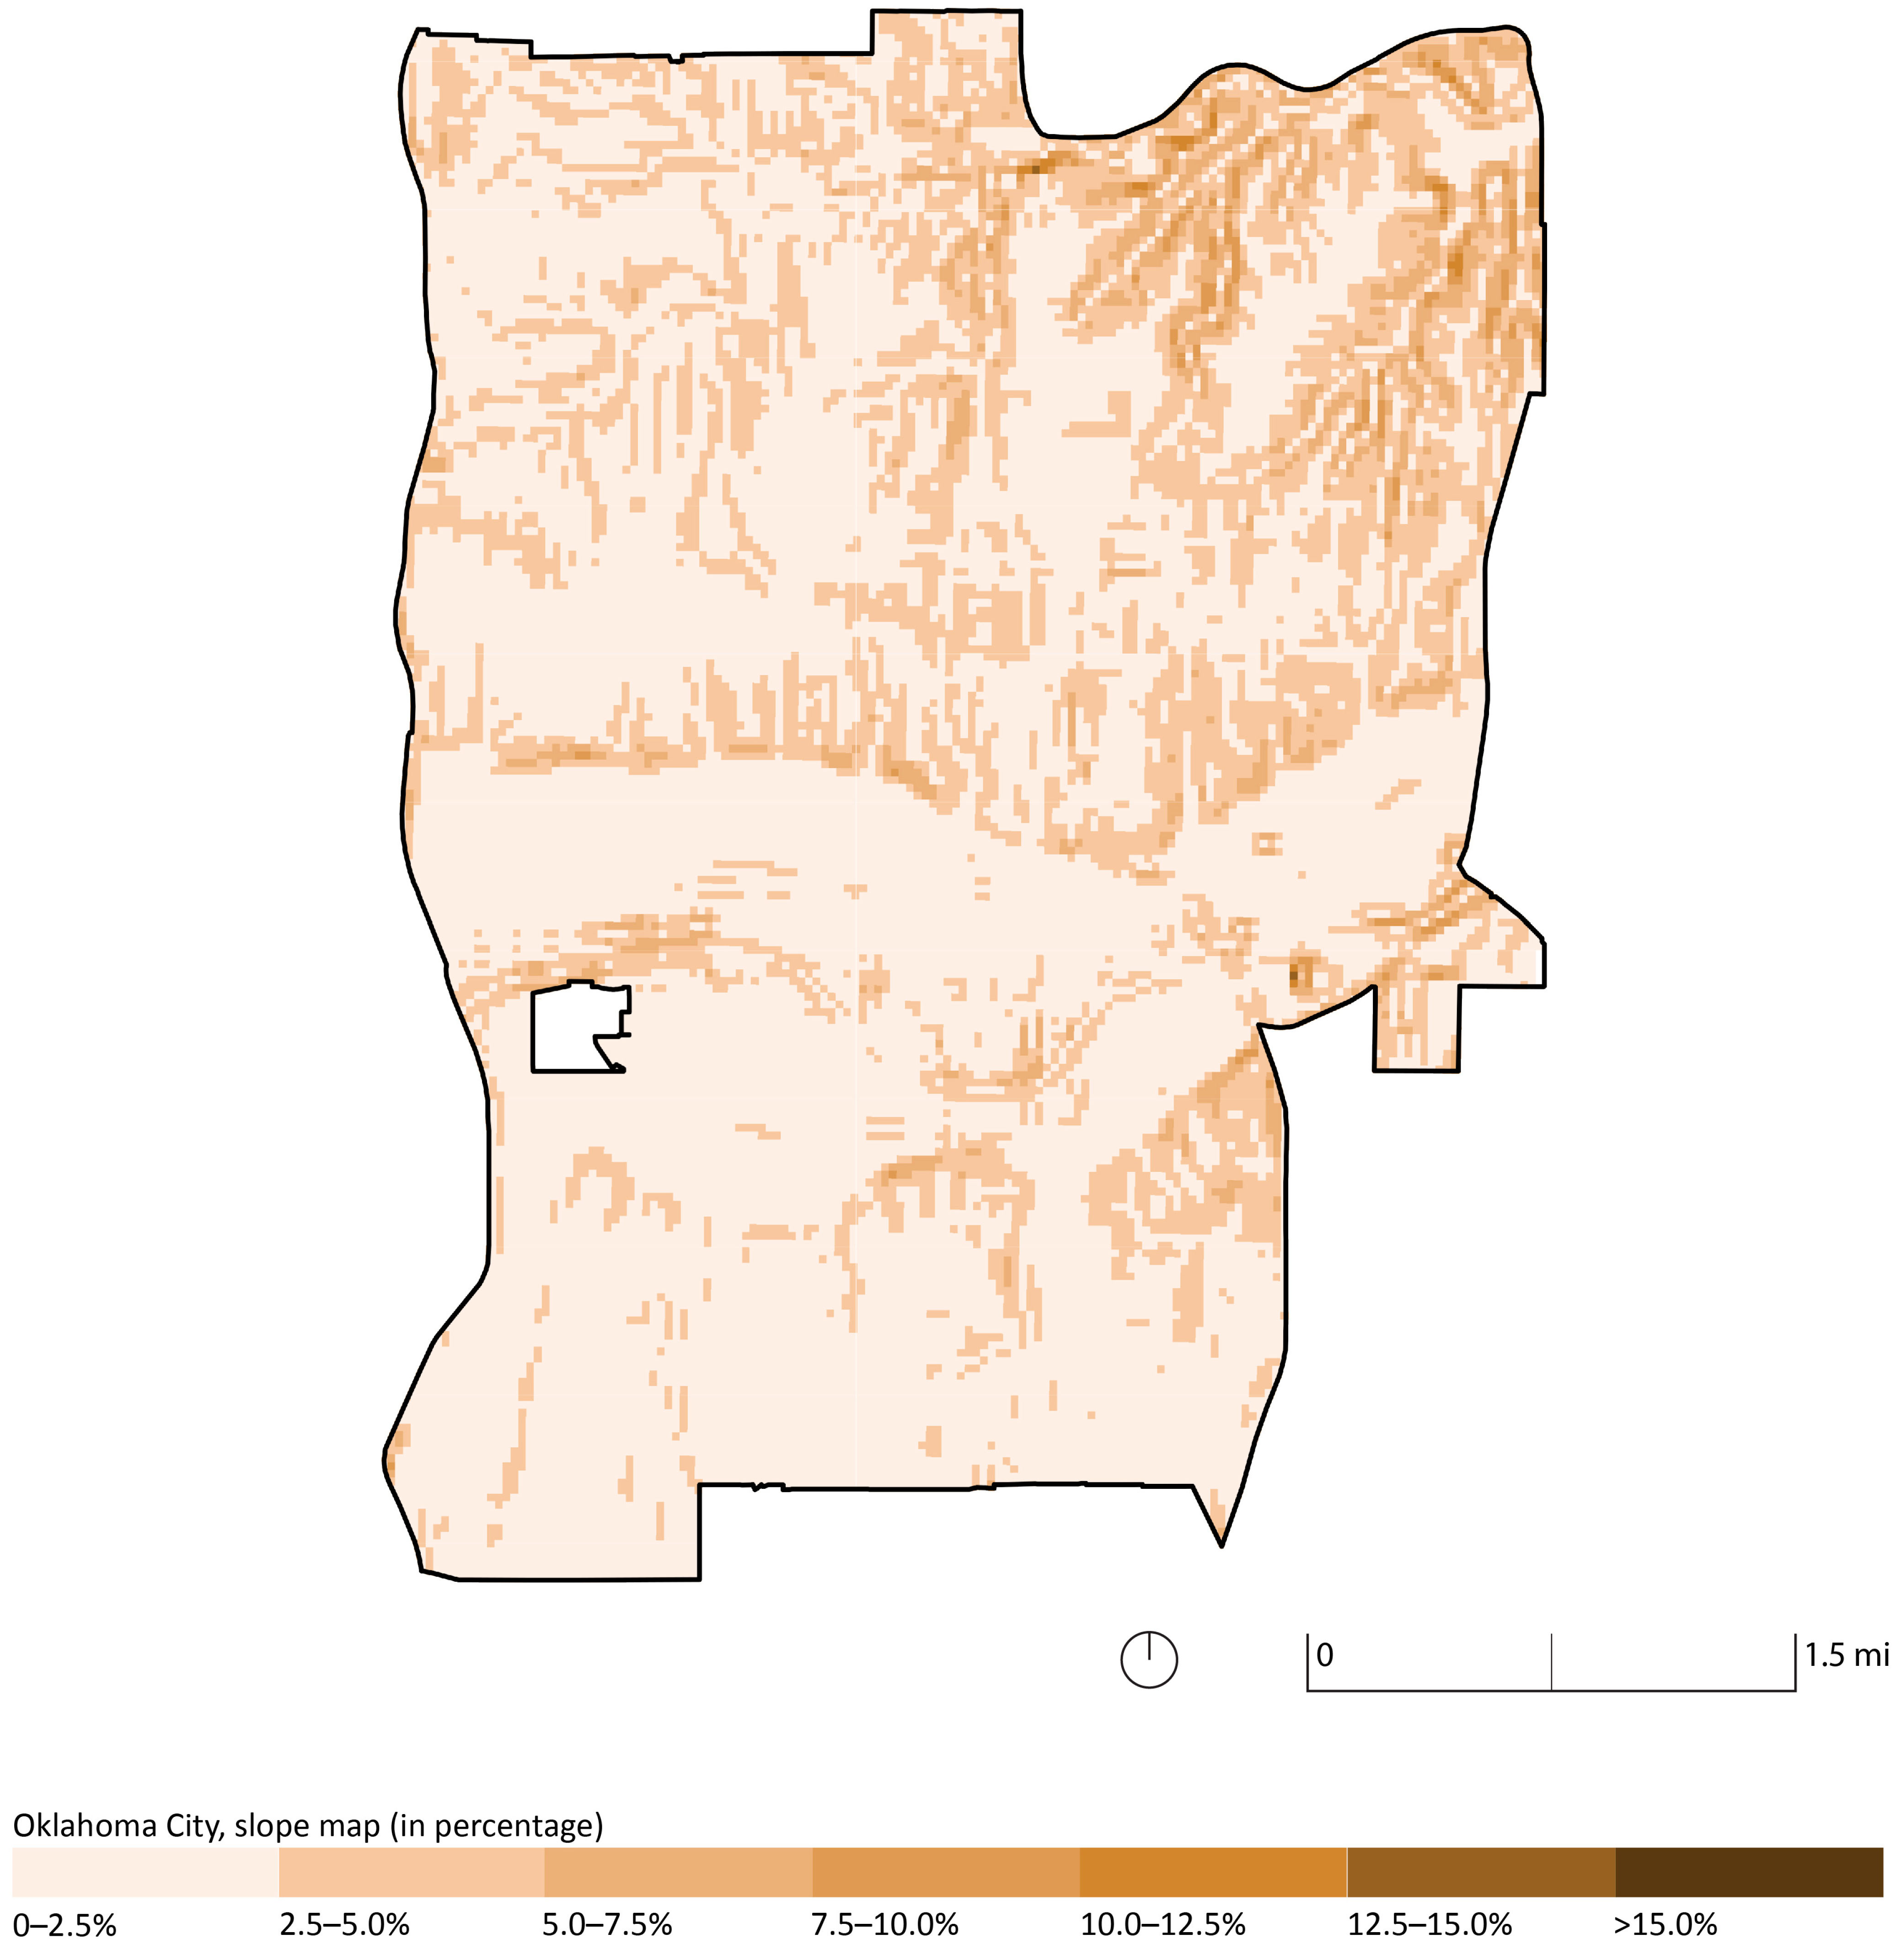
4.4. Urban, Environmental, and Topographic Analysis

The urban analysis classifies DUVL features in relationship to urban elements, such as blocks and street networks. For this part of the analysis, we worked primarily with QGIS tools Buffer and Intersection, using the street network center line shapefile. Due to the regularity of OKC’s street network, we identified the number of vacant parcels facing public streets, and vacant parcels with no access to public streets, using intersection tools and buffer zones of 25 m for the street center lines. The number of DUVL parcels facing streets is 6909 (98.49%), while the number of DUVL with no access to streets is 106 (1.51%). Similarly, we identified vacant corner parcels (3721, 53.04%), by calculating intersection points from the street network layer and applying a buffer of 20 m. We also calculated the number of DUVLs which are located at a T-junction (101, 1.43%).
We obtained data on street types serving DUVL through the City Open Data Portal centerline layer. The portal provides detailed street typologies information. A 45 m buffer was created out of the street centerlines layer, intersecting with the DUVL layer. By filtering the attribute table outcome list, we derived the percentages of DUVL based on street typologies, as shown in Table S6.
To identify a correlation between DUVL and urban elements, we considered DUVL in relationship to the geographic center of the city, railroads, highways, riparian areas, and brownfields. Table S7 shows the distribution of DUVL in the buffers, expressed in percentages, and the number of DUVL parcels per acre. The spatial analysis results show a significant concentration of DUVL in the area within ½-mile and 1 mile from the city center (approximately 44% of tax parcels are DUVL). In addition, the spatial analysis showed higher DUVL occurrence in areas close to railroads, for example, 29.17% of DUVL is located less than ¼-mile from rail lines, and 49.03% within a distance of ½-mile. Proximity to remediated sites or current brownfields is another factor influencing the presence of DUVL. There is approximately a 37% chance that tax parcels within a ½-mile distance from brownfields are DUVL parcels. Many of the former and current brownfields in the urban core are located adjacent to railroads, within a 1-mile distance from the city center.
Finally, we developed a topographic analysis to check for a potential correlation between slope and vacancy in the urban core. For this task, we used the DEM image previously created to obtain slope percentages for DUVL (Figure 9). Regarding topographic features, DUVL is distributed within the elevation interval of 317 m (northeast OKC urban core) and 394.4 m (southwest OKC urban core), with 93.56% of DUVL with a slope less than 5% (Table S8).

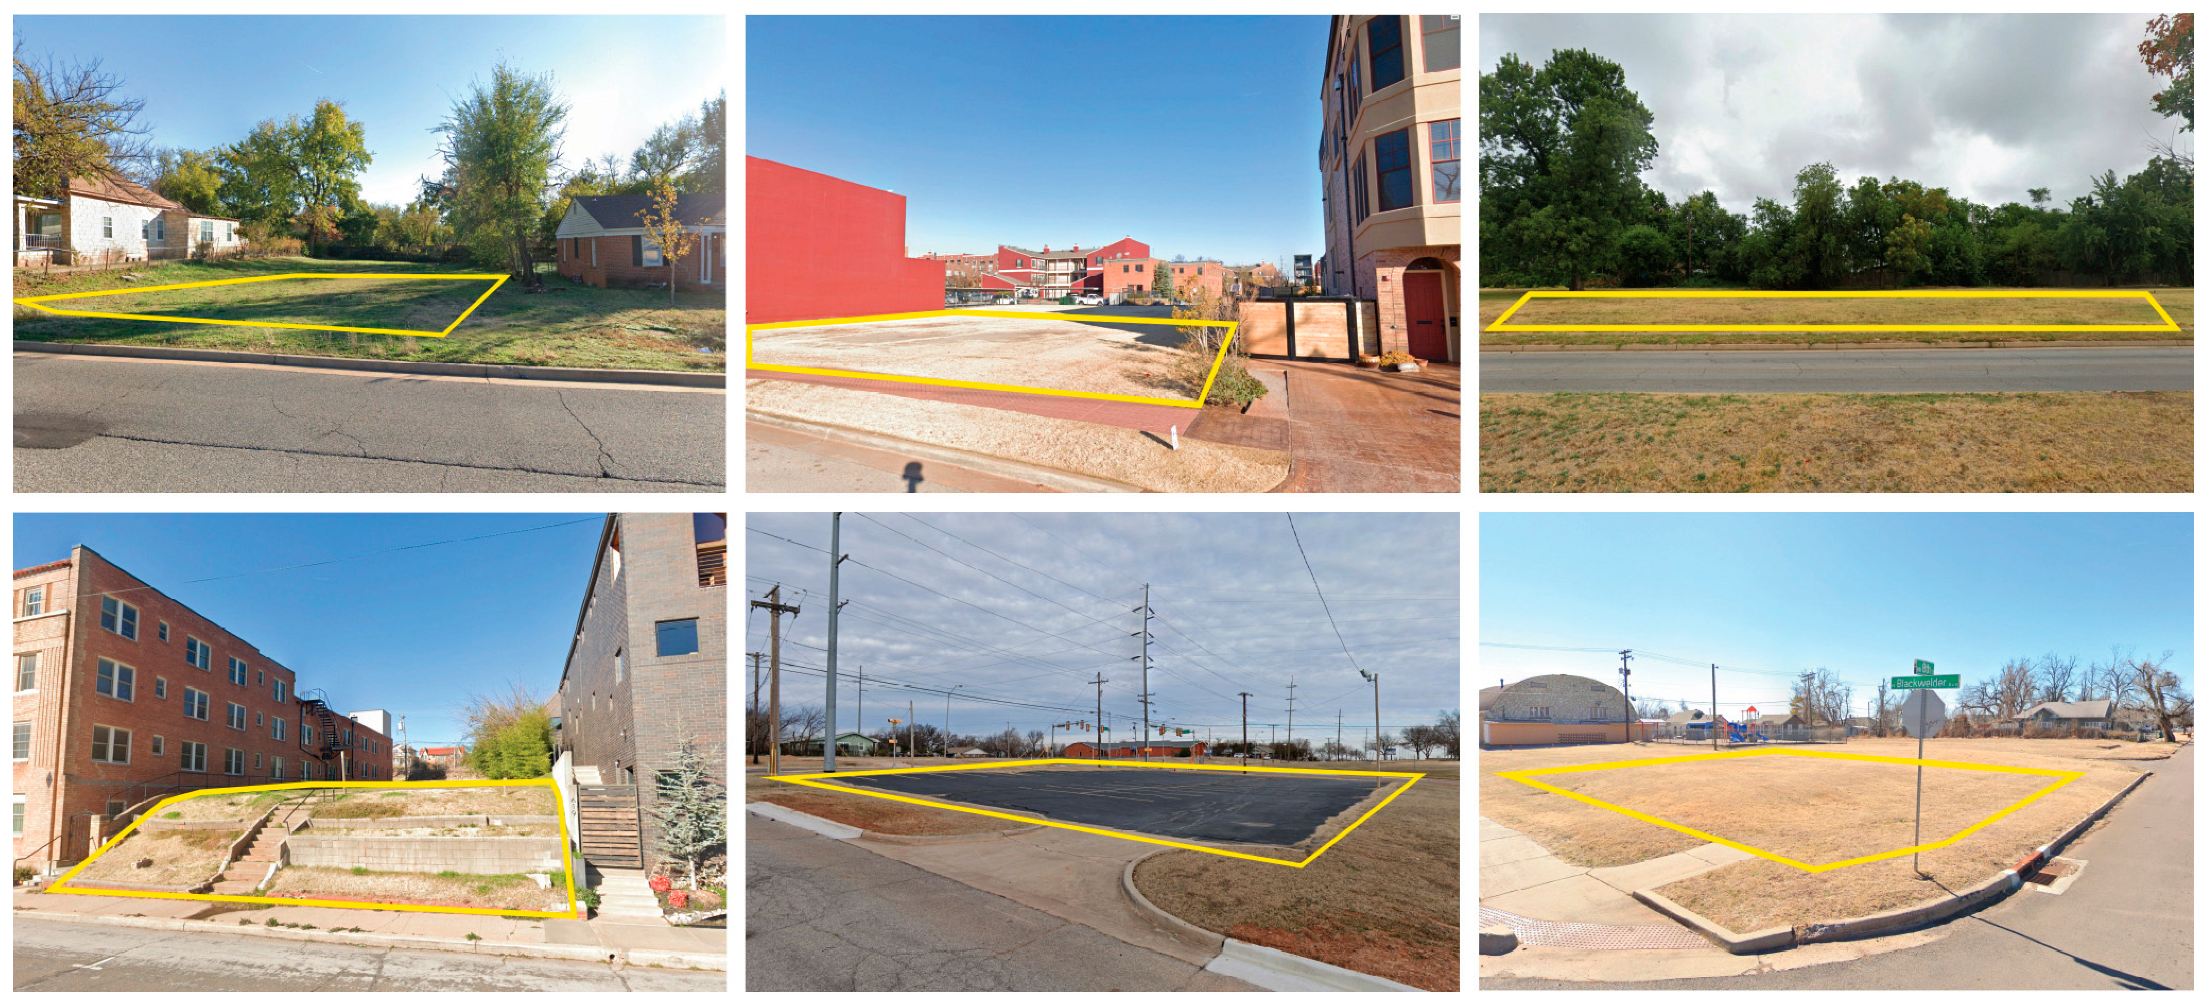
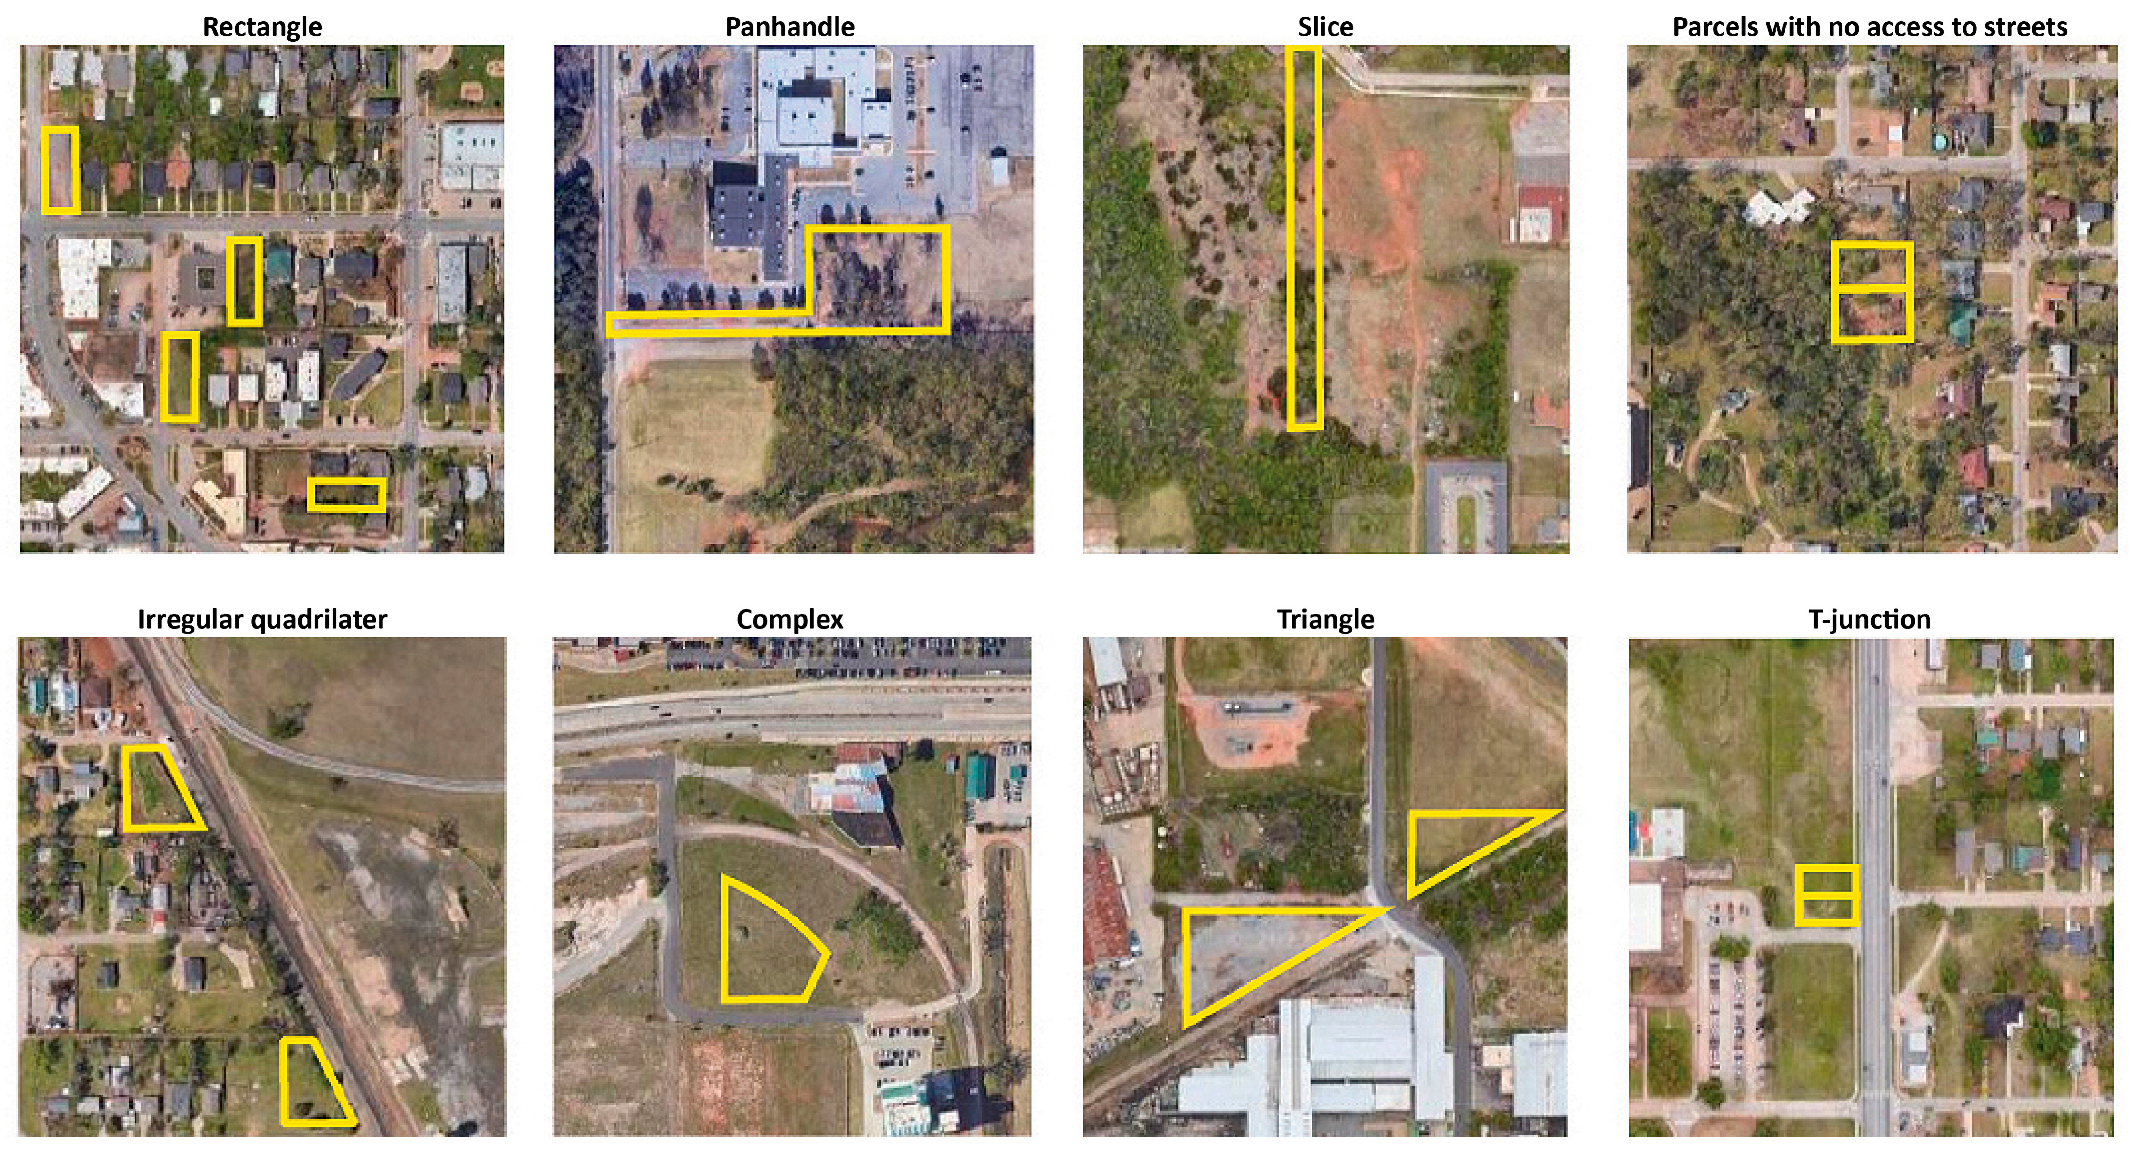
4.5. Geometrical Analysis

For the geometrical analysis, we classified vacant land according to shape and area. Starting with shape, we consulted existing urban vacancy studies [20] to identify the recurring geometries as follows (Figure 10). We focused our attention on the following shapes:
  • Triangular parcels, or lots with three sides.
  • Rectangular parcels, or four-sided parcels with angles included between 88 and 92 degrees.
  • Irregular quadrilateral parcels.
  • Slices, or rectangular parcels with a width/length ratio higher than 1:7.
  • Panhandles, or narrow quadrilateral parcels projecting from a quadrilateral shape.
  • Complex parcels, or parcels with five or more sides, not included in the categories above.
Results from the geometrical analysis are reported in Table S9. Due to the gridiron block structure of most of OKC’s urban core neighborhoods, most DUVL parcels facing streets were classified as rectangular (5648, 80.51% of tot DUVL). The distribution of vacant rectangular lots mirrors the general distribution of vacant parcels in the urban core, with more concentration in downtown areas, northeast OKC, and neighborhoods along the Oklahoma River. Interestingly, we noticed that specific lot shapes occur more often in proximity to specific infrastructure. For example, vacant triangular and irregular quadrilateral lots occur more frequently along railroads. For the area analysis, we subdivided UVL according to ranges of area, expressed in acres. In addition, a comparison between DUVL and tax parcels in the urban core was conducted to identify the different data distributions in the curves. As shown in Table S10, more than half of DUVL parcels have an area comprised between 505.85 m2 (1/8 ac) and 1011.71 m2 (1/4 ac), while a quarter of DUVL is less than 505.85 m2. By overlapping our spatial analysis with area data, we discovered that larger vacant lots (>8093.71 m2, or >2 ac.) are more likely to occur on the fringes of the urban core. Finally, by using a Python script for Rhinoceros 3D, we identified the median proportions of DUVL. The median values of width and length for a rectangular DUVL are 15.20 and 42.70 m (approximately 50 × 140’), with a proportion of 1:2.8.

5. Discussion

Although the presence of vacant land can be found for the urban core census tracts, the percentage substantially changes from the east and south quadrants of the case study to the north and west. The lowest percentages of DUVL are concentrated on the northwest side of the urban core. High percentages of DUVL (more than 13.4% of total tax parcels, and 10.9% of tax parcel area) are in downtown census tracts and along the vectors represented by the Oklahoma River, the BNSF Railway, and Interstate I-235. Peak percentages of DUVL are concentrated at the geometric intersection of these vectors, corresponding to the southeast part of downtown OKC. This area includes most of the brownfields in the urban core. Historical research has shown that this city area was heavily impacted by urban renewal projects, and still hosts high percentages of minority communities. In general, the proximity to the Oklahoma River and the north–south BNSF railroad aligns with the formation of vacant lots, as these areas were historically subjected to floods and environmental pollution. In our study, we did not identify a strong correlation between demographics, income levels, and vacancy rates. However, low vacancy rates are reported in the city’s northwest quadrant, where the mostly white population lives.
The geometric analysis demonstrates that the problem of land vacancy in the urban core mainly affects small to middle-sized rectangular parcels facing local streets. Indeed, the occurrence probability of DUVL for tax parcels below 1/8 ac size is 31.50% (1768 out of 5613), approximately four times higher than the occurrence probability of DUVL for tax parcels with a size between 1/8 ac and 1/4 ac (3734 out of 48,740, 7.66%). This site-specific study confirms typical urban vacancy characteristics related to parcel size reported in the literature [15].
Zoning standards can be viewed as another contributing factor to urban vacancy [20]. A noteworthy portion of DUVL parcels in residential zones, such as R-1, does not conform to minimum development standards required by the city’s Zoning Ordinance (Figure 11). Variances or rezones necessary to bring the property into conformity are more time-consuming and uncertain in results than standard permitting processes, as they are subject to additional reviews, planning commission meetings, and recommendations. Consequently, restrictive minimum lot requirements can delay the development of vacant land.

6. Assessment

To estimate the potential contribution of residential development on OKC’s DUVL, we calculated new housing construction according to three different land-use scenarios, differentiated for varying development standards, from the most restrictive to the least restrictive (Table S11a,b, Figure 12).
Our methodology for calculating the housing capacity of DUVL in OKC considered the main criteria for the creation of buildable land inventories in U.S. cities’ urban growth boundaries [39,41]. However, for the scope of this study, the three-tiered scenario follows shared assumptions and simplifications. First, we consider all the tax classes for calculating the housing supply. Only vacant tax parcels in base and special purpose districts were considered for calculations, therefore we excluded vacant land in the State Capitol and the University of Oklahoma/Medical Center areas. Tax parcels that are not capable of supporting future housing because of size restrictions are removed from the calculations. As a result, for a more realistic estimation, parcels smaller than 93 m2 (1000 sq ft) are excluded. Although they are limited in number and size, parcels with no street access that fit the criteria are considered in the calculations. Finally, our estimation deducts the necessary land for setbacks and easements for potential new streets and infrastructure [39].
The adopted formula to calculate the housing capacity of a vacant parcel computes the maximum number of dwelling units permitted by the zoning district in each scenario, rounded down. For example: a 2.5 ac developable parcel in a zoning district which allows a density of 2 du/acre, has a housing capacity of (2.5/2) = 1.25, rounded down to 1 du.
The first scenario calculates the housing capacity of DUVL parcels only in zoning districts that allow residential development, following current development standards. Large parcels more than 0.80 ha (2 ac, close to the size of a historic block in downtown OKC) are excluded from calculations. This criterion excludes excessive parcel size for typical market activity, which may additionally require more design work and a long-term plan for the implementation of green infrastructure and climate resilience strategies. Therefore, in the first scenario, large underutilized vacant lots, such as block-scale surface parking lots, are not considered. Additionally, this scenario does not hypothesize land assembly strategies, accepting that some parcels may be underutilized or undeveloped in the first hypothesis. In the case of no residential density restrictions established by the zoning ordinance, the minimum density value prescribed by the comprehensive 2015 City Plan was calculated [34].
The second scenario still calculates the housing potential only for zoning districts permitting residential uses. However, it applies less restrictive standards for residential zones, as recommended by most recent OKC zoning studies [31]. For R-1 and R-2 zones, it allows the development of lots larger than 278.70 m2 (3000 sq ft) with an urban single-family type, such as a townhome, with a density of 37 dwelling units per hectare (du/ha) and no height restrictions [23,42].
For R-3 parcels, urban low-rise developments, including stacked triplexes, for lots no less than 371.61 m2 (4000 sq ft), and a density of 49.5 du/ha, were hypothesized. For R-4 parcels, the standard development was set as urban low-rise multifamily types, including fourplexes, for lots no less than 557.41 m2 (6000 sq ft) and a density of 61.75 du/ha. For the remaining zoning districts allowing residential developments, the median density value prescribed by PlanOKC was applied. In this scenario, large parcels (more than 0.80 ha, or 2 ac) are also included in the calculations.
The third scenario considers all DUVL parcels and applies the highest density standards for each zoning district currently suggested by the OKC Development Code Update [43]. In this scenario, the residential potential of DUVL in zoning districts that limit residential uses, such as commercial (C-1; C-3; etc.), and industrial (I-1; I-2; etc.), is calculated. In addition, this scenario hypothesizes inventive land assembly or subdivision strategies to maximize the development potential of DUVL.
Table S12a–c summarizes the number of housing units and population in different scenarios for OKC’s urban core. To calculate the number of prospective residents, a median household size of 2.58 people was considered, corresponding to the median number of persons per household in OKC in 2020 [44]. Under current zoning requirements (scenario 1, low land use), approximately 14,297 new housing units could be developed and 36,879 people housed, by utilizing roughly 413 ha of land. In an intermediate scenario with revised zoning standards for residential districts (scenario 2, intermediate land use), approximately 30,710 units could be developed and 79,225 people housed, by utilizing roughly 473 ha. Under new zoning rules that fully exploit density in OKC’s urban core (scenario 3, high land use), approximately 57,753 units could be developed and 148,989 people housed, utilizing roughly 686 ha of land. While all three scenarios can easily fulfill the current needs for new rental and ownership housing in OKC, the high land use scenario may potentially address the total need for housing in the city through new housing production. High density standards applied in the third scenario suggest high land values for the urban core, enough to support the redevelopment of other built-up, low-value parcels, through demolition and new construction. As a result, in this scenario the current DUVL inventory is less relevant. On the other hand, the third hypothesis provides indicative values for the full residential potential of DUVL in the urban core, testing the highest standards proposed by the OKC Development Code Update.

7. Limitations to the Methodology

While this project offered a comprehensive methodology for the problem of land vacancy, there are limitations to the analysis worth noting.
The first order of limitations is related to the geodatabase sources. As the Oklahoma County Assessor Database does not offer clear data on land vacancy, or tax data related to building or development values, a GDB of vacant land was built by merging and filtering databases belonging to different resources. In addition, because Regrid, Oklahoma County Assessor, and OKC Data Portal GDBs are not updated regularly at the same time, the classification and assessment of UVL introduced errors. As the urban core in OKC has both small- and large-scale developments, we had to crosscheck information through visual interpretation of data to detect and exclude 287 parcels that did not correspond to our definition of UVL. This approach was labor-intensive and time-consuming. In addition, we found an inhomogeneous level of updates during the check of vacant parcels through Google Maps Aerial Images and Street View. Although we found more recent developments shown in Street View rather than Google Aerial Images, we noticed that in some cases, Street Views were only updated to 2017, especially in east OKC neighborhoods.
A final limitation of the research is the lack of information available on the duration of the vacancy. Indeed, the ability to classify vacant land according to its vacancy duration provides additional details on the nature of vacancy in a specific context, as long durations of vacancy significantly impact vacancy clustering and neighborhood decline [19].

8. Conclusions

This study represents the first results for developing a methodology for the quantitative and qualitative understanding of DUVL in OKC’s urban core. Although the classification criteria and the housing assessment proposed in this study were applied to the OKC context, our methodology and results can be used to analyze UVL in cities with similar scales and histories.
The main conclusions of our research are as follows:
  • In the OKC urban core, the occurrence probability of DUVL for tax parcels below 1/8 ac size is 31.50%, approximately four times higher than the occurrence probability of DUVL for tax parcels with a size between 1/8 ac and 1/4 ac (7.66%). These data demonstrate a correlation between small parcels and higher chances of vacancy.
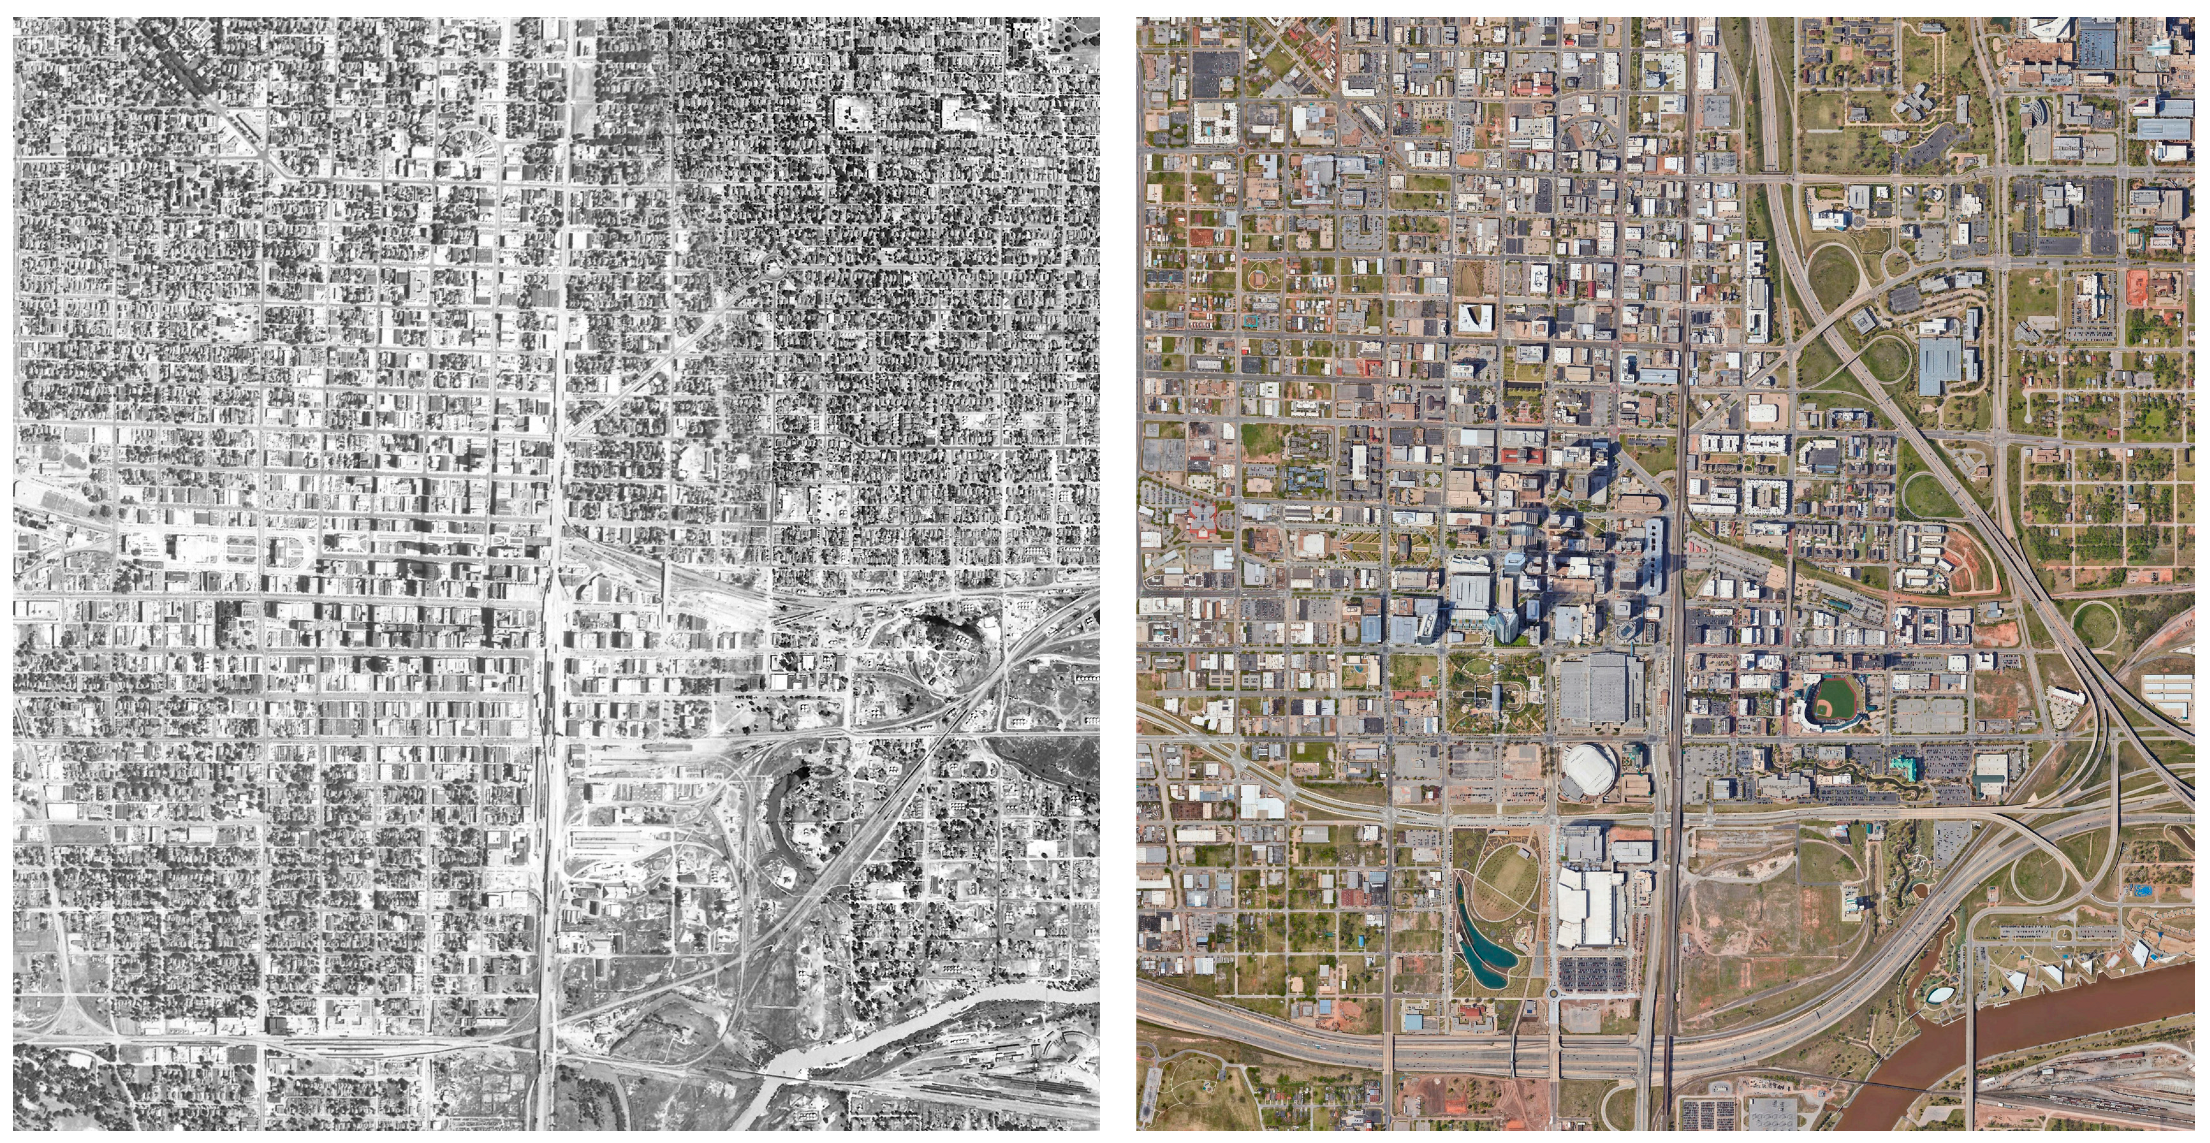
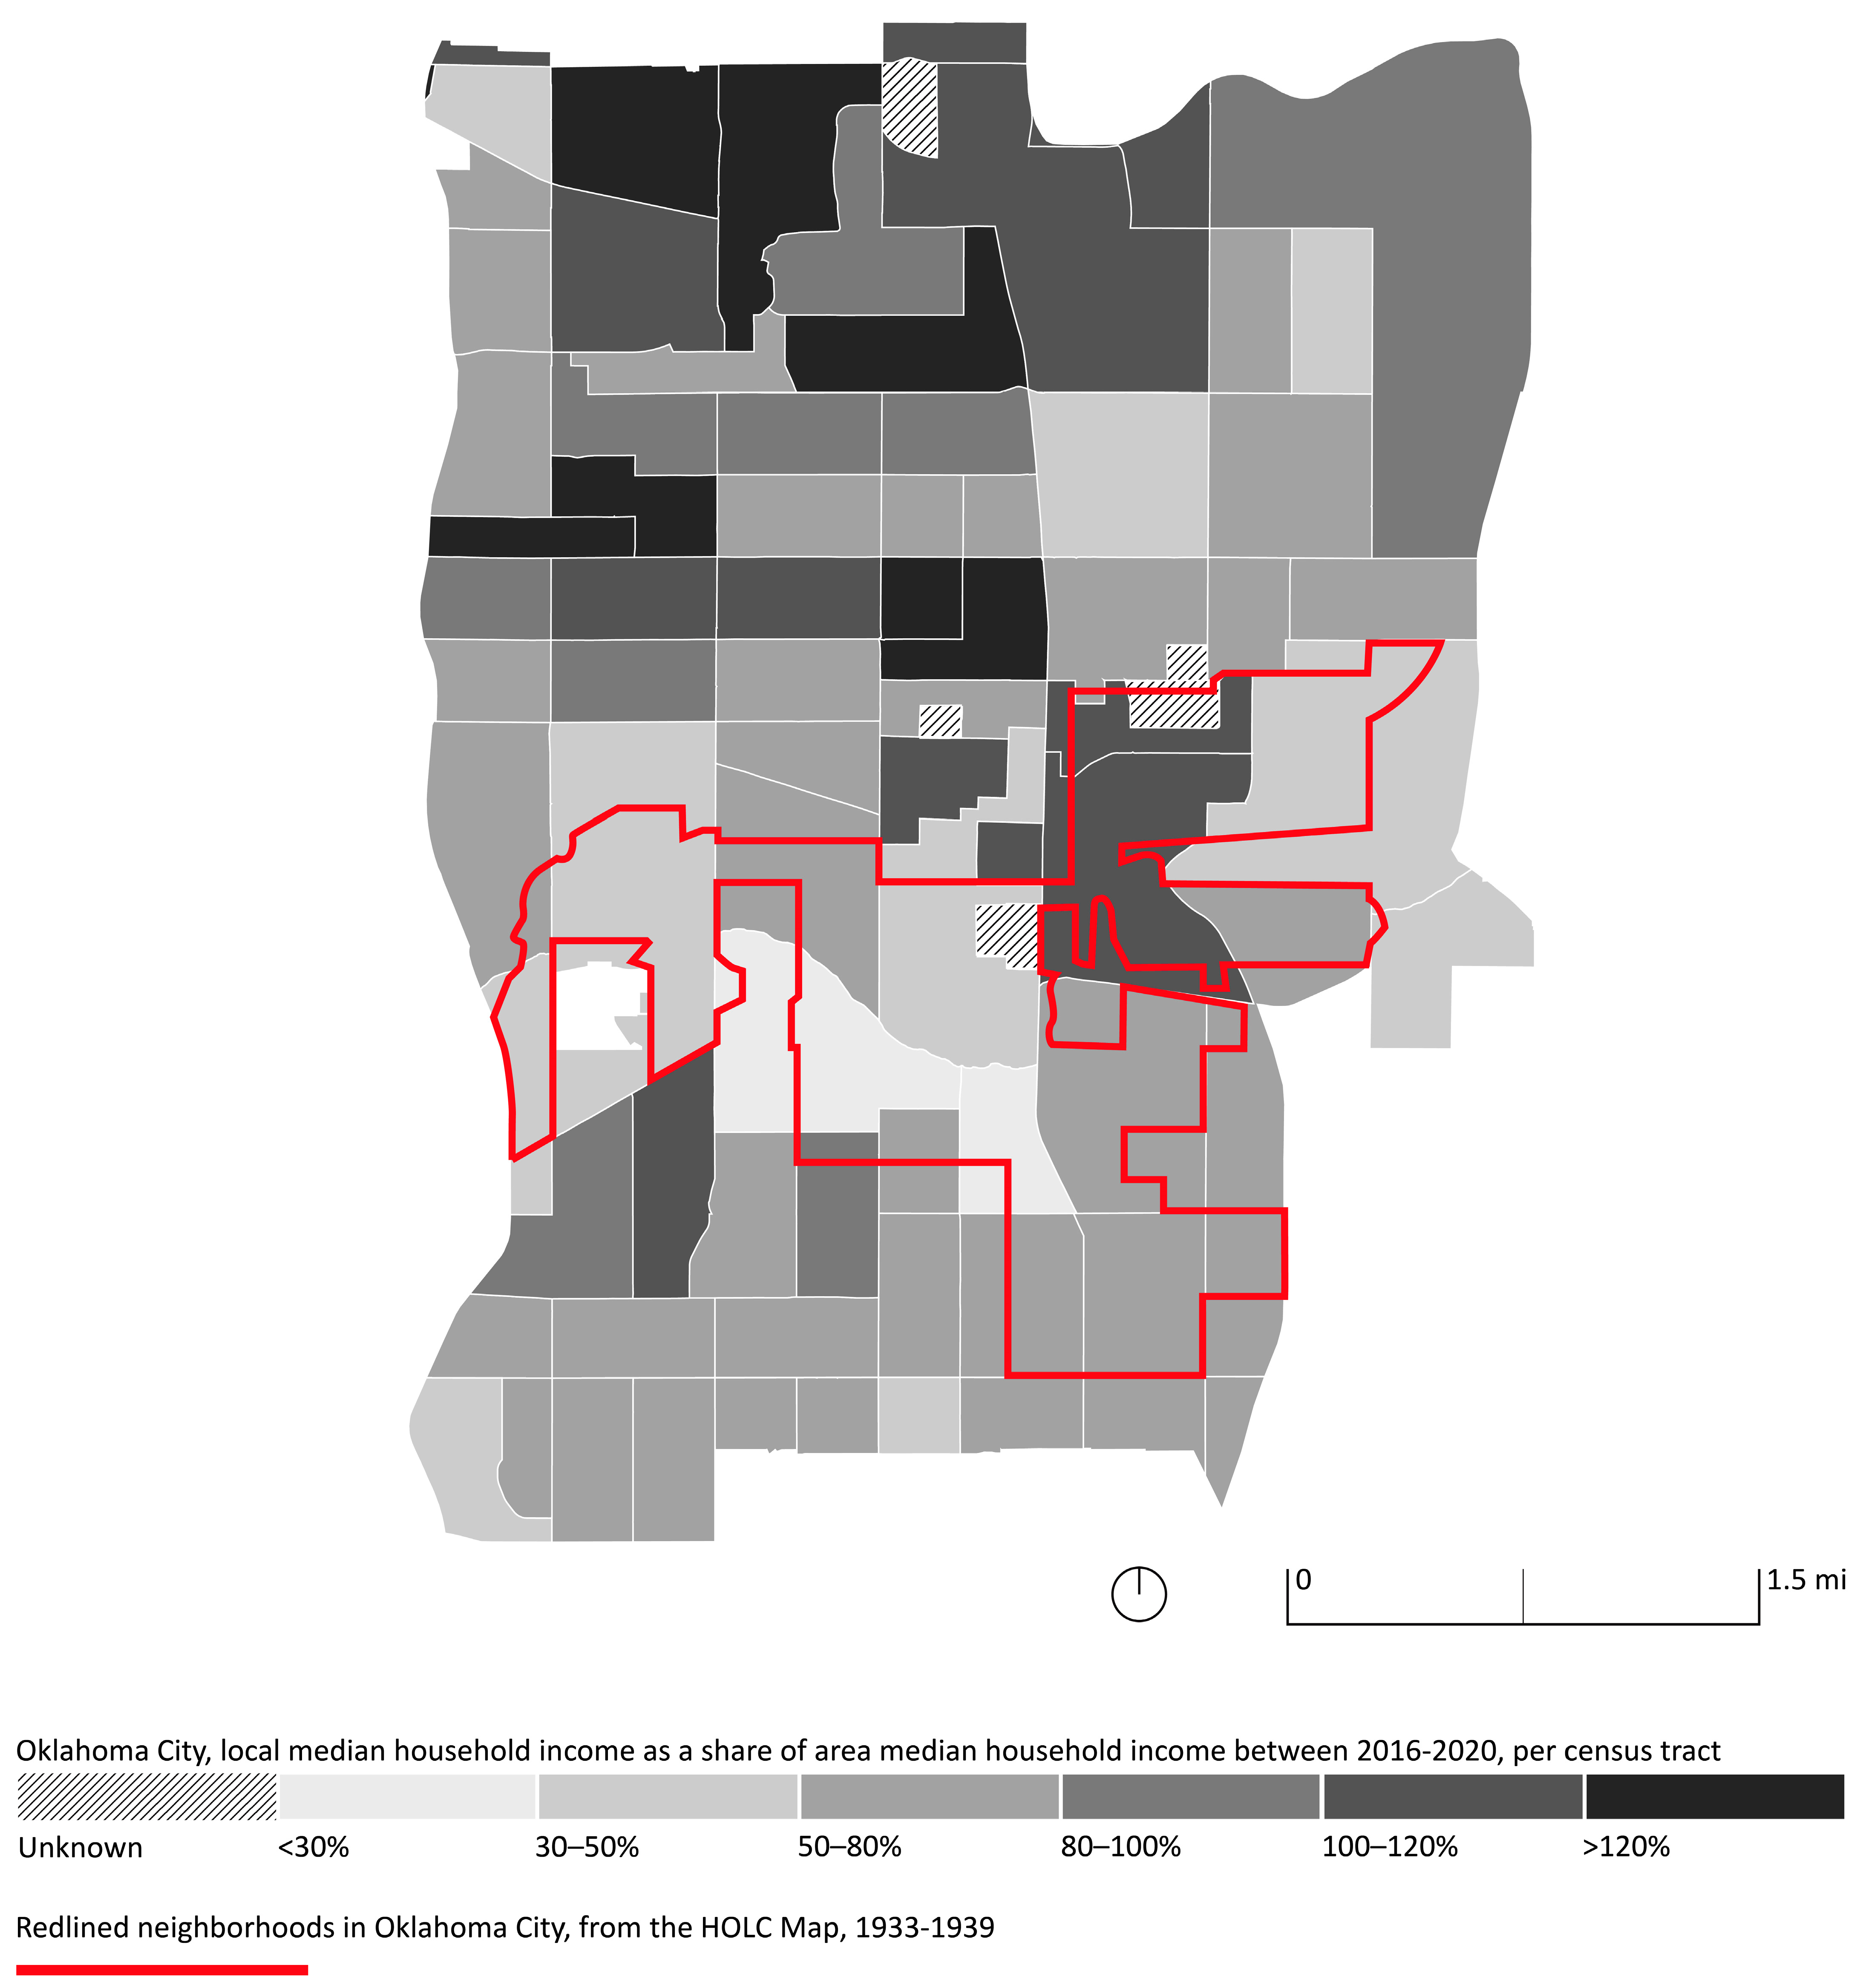
  • The spatial analysis revealed a higher concentration of DUVL on parcels that are located ½ mile to 1 mile away from the city center. This zone reflects the legacy of urban renewal programs implemented in OKC since the 1960s, that particularly hit the neighborhoods on the fringes of downtown. In addition, there is a correlation between higher vacancy rates and proximity to brownfields and railroads.
  • Specific vacant lot shapes and features occur more often close to specific urban features. Triangular and irregular quadrilateral lots happen more often in proximity to railroads, due to their diverse orientation in comparison to the street grid. Larger lots tend to be distributed more on the fringes of the urban core, and close to infrastructural intersections.
  • Under current zoning requirements, approximately 14,297 housing units and 36,879 people could be added to the urban core through infill residential developments, fulfilling the current need for new rental and ownership housing in the city.
Further steps of this research will be directed towards a more comprehensive vacancy classification, including land cover data. By focusing on the nature of the soil of DUVL, a matrix of development potentials for non-residential categories, including productive landscape uses, such as food production, can be created. This further investigation would allow our findings to support community-driven solutions to DUVL, such as community gardens, and neighborhood farms. Finally, the research team is currently exploring grant opportunities to build a web portal. Comprised of maps, data tables, and charts, this web portal will offer a variety of user summaries on DUVL to help fulfill infill housing demand, with a focus on small-scale solutions.

Supplementary Materials

The following supporting information can be downloaded at: https://www.mdpi.com/article/10.3390/urbansci7040101/s1. Detailed tables presented in this study are available here: Table S1: Geodatabase inventory. Table S2a: UVL detection. Table S2b: DUVL detection. Table S3: Spatial distribution of DUVL per census tract. Table S4: Property type analysis. Table S5a: Zoning analysis. Table S5b: Zoning analysis, non-conforming DUVL parcels in R-1 zones. Table S6: Street-type analysis. Table S7: Proximity to urban elements analysis. Table S8: Slope analysis. Table S9: Geometric analysis by shape and area. Table S10: Area comparison between DUVL and tax parcels. Table S11a: Housing potential assessment: OKC current main zoning development standards. Table S11b: Housing potential assessment: applied density for each scenario. Table S12a, b, and c: Housing potential assessment: scenarios 1, 2, and 3.

Author Contributions

Conceptualization, F.C.; Methodology, F.C., M.A. and D.R.; Software, F.C., M.A., D.R. and R.K.K.; Validation, F.C., M.A., D.R. and R.K.K.; Analysis, F.C., M.A., D.R. and R.K.K.; Writing—original draft, F.C. and M.A.; Writing—first review, F.C. and D.R.; Visualization, F.C., M.A. and R.K.K.; Supervision, F.C. All authors have read and agreed to the published version of the manuscript.

Funding

Financial support for publication was provided by the University of Oklahoma Libraries’ Open Access Fund.

Data Availability Statement

Information on data inventory and availability is in Table S1.

Acknowledgments

The research team is grateful for the support for data collection offered by the City of Oklahoma City Planning Department, particularly to Lisa Chronister, and the Oklahoma County Assessor, with special thanks to Timothy Conner. We are grateful for the continuous input of Gibbs College of Architecture Faculty Shane Hampton, Shawn Schaefer, Wenwen Cheng, Vanessa Morrison, and Charles Warnken.

Conflicts of Interest

The authors declare no competing financial interest or personal relationships with other people or organizations that could inappropriately influence their work. The work has not been published previously and it is not under consideration for publication elsewhere.

References

  1. Ewing, R.; Bartholomew, K.; Winkelman, S.; Walters, J.; Chen, D. Growing Cooler: The Evidence on Urban Development and Climate Change; Urban Land Institute: Washington, DC, USA, 2008. [Google Scholar]
  2. Raven, J.; Stone, B.; Mills, G.; Towers, J.; Katzschner, L.; Leone, M.F.; Gaborit, P.; Georgescu, M.; Hariri, M.; Lee, J.; et al. Urban Planning and Urban Design. In Climate Change and Cities, 1st ed.; Rosenzweig, C., Solecki, W.D., Romero-Lankao, P., Mehrotra, S., Dhakal, S., Ali Ibrahim, S., Eds.; Cambridge University Press: Cambridge, UK, 2018; pp. 139–172. [Google Scholar] [CrossRef]
  3. Adams-Schoen, S.; Sullivan, E.J. Reforming Restrictive Residential Zoning: Lessons from An Early Adopter. J. Afford. Hous. Community Dev. Law 2021, 30, 161–216. [Google Scholar] [CrossRef]
  4. Wegman, J. Death to Single-Family Zoning…and New Life to the Missing Middle. J. Am. Plann. Assoc. 2020, 86, 113–119. [Google Scholar] [CrossRef]
  5. Accordino, J.; Johnson, G.T. Addressing the Vacant and Abandoned Property Problem. J. Urban Aff. 2000, 22, 301–315. [Google Scholar] [CrossRef]
  6. Kremer, P.; Hamstead, Z.; McPhearson, T. A Social–Ecological Assessment of Vacant Lots in New York City. Landsc. Urban Plan. 2013, 120, 218–233. [Google Scholar] [CrossRef]
  7. Pagano, M.; Bowman, A. Vacant Land in Cities: An Urban Resource; Brookings Institution, Center on Urban and Metropolitan Policy: Washington, DC, USA, 2000. [Google Scholar]
  8. Anderson, E.C.; Minor, E.S. Vacant Lots: An Underexplored Resource for Ecological and Social Benefits in Cities. Urban For. Urban Green. 2017, 21, 146–152. [Google Scholar] [CrossRef]
  9. Rupprecht, C.D.D.; Byrne, J.A. Informal Urban Greenspace: A Typology and Trilingual Systematic Review of Its Role for Urban Residents and Trends in the Literature. Urban For. Urban Green. 2014, 13, 597–611. [Google Scholar] [CrossRef]
  10. McClintock, N.; Cooper, J.; Khandeshi, S. Assessing the Potential Contribution of Vacant Land to Urban Vegetable Production and Consumption in Oakland, California. Landsc. Urban Plan. 2013, 111, 46–58. [Google Scholar] [CrossRef]
  11. Mohamad Selamat, I.A.; Maruthaveeran, S.; Mohd Yusof, M.J.; Shahidan, M.F. Planning Tools to Revitalise Urban Vacant Land from Ecological Perspectives: A Systematic Review. Urban Sci. 2023, 7, 58. [Google Scholar] [CrossRef]
  12. Ehrhardt, D.; Behnisch, M.; Jehling, M.; Michaeli, M. Mapping Soft Densification: A Geospatial Approach for Identifying Residential Infill Potentials. Build. Cities 2023, 4, 193–211. [Google Scholar] [CrossRef]
  13. Kim, G.; Miller, P.A.; Nowak, D.J. Urban Vacant Land Typology: A Tool for Managing Urban Vacant Land. Sustain. Cities Soc. 2018, 36, 144–156. [Google Scholar] [CrossRef]
  14. Bowman, A.; Pagano, M. Terra Incognita: Vacant Land and Urban Strategies; Georgetown University Press: Washington, DC, USA, 2004. [Google Scholar]
  15. Newman, G.; Bowman, A.; Lee, R.J.; Kim, B. A Current Inventory of Vacant Urban Land in America. J. Urban Des. 2016, 21, 302–319. [Google Scholar] [CrossRef]
  16. Newman, G.; Gu, D.; Kim, J.-H.; Bowman, A.O.M.; Li, W. Elasticity and Urban Vacancy: A Longitudinal Comparison of U.S. Cities. Cities 2016, 58, 143–151. [Google Scholar] [CrossRef]
  17. Prener, C.G.; Braswell Harris, T.; Monti, D.J. St. Louis’s ‘Urban Prairie’: Vacant Land and the Potential for Revitalization. J. Urban Aff. 2020, 42, 371–389. [Google Scholar] [CrossRef]
  18. Song, X.; Wen, M.; Shen, Y.; Feng, Q.; Xiang, J.; Zhang, W.; Zhao, G.; Wu, Z. Urban Vacant Land in Growing Urbanization: An International Review. J. Geogr. Sci. 2020, 30, 669–687. [Google Scholar] [CrossRef]
  19. Lee, R.J.; Newman, G. A Classification Scheme for Vacant Urban Lands: Integrating Duration, Land Characteristics, and Survival Rates. J. Land Use Sci. 2019, 14, 306–319. [Google Scholar] [CrossRef] [PubMed]
  20. Office of Jonathan Tate. The Starter Home*: Volume One; Office of Jonathan Tate: New Orleans, LA, USA, 2015. [Google Scholar]
  21. Cao, Q.; Shi, M. Spatio-Temporal Distribution and Classification of Utilization of Urban Bare Lots in Low-Slope Hilly Regions. PLoS ONE 2021, 16, 19. [Google Scholar] [CrossRef] [PubMed]
  22. City and Town Population 2020–2022. 13 June 2023. Available online: https://www.census.gov/data/tables/time-series/demo/popest/2020s-total-cities-and-towns.html (accessed on 20 August 2023).
  23. Parolek, D. Missing Middle Housing: Thinking Big and Building Small to Respond to Today’s Housing Crisis; Island Press: Washington, DC, USA, 2020; Available online: https://www.google.com/books/edition/Missing_Middle_Housing/sDfnDwAAQBAJ?hl=en&gbpv=1&dq=missing+middle+housing&printsec=frontcover (accessed on 20 August 2023).
  24. Hampton, S. Population Loss in Oklahoma City. 5 February 2021. Available online: http://shanehampton.com/population-loss-in-oklahoma-city/ (accessed on 20 August 2023).
  25. Gruen Associates, Inc. Central City Plan: Oklahoma City; Oklahoma City Urban Renewal Authority: Oklahoma City, OK, USA, 1975. [Google Scholar]
  26. Lackmeyer, S.; Money, J. OKC: Second Time Around; Full Circle Press: Oklahoma City, OK, USA, 2007. [Google Scholar]
  27. Oklahoma City Urban Renewal Authority; Harrison-Walnut Redevelopment Corporation. Amended Harrison-Walnut Urban Renewal Plan; Special Archive Sessions; Oklahoma City Metropolitan Library: Oklahoma City, OK, USA, 1983. [Google Scholar]
  28. City of Oklahoma City Planning Department’s Office of Sustainability. AdaptOKC: Adapting for a Healthy Future. Oklahoma City. 2020. Available online: https://www.okc.gov/home/showpublisheddocument/18882/637299972915330000 (accessed on 20 August 2023).
  29. 2020 Census Demographic Data Map Viewer. 2022. Available online: https://mtgis-portal.geo.census.gov/arcgis/apps/MapSeries/index.html?appid=2566121a73de463995ed2b2fd7ff6eb7 (accessed on 20 August 2023).
  30. Economic & Planning Systems, Inc. Housing Affordability Study. Denver, CO, USA. 2021. Available online: https://www.okc.gov/home/showpublisheddocument/27501/637837177955800000 (accessed on 20 August 2023).
  31. Opticos Design. Development Codes Diagnosis, Oklahoma City, Oklahoma. Oklahoma City, OK, USA, 2017. Available online: https://www.okc.gov/home/showpublisheddocument/24106/637625460305300000 (accessed on 20 August 2023).
  32. Oklahoma City Urban Renewal Authority. Ocura Land Inventory. 2022. Available online: https://www.ocura-ok.org/land-inventory (accessed on 20 August 2023).
  33. GSBS Richman Consulting. Addressing Vacant & Abandoned Buildings in Oklahoma City Prevalence, Costs + Program Proposal; GSBS Richman Consulting: Oklahoma City, OK, USA, 2013. Available online: https://www.okc.gov/home/showdocument?id=2518 (accessed on 20 August 2023).
  34. City of Oklahoma City, Planning Commission. PlanOKC. Planning for a Healthy Future. 2020. Available online: https://planokc.org/wp-content/uploads/2020/04/01_planokc_final_20201210.pdf (accessed on 20 August 2023).
  35. City of Oklahoma City, Planning Office. Open Data Portal. 2022. Available online: https://data.okc.gov/portal/page/start/ (accessed on 20 August 2023).
  36. Larry Stein Oklahoma County Assessor Online Mapping 2022. Available online: https://oklahomacounty.geocortex.com/Html5Viewer/Index.html?configBase=http://oklahomacounty.geocortex.com/Geocortex/Essentials/REST/sites/OKCAssessor/viewers/OKCAssessor_gvh/virtualdirectory/Resources/Config/Default (accessed on 20 August 2023).
  37. Regrid. Regrid Maps. 2022. Available online: https://regrid.com/ (accessed on 20 August 2023).
  38. Brown-Luthango, M.; Makanga, P.; Smit, J. Towards Effective City Planning—The Case of Cape Town in Identifying Potential Housing Land. Urban Forum 2012, 24, 189–203. [Google Scholar] [CrossRef]
  39. Metro. 2018 Urban Growth Report. Appendix 2 Buildable Lands Inventory; Portland, OR, USA, 2018. Available online: https://www.oregonmetro.gov/sites/default/files/2018/07/03/UGR_Appendix2_Buildable_Lands_Inventory.pdf (accessed on 20 August 2023).
  40. Raetz, H. Oakland’s Vacant Lots. Encouraging Equitable Development; Goldman School of Public Policy: Oakland, CA, USA, 2018; Available online: https://ternercenter.berkeley.edu/wp-content/uploads/pdfs/H.Raetz_Vacant_Parcels_Final.pdf (accessed on 20 August 2023).
  41. King County Office of Performance, Strategy, and Budget; BERK Consulting; Heartland LLC. 2021 Urban Growth Capacity Report; Seattle, WA, USA, 2021. Available online: https://kingcounty.gov/~/media/depts/executive/performance-strategy-budget/regional-planning/UGC/KC-UGC-Final-Report-2021-Ratified.ashx?la=en (accessed on 20 August 2023).
  42. O’Looney, B. Increments of Neighborhood. A Compendium of Built Types for Walkable and Vibrant Communities; Oro Editions: Novato, CA, USA, 2020. [Google Scholar]
  43. City of Oklahoma City, Planning Department. Code Update Phase 2: Code Development. 2022. Available online: https://www.okc.gov/departments/planning/current-projects/code-update/code-update-phase-2-code-development (accessed on 20 August 2023).
  44. United States Census Bureau. American Community Survey: 2020 ACS 5-Year Estimates, Table S1101: Households and Families, 2020. Available online: https://data.census.gov/table?q=households&g=160XX00US4055000&tid=ACSST5Y2020.S1101&moe=false (accessed on 20 August 2023).
Figure 1. Aerial view of Oklahoma City (OKC), OK, USA. Original maps data: Google Earth ©2022 TerraMetrics, Map data ©2022, https://earth.google.com/web/ (accessed on 20 August 2023), image adapted by the authors.
Urbansci 07 00101 g001
Figure 2. Pictures of vacant land in OKC’s urban core. The yellow box is the parcel perimeter. Original photos data: Google Street View, ©2022 Google, https://www.google.com/maps (accessed on 20 August 2023), images adapted by the authors.
Urbansci 07 00101 g002
Figure 3. Aerial view of OKC in 1941 (left, before urban renewal) and 2022 (right). Photos: Department of Agriculture. Agricultural Stabilization and Conservation Service. Aerial Photography Field Office. Oklahoma County, Oklahoma, 1941. 2B-141, 1B-145. 1:20,000, original source. Oklahoma Historical Aerial Digitization Project, 2022, electronic source: https://www.oklahoma.gov/content/dam/ok/en/occ/documents/og/ohadp/oklahoma/sns_oklahoma_1941/2B-141.jpg, https://www.oklahoma.gov/content/dam/ok/en/occ/documents/og/ohadp/oklahoma/sns_oklahoma_1941/1B-145.jpg (accessed on 20 August 2023), images adapted by the authors. Google Maps, ©2022 Airbus, CNES/Airbus, Maxar Technologies, U.S. Geological Survey, USDA/FPAC/GEO, Map data ©2022, (accessed on 20 August 2023).
Urbansci 07 00101 g003
Figure 4. OKC’s urban core land area compared to Manhattan, NY, and the whole OKC territory.
Urbansci 07 00101 g004
Figure 5. Map of median household income in OKC’s urban core census tracts as a share of area median household income between 2016–2020, with redlined neighborhoods in a 1930s Home Owners’ Loan Corporation (HOLC) map. Income data: United States Census Bureau and PolicyMap, (accessed on 20 August 2023). Original HOLC map data: Records of the Federal Home Loan Bank Board, Record Group 195, National Archives at College Park, College Park, MD, available online: https://www.docsteach.org/documents/document/redlining-map-of-oklahoma-city-oklahoma (accessed on 20 August 2023), image adapted by the authors.
Urbansci 07 00101 g005
Figure 6. Developable urban vacant land (DUVL) in OKC’s urban core.
Urbansci 07 00101 g006
Figure 7. Workflow to detect urban vacant land (UVL) and DUVL through GIS. UVL* is the preliminary database with Regrid data merged to County Assessor data.
Urbansci 07 00101 g007
Figure 8. (a,b): Distribution pattern of DUVL parcels per census tract ((a): percentage of DUVL parcels; (b): percentage of DUVL area).
Urbansci 07 00101 g008
Figure 9. Slope map of OKC’s urban core.
Urbansci 07 00101 g009
Figure 10. Aerial views of DUVL shapes. The yellow box is the parcel perimeter. Original maps data: Google ©2022 Airbus, CNES/Airbus, Maxar Technologies, U.S. Geological Survey, USDA/FPAC/GEO, Map data ©2022, https://www.google.com/maps (accessed on 20 August 2023), images adapted by the authors.
Urbansci 07 00101 g010
Figure 11. OKC, Shidler-Wheeler (census tract 1039): aerial view of the neighborhood with DUVL parcels more than 557.41 m2 (6000 sq ft, red hatch), and less than 557.41 m2 (blue hatch). Original Maps Data: Google ©2022 Airbus, CNES/Airbus, Maxar Technologies, U.S. Geological Survey, USDA/FPAC/GEO, Map data ©2022, https://www.google.com/maps (accessed on 20 August 2023), image adapted by the authors.
Urbansci 07 00101 g011
Figure 12. Flowchart to prepare DUVL according to each land-use scenario. DUVL* is the DUVL database without parcels in the Capitol-OU Medical Center area, parcels less than 93 m2 (1000 sq ft), and deducted area for new street and infrastructure creation.
Urbansci 07 00101 g012
Disclaimer/Publisher’s Note: The statements, opinions and data contained in all publications are solely those of the individual author(s) and contributor(s) and not of MDPI and/or the editor(s). MDPI and/or the editor(s) disclaim responsibility for any injury to people or property resulting from any ideas, methods, instructions or products referred to in the content.

