Article

Spatial and Temporal Analysis of Drought Forecasting on Rivers of South India

1
School of Civil Engineering, JSPM Imperial College of Engineering and Research, Pune 411060, Maharashtra, India
2
Department of Civil Engineering, Dr. Vishwanath Karad MIT World Peace University, Pune 411038, Maharashtra, India
3
School of Civil Engineering, Lovely Professional University, Phagwara 144411, Punjab, India
*
Author to whom correspondence should be addressed.
Urban Sci. 2023, 7(3), 88; https://doi.org/10.3390/urbansci7030088
Submission received: 23 March 2023 / Revised: 24 July 2023 / Accepted: 31 July 2023 / Published: 17 August 2023
(This article belongs to the Special Issue Urban Resources and Environment)

Abstract

:
Extreme weather events such as droughts are catastrophic and can have serious consequences for people and the environment. Drought may be managed if measures are taken in advance. The success of this endeavor depends on a number of factors, not the least of which is accurate descriptions and measurements of drought conditions. Reducing the negative consequences of droughts requires an early forecast of drought conditions. The primary objective of this research is, hence, to establish a process for the assessment and prediction of drought. The drought evaluation was carried out using the standards established by the SPI and the Indian Meteorological Department. Maps of drought severity were generated using severe drought data. Thirty years’ worth of SPI readings was analyzed. Fuzzy-based drought forecasting model parameters were determined during a 25-year period, and the model was validated throughout the remaining years. The findings of this study can be used by the community to help combat the drought. Before the drought worsens, the local government can implement lifesaving mitigating measures.

1. Introduction

A drought is a period of abnormally low precipitation that lasts for an extended length of time (months to years) across the land. There are four types of droughts that may be identified by their underlying causes: meteorological, agricultural, hydrological, and socioeconomic. In meteorology, drought is defined as an extended period of below-average rainfall throughout an entire region. Low precipitation, dry winds, and high temperatures characterize drought, and these factors vary greatly from place to region (Nagarajan, 2010; Haied et al., 2017) [1,2]. When the relative humidity drops low enough to have an effect on soil moisture, a severe agricultural drought will begin. The drop in soil moisture during this time period will have negative effects on crops and animals, lowering agricultural production and disrupting the ecosystem’s delicate food web. A dry period is defined in a hydrological manner as being very long in that affected river flows and water storages are below long-term mean levels in aquifers, lakes, or reservoirs. It is slugger than the last two classes, as it covers not only the depletion process but also the refilling stage. As a consequence, a socioeconomic drought occurs when the water resources systems fail to meet the demand for the economic good (Dutta et al., 2015; Bhunia et al., 2020) [3,4]. Droughts can also practically be classified on the basis of precipitation anomalies schedules. The importance of water in the Indian economy can be measured by the fact that the agricultural sector traditionally accounted for two-fifths of the GDP and two-thirds of the country’s population. But due to several factors, including the effect of the drought, it has experienced a decreasing trend. Drought directly affects urban sustainability. The shortage of water in urban areas is affecting the lifestyle of living people, affecting the overall water demand of the city and reducing pure water quality. One of the most vital and taxing functions of meteorological services is weather forecasting (Ekundayo et al., 2022; Lakshmi et al., 2020) [5,6]. It is projected that the challenges and damage to the economy, agriculture, and survival will worsen over time. To lessen the impact of this, efficient water resource planning and management is required. For both short-term and long-term agricultural production planning, accurate rainfall forecasts at varying times are crucial. Rainfall predictions are notoriously difficult to make. Given the intrinsic complexity of hydrologic processes and the variety of geomorphological and climatic elements involved, modeling precipitation series using conventional ways to simulate responses is a typical task. Quantity variability and observational errors are described by statistical modeling (Pai et al., 2011) [7]. However, the data in these models are typically thought of as integers or vectors. Because the results of continuous measurements are never perfectly precise, it is not always reasonable to make this assumption. Such uncertainty differs from mistakes and variability. Whereas errors and variability can be modeled by stochastic variables and distributions of probability (Danger et al., 2019) [8], imprecision, or fuzziness, is another type of uncertainty. The most up-to-date method is to apply fuzzy numbers and fuzzy vectors, which are special fuzzy models for a quantitative description of these data. The fuzzy theory of precipitation was recently used as an alternative method to develop an ambiguity/vagueness forecasting model. In order to model and predict data on local rainfall, Halide and Ridd (2002) [9] used flush logic. The mean root squared error between the data and the model output was 319.0 mm, smaller than the local rain or niño. Wong et al. (2003) [10] built the fuzzy rule bases using SOM and neural propagation networks and developed a predictive rainfall model for spatial interpolation over Switzerland using the rule base. To predict precipitation in the West, Karamouz et al. (2004) [11] used a model of furious rule and neural networks. They showed that the same error occurred in both models. The neurofuzzy system was employed by Annas et al. (2006) [12] to model tropical rainfall in the wet season. The low root mean squared error values of the models showed that the model forecasts are reliable. Subramanian (1999) [13] has developed an aridity index concept for the classification of drought (Ia). The aridity rate is the percentage of annual water failure to yearly water consumption or annual evapotranspiration potential. The elaborate and comprehensive droughts identifying technique was developed by Palmer (1965) [14]. The Palmer methodologies were implemented by George et al. (2010) [15] for different Indian subdivisions and 71-year defined periods and intensity of drought. One of the great shortcomings of this method is its uniform application in all agro-climate zones. In wetlands, it is more of an agricultural drought, while it is a hydrological drought in semi-arid and arid areas (Shewale and Kumar 2005) [16]. The Integrated Drought Severity Index (IDSI) was developed by Ravikumar (2017) [17] in Dharmapuri district, Tamil Nadu, to identify drought susceptible areas. In the application of a land use criterion, IDSI integrates the effect of meteorological, hydrological, and agricultural factors.
Ray and Shewale (2001) [18] reported that the likelihood of drought over Gujarat, West Rajasthán, and Jammu and Kashmir exceeded 20 percent. Herbst et al. (1966) [19] developed a drought assessment technique using monthly rainfall. The technique determines both the duration and intensity of droughts and the month in which they begin and end. Chow (1959) [20] suggested that analyzing low flows is an appropriate way to quantify droughts. He found that the deviation from normal conditions is greater when the river flows than when rain flows during periods of poor precipitation. He also suggested that low-flow data in terms of flux magnitude should be indicated. Herbst et al. (1966) [19] developed a system that Mohan and Rangacharya (1991) [21] used to evaluate severe meteorological drought using rainfall data for stream flow data. The properties of droughts were investigated using the geometric probability distribution by Yevjevich (1967) [22], which defined the drowsiness for a consecutive year when water resources were inadequate. Yevjevich (1967) [22] suggested that ARMA models are the best global models for short and long-term persistence forecasting. The distribution of the annual maximum precipitation deficit for six districts within the Netherlands was studied by Beersma and Buishand (2007) [23] following the model series based on nearby resampling. SPI-based drought forecasting using log-linear models was developed. Pongracz et al. (1999) [24] have developed a fuzzy rules-based approach to the forecast of droughts in the U.S. Great Plains, based on broad-base climate information, namely the daily atmosphere circulation patterns (CPs) (SOI). A fuzzy model to predict local droughts (characterized by PMDI) was proposed by Pongracz et al. (1999) [24] using two forcing inputs, ENSO and CPs, in a typical Nebraska state in the Great Plains.
Drought forecasting helps to protect an area from drought and to reduce the environmental, social, and economic impacts of drought in advance. The estimation and forecasting of drought is therefore very important and could involve short and long-term strategies. Studies on the assessment and forecasting of drought are important for humanity in general and for the economy of any nation. In this article, we examine the numerous drought definitions and analyze their consequences for the outward appearance and the importance of drought evaluation. The focus of this research is on improving drought forecasting using a rule-based technique and creating a meteorological and agricultural drought evaluation mechanism. A fuzzy rule-based drought forecasting methodology was developed employing the Standardized Precipitation Index (SPI), and for forecasting drought classification, AR and MA models were used. A case study of the Thamiravaruni River Basin, located in South Tamil Nadu State in India, is used for the illustration of the methodology. The weather droughts evaluation is performed using the Indian Metrological Department (IMD) method, and spatial distribution of drought over the study area is generated from the meteorological drought gravity map using GIS.

2. Methodology

2.1. Study Area

The river basin Thamiravaruni was chosen in this study as the focus catchment. The basin is one of Tamil Nadu’s oldest systems. The river in the south of this state is short but perennial. Irrigation development for the people living near the Thamiravaruni River is a major source of revenue. The behavior of the river is erratic, and the major part of the region under the basin is susceptible to droughts of mild to severe intensity. The river Thamiravaruni originates at an altitude of 2000 m and converges with Bengal Bay at the Gulf of Mannar from the Pothigai Mountains of the eastern slopes of Western Ghats. From its origins up to the Gulf of Mannar, the river Thamiravaruni is 125 km long. For the Thirunelveli and Thoothkudi districts, it is their lifeline. The overall area of the basin is 5969 km2, 688 km2 of which is hilly. The basin is located between latitudes of 8°21′ N and 9°13′ N and 77°10′ E and 78°8′ E. Figure 1 shows the map of the basin of Thamiravaruni. Southwest and northeast monsoons benefit from the forecasting of rainfall over the Western Ghats.

2.2. Data Collected

The data needed for assessing the drought can be grouped into three categories, i.e., meteorological, hydrological, and agricultural. The above data collected from various departments are detailed below.

2.2.1. Meteorological Data

The State Surface and Ground Water Data Centre and the Water Resources Organization (WRO) Public Works Department (PWD), for the period from 1975 to 2018, collected monthly precipitation data for 26 rain stations. For the Malaipatty meteorological station at the Institute for Water Studies (IWS), WRO, PWD, we collected climate data such as temperature, humidity, sunshine, wind velocity, pan-evapement, etc. Weather data were collected from the Indian Meteorological Department for the Palayankottai Weather Station.

2.2.2. Hydraulic and Hydrological Data

Papanasam, Manimuthar, Gadana, Ramanathi, Karuppanadhi, Gundar, and Servalar have been hydraulically recovered from the IWS reservoirs. Data from the stream flow was collected from the state surface, groundwater data centre, WRO, PWD, Chennai, and other WRO offices in Madurai, Thirunelveli, and Tenkasi for the period 1991–2018 for the gauging stations in Kodaimelalagian, Nadhijunni, Kannadian, Palavour, Suttamalli, Marudur, and Srivaikuntam Anicuts. WRO, Thamiravaruni Basin, Thirunelveli, collected hydraulic elements such as water expansion area, capacity, aricuts, etc., for 1300 tanks located in the Thamiravaruni Basin.

2.2.3. Agricultural Data

For the Thirunelveli and Thoothukudi provinces, statistical and agricultural departments in Thirunelveli and Thoothukudi collected agricultural data such as land use, cropping calendars, crop patterns, and cultivated areas. The agricultural data from the relevant District Offices of the Statistical Department were also collected.

3. Fuzzy Rule-Based Drought Forecasting

Fuzzy reasoning provides a means of understanding the system conduct when it is possible to infer between the observed input and output situations in systems with few numerical data and if ambiguous or uncertain information is available. Fuzzy systems can implement crisp inputs and outputs and create a nonlinear mapping of functions similar to algorithms (Ross 2005) [25]. Fuzzy systems can, on the other hand, focus on modeling problems with inaccurate or ambiguous information. It uses linguistic variables instead of quantitative ones to represent inaccurate concepts, the underlying power of the fugitive theory set. Fuzzy logic succeeds in two sorts of situations: (i) very complex models with strictly limited or judgmental understanding and (ii) processes inextricably involving human reasoning, perception of man, or decision-making of man. Drought is a smooth phenomenon in which the above-mentioned factors play a major part. It requires a thorough understanding of the drought factors, the classification of severity, and the interpretation of drought variables. In the following sections, we propose the methodology of fuzzy-based SPI drought forecasting.

Estimation of the Standardized Precipitation Index

The SPI was used to predict drought. The primal reason why SPI is used is that SPI is based solely on precipitation, which makes it possible to assess drought even if other hydro-meteorological measures are not available. The topography also has no damage to the SPI. The SPI is defined by different time frames, enabling it to describe conditions of drought through a range of meteorological, wetland, and agricultural applications. The fourth advantage of SPI is that it is standardized, which ensures that extreme event frequencies are consistent in all locations and at any time. The SPI also detects a moisture deficit, which is about 8–12 months in response. The 12-month SPI results detect long-term dry periods linked to the global impact of drought on hydrological regimes and water resources of a region (Paulo et al., 2005) [26]. This study, therefore, considered a 12-month or annual time scale.
In this study, McKee et al. (1993) [27] developed the Standardized Precipitation Index (SPI), which quantifies the multi-time precipitation deficit, reflective of the effect of precipitation deficiency on the availability of different water supplies. Technically, for a normal distributed random variable, SPI is the number of defaults that would deviate the observed value from the long-term mean. Given that precipitation does not have a normal distribution, a transformation is applied so that the precipitation values transformed are distributed in normal order (Rouault and Richard 2003) [28]. The SPI is calculated on the basis of the long-term precipitation record at a desired station that is then converted into a normal distribution so that the average SPI is nil. Criteria for drought classification in the categories described in Table 1 were assessed according to Wu et al. (2016) [29].

4. Results and Discussion

The IMD procedure was used to evaluate the severe drought of the annual rainfall time series. For all 26 stations, weather drought assessments were performed, and the results are presented in Table 2. As shown in Table 2, several blocks of drought in the years 1974, 1975, 1981, 1986, 1996, and 1999 have been affected by moderate and severe drought. Twelve blocks were seriously damaged in 1974, eight blocks were moderately damaged, and other blocks were less affected. In 1975, eleven blocks were severely affected, eight blocks were moderately affected, and other blocks were slightly affected. Four blocks suffered severe damage, four blocks were moderately affected, and others were less affected during 1982. In 1986, there were moderate impacts on 12 blocks and severe damage to nine blocks. One block suffered severe damage in 1996, and nine blocks were moderately affected. In 1999, six blocks were severely affected, and 11 blocks were moderately affected. The drought was constantly prevalent between 1974 and 1976 and between 1980 and 1983. Table 2 shows the above results. The drought seriousness of each rain gauge station was used to generate maps of drought seriousness each year. The drought gravity in 1986 and 1999 is shown as an example in Figure 2 and Figure 3.
Here M0 to M3 define drought category, where M0 stands for no drought, M1 is mild drought, M2 is moderate drought, and M3 stands for severe drought.
Drought frequency analysis was conducted using thirty-year rainfall data from the Thamiravaruni basin, based on percentage deviation using the IMD method. The following are stages of severe drought, once in 3 to 6 years, in Sivagiri, Kadaiyam, Papanasam, Damp Camp, Cheranmahadavi, Radhapuram, Nilaparai, Kayattar, Ottappidaram, Thoothukudi, Srivaikuntam, and once in 7 to 10 years in the stations Palayankottai, Karuppanadhi anicut, Kadaiyanallur, Sankarankovil, Sattankulam, and Tiruchendur. Other blocks are less often exposed to serious drought. All other blocks will be exposed to moderate drought once 2–9 years apart from Sivagiri, Gadana Dam, Ambasamudram, Manimuthar, Papanasam, Dam camp, Sencotttai, and Tenkasi. All of the blocks are often subject to mild droughts with a return period ranging from two to five years other than Kadaiyam and Papanasam, Cheranmahadevi, Tenkasi, Kadaiyanallur, and Ambasamudram.

4.1. Meteorological Drought Risk Index

The Meteorological Drought Risk Index (MDRI) was developed using frequency analysis based on thirty years of rainfall data by calculating the probability of each drought severity class. The drought risk index ranges from 1.00 at Senkottai to 2.64 at Thoothukudi. Four drought risk classes were delineated based on the range of the drought risk index, as shown in Table 3. From the IMD results presented in Table 3, the meteorological drought risk status of each block was determined.
The meteorological drought risk index spatial interpolation was performed. The region is less susceptible to meteorological drought than other regions because the blocks around the West Ghats are subjected to very good rainfall. The rainfall decreases with the increase of the distance from the Western Ghats. This leads to a gradual rise in drought propensity toward the east, which is evident from the drought risk map. Figure 3 shows the risk map of the meteorological drought in the Thamiravaruni Basin.
As Ambasamudram, Tenkasi, Gadana Dam, and Senkottai are shielded by the Western Ghats, they are less prone to meteorological drought risk than other stations. However, Tenkasi, Gadana Dam, and Senkottai are not located on the main stream and are located on the tributaries of the Thamiravaruni River. They are slightly more prone to drought compared to Ambasamudram. Palayankottai, Nanguneri, Tiruchendur, Udangudi, part of Kadaiyanallur, Vasudevanallur, Kelappavar, Kadaiyam, Pappakudi, Cheranmadevi, Kalakkadu, Azhwartirunagari and Kayattar blocks are under moderate drought risk status. Northern and tail-end blocks such as Sankarankovil, Kuruvikulam, Kayattar, Ottappidaram, Srivaikuntam, Karunkulam, Sattankulam, Manur, Azhwartirunagari, and Tiruchendur are all liable to severe drought risks as shown in Figure 4.

4.2. Drought Forecasting Using Fuzzy Logic

The drought forecasting was conducted using the standard precipitation index and fuzzy logic. In subsequent paragraphs, the analysis and drought classification using SPI and the SPI forecast are discussed with the application of the proposed fuzzy logic drought forecasting methodology.

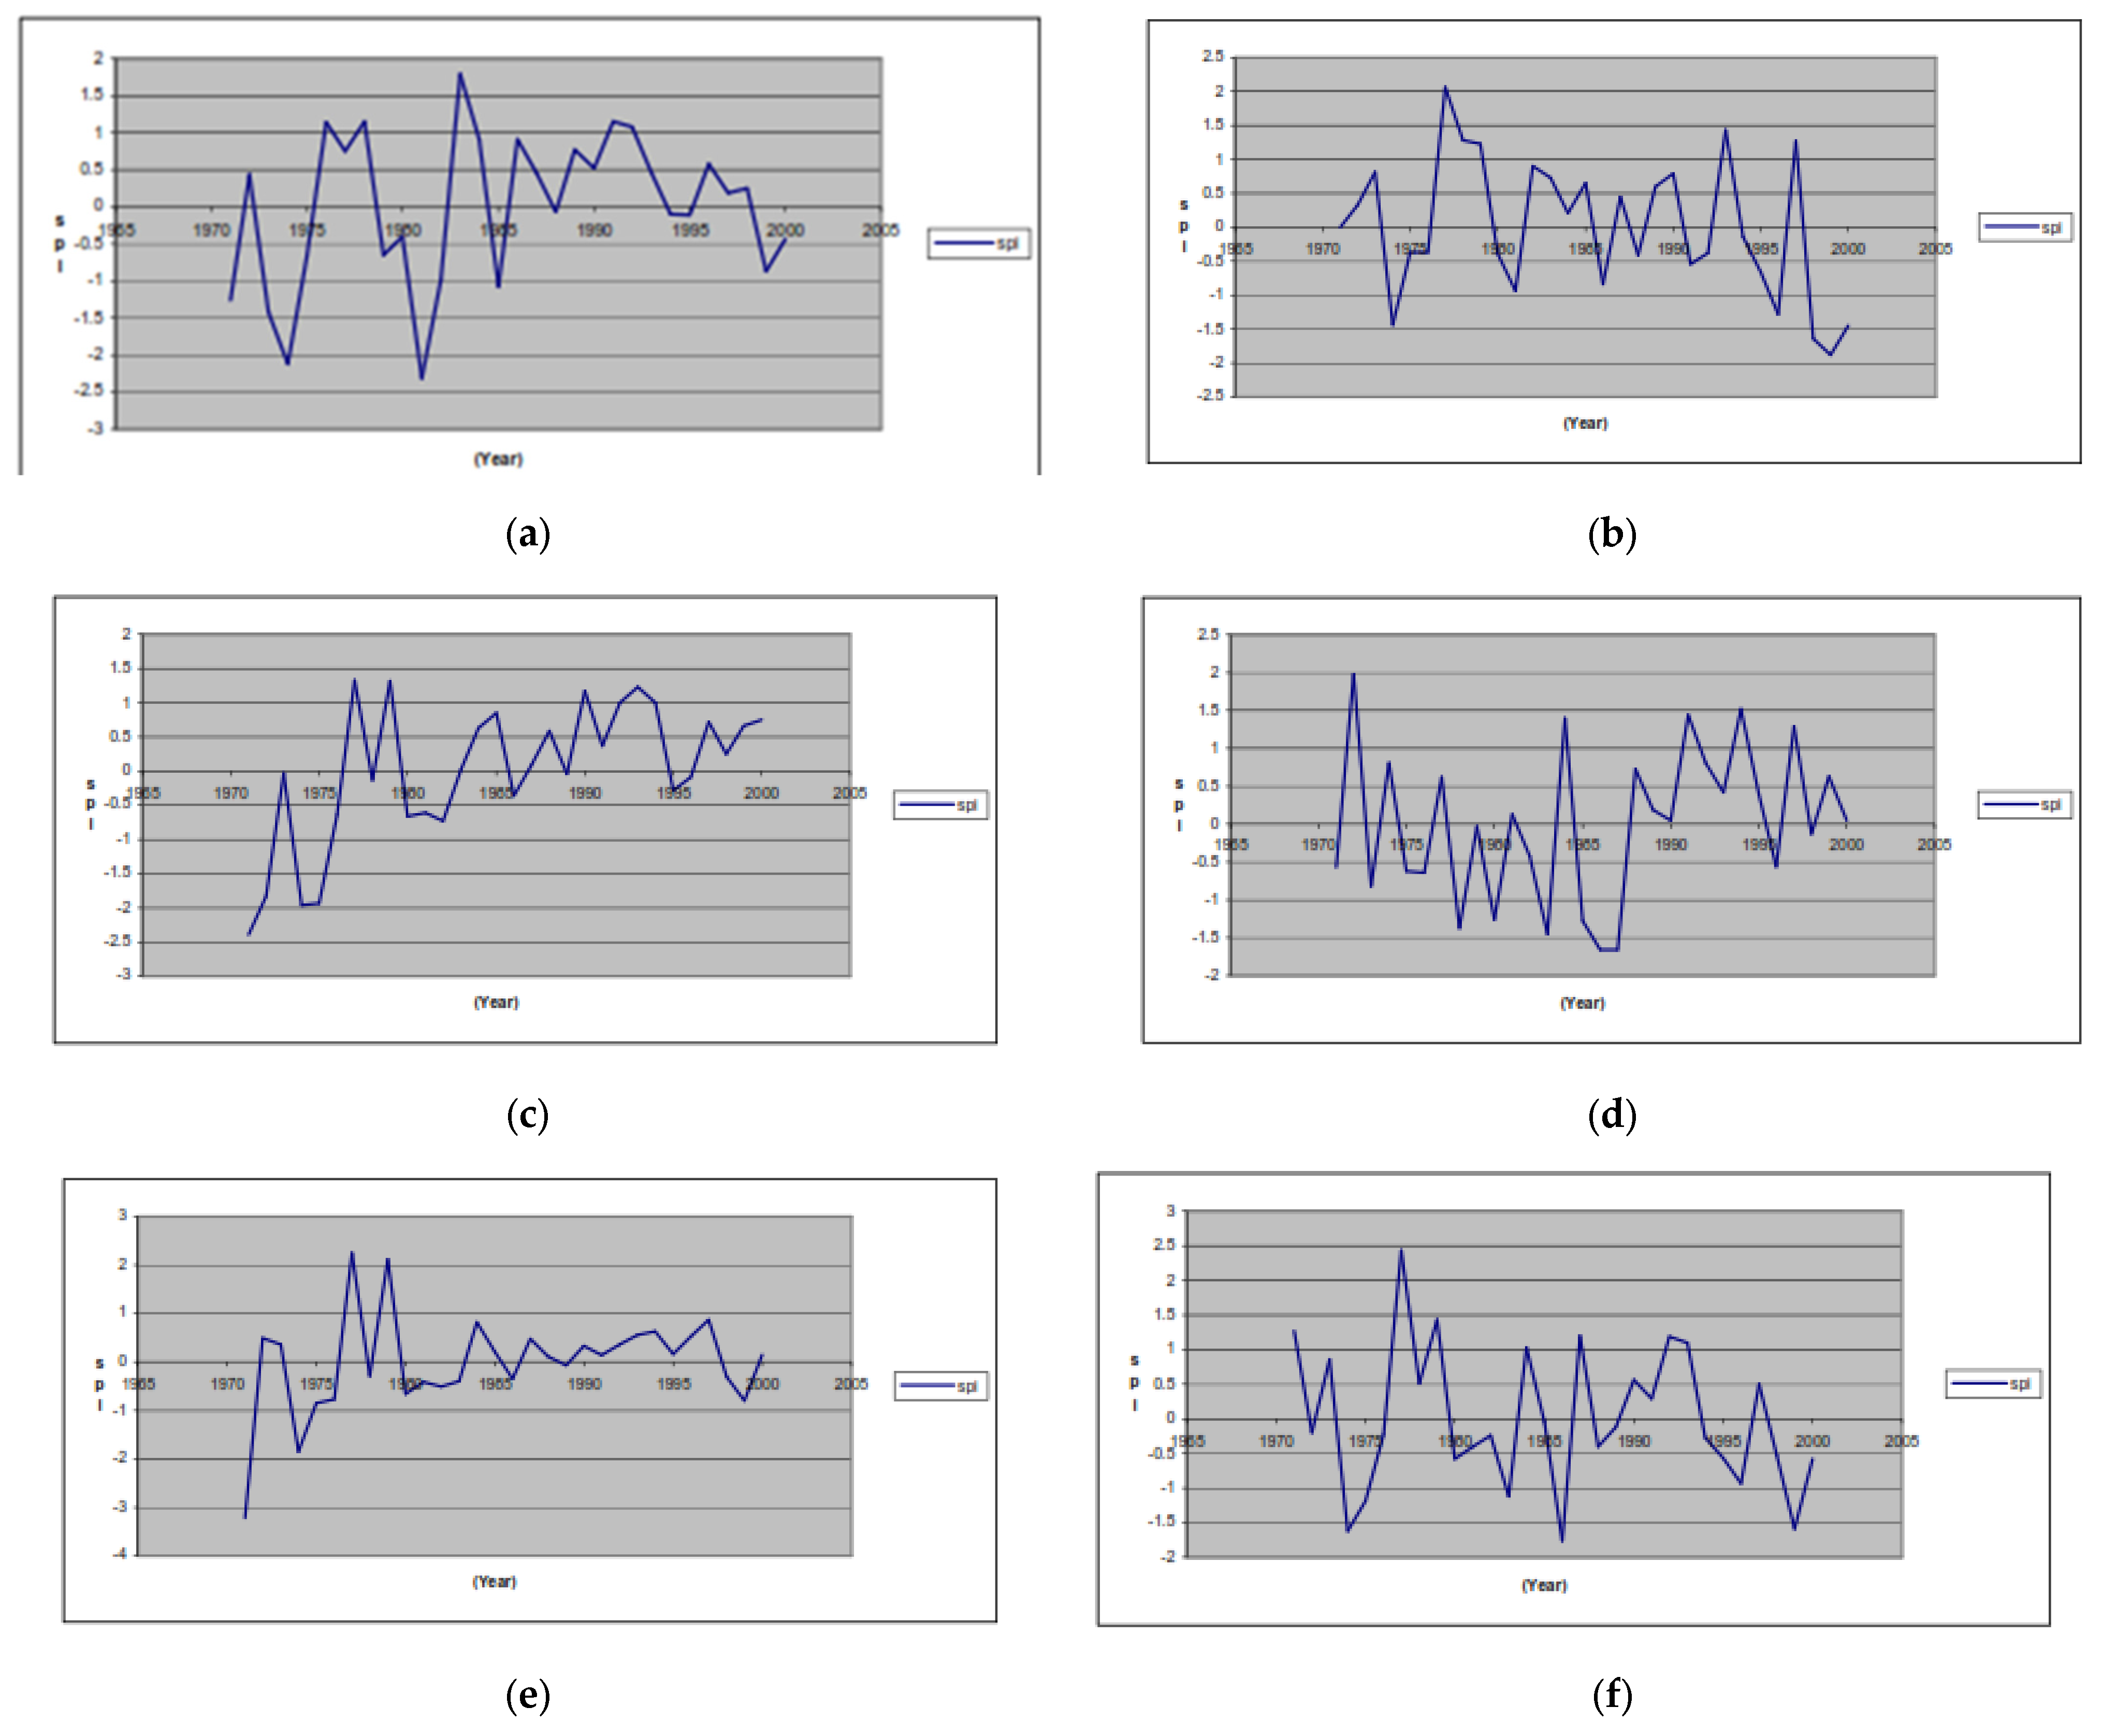
4.2.1. Analysis of SPI for Drought Forecasting

The SPI values for all the rain gauge stations were calculated based on monthly rainfall values. The SPI is calculated on the basis of long-term rainfall records for the desired station, which is then converted into a normal distribution so that the average SPI is nil. The ranks were allocated, and the membership value was based according to the drought classification. Figure 5 shows the evolution of SPI values for various rain gauge stations. Dry classification according to the SPI values was observed to differ from IMD values. Ambasamudram rain gauge station, for example, for the year 1974, was classified as moderate drought prone to IMD. However, SPI was also classified as ‘extremely dry’. The inoperative values of Karuppanadhi, Nilaparay, and Kadaiyanallur were not consistent and were not considered for SPI testing. Figure 5a–v gives a good indication of the drought history of the specific station to plot a time series of years against the SPI.

4.2.2. Drought Forecasting

Fuzzy ranks for each rain gauge station were determined, and a sample result was presented. These values were obtained following the transfer of the SPI values to the triangular fuzzy membership function. The specific SPI value of the respective sets was identified. For each possible flush set, the Hamming distances were identified, the maximum value of the fuzzy membership function was considered, and this particular range was assigned. Similarly, for each SPI value, all fused ranks were identified. The ranks were used to predict the severity of the drought. These ranks are predicted using MA (2) and AR (2) models. SPSS was used to estimate the model parameters for all stations. The parameters were used to predict the corresponding drought classification rank for MA (2) and AR (2).
For analysis and modeling of the hydrological time series, stochastic models are widely used. The MA and AR were used for two kinds of shocking models. The Box and Jenkins 1976 correlation method was used to apply linear AR and MA models to fuzzified PI series. The AR and MA models were developed in three phases: identification, estimation, and diagnostic inspection. In the identification phase, data were transformed to improve the normality and stability of the time series, if needed, and the general form of the model to be estimated was determined. For information on the seasonal and non-seasonal AR and MA operators for the fused annual series, the autocorrelation function (ACF) and partial autocorrelation function (PACF), calculated using the SPSS software, are used. The ACF measures linear dependence in time series between observations.
A second-order Moving Average (MA) and Autoregressive (AR) models (Haan 2012) were used for forecasting the respective rank for the next time step.

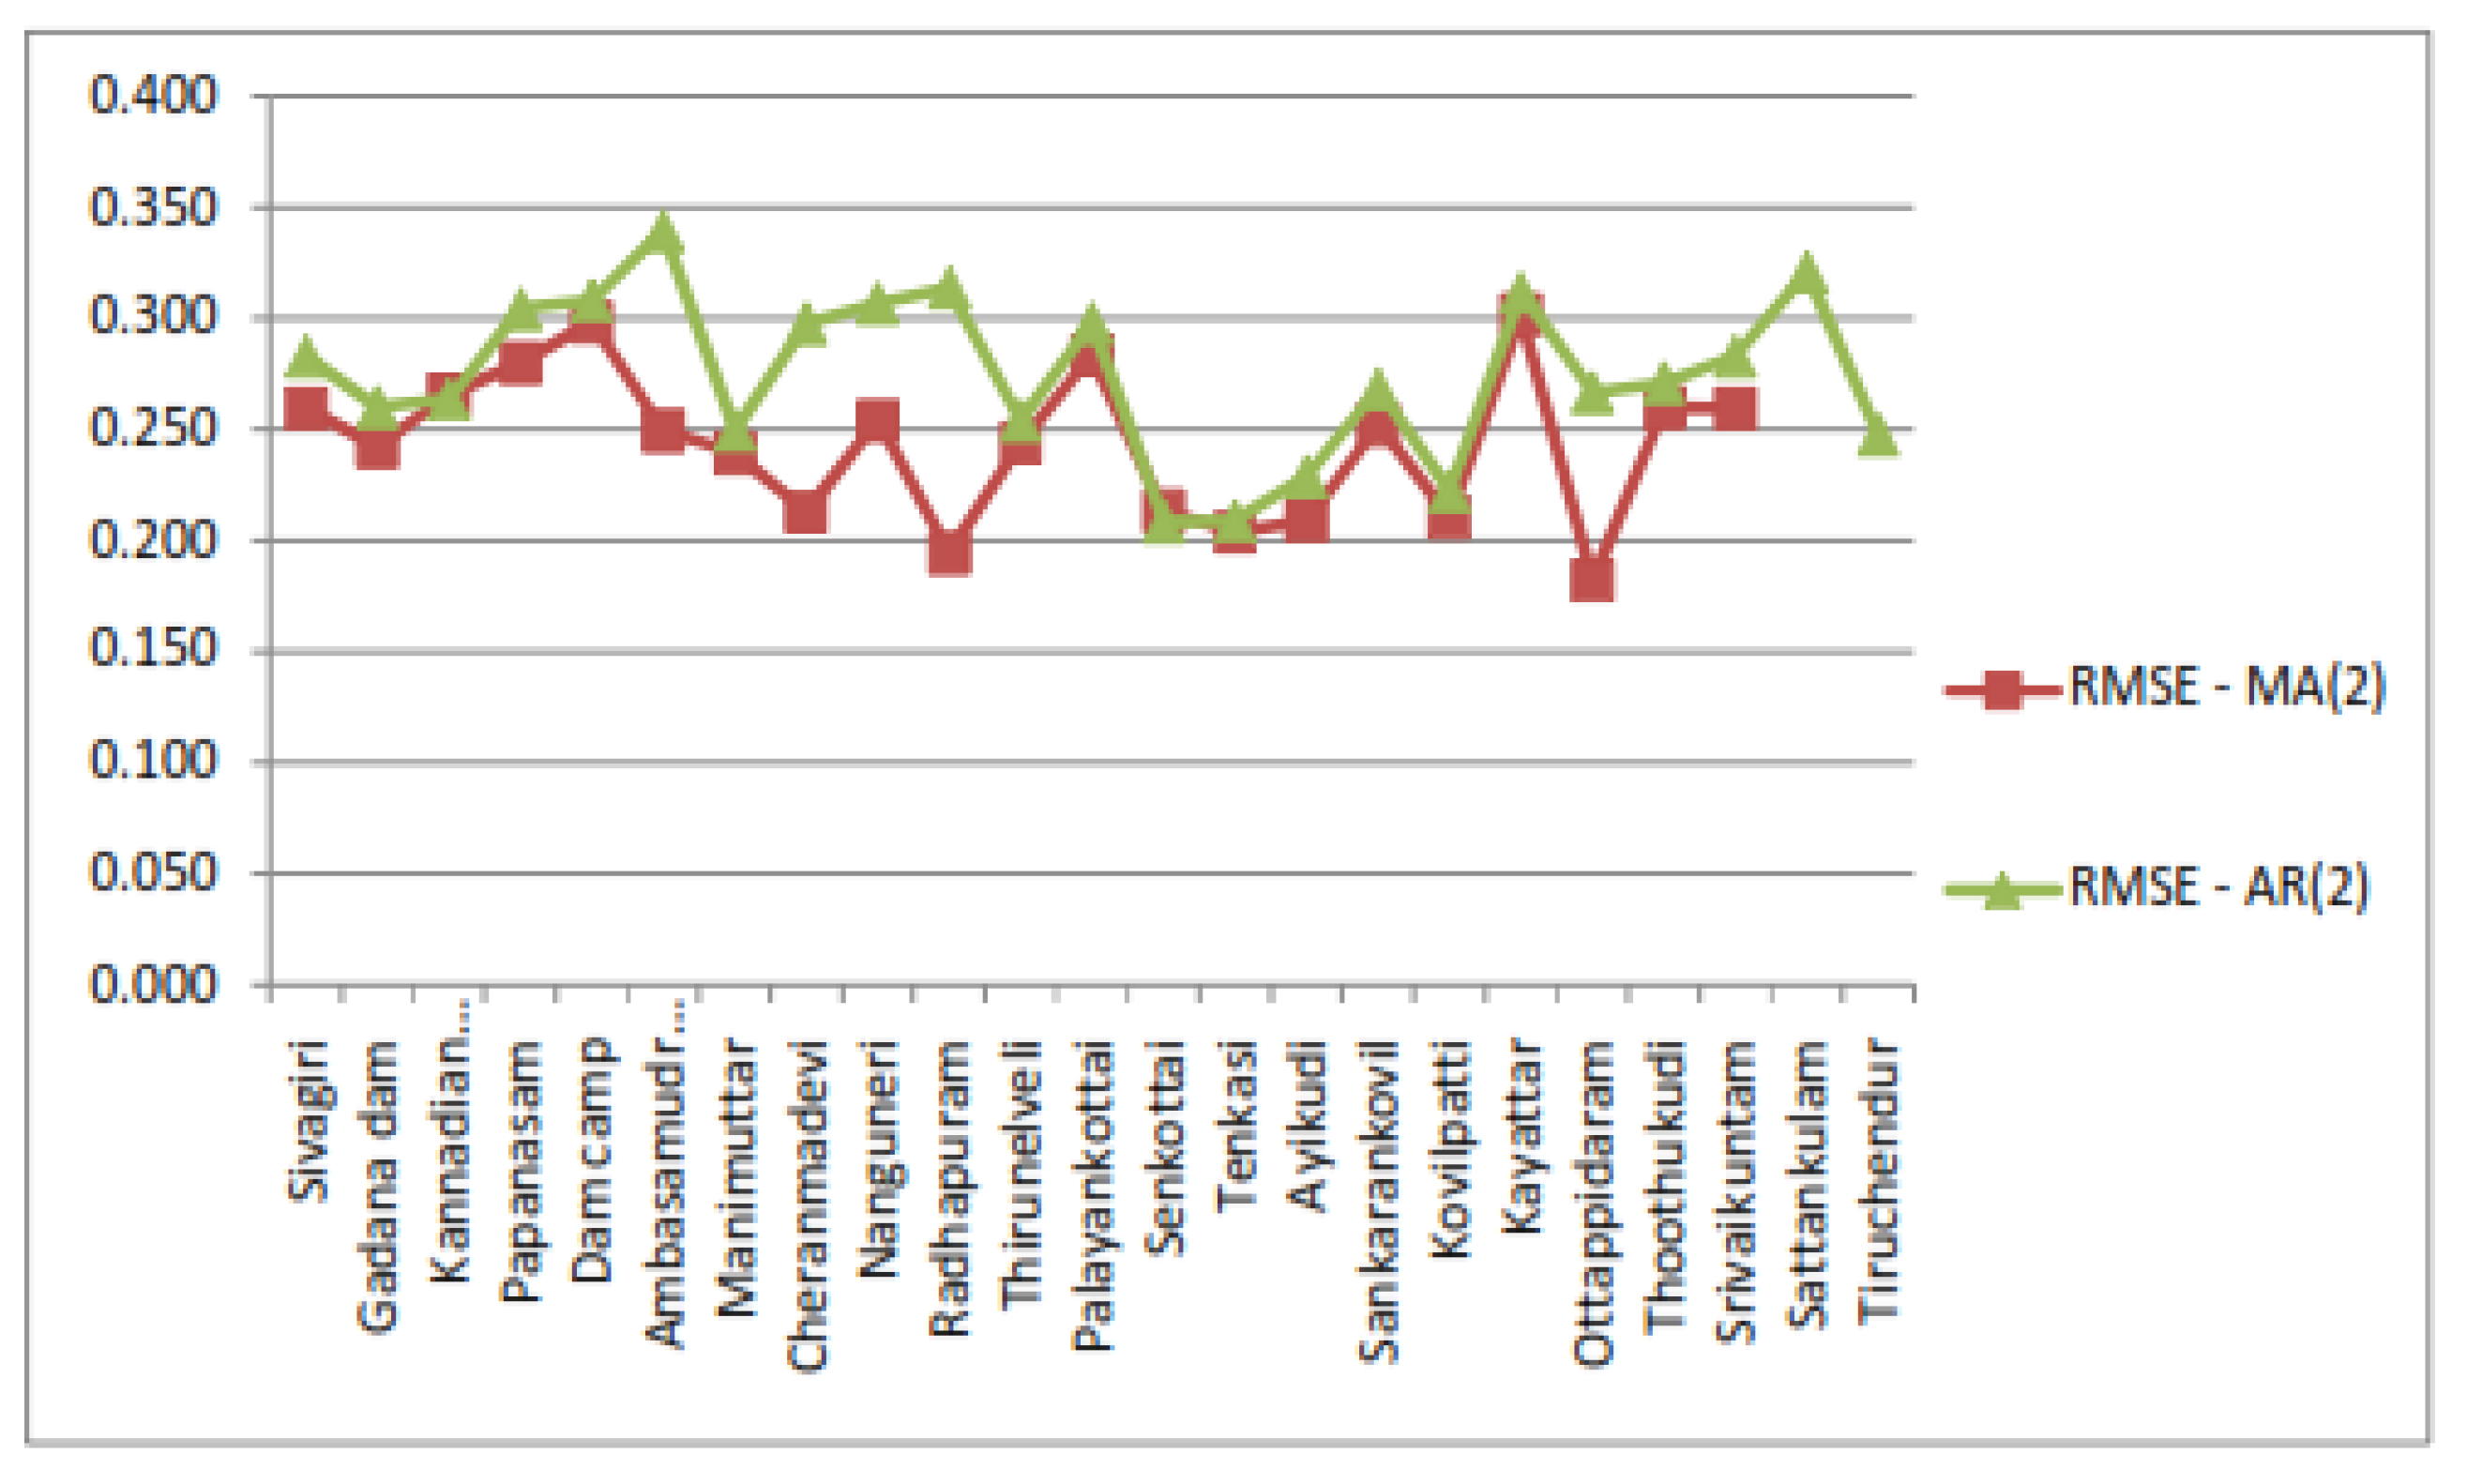
4.2.3. Performance of Fuzzy-Based Drought Forecasting

The performance of both MA and AR models was evaluated using the Root Mean Square Error (RMSE) for annual time lead. The performance of the fuzzy-based forecasting model using MA and AR processes is examined, and the results are presented in Figure 6. Based on the RMSE, the MA (2) process performs well in forecasting the fuzzified drought ranks compared to the AR (2) process. It is observed that the RMSE value for MA (2) was less compared to the AR (2) process. Hence, the MA (2) results were used for forecasting the drought severity class for the immediate time step.

4.2.4. Defuzzification of the Forecasted Ranks

The projected ranks of the triangular fuzzy membership were defuzzified and overlaid, and their respective drought severity was identified. It is noted that the classification of the deflated drought severity has the range of drought severity that carries the drought-related uncertainty. This method is based on a direct approach based on fuzzy logic with better-integrated drought uncertainty than other models, as discussed in the literature review.

5. Conclusions

Drought forecasting necessitates research into modeling methodologies in the fields of meteorology, hydrology, agricultural systems, and water resource systems. In order to enhance the required multi-stage forecasting, accurate forecasting is essential for the best management practices. Meteorological drought evaluation was conducted using the IMD technique. The meteorological drought gravity map was used in conjunction with a geographic information system to determine the geographical distribution of drought over the research region. Analytical frequency was applied to the IMD outcomes and the suggested meteorological driving risk index. The findings were discussed. Mild and moderate IMD drought has been determined to be a threat in areas such as Kayattar, Karunkulam, Kuruvikulam, Sankarankovil, and Alangulam. These sections are especially vulnerable to long-term drought. This is clearly demonstrated by the frequency-based meteorological drought risk index created for this research. According to this proposed technique, the aforementioned blocks represent extremely drought-prone locations. Based on frequency analyses, this study finds that a methodology created for meteorological drought evaluations is more effective than the IMD approach in identifying areas likely to experience drought. Both of these approaches share the same roots and rationales; however, the suggested technique is an enhanced version of the IMD approach. With the use of the supply and demand calculation, the extent of the drought in the agricultural sector was evaluated. The Thamiravaruni Basin’s whole block set was analyzed. Supply and demand analysis was implemented throughout the Kar (June–September), Pishanam (October–February), and Dry (March–July) seasons. It was discovered that droughts occurred more frequently during the Kar season than during the Pishanam season. A frequency study of yearly rainfall in the Thamiravaruni basin shows that the basin is at risk of drought around once every five years.
People can utilize the study’s findings to help ease the current drought. Before the drought becomes any worse, the government may take precautions that could save lives. Using data collected at the block level can help prioritize areas in need of immediate drought relief, soil conservation, water conservation (including rainwater collecting and mitigation), environmental planning, and the restoration of geo-ecological balance.

Author Contributions

Formal analysis, A.S. and K.S.; writing—original draft preparation, A.S. and K.S.;writing—review and editing, K.V.S. and V.K. All authors have read and agreed to the published version of the manuscript.

Funding

This research received no external funding.

Data Availability Statement

The datasets generated during the current study are available from the corresponding author upon reasonable request.

Conflicts of Interest

The authors declare no conflict of interest.

References

  1. Nagarajan, R. Drought Assessment; Springer Science & Business Media: Berlin/Heidelberg, Germany, 2010. [Google Scholar]
  2. Haied, N.; Foufou, A.; Chaab, S.; Azlaoui, M.; Khadri, S.; Benzahia, K.; Benzahia, I. Drought assessment and monitoring using meteorological indices in a semi-arid region. Energy Procedia 2017, 119, 518–529. [Google Scholar] [CrossRef]
  3. Dutta, D.; Kundu, A.; Patel, N.R.; Saha, S.K.; Siddiqui, A.R. Assessment of agricultural drought in Rajasthan (India) using remote sensing derived Vegetation Condition Index (VCI) and Standardized Precipitation Index (SPI). Egypt. J. Remote Sens. Space Sci. 2015, 18, 53–63. [Google Scholar] [CrossRef]
  4. Bhunia, P.; Das, P.; Maiti, R. Meteorological drought study through SPI in three drought prone districts of West Bengal, India. Earth Syst. Environ. 2020, 4, 43–55. [Google Scholar] [CrossRef]
  5. Ekundayo, O.Y.; Abiodun, B.J.; Kalumba, A.M. Global quantitative and qualitative assessment of drought research from 1861 to 2019. Int. J. Disaster Risk Reduct. 2022, 70, 102770. [Google Scholar] [CrossRef]
  6. Lakshmi, S.V.; Ramalakshmi, M.; Rakshith, R.K.; Christobel, M.J.; Kumar, P.P.; Priyadharshini, B.; Kumar, P.R. An integration of geospatial technology and standard precipitation index (SPI) for drought vulnerability assessment for a part of Namakkal district, South India. Mater. Today Proc. 2020, 33, 1206–1211. [Google Scholar] [CrossRef]
  7. Pai, D.S.; Sridhar, L.; Guhathakurta, P.; Hatwar, H.R. District-wide drought climatology of the southwest monsoon season over India based on standardized precipitation index (SPI). Nat. Hazards 2011, 59, 1797–1813. [Google Scholar] [CrossRef]
  8. Dhangar, N.; Vyas, S.; Guhathakurta, P.; Mukim, S.; Tidke, N.; Balasubramanian, R.; Chattopadhyay, N. Drought monitoring over India using multi-scalar standardized precipitation evapotranspiration index. Mausam 2019, 70, 833–840. [Google Scholar] [CrossRef]
  9. Halide, H.; Ridd, P. Modelling coral bleaching events using a fuzzy logic technique. In Fuzzy Logic; Physica: Heidelberg, Germany, 2002; pp. 352–362. [Google Scholar]
  10. Wong, K.W.; Wong, P.M.; Gedeon, T.D.; Fung, C.C. Rainfall prediction model using soft computing technique. Soft Comput. 2003, 7, 434–438. [Google Scholar] [CrossRef]
  11. Karamouz, M.; Kerachian, R.; Zahraie, B. Monthly water resources and irrigation planning: Case study of conjunctive use of surface and groundwater resources. J. Irrig. Drain. Eng. 2004, 130, 391–402. [Google Scholar] [CrossRef]
  12. Annas, S.; Kanai, T.; Koyama, S. Neuro-fuzzy approaches for modeling the wet season tropical rainfall. Agric. Inf. Res. 2006, 15, 331–341. [Google Scholar] [CrossRef]
  13. Subramanian, C.; Manry, M.T.; Naccarino, J. Reservoir inflow forecasting using neural networks. In Proceedings of the American Power Conference, Chicago, IL, USA, 6–8 April 1999; Volume 61, pp. 220–225. Available online: https://www.researchgate.net/profile/Michael-Manry/publication/2311940_Reservoir_Inflow_Forecasting_Using_Neural_Networks/links/0912f50bfb6f172b7b000000/Reservoir-Inflow-Forecasting-Using-Neural-Networks.pdf (accessed on 22 March 2023).
  14. Palmer, W.C. Meteorological Drought; US Department of Commerce, Weather Bureau: Washington, DC, USA, 1965; Volume 30.
  15. St George, S.; Meko, D.M.; Cook, E.R. The seasonality of precipitation signals embedded within the North American Drought Atlas. Holocene 2010, 20, 983–988. [Google Scholar] [CrossRef]
  16. Shewale, M.P.; Kumar, S. Climatological features of drought incidences in India. In Meteorological Monograph (Climatology 21/2005); National Climate Centre, Indian Meteorological Department: Delhi, India, 2005. [Google Scholar]
  17. Ravikumar, G. Multi Criteria Analysis for Drought Assessment Using Remote Sensing and GIS. 2017, Anna University, India. Available online: https://shodhganga.inflibnet.ac.in/handle/10603/10086 (accessed on 23 March 2023).
  18. Ray, K.S.; Shewale, M.P. Probability of occurrence of drought in various sub-divisions of India. Mausam 2001, 52, 541–546. [Google Scholar] [CrossRef]
  19. Herbst, P.H.; Bredenkamp, D.; Barker, H.M.G. A technique for the evaluation of drought from rainfall data. J. Hydrol. 1966, 4, 264–272. [Google Scholar] [CrossRef]
  20. Chow, V.T. Handbook of Applied Hydrology; McGraw Hill: New York, NY, USA, 1959. [Google Scholar]
  21. Mohan, S.; Rangacharya, N.C.V. A modified method for drought identification. Hydrol. Sci. J. 1991, 36, 11–21. [Google Scholar] [CrossRef]
  22. Yevjevich, V.M. Objective Approach to Definitions and Investigations of Continental Hydrologic Droughts. Doctoral Dissertation, Colorado State University, Fort Collins, CO, USA, 1967. [Google Scholar]
  23. Beersma, J.J.; Buishand, T.A. Drought in The Netherlands—Regional frequency analysis versus time series simulation. J. Hydrol. 2007, 347, 332–346. [Google Scholar] [CrossRef]
  24. Pongracz, R.; Bogardi, I.; Duckstein, L. Application of fuzzy rule-based modeling technique to regional drought. J. Hydrol. 1999, 224, 100–114. [Google Scholar] [CrossRef]
  25. Ross, T.J. Fuzzy Logic with Engineering Applications; John Wiley & Sons: Hoboken, NJ, USA, 2005. [Google Scholar]
  26. Paulo, A.A.; Ferreira, E.; Coelho, C.; Pereira, L.S. Drought class transition analysis through Markov and Loglinear models, an approach to early warning. Agric. Water Manag. 2005, 77, 59–81. [Google Scholar] [CrossRef]
  27. McKee, T.B.; Doesken, N.J.; Kleist, J. The relationship of drought frequency and duration to time scales. In Proceedings of the 8th Conference on Applied Climatology, Anaheim, CA, USA, 17–22 January 1993; Volume 17, pp. 179–183. [Google Scholar]
  28. Rouault, M.; Richard, Y. Intensity and spatial extension of drought in South Africa at different time scales. Water SA 2003, 29, 489–500. [Google Scholar] [CrossRef]
  29. Wu, H.; Hayes, M.J.; Wilhite, D.A.; Svoboda, M.D. The effect of the length of record on the standardized precipitation index calculation. Int. J. Climatol. J. R. Meteorol. Soc. 2005, 25, 505–520. [Google Scholar] [CrossRef]
Figure 1. Thamiravaruni River basin map.
Urbansci 07 00088 g001
Figure 2. Drought severities in the Thamiravaruni basin.
Urbansci 07 00088 g002
Figure 3. Drought severity in the Thamiravaruni basin (block-wise).
Urbansci 07 00088 g003
Figure 4. Meteorological drought risk map of the Thamiravaruni basin.
Urbansci 07 00088 g004
Figure 5. Evolution of SPI for an annual time scale for different locations in the Thamiravaruni River Basin. (a) Ambasamudram (b) Ayikudi (c) Cheranmadevi (d) Dam Camp (e) Gadana Dam (f) Kannadian Anicut (g) Kayattar (h) Kovilpatti (i) Manimuttar (j) Nanguneri (k) Ottappidaram (l) Palayankottai (m) Papanasam (n) Radhapuram (o) Sankarankovil (p) Sattankulam (q) Senkottai (r) Sivagiri (s) Srivaikuntam (t) Tenkasi (u) Tiruchendur (v) Thirunelveli.
Urbansci 07 00088 g005aUrbansci 07 00088 g005bUrbansci 07 00088 g005c
Figure 6. RMSE values for MA (2) and AR (2).
Urbansci 07 00088 g006
Table 1. Standardized precipitation index range with different categories.
S. No.SPI ValuesDrought Category
12 and aboveExtremely wet
21.5–1.99Very wet
31.0–1.49Moderately wet
4−0.99–0.99Normal
5−1.0 to −1.49Moderately dry
6−1.5 to −1.99Severe dry
7−2.0 or lessExtreme dry
Table 2. Meteorological drought assessment in the Thamiravaruni basin using the IMD method.
Sr. NoName of StationYear Wise Drought Severity
197119721973197419751976197719781979198019811982198319841985
1SivagiriM1M0M0M2M3M1M0M1M0M0M3M3M2M0M0
2Gadana damM3M0M0M3M2M2M0M1M0M2M1M1M1M0M0
3Kannadian anicutM0M1M0M2M2M1M0M0M0M1M1M1M2M0M1
4PapanasamM3M3M3M3M3M3M3M3M3M1M1M1M1M0M1
5Dam CampM3M3M3M3M3M3M3M3M3M0M0M1M0M0M0
6AmbasamudramM1M2M0M2M3M2M0M0M0M2M1M3M2M0M0
7ManimuttarM0M0M0M2M2M1M0M1M0M1M1M2M2M0M2
8CheranmadeviM3M3M1M3M3M2M0M2M0M2M2M2M2M0M0
9NanguneriM0M0M0M2M2M1M0M0M0M1M2M1M2M0M2
10RadhapuramM0M2M0M3M2M1M0M0M0M0M2M3M2M1M2
11Nilaparai M0M1M1M2M0M0M0M1M0M0M0
12ThirunelveliM0M0M0M0M3M1M1M2M0M3M2M1M2M0M0
13PalayankottaiM0M0M0M3M3M0M0M1M0M0M1M1M2M0M0
14SenkottaiM2M2M0M0M0M2M0M1M0M2M1M2M2M0M1
15TenkasiM0M0M0M1M1M2M0M0M0M1M2M0M1M0M1
16Karuppanadhi anicut M0M0M0M0M2M0M2M1M1
17AyikudiM1M0M0M2M1M1M0M0M0M1M2M0M0M0M0
18KadauanallurM0M0M0M3M3M2M0M0M0M0M2M0M2M2M1
19SankarankovilM0M0M0M2M3M0M0M2M0M0M1M0M1M1M2
20KovilpattiM0M0M0M3M1M1M0M1M0M2M2M1M0M0M1
21KayattarM1M2M0M1M1M3M2M1M1M3M1M3M3M3M2
22OtappidaramM0M0M0M3M2M1M0M2M0M1M1M2M0M0M1
23ThoothukudiM0M0M0M3M3M0M0M0M0M1M2M0M1M0M0
24SrivaikuntamM0M0M1M3M2M0M0M0M0M0M0M1M2M0M0
25SanttankulamM0M0M0M3M3M1M0M0M0M1M2M1M2M0M0
26TiruchendurM0M0M0M2M2M1M0M0M1M1M1M0M3M0M0
Table 3. Drought severity classification for the Tamiravaruni Basin based on the MDRI.
S. No.RangeDrought Severity
11.0–1.41Very mild
21.41–1.82Mild
31.82–2.23Moderate
42.23–2.64Severe
Disclaimer/Publisher’s Note: The statements, opinions and data contained in all publications are solely those of the individual author(s) and contributor(s) and not of MDPI and/or the editor(s). MDPI and/or the editor(s) disclaim responsibility for any injury to people or property resulting from any ideas, methods, instructions or products referred to in the content.

