Article

Identification of Critical Locations for Improvement of Air Quality Developing a Prioritized Clean Air Assessment Tool (PCAT)

1
Department of Civil Engineering, Indian Institute of Technology Kharagpur, Kharagpur 721302, India
2
Advance Technology Development Centre, Indian Institute of Technology Kharagpur, Kharagpur 721302, India
*
Author to whom correspondence should be addressed.
Urban Sci. 2023, 7(3), 75; https://doi.org/10.3390/urbansci7030075
Submission received: 20 April 2023 / Revised: 27 June 2023 / Accepted: 30 June 2023 / Published: 14 July 2023
(This article belongs to the Special Issue Urban Climate Change Management and Society)

Abstract

:
Fourteen Indian cities, including urban and rural locations, were chosen for the present study across India, with unhealthy air quality based on National Air Quality Index (NAQI > 100). However, it was found that NAQI values over the locations are driven by the undifferentiated mass concentration of particulate matter (PM, both PM 10  and PM 2.5 ) than other criteria pollutants. The PM 2.5  and PM 10  concentration during the winter violated the National Ambient Air Quality Standards (NAAQS) of India by two to five times at six urban locations, with the mean daily PM 2.5  concentration averaged over the month; the the largest being at Patna (353 µg m 3 ) during the winter and lowest at Bengaluru (27 µg m 3 ) during the summer. The analysis of chemical species, in general, indicated NO 2  (SO 2 , CO) as having a 25% to 70% (16% to 50%, 16% to 85%) increase in concentration from the summer to winter, which is adequately reflected in higher fuzzy scores during the winter. Thus, to provide a realistic approach to air quality management, the present study focuses on identifying priority-based locations requiring immediate mitigation measures by developing a Prioritized Clean Air Assessment Tool (PCAT). The tool utilizes a fuzzy-based algorithm to incorporate the cumulative effect of all six criteria pollutants, taking into consideration the severity of their expected health implications. Using PCAT, Delhi and Varanasi cities are identified for prioritized mitigation considering the NAAQS of India, unlike all cities (except Bengaluru) during the winter and nine out of fourteen cities during the summer, considering the NAQI. Using more stringent WHO guideline values in PCAT, six cities out of fourteen were identified requiring immediate mitigation during the winter and summer months; locations such as Solapur and Patna are identified to need season-specific mitigation measures during the summer and winter, respectively. The tool is simplistic, user-friendly, and quickly evaluates multiple locations simultaneously to provide priority sites.

1. Introduction

Air pollution in the 21st century is largely contributed to by anthropogenic activities such as industrialization, the increased number of automobiles every year, and urbanization. Significant air pollution occurs due to the presence of six criteria pollutants, namely particulate matter (PM 10  and PM 2.5 ), sulfur dioxide (SO 2 ), carbon monoxide (CO), nitrogen dioxide (NO 2 ) and ground-level ozone (O 3 ), classified by the United States Environmental Protection Agency (USEPA) [1]. However, in recent studies, other emerging pollutants have also been found to play an important role [2,3]. An Air Quality Index (AQI) that provides a reliable assessment and classification of air quality is essential to address the burden of the pollutants in the atmosphere and their subsequent health impacts. The indices help in a better perception of the current air pollution scenario.
The National Air Quality Index (NAQI) was developed by the Central Pollution Control Board (CPCB) of India in 2014 to disseminate information on air quality in an easily understandable form for the general public [4]. NAQI is frequently used for the mass sensitization of poor air. It considers six major air pollutants, namely, SO 2 , NO 2 , CO, PM 10 , PM 2.5  and O 3  for calculation of the index value. The NAQI method works on maximum operator function, is simplistic and fast, and thus can be used as a quick analysis tool for classifying cities with high pollution. Although the method is quick, it does not account for the combined effect of multiple pollutants, and any other recently emerged pollutants. It is for this reason that researchers across the globe developed multiple other indices to account for the combined effect of pollutants in the atmosphere [5,6,7,8].
Fuzzy-based air quality index, an analytical method first developed by Zadeh et al. [9], became suitable for subjective environmental conditions where conventional methods fail to classify air quality sensitively. The fuzzy synthetic evaluation has been utilized in the past for developing new indices, considering only criteria pollutants [10,11,12,13] or taking into account the emerging pollutants [14]. However, such air quality assessment measures are yet to be evaluated comprehensively for complex environments such as the Indian region, where pollutants from anthropogenic and natural sources with tropical climatic conditions are prevalent across the country.
The country has a particularly high level of PM pollution [15,16,17], but the impact caused by the undifferentiated PM mass is yet to be comprehended. The PM over the Indian region is composed of chemical components varying in physicochemical properties. Furthermore, the physicochemical properties are dependent on meteorological conditions, and regionally and seasonally changing emission sources. The emission sources include contributions from both the regional and long-range transport of pollutants. Though the potential of PM components (nitrate, sulphate, and organics, among various others) in causing health risks is still to be adequately understood, it is suggested that the PM components may not be equally important in causing adverse health effects [18,19]. The PM components originating from combustion sources are considered to be potentially associated with higher health risks than by the crustal material, e.g., mineral dust [20]. When considering PM mass as the driving factor to describe air quality, there is a possibility that locations having similar PM mass concentrations are placed in the same category of an air quality descriptor (severe, very poor, poor, moderately polluted, satisfactory, and good), irrespective of the significant concentration of other criteria pollutants anticipated having potential health impacts. In comparison with PM 2.5 , ground-level ozone has adverse health effects, and the mortality rate due to O 3  is twice of PM 2.5 , considering only the respiratory mortality (not counting the mortality due to lung cancer, cardiopulmonary disease, and others) [21]. Hence, it is essential to include the impact of all pollutants while estimating an air quality index. The negligence of pollutants of lower concentration but with higher health impact results in eclipsicity in the region’s air quality. When ambiguous, the index may raise a false alarm for a less polluted region to be highly polluted. In contrast, an eclipsed index may state a highly polluted region to be safe [8].
Apart from the distinctive effect of different criteria pollutants, there may exist a cumulative effect if a particular environmental condition exists. For instance, a pollutant may remain individually insignificant but cumulatively significant, as in the case of SO 2  in the presence of particulate matter alongside the required relative humidity [22]. Thus, for complex environments, such as that over the Indian region with a tropical climate and highly polluted urban atmosphere with a mixture of pollutants from different sources, it becomes crucial to take into account the combined effect of multi-pollutants. The single index value as obtained from MPI after aggregating multiple pollutant characteristics helps in the evaluation of the adversity of the air pollution impact in the atmosphere. Hence, the objectives of the present study are to (i) assess the air quality over India by comparing it with permissible limit values considering the National Ambient Air Quality Standards (NAAQS) and World Health Organisation (WHO) guidelines, (ii) elucidate the pollution trend at selected monitoring stations and the distribution of chemical species during the winter and summer season using the concentration of six criteria pollutants, (iii) development of a Prioritized Clean Air Assessment Tool (PCAT) based on a fuzzy algorithm coupled with an Analytical Hierarchy Process (AHP), and (iv) examine the application of PCAT towards identifying prioritized locations that need immediate air pollution control measures.

2. Methodology

In the present study, six criteria air pollutants (PM 10 , PM 2.5 , CO, SO 2 , NO 2 , and O 3 ) measured across 14 cities in India (refer to Table S1 in the Supplementary Materials) are considered to evaluate air quality. The cities selected for the study monitored most of the criteria pollutants during the study period and are spread throughout the geographical expanse of India, as presented in Figure 1 and Figure 2, and are thus representative of the current pollution scenario of the country. The estimated indices (NAQI and MPI), which are discussed later in the section, are also shown in these figures. The 24-h mean (PM 10 , PM 2.5 , SO 2 , NO 2 ) and 8-h (CO and O 3 ) concentration of the criteria pollutants at locations under study are obtained from the Central Pollution Control Board (CPCB), India website (source: https://airquality.cpcb.gov.in/ccr/#/caaqm-dashboard-all/caaqm-landing; accessed on: 24 July 2022) for the winter (November 2015 to January 2016) and summer months (March 2016 to May 2016). Necessary quality checks are applied to the dataset to remove the outliers before the seasonal analysis and an estimation of the indices are made. Concentration values above the mean ± 3 σ  (3 times standard deviation) are considered as outliers.

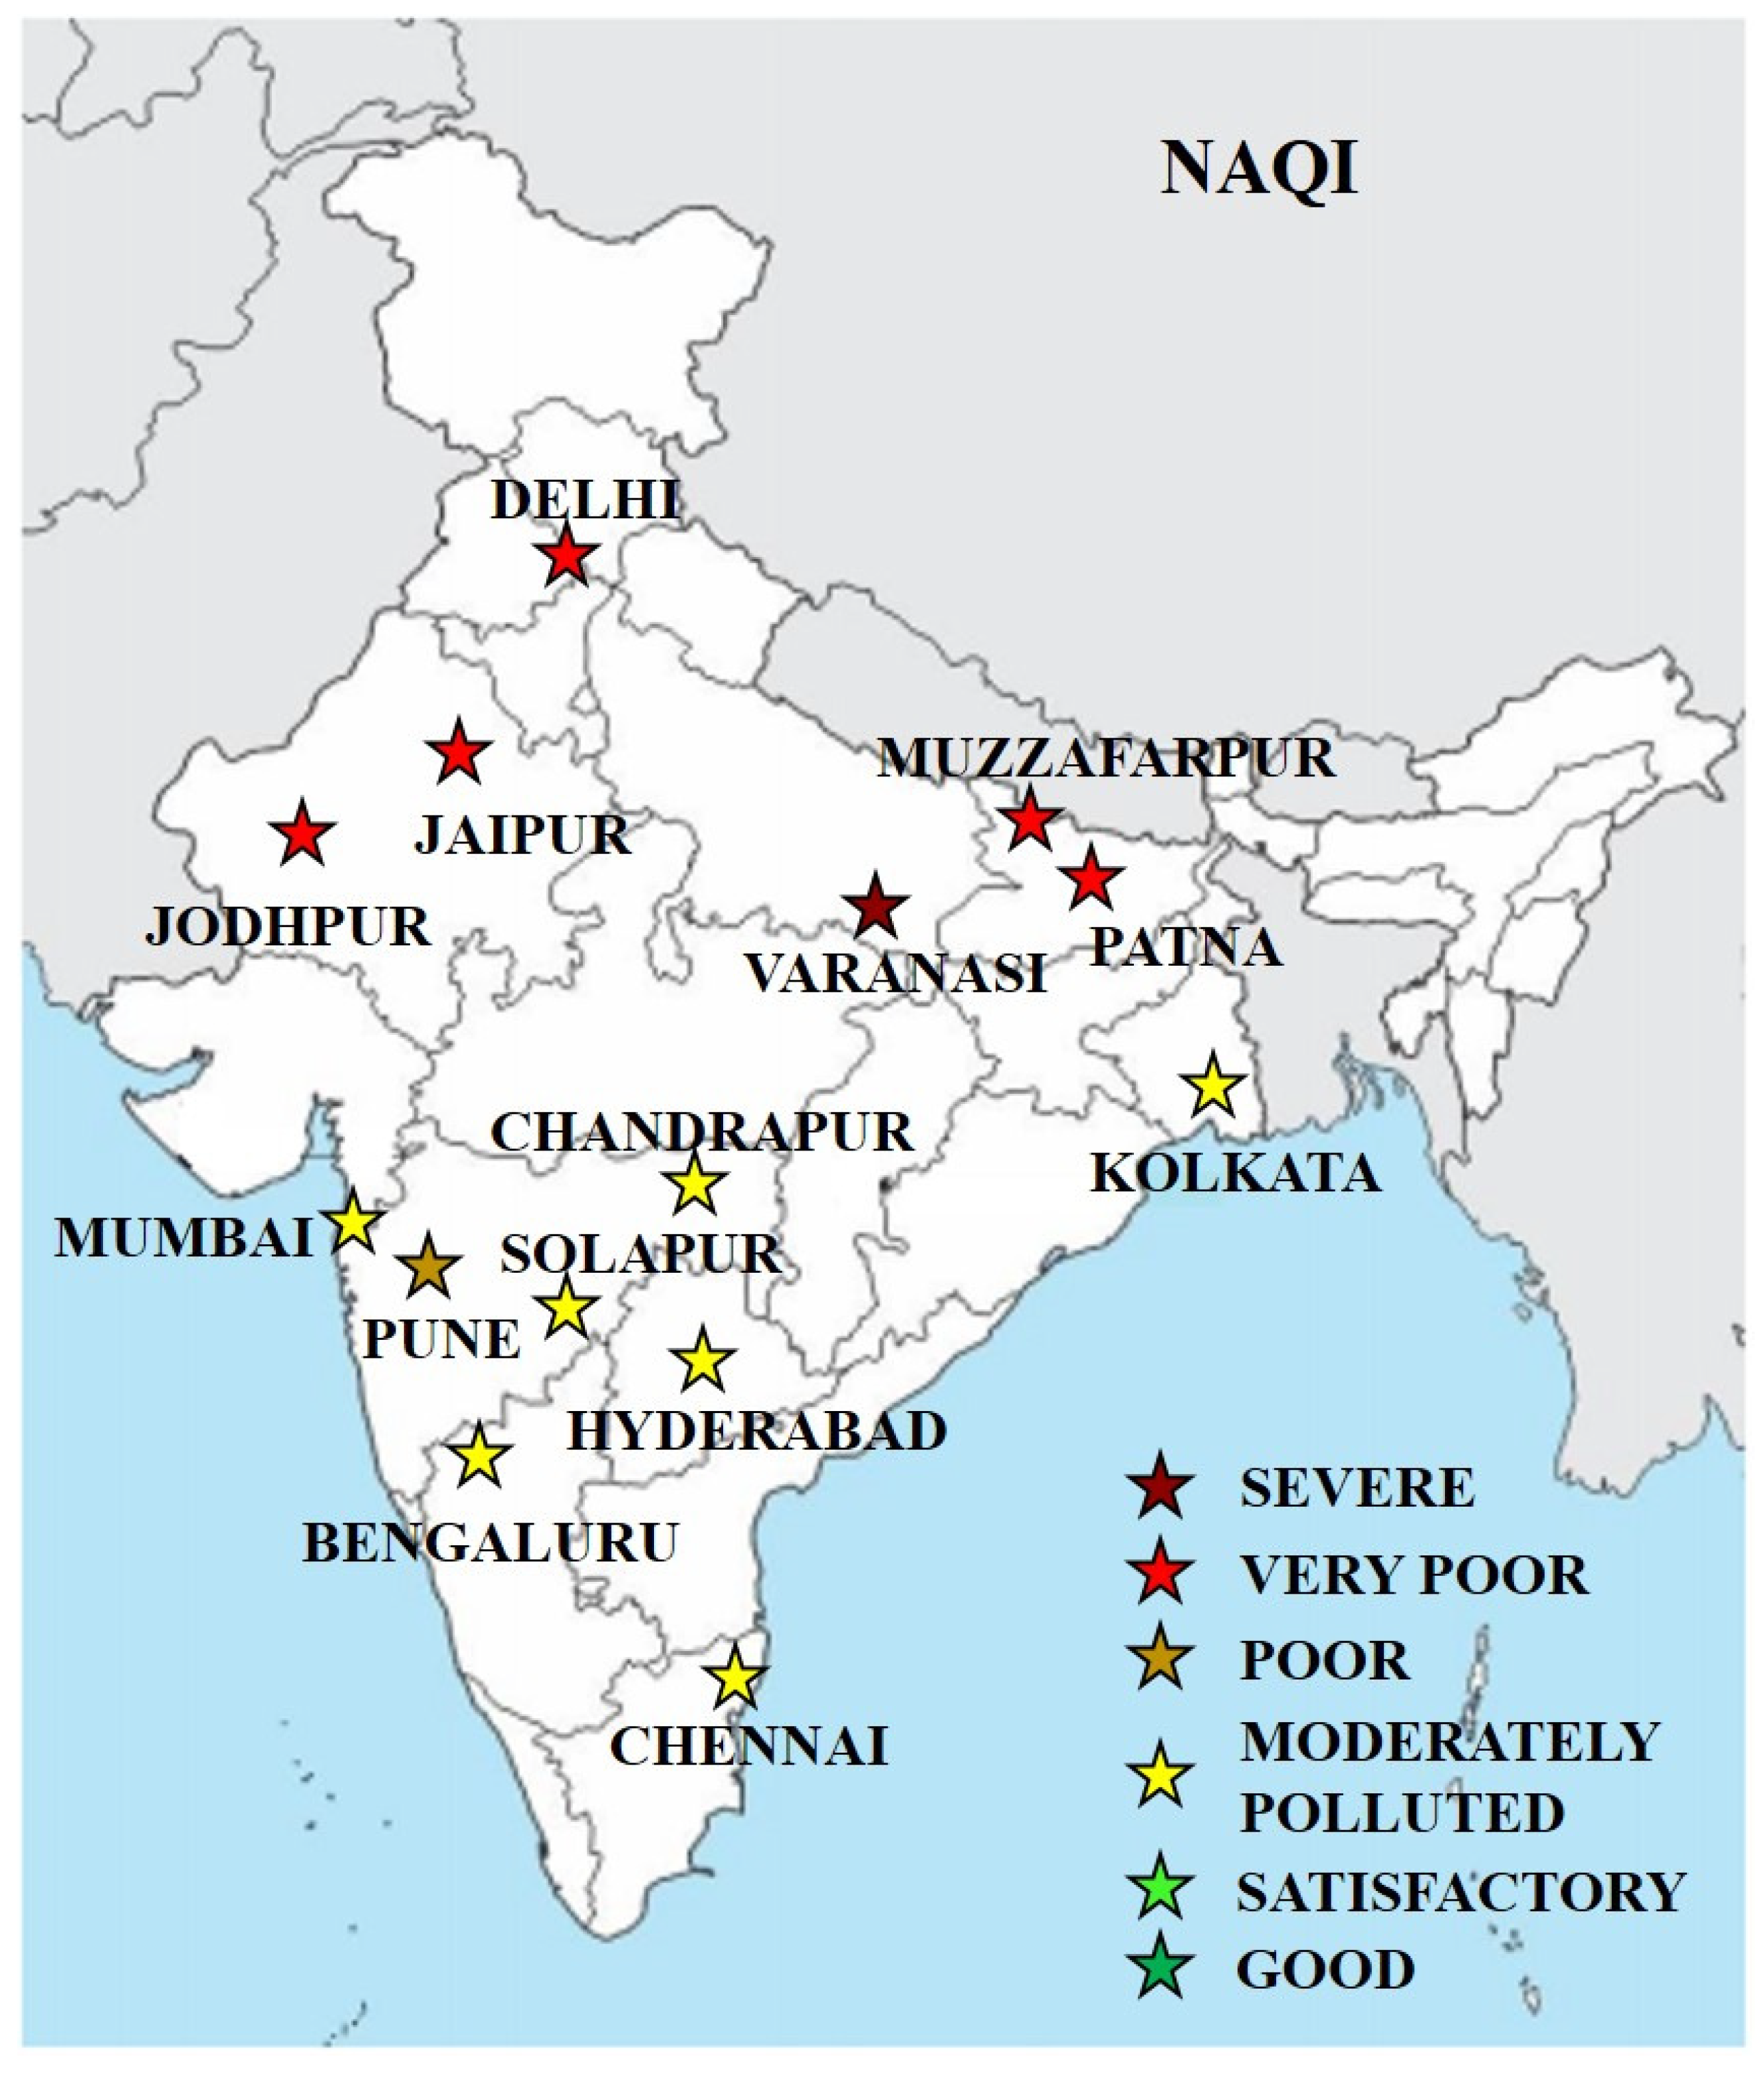
2.1. National Air Quality Index (NAQI)

The Indian National Air Quality Index (NAQI) represents the air quality of a location based on the National Ambient Air Quality Standards followed by CPCB. It includes the calculation of sub-indices on a scale of 0 to 500. These associate the actual ambient concentration of each criteria pollutant to its corresponding normalised sub-index using a linear segmentation principle.
The sub-index ( I p ) for a given pollutant concentration ( C p ) is calculated as:
I p = I H i I L o B P H i B P L o × ( C p B P L o ) + I L o
where
  • I p  = the sub-index value for Pollutant “p” (rounded to the nearest integer).
  • C p  = the actual ambient concentration of pollutant “p”.
  • B P H i  = the upper end breakpoint concentration that is greater than or equal to  C p .
  • B P L o  = the lower end breakpoint concentration that is less than or equal to  C p .
  • I L o  = the sub-index value corresponding to  B P L o .
  • I H i  = the sub-index value corresponding to  B P H i .
The sub-indices for the pollutants obtained from Equation (1) using respective breakpoint values proposed by CPCB (refer to Table S2 in the Supplementary Materials) [4] are inter-compared to identify the specific pollutant with a maximum value of a sub-index over the location. The sub-index of the corresponding criteria pollutant is used subsequently to achieve the final value of NAQI.

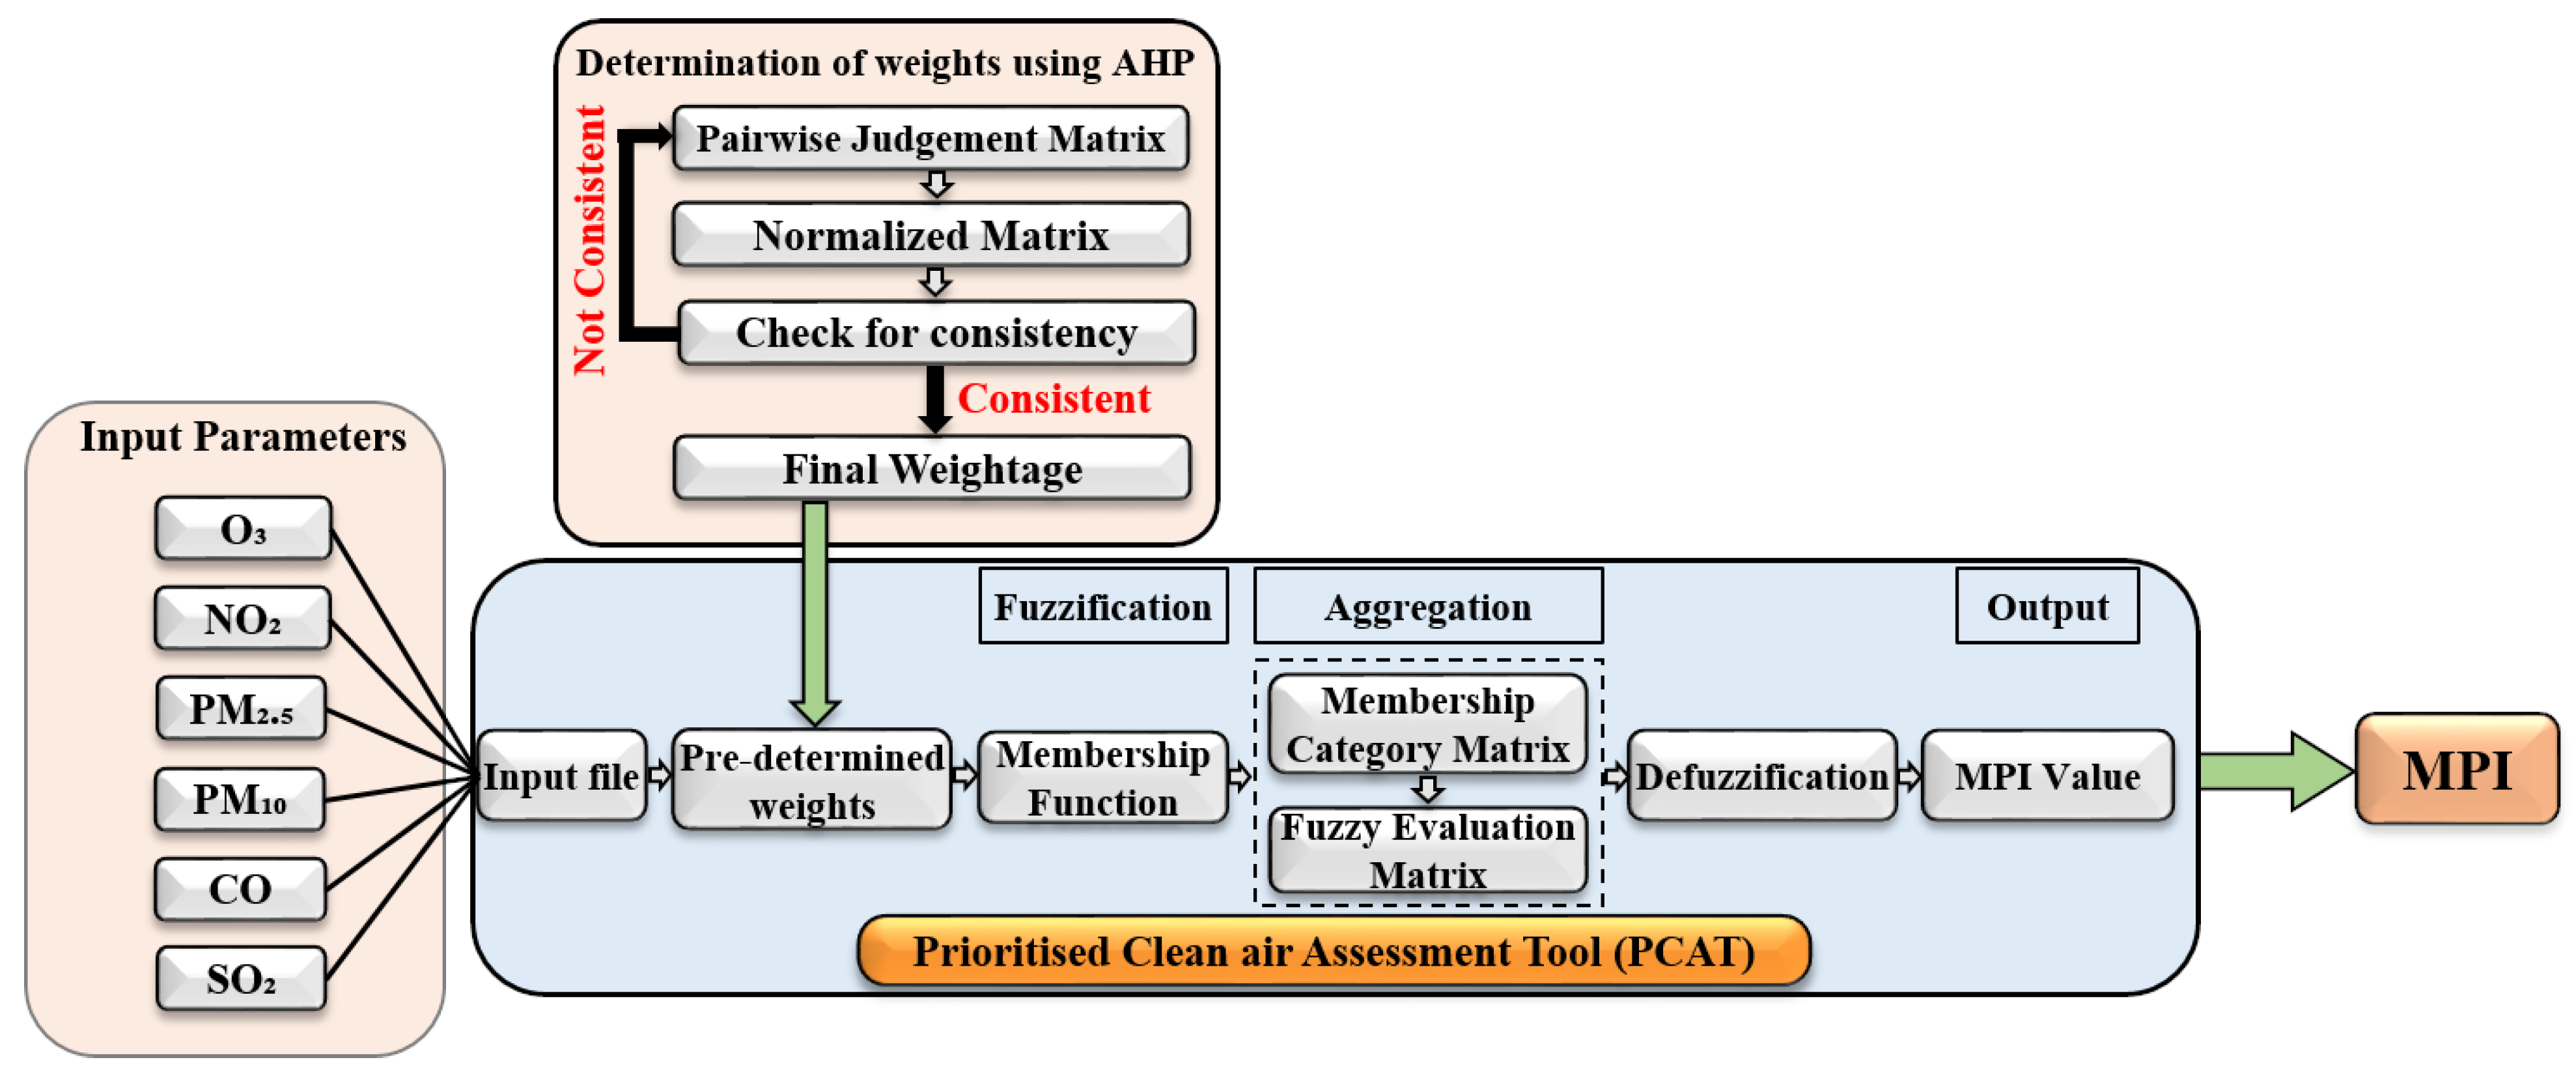
2.2. Development of Prioritized Clean Air Assessment Tool (PCAT)

To identify locations that need immediate control measures among the ones with poor air quality, a Prioritized Clean air Assessment Tool (PCAT) is developed based on the fuzzy integrated Mitigation Priority Index (MPI). The fuzzy tool is used to deal with uncertainty where the normal probability theory fails due to large computational expensiveness. The fuzzy membership function is used to include the combined effect of all the criteria pollutants that have significant health effects. A flow-sheet explaining the working of the PCAT is given in Figure 3. An input file consisting of the pollutant concentration for the required months is prepared beforehand, and relative weights that are pre-determined using Analytic Hierarchy Process (AHP) are provided for estimating the MPI values. The AHP approach takes into account the inter-judgement of the relative impact of the one pollutant with respect to another. The input file is a comma-separated values (CSV) file with a concentration of criteria pollutants in the same order as that of pre-determined weights.

2.2.1. Determination of Weights Using Analytic Hierarchy Process (AHP)

The present study describes the application of AHP for determining the relative weights of air quality parameters (PM 10 , PM 2.5 , CO, SO 2 , NO 2 , and O 3 ) and the development of a potential fuzzy membership function by deriving weights through a matrix-based technique rather than assigning them arbitrarily [23]. Each criteria pollutant has a different significance with respect to the health effects they pose and thus a different weight is attributed to each of the criteria pollutants. The most significant pollutant having a maximum health impact would have the highest weightage and vice-versa.
As part of implementing the AHP method, a pair-wise judgement matrix comprising the relative importance scores based on Saaty’s scale [24] are compiled by taking unbiased inputs from a five member expert panel. The criteria and sub-criteria of the hierarchical structured model used by the panel for assigning the Saaty score for the relative importance of pollutants also included the health effects (refer to [10] for a detailed structure of obtaining AHP). The pair-wise judgement matrix  [ A ]  is shown below, where the number in the  i t h  row and  j t h  column provides the relative importance of an individual air pollutant ( P i ) as compared to  P j .
In the present study, O 3  is assigned with the highest weight due to its adverse health impact at lower concentrations [25], which is also reflected in its 8-h monitoring based on the exposure of the community to the pollutant and its short-term health effects [26,27]. NO 2  emitted from combustion-related activities such as traffic, has adverse effects on lung performance and may cause bronchitis and emphysema; excessive NO 2  exposure affects the defense mechanism, leaving the host susceptible to respiratory illness. Studies reported a 5% change in pulmonary function and increased responsiveness to bronchoconstrictors at NO 2  levels of 380–560 µg m 3  for asthmatic people [28]. Concentrations of NO 2  are often strongly correlated with those of ultrafine particles, with nitrous oxide (NO) and particulate matter being easier to measure and often used as a surrogate for the pollutant mixture as a whole [29]. Airborne particulate matter has been linked to an increasing range of adverse health effects (e.g., changes in lung function, inflammation markers) with risks to health at concentrations currently found in many cities in developed countries. The concentration of both the fine and coarse fraction are associated with daily mortality [20,30]. The fine particles impact the pulmonary region (lower respiratory system), which are known to cause long-term chronic effects [31]. CO produced by incomplete combustion can cause headache, dizziness, drowsiness, and nausea which may advance to vomiting, loss of consciousness, and collapse if prolonged or if high exposures are encountered. Based on the laboratory studies of a reduction in exercise capacity in both healthy individuals and volunteers with cardiovascular disease, it was determined that Carboxyhaemoglobin (COHb) levels should not exceed 2%. For the concentration of 10 mg m 3 , the percentage of the COHb level could be about 2% [32]. Contemplating the above health implications while taking inputs from the expert panel, the pair-wise judgement matrix [A] is formulated.
To eliminate any possible bias due to the handling of data sets collected from heterogeneous data sources, the normalization of the matrix  [ A ]  is conducted using the columnar sum as the normalization factor. The respective normalized matrix is thus obtained is represented by  [ N ] .
[ A ] = SO 2 CO PM 10 PM 2.5 NO 2 O 3 SO 2 1 0.67 0.5 0.4 0.4 0.33 CO 1.5 1 0.67 0.5 0.5 0.33 PM 10 2 1.5 1 0.67 0.5 0.4 PM 2.5 2.5 2 1.5 1 0.67 0.5 NO 2 2.5 2 2 1.5 1 0.67 O 3 3 3 2.5 2 1.5 1
[ N ] = SO 2 CO PM 10 PM 2.5 NO 2 O 3 SO 2 0.08 0.07 0.06 0.07 0.09 0.1 CO 0.12 0.1 0.08 0.08 0.11 0.1 PM 10 0.16 0.15 0.12 0.11 0.11 0.12 PM 2.5 0.2 0.2 0.18 0.16 0.15 0.15 NO 2 0.2 0.2 0.24 0.25 0.22 0.21 O 3 0.24 0.30 0.33 0.33 0.33 0.31
The pair-wise judgement matrix used for estimating the weights in AHP is often prone to error and inconsistency due to the fuzziness in the judgement data sets of the expert responses. To avoid discrepancy in response, the consistency of the judgement matrix is measured by checking the value of the Consistency Ratio (CR) utilizing the eigenvector approach. The judgement matrix is consistent if the value of CR is found to be less than or equal to 0.1 [33]. A value of CR greater than 0.1 requires a reconsideration of the judgements. In the present study, the CR, calculated using the consistency index (0.0372) and the maximum eigen value (6.186) of the matrix, is found to be 0.03, which is well bellow the threshold value of 0.1. (Refer to Section S1.1 in Supplementary Materials to examine the consistency check in detail).
The final pairwise judgement matrix with a sufficient consistency level is considered for calculation of the weights. The eigenvalue and eigenvector analysis method for calculating the weights are adopted for the purpose. Normalized eigen vectors corresponding to the maximum eigenvalue of the matrix are considered as weights in this method. The final weightage W for the pollutants is estimated by the normalization of the maximum eigenvalue of the matrix ( λ max ).
W = SO 2 CO PM 10 PM 2.5 NO 2 O 3 0.08 0.10 0.12 0.16 0.22 0.31

2.2.2. Development of Fuzzy Membership Functions

The Fuzzy Membership Function (FMF) represents the degree of fuzziness of a fuzzy set in a graphical form. It is a necessary computational step to interpret whether the elements in fuzzy sets are discrete or continuous. In the present study, six defined terms, namely Good, Monitoring for Mitigation, Mitigation, Desired Mitigation, Urgent Mitigation and Very Urgent Mitigation are considered to include the complete NAQI spectrum (0–500) satisfactorily. The fuzzy subsets are assigned to each of the six defined terms and are expressed using triangular FMFs. The Equations of FMFs of six criteria pollutants (CO, NO 2 , PM 10 , O 3 , PM 2.5 , and SO 2 ) corresponding to the defined terms (Good, Monitoring for Mitigation, Mitigation, Desired Mitigation, Urgent Mitigation, and Very Urgent Mitigation) are described in Table S4 in the Supplementary Materials. The measured values of the pollutant concentration are converted to the membership category using the corresponding equation from the break-point concentrations, as in Table S3 for each day of the observed data.

2.2.3. Aggregation

After calculating the membership category for each of the pollutants, the membership category matrix [AG] is built, where each row denotes the severity of the health risk due to various pollutants.
[ A G ] = G ( S O 2 ) M M ( S O 2 ) M ( S O 2 ) D M ( S O 2 ) U M ( S O 2 ) V U M ( S O 2 ) G ( C O ) M M ( C O ) M ( C O ) D M ( C O ) U M ( C O ) V U M ( C O ) G ( N O 2 ) M M ( N O 2 ) M ( N O 2 ) D M ( N O 2 ) U M ( N O 2 ) V U M ( N O 2 ) G ( P M 10 ) M M ( P M 10 ) M ( P M 10 ) D M ( P M 10 ) U M ( P M 10 ) V U M ( P M 10 ) G ( P M 2.5 ) M M ( P M 2.5 ) M ( P M 2.5 ) D M ( P M 2.5 ) U M ( P M 2.5 ) V U M ( P M 2.5 ) G ( O 3 ) M M ( O 3 ) M ( O 3 ) D M ( O 3 ) U M ( O 3 ) V U M ( O 3 )
To identify various consequences of each of the alternatives on the air quality, an Ordered Weighted Product (OWP) approach is implemented for fuzzy aggregation. This determines the collective risk by taking the product of the membership value of possible combinations represented by matrix  [ A G ]  and the weightage as represented by W. The resultant fuzzy evaluation matrix [u] for the fuzzy-based Mitigation Priority Index (MPI) is defined as
[ u ] = S O 2 0.08 C O 0.10 P M 10 0.12 P M 2.5 0.16 N O 2 0.22 O 3 0.31 × G ( S O 2 ) M M ( S O 2 ) M ( S O 2 ) D M ( S O 2 ) U M ( S O 2 ) V U M ( S O 2 ) G ( C O ) M M ( C O ) M ( C O ) D M ( C O ) U M ( C O ) V U M ( C O ) G ( N O 2 ) M M ( N O 2 ) M ( N O 2 ) D M ( N O 2 ) U M ( N O 2 ) V U M ( N O 2 ) G ( P M 10 ) M M ( P M 10 ) M ( P M 10 ) D M ( P M 10 ) U M ( P M 10 ) V U M ( P M 10 ) G ( P M 2.5 ) M M ( P M 2.5 ) M ( P M 2.5 ) D M ( P M 2.5 ) U M ( P M 2.5 ) V U M ( P M 2.5 ) G ( O 3 ) M M ( O 3 ) M ( O 3 ) D M ( O 3 ) U M ( O 3 ) V U M ( O 3 )
= G M M M D M U M V U M

2.2.4. Defuzzification

A defuzzification technique is used to extract a crisp value of the fuzzy set. The scoring method is adopted in this study for defuzzification. Scores are assigned to corresponding membership values to obtain crisp output [34,35,36]. Values of the linguistic terms, namely Good (G), monitoring for mitigation (MM), mitigation (M), desired mitigation (DM), urgent mitigation (UM), and very urgent mitigation (VUM) as obtained from matrix [u] are assumed to have a set of six weights viz. 1, 2, 3, 4, 5, and 6, respectively. The final crisp non-fuzzy value obtained using Equation (2) represents the Mitigation Priority Index (MPI) for a specific day. The categories of MPI corresponding to NAQI category ranges are mentioned in Table 1.
Although subjective and widely used in numerous disciplines, the fuzzy synthetic evaluation is quite intricate to implement manually. Hence, the developed PCAT is beneficial in overcoming the complexity of calculations. It is user-friendly, easy to use, and rapidly calculates the MPI for multiple locations in a single run.
M P I = 1 × G + 2 × M M + 3 × M + 4 × D M + 5 × U M + 6 × V U M

3. Results and Discussion

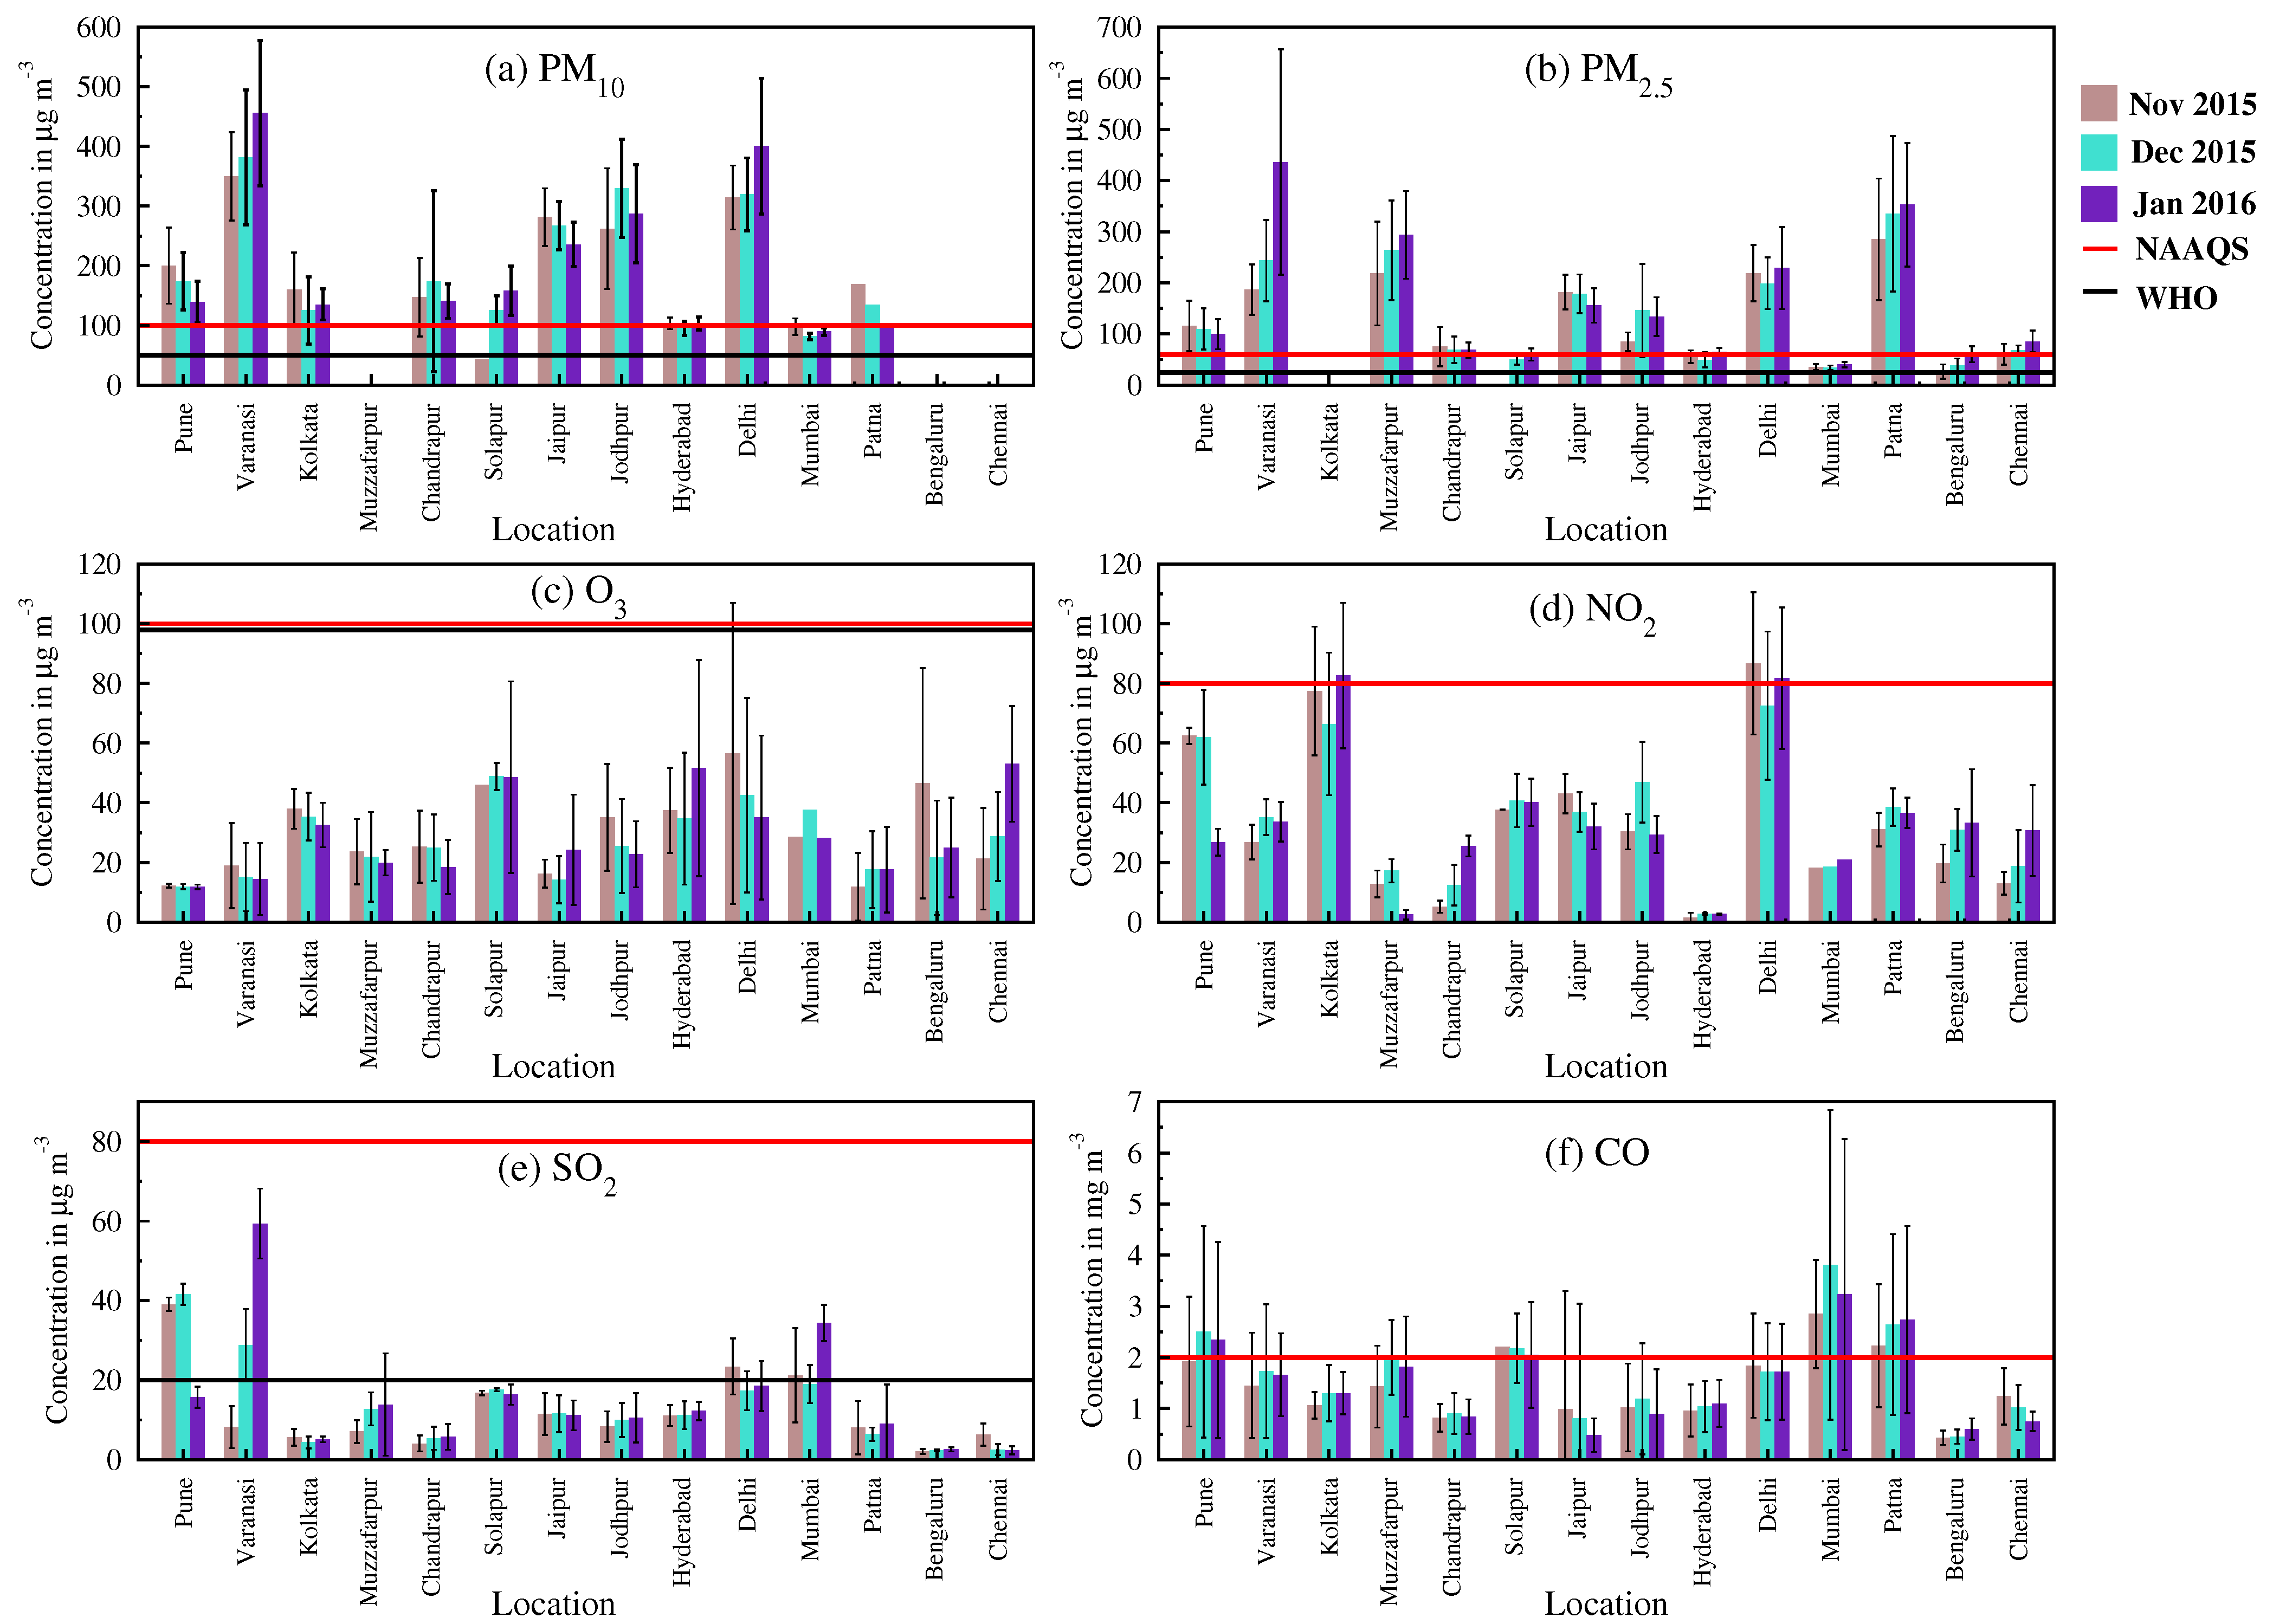
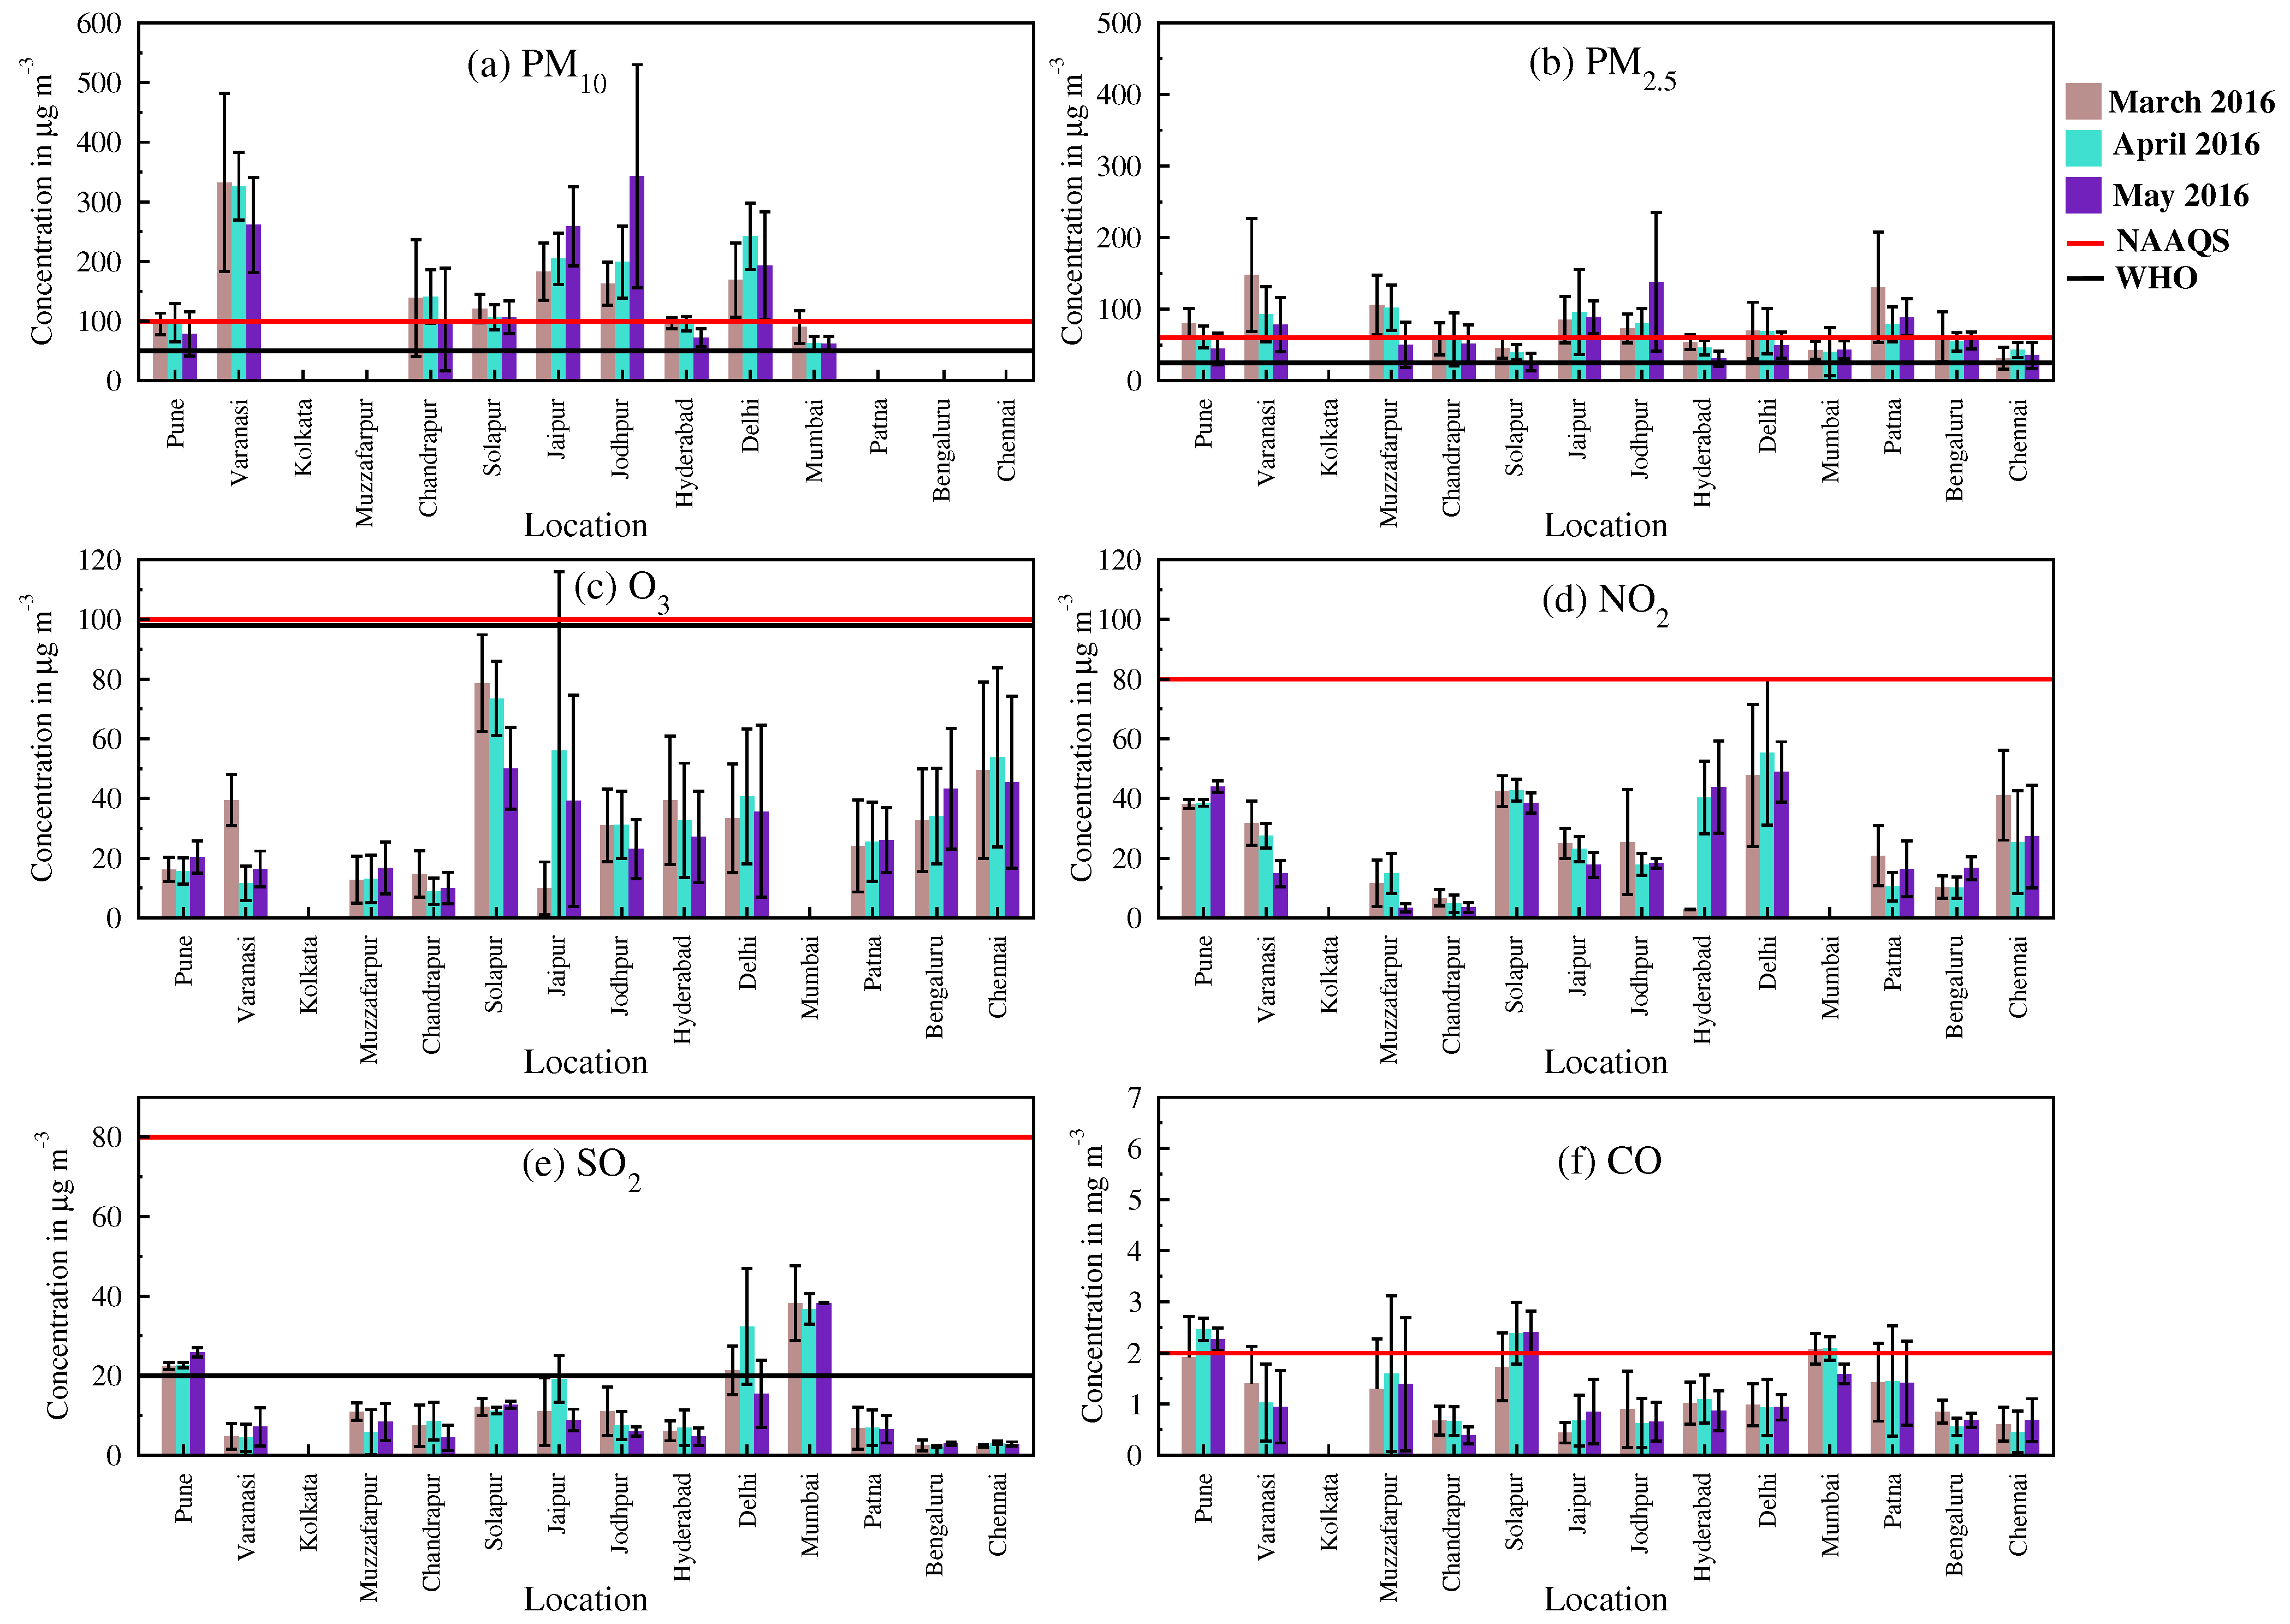
3.1. Concentration of Criteria Pollutants

The present study focused on evaluating the air quality of Indian cities using the estimated NAQI and identifying critical locations needing immediate mitigation using the developed PCAT. Along with the analysis of air quality and identification of prioritized locations, the concentration of criteria pollutants in 14 Indian cities are also discussed to understand the relative abundance of criteria pollutants in these locations. The daily mean (PM 10 , PM 2.5 , SO 2  and NO 2 ) and 8-h (CO and O 3 ) concentration of criteria pollutants averaged over each of the winter and summer months are presented in Figure 4a–f and Figure 5a–f, respectively; and compared with the 24-h national ambient air quality standards (NAAQS) [37] and WHO guideline values (24-h), below which no adverse health effects on human beings are expected [38]. Considerably high (3–4 times the NAAQS) daily mean PM 2.5  concentrations averaged over the winter and summer months (refer Table S3 in the Supplementary Materials) are observed during the study period consistent with measurement studies during the same period [15]. The daily mean concentration of the PM 10  averaged for January is found to be the highest at Varanasi (456 µg m 3 ), as it was four folds of the 24-h Indian standards and nine folds of the WHO guideline values. Although significantly high levels of PM 10  and PM 2.5  concentration are observed in the present study, a decreasing trend of PM 2.5  concentration in Indian megacities from 2014–2019 has been reported, attributed to the recent policies and regulations implemented for the abatement of air pollution [39].
The daily mean concentration of the PM 10  and PM 2.5  averaged over the winter is higher than summer by 7–47 % and 20–71%, respectively, for the locations analyzed. The Indian region experiences seasonally varying pollutant concentrations with higher values during the winter season than during the summer [40,41,42,43]. Relatively stagnant meteorological conditions during the winter season lead to a low dispersion and confinement of atmospheric pollutants within the shallow boundary layer height [44]. However, the expected increasing trend of the PM 10  and PM 2.5  concentration from March to May at Jaipur and Jodhpur is due to the increased turbulence resulting from high wind velocities during the summer season [11,14,45] and their proximity to Thar desert. The substantial convective activities due to the prevalent temperature result in the uplifting of particulate matter during the summer months [43,46]. Moreover, the analysis through NAQI demonstrated that PM 10  and PM 2.5  are descriptive pollutants in all the locations considered in the present study. The undifferentiated mass concentration of particulate matter often driving the NAQI, results in deceiving the actual pollution scenario.
The analysis of chemical species (SO 2 , NO 2 , CO, and O 3 ) demonstrated that SO 2 , NO 2  and CO are higher in the winter than summer by 16–50%, 25–70% (for 11 locations out of 14 analyzed, and 2–3 times at Patna and Chandrapur) and 16–85%, respectively. However, O 3  was higher in the summer than winter by 28–65%. It is observed from the Figure 4c and Figure 5c that the daily mean concentration of O 3  averaged over each of the winter and summer months are well within the 24-h NAAQS and WHO guideline values. Although the SO 2  concentrations are within the 24-h NAAQS, four cities in the winter (Pune, Varanasi, Delhi and Mumbai) and summer (Pune, Jaipur, Delhi and Mumbai) months are in violation of the 24-h WHO guideline values. CO followed by NO 2  contribute more to the total concentration of chemical species during the study period. In general, the ratio of NO 2  to SO 2  varies from 2 to 5 at most locations, and as high as 11 to 15 at Bengaluru and Kolkata during the study period. This indicated the higher influence of traffic sources compared to combustion and industrial sources [47].

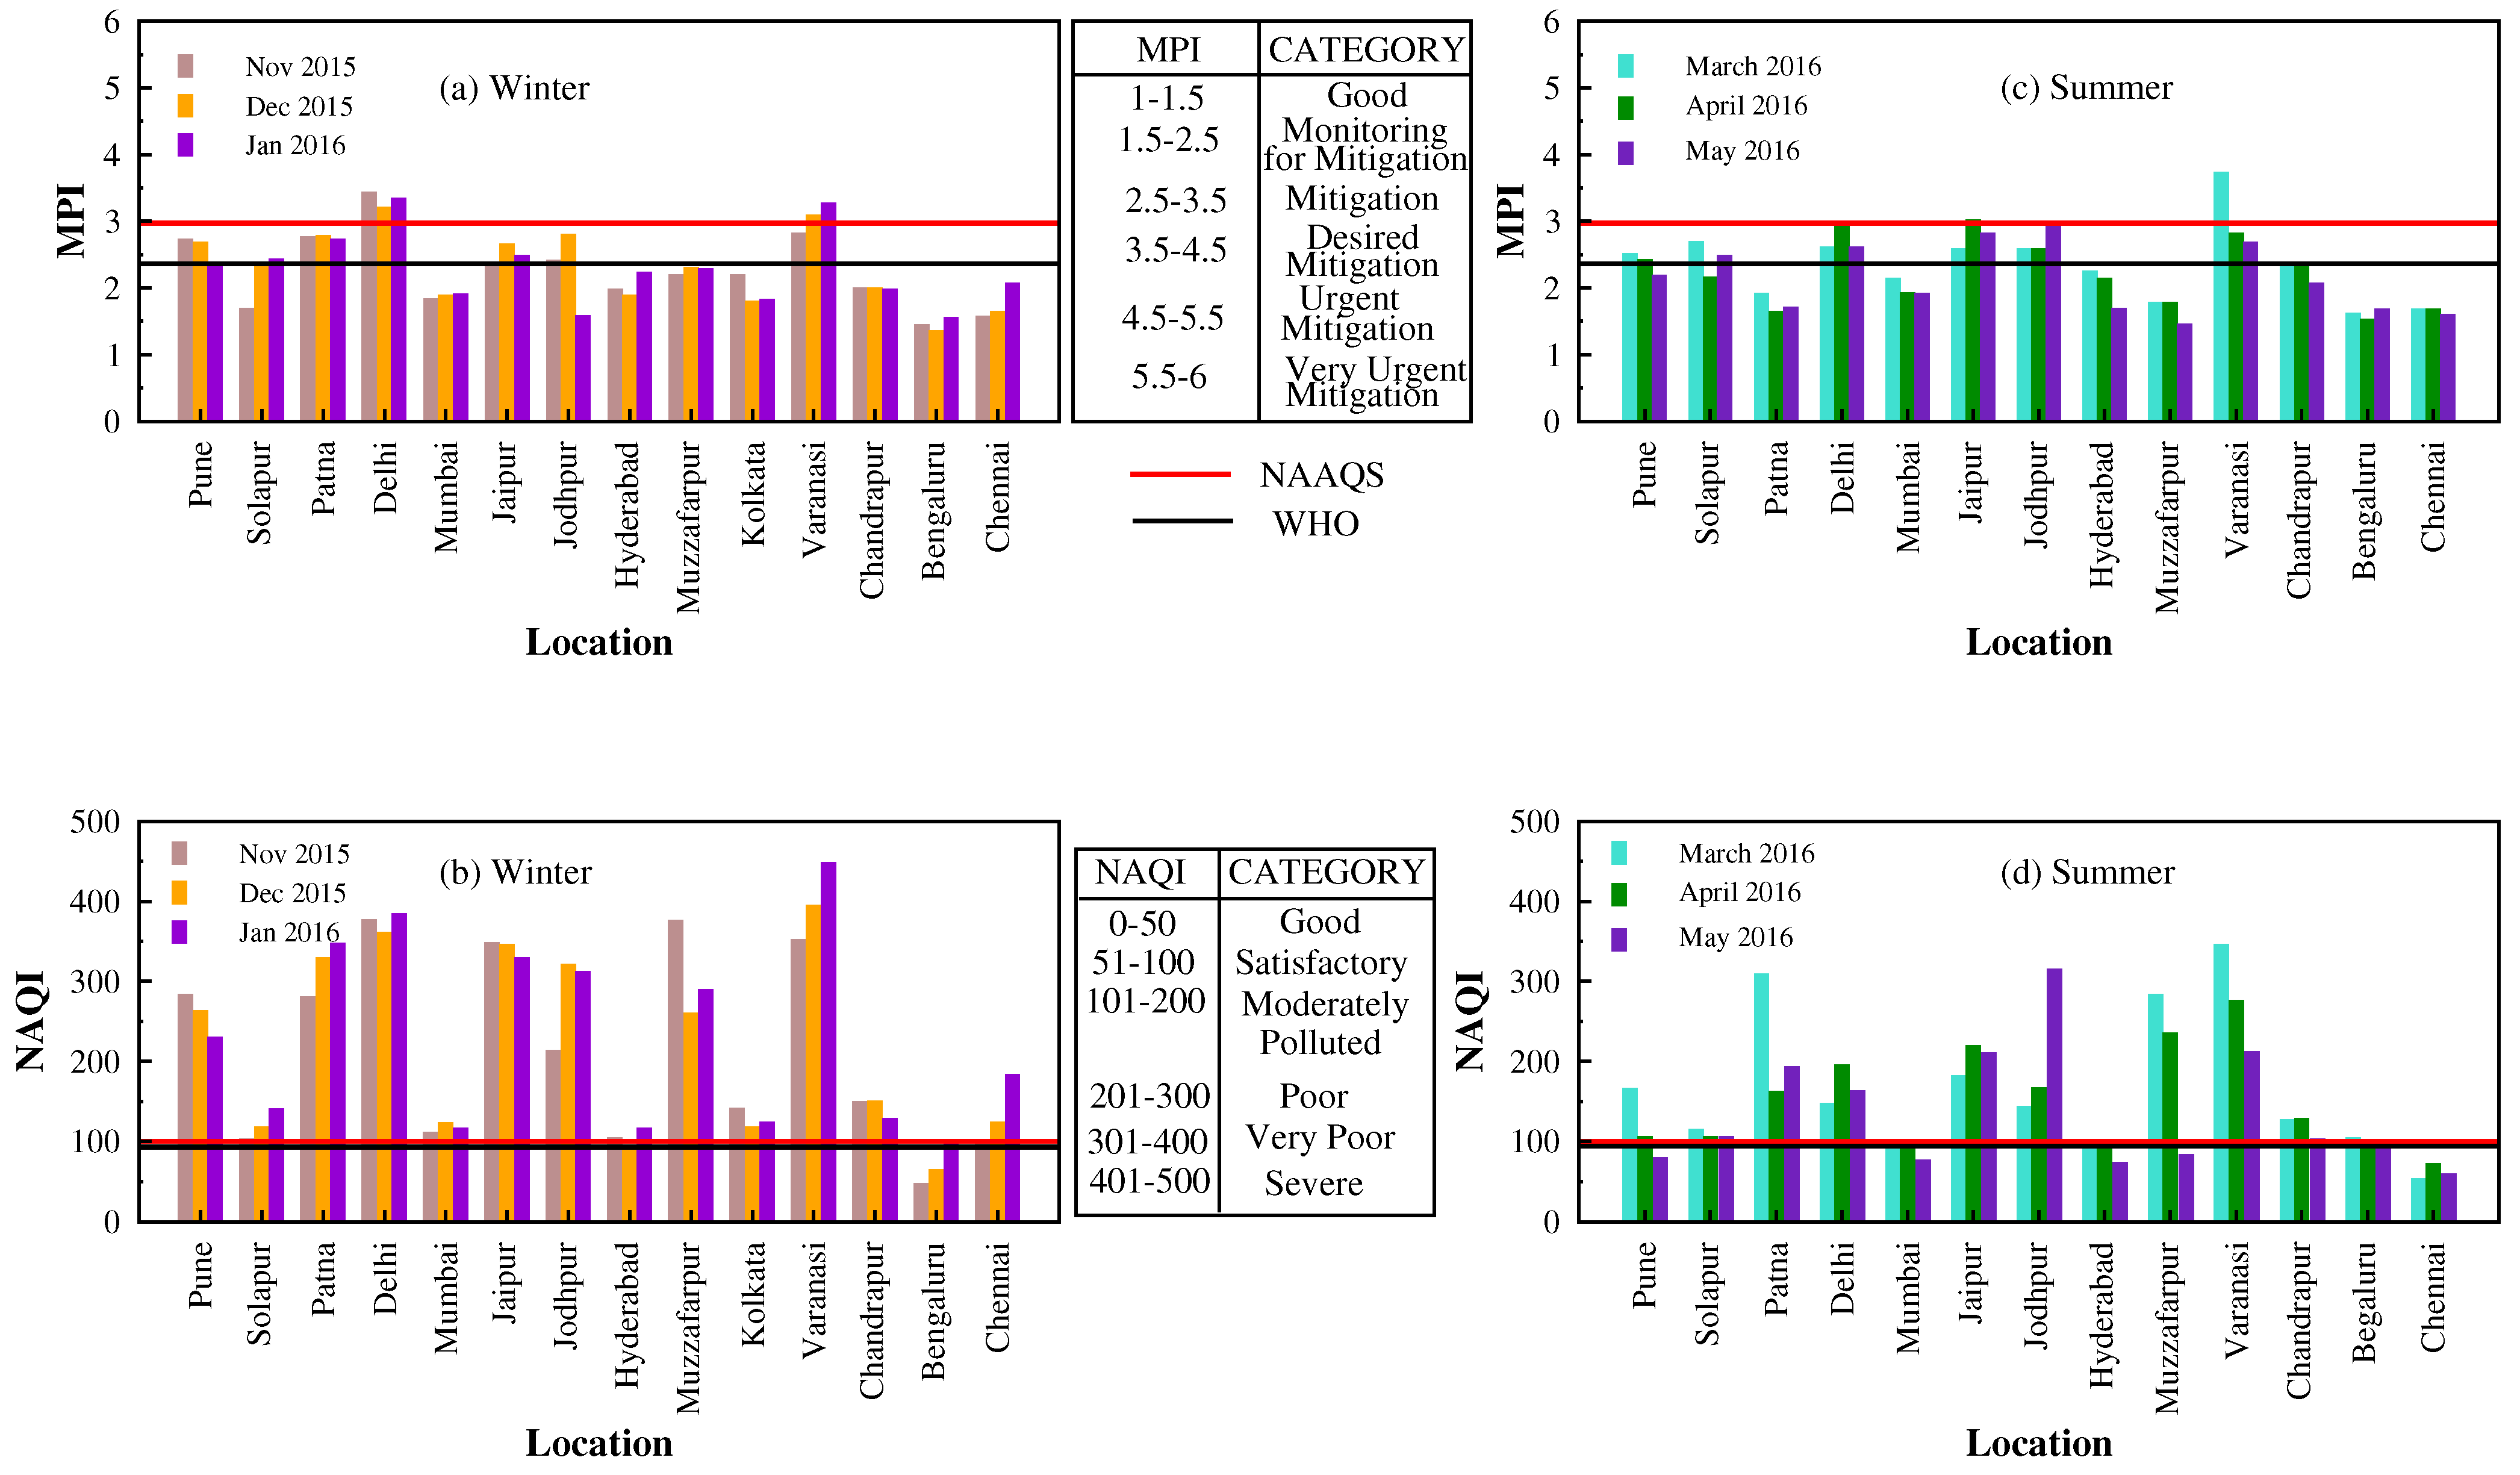
3.2. Assessment of Prioritized Air Quality Management

The estimated NAQI and PCAT obtained MPI using the breakpoint concentration of criteria pollutants, as provided by CPCB, India are given in Tables S5 and S6 in the Supplementary Materials, respectively, and represented in Figure 6. Based on the NAQI estimate, Varanasi is identified as the most polluted city followed by Delhi and Jaipur during the winter while Varanasi is followed by Patna and Jodhpur during summer seasons. High PM 2.5  concentration in Patna resulted in higher NAQI than in Delhi or Jaipur during the summer. It is observed from Figure 6 that among the locations considered, most of the cities are under unhealthy NAQI (value above 100), and the NAQI mostly ranges from being moderately polluted to very poor (NAQI between 150–400). A NAQI value above 100 can bring breathing discomfort to people with asthma, lungs, and heart diseases [4].
NAQI shows high values for all the cities, owing to the elevated concentration of one of the criteria pollutants over all others, resulting in soaring NAQI, as presented in Figure 1. A very poor (301–400) and even severe (Varanasi in January) NAQI category is observed over six of the urban locations during winter months, which may cause respiratory illness to the people from prolonged exposure; the effect may be more pronounced in people with lung and heart diseases [4]. However, the air quality remained in the moderately polluted category for most of the locations considered in the present study during the summer months except at Patna (March), Jodhpur (May), and Varanasi (March). An evaluation of NAQI and MPI is presented in Table S7 in the Supplementary Materials along with the descriptive pollutants identified from the NAQI calculation for each location under study. From the table, it is clear that NAQI is calculated based on either the PM 10  or PM 2.5  concentration for 11 stations out of 14 stations considered (refer to Table S6 in the supplementary file). The consideration of the pollutant with the highest sub-index as a descriptor pollutant, mostly being PM 10  or PM 2.5 , places the cities with high dust such as Jodhpur in the same NAQI category as that of megacities such as Delhi and Kolkata, which are known for their overall elevated ambient atmospheric pollutant levels. From Figure 4 and Figure 5, it is observed that the concentration of all six criteria pollutants is higher in Delhi than in Jodhpur during the winter. Interestingly, during the summer, the concentration of gaseous pollutants (SO 2 , NO 2 , CO, and O 3 ) in Delhi are twice of Jodhpur; however, the NAQI of Jodhpur is above Delhi, which is attributed solely to high PM 2.5  mass at Jodhpur. Delhi is among the most polluted cities in India and the world [48] and is surrounded by industries that contribute to higher levels of atmospheric pollutants along with contributions from vehicular emissions, crop burning and dust [49], whereas Jodhpur is a semi-arid location with proximity to the Thar desert in Rajasthan. The bulk PM mass assessment-based NAQI makes no distinction between places with high pollution levels resulting from local combustion sources (e.g., megacities) and those with predominant mineral dust transport over most of the Indian subcontinent.
Due to notably high PM pollution in India, almost all the cities are above the permissible limit for air quality (NAQI) and in violation of NAAQS. While NAQI helps in mass sensitization, it cannot bestow a single location to begin the mitigation plan because of India’s relatively feeble air quality scenario. As a result, a tool is required to assist in the identification of polluted cities among the ones with unhealthy air quality that require immediate mitigation. The PCAT-obtained MPI identifies the city that requires the most urgent mitigation, incorporating all criteria pollutants’ cumulative effect and taking into account their anticipated health impacts. Identifying specific locations would aid in better-targeted air quality control strategies, explicitly focusing on regulations and protecting public health.
The permissible value of PCAT-estimated MPI, when calculated using NAAQS of residential areas, is 2.97, which lies in the needing mitigation category. The high value indicates a need to evaluate the standard concentration values further. However, when the same is calculated, taking into account the WHO guidelines for outdoor air quality [38], the permissible value thus obtained is 2.36, which lies in the Monitoring for the mitigation category. The lowering of the permissible MPI value along with the concentration shows the sensitivity of MPI towards the changes in concentration. The lower permissible MPI by WHO is due to the lower standard concentration limit for SO 2 , PM 10  and PM 2.5 . Moreover, WHO takes either an hourly or annual mean for NO 2  due to its chronic short-term and long-term effects on human health. In contrast, Indian standards measure it as 24 h or an annual average. While CO is not included in the list of pollutants by WHO guidelines, 2005 [38], an 8-h mean (10 mg m 3 ) is approved in the WHO guideline, 2000 [32]. Thus, to keep uniformity in judgement for NO 2  and include a value with restricting CO, Indian standard values of NO 2  (80 µg m 3 ) and CO (2 mg m 3 ) are taken into account while estimating the permissible MPI of WHO.
Table 2 shows the results of using the developed PCAT to identify cities that require immediate pollution control measures out of all the cities investigated in the study. All locations except Bengaluru are categorized as polluted during the winter when analyzed through NAQI, considering NAAQS and WHO guidelines (refer to Table 2). To plan mitigation on a seasonal basis using PCAT, Delhi and Varanasi are identified as critical locations considering NAAQS during the winter and only Varanasi during the summer. However, when more stringent WHO guideline values are adopted, six locations, namely Pune, Patna, Delhi, Jaipur, Jodhpur, and Varanasi are identified as critical during the winter along with Solapur during the summer. The recognition of locations such as Pune and Solapur for mitigation reflects the importance of the cumulative impact of all pollutants which are otherwise neglected. Pune is a major Information Technology (IT) hub along with automotive (domestic and international) manufacturing units. Several large and small scale glass, sugar, and forging industries also contribute to the growing criteria pollutant concentration at Pune [50]. The contribution of CO and NO 2  among the criteria pollutants, attributed to by sugar factories and heavy textiles industries in Solapur, led the MPI towards the mitigation category. It is worth noticing that Patna’s NAQI value in March is significantly high (308–very poor) compared to April and May, which was ascribed to the high PM 2.5  concentration (130 µg m 3 ); however, Patna is not identified as needing mitigation in March due to a lower aggregated MPI, corresponding to the overall criteria pollutant concentration. This indicates the importance as well as sensitiveness of the PCAT-obtained MPI towards each of the varying pollutant concentration values. Thus, a total of seven cities are identified that need immediate mitigation measures considering stringent WHO guidelines to regulate the feeble air quality of the region. NAQI adopts a simplistic approach to distinguish multiple cities having air pollution above the permissible limit for highly essential mass sensitization purposes. Thus, NAQI can be used as a quick method with easier calculations to estimate the air quality status of a region and hence be used by the general public. The PCAT-based MPI, on the other hand, is further suggested to be used as a tool to provide ranked locations where mitigation is required.

4. Conclusions

In the present study, the daily mean concentration of six criteria pollutants (SO 2 , CO, NO 2 , PM 10 , PM 2.5 , and O 3 ) for two consecutive seasons, winter (November 2015 to January 2016) and summer (March 2016 to May 2016), were utilized to assess the air quality of 14 locations representing the geographical expanse of the Indian region. The data were employed to develop a Prioritised Clean air Assessment Tool (PCAT) for identifying locations needing immediate pollution mitigation to control severe health impacts caused by poor air quality. The tool incorporates all criteria pollutants’ cumulative effects, taking into account their anticipated health impacts, and aids as an efficacious approach to identify locations among the polluted ones. It is essential to include each pollutant’s impact into the weighing scheme since the toxicities and impacts they have on health vary substantially.
Although spatial variability in 24-h average concentrations (SO 2 , NO 2 , PM 10 , and PM 2.5 ) and an 8-h average concentration (CO and O 3 ) was observed across the stations during the study period, it was noteworthy to mark that the daily PM 10  and PM 2.5  concentration at all sites were in violation of the 2009 NAAQS and WHO air quality guideline for PM 10  and PM 2.5 . The concentration of pollutant PM (both PM 10  and PM 2.5 ) greatly influenced the NAQI of Indian cities. The analysis of criteria pollutants indicated that the concentration of all the pollutants except O 3  during the winter was higher than that during the summer season. In general, the percentage increase in the concentration of NO 2  from the summer to winter at a few urban locations was the highest, compared to that of SO 2  and CO. Moreover, CO, followed by NO 2 , had the highest contribution towards the total concentration of chemical species during the study period. Based on the data analyzed, the mean ratio of NO 2  to SO 2  for the entire study period was found to be 2.5 ± 1.5, indicating the traffic influence in Indian cities.
Further, the air quality assessment indicated that Varanasi was the most polluted among the cities analyzed, succeeded by Delhi, as observed using NAQI estimates. Due to the notably high PM pollution in India, almost all the cities were above the permissible limit for air quality (NAQI), as well as concentration standards (NAAQS). Since NAQI was above the permissible limit for most of the sites, it was essential to develop a technique that identifies locations in need of priority-based measures of pollution control. As obtained from PCAT, Delhi and Varanasi need immediate pollution control measures, taking NAAQS considerations among the cities considered in the present study. However, taking into account WHO guidelines, the PCAT led to obtaining seven cities (Pune, Patna, Solapur, Delhi, Jaipur, Jodhpur, and Varanasi) needing prioritized air quality control measures. Thus, the tool is useful to plan priority-based strategies for immediate pollution control at critical locations, evaluating the air quality of environments such as that of the Indian region with seasonally varying pollutant concentrations, sources, and types.
To achieve a real-time analysis of air quality using all consequential pollutants by a computationally inexpensive approach, the model can also include emerging atmospheric pollutants, which have higher associated health risks and parameters (e.g., population, location, or proximity to pollution source) that may improve the overall sensitivity. The developed tool is user-friendly, easy to handle, and rapidly assesses multiple locations simultaneously to identify cities needing immediate mitigation. The assessment from this tool, when integrated with NAQI, provides an effective approach to control air quality from the perspective of potential health benefits.

Supplementary Materials

The following supporting information can be downloaded at: https://www.mdpi.com/article/10.3390/urbansci7030075/s1, Supplementary Material contains details of monitoring stations, breakpoint concentration of criteria pollutants and other statistical details of the estimated data. References [51,52] are cited in the supplementary materials.

Author Contributions

Conceptualization, S.V.; Data curation, K.D.; Formal analysis, K.D.; Methodology, K.D., S.V., S.S. and M.K.; Project administration, S.V.; Supervision, S.V.; Validation, K.D. and S.V.; Visualization, K.D., S.S. and S.V.; Writing—original draft, K.D.; Writing—review and editing, K.D and S.V. All authors have read and agreed to the published version of the manuscript.

Funding

The fellowship of K. Dubey is funded through a grant received for the project National Carbonaceous Aerosol Programme–Carbonaceous Aerosol Emissions, Source Apportionment and Climate impacts (NCAP–COALESCE) from the Ministry of Environment, Forest, and Climate Change (14/10/2014-CC (Vo.II)), Govt. of India at the Indian Institute of Technology, Kharagpur.

Data Availability Statement

The data in this study are available from the corresponding author upon request. All the ambient concentrations used in the study are publicly available at https://app.cpcbccr.com/ccr/#/caaqm-dashboard-all/caaqm-landing/data.

Acknowledgments

The authors acknowledge the use of concentration data obtained from Central Pollution Control Board, India website.

Conflicts of Interest

The authors declare no conflict of interest.

References

  1. USEPA. Criteria Air Pollutants. 2015. Available online: https://www.epa.gov/sites/production/files/2015-10/documents/ace3_criteria_air_pollutants.pdf (accessed on 10 August 2022).
  2. Chakraborty, P.; Gadhavi, H.; Prithiviraj, B.; Mukhopadhyay, M.; Khuman, S.N.; Nakamura, M.; Spak, S.N. Passive Air Sampling of PCDD/Fs, PCBs, PAEs, DEHA, and PAHs from Informal Electronic Waste Recycling and Allied Sectors in Indian Megacities. Environ. Sci. Technol. 2021, 55, 9469–9478. [Google Scholar] [CrossRef] [PubMed]
  3. Chakraborty, P.; Shappell, N.W.; Mukhopadhyay, M.; Onanong, S.; Rex, K.R.; Snow, D. Surveillance of plasticizers, bisphenol A, steroids and caffeine in surface water of River Ganga and Sundarban wetland along the Bay of Bengal: Occurrence, sources, estrogenicity screening and ecotoxicological risk assessment. Water Res. 2021, 190, 116668. [Google Scholar] [CrossRef] [PubMed]
  4. National Air Quality Index Report. Central Pollution Control Board, Ministry of Environment, Forest and Climate Change. 2014. Available online: https://app.cpcbccr.com/ccr_docs/FINAL-REPORT_AQI_.pdf (accessed on 5 August 2022).
  5. Kumar, A.; Goyal, P. Forecasting of air quality in Delhi using principal component regression technique. Atmos. Pollut. Res. 2011, 2, 436–444. [Google Scholar] [CrossRef] [Green Version]
  6. Kumar, A.; Goyal, P. Forecasting of air quality index in Delhi using neural network based on principal component analysis. Pure Appl. Geophys. 2013, 170, 711–722. [Google Scholar] [CrossRef]
  7. Abdullah, L.; Khalid, N.D. Classification of air quality using fuzzy synthetic multiplication. Environ. Monit. Assess. 2012, 184, 6957–6965. [Google Scholar] [CrossRef] [PubMed]
  8. Swamee, P.K.; Tyagi, A. Formation of an air pollution index. J. Air Waste Manag. Assoc. 1999, 49, 88–91. [Google Scholar] [CrossRef]
  9. Zadeh, L.A. Fuzzy sets. Inf. Control 1965, 8, 338–353. [Google Scholar] [CrossRef] [Green Version]
  10. Gorai, A.K.; Upadhyay, A.; Tuluri, F.; Goyal, P.; Tchounwou, P.B. An innovative approach for determination of air quality health index. Sci. Total. Environ. 2015, 533, 495–505. [Google Scholar] [CrossRef] [Green Version]
  11. Upadhyay, A.; Kanchan, P.G.; Yerramilli, A.; Gorai, A.K. Development of fuzzy pattern recognition model for air quality assessment of Howrah city. Aerosol Air Qual. Res 2014, 14, 1639–1652. [Google Scholar] [CrossRef] [Green Version]
  12. Onkal-Engin, G.; Demir, I.; Hiz, H. Assessment of urban air quality in Istanbul using fuzzy synthetic evaluation. Atmos. Environ. 2004, 38, 3809–3815. [Google Scholar] [CrossRef]
  13. Yang, Z.; Wang, J. A new air quality monitoring and early warning system: Air quality assessment and air pollutant concentration prediction. Environ. Res. 2017, 158, 105–117. [Google Scholar] [CrossRef]
  14. Sowlat, M.H.; Gharibi, H.; Yunesian, M.; Mahmoudi, M.T.; Lotfi, S. A novel, fuzzy-based air quality index (FAQI) for air quality assessment. Atmos. Environ. 2011, 45, 2050–2059. [Google Scholar] [CrossRef]
  15. Jain, S.; Sharma, S.K.; Srivastava, M.K.; Chatterjee, A.; Vijayan, N.; Tripathy, S.S.; Kumari, K.M.; Mandal, T.K.; Sharma, C. Chemical characterization, source apportionment and transport pathways of PM2.5 and PM10 over Indo Gangetic Plain of India. Urban Clim. 2021, 36, 100805. [Google Scholar] [CrossRef]
  16. Murari, V.; Singh, N.; Ranjan, R.; Singh, R.; Banerjee, T. Source apportionment and health risk assessment of airborne particulates over central Indo-Gangetic Plain. Chemosphere 2020, 257, 127145. [Google Scholar] [CrossRef] [PubMed]
  17. Yadav, R.; Korhale, N.; Anand, V.; Rathod, A.; Bano, S.; Shinde, R.; Latha, R.; Sahu, S.; Murthy, B.; Beig, G. COVID-19 lockdown and air quality of SAFAR-India metro cities. Urban Clim. 2020, 34, 100729. [Google Scholar] [CrossRef]
  18. Daellenbach, K.R.; Uzu, G.; Jiang, J.; Cassagnes, L.E.; Leni, Z.; Vlachou, A.; Stefenelli, G.; Canonaco, F.; Weber, S.; Segers, A.; et al. Sources of particulate-matter air pollution and its oxidative potential in Europe. Nature 2020, 587, 414–419. [Google Scholar] [CrossRef]
  19. WHO. WHO Global Urban Ambient Air Pollution Database. 2016. Available online: https://www.who.int/data/gho/data/themes/air-pollution/who-air-quality-database (accessed on 5 August 2022).
  20. Ostro, B.; Feng, W.Y.; Broadwin, R.; Green, S.; Lipsett, M. The effects of components of fine particulate air pollution on mortality in California: Results from CALFINE. Environ. Health Perspect. 2007, 115, 13–19. [Google Scholar] [CrossRef] [Green Version]
  21. Xue, X.; Chen, J.; Sun, B.; Zhou, B.; Li, X. Temporal trends in respiratory mortality and short-term effects of air pollutants in Shenyang, China. Environ. Sci. Pollut. Res. 2018, 25, 11468–11479. [Google Scholar] [CrossRef] [PubMed] [Green Version]
  22. Harrison, R.M.; Yin, J. Particulate matter in the atmosphere: Which particle properties are important for its effects on health? Sci. Total. Environ. 2000, 249, 85–101. [Google Scholar] [CrossRef]
  23. Fisher, B.E. Fuzzy approaches to environmental decisions: Application to air quality. Environ. Sci. Policy 2006, 9, 22–31. [Google Scholar] [CrossRef]
  24. Saaty, T.L. Decision making with the analytic hierarchy process. Int. J. Serv. Sci. 2008, 1, 83–98. [Google Scholar] [CrossRef] [Green Version]
  25. Lippmann, M. Health effects of tropospheric ozone. Environ. Sci. Technol. 1991, 25, 1954–1962. [Google Scholar] [CrossRef]
  26. Beck, J.; Krzyzanowski, M.; Koffi, B. Tropospheric Ozone in EU—The Consolidated Report; EEA Topic Report; EEA: Copenhagen, Denmark, 1998; Chapter 6. [Google Scholar]
  27. Rombout, P.J.; Lioy, P.J.; Goldstein, B.D. Rationale for an eight-hour ozone standard. J. Air Pollut. Control. Assoc. 1986, 36, 913–917. [Google Scholar] [CrossRef]
  28. Burnett, R.T.; Stieb, D.; Brook, J.R.; Cakmak, S.; Dales, R.; Raizenne, M.; Vincent, R.; Dann, T. Associations between short-term changes in nitrogen dioxide and mortality in Canadian cities. Arch. Environ. Health Int. J. 2004, 59, 228–236. [Google Scholar] [CrossRef]
  29. WHO. Air Quality Guidelines: Global Update 2005: Particulate Matter, Ozone, Nitrogen Dioxide and Sulfur Dioxide; World Health Organization: Geneva, Switzerland, 2005. [Google Scholar]
  30. Castillejos, M.; Borja-Aburto, V.H.; Dockery, D.W.; Gold, D.R.; Loomis, D. Airborne coarse particles and mortality. Inhal. Toxicol. 2000, 12, 61–72. [Google Scholar] [CrossRef]
  31. Sharma, M.; Kumar, V.N.; Katiyar, S.K.; Sharma, R.; Shukla, B.P.; Sengupta, B. Effects of particulate air pollution on the respiratory health of subjects who live in three areas in Kanpur, India. Arch. Environ. Health Int. J. 2004, 59, 348–358. [Google Scholar] [CrossRef]
  32. WHO. Air Quality Guidelines for Europe; World Health Organization: Geneva, Switzerland, 2000. [Google Scholar]
  33. Saaty, T.L. The analytic hierarchy and analytic network processes for the measurement of intangible criteria and for decision-making. In Multiple Criteria Decision Analysis: State of the Art Surveys; Springer: Berlin, Germany, 2005; pp. 345–405. [Google Scholar]
  34. Lu, R.S.; Lo, S.L.; Hu, J.Y. Analysis of reservoir water quality using fuzzy synthetic evaluation. Stoch. Environ. Res. Risk Assess. 1999, 13, 327–336. [Google Scholar] [CrossRef]
  35. Sadiq, R.; Rodriguez, M.J. Fuzzy synthetic evaluation of disinfection by-products—A risk-based indexing system. J. Environ. Manag. 2004, 73, 1–13. [Google Scholar] [CrossRef] [Green Version]
  36. Silvert, W. Fuzzy indices of environmental conditions. Ecol. Model. 2000, 130, 111–119. [Google Scholar] [CrossRef]
  37. CPCB. Delhi Ambient Air Quality Standards, India. 2009. Available online: https://cpcb.nic.in/uploads/National_Ambient_Air_Quality_Standards.pdf (accessed on 5 August 2022).
  38. Krzyzanowski, M.; Cohen, A. Update of WHO air quality guidelines. Air Qual. Atmos. Health 2008, 1, 7–13. [Google Scholar] [CrossRef] [Green Version]
  39. Singh, V.; Singh, S.; Biswal, A. Exceedances and trends of particulate matter (PM2.5) in five Indian megacities. Sci. Total. Environ. 2021, 750, 141461. [Google Scholar] [CrossRef]
  40. Gupta, A.; Karar, K.; Ayoob, S.; John, K. Spatio-temporal characteristics of gaseous and particulate pollutants in an urban region of Kolkata, India. Atmos. Res. 2008, 87, 103–115. [Google Scholar] [CrossRef]
  41. Tiwari, S.; Rai, R.; Agrawal, M. Annual and seasonal variations in tropospheric ozone concentrations around Varanasi. Int. J. Remote Sens. 2008, 29, 4499–4514. [Google Scholar] [CrossRef]
  42. Tiwari, S.; Srivastava, A.; Bisht, D.; Parmita, P.; Srivastava, M.K.; Attri, S. Diurnal and seasonal variations of black carbon and PM2.5 over New Delhi, India: Influence of meteorology. Atmos. Res. 2013, 125, 50–62. [Google Scholar] [CrossRef]
  43. Pani, S.; Verma, S. Variability of winter and summertime aerosols over eastern India urban environment. Atmos. Res. 2014, 137, 112–124. [Google Scholar] [CrossRef]
  44. Ghosh, S.; Verma, S.; Kuttippurath, J.; Menut, L. Wintertime direct radiative effects due to black carbon (BC) over the Indo-Gangetic Plain as modelled with new BC emission inventories in CHIMERE. Atmos. Chem. Phys. 2021, 21, 7671–7694. [Google Scholar] [CrossRef]
  45. Yerramsetti, V.S.; Sharma, A.R.; Navlur, N.G.; Rapolu, V.; Dhulipala, N.C.; Sinha, P. The impact assessment of Diwali fireworks emissions on the air quality of a tropical urban site, Hyderabad, India, during three consecutive years. Environ. Monit. Assess. 2013, 185, 7309–7325. [Google Scholar] [CrossRef]
  46. Verma, S.; Pani, S.; Kumar, D.B.; Faruqi, A.; Bhanja, S.; Mandal, M.; Priyadharshini, B. Aerosol extinction properties over coastal West Bengal Gangetic plain under inter-seasonal and sea breeze influenced transport processes. Atmos. Res. 2016, 167, 224–236. [Google Scholar] [CrossRef]
  47. Aneja, V.P.; Agarwal, A.; Roelle, P.A.; Phillips, S.B.; Tong, Q.; Watkins, N.; Yablonsky, R. Measurements and analysis of criteria pollutants in New Delhi, India. Environ. Int. 2001, 27, 35–42. [Google Scholar] [CrossRef]
  48. Bhowmik, H.S.; Naresh, S.; Bhattu, D.; Rastogi, N.; Prévôt, A.S.; Tripathi, S.N. Temporal and spatial variability of carbonaceous species (EC; OC; WSOC and SOA) in PM2.5 aerosol over five sites of Indo-Gangetic Plain. Atmos. Pollut. Res. 2021, 12, 375–390. [Google Scholar] [CrossRef]
  49. Jain, S.; Sharma, S.; Vijayan, N.; Mandal, T. Seasonal characteristics of aerosols (PM2.5 and PM10) and their source apportionment using PMF: A four year study over Delhi, India. Environ. Pollut. 2020, 262, 114337. [Google Scholar] [CrossRef] [PubMed]
  50. Pipal, A.S.; Tiwari, S.; Satsangi, P.G. Seasonal chemical characteristics of atmospheric aerosol particles and its light extinction coefficients over Pune, India. Aerosol Air Qual. Res. 2016, 16, 1805–1819. [Google Scholar] [CrossRef]
  51. Saaty, T.L. The Analytical Hierarchy Process, Planning, Priority. Resource Allocation; RWS Publications: Pittsburgh, PA, USA, 1980. [Google Scholar]
  52. Saaty, T.L.; Takizawa, M. Dependence and independence: From linear hierarchies to nonlinear networks. Eur. J. Oper. Res. 1986, 26, 229–237. [Google Scholar] [CrossRef]
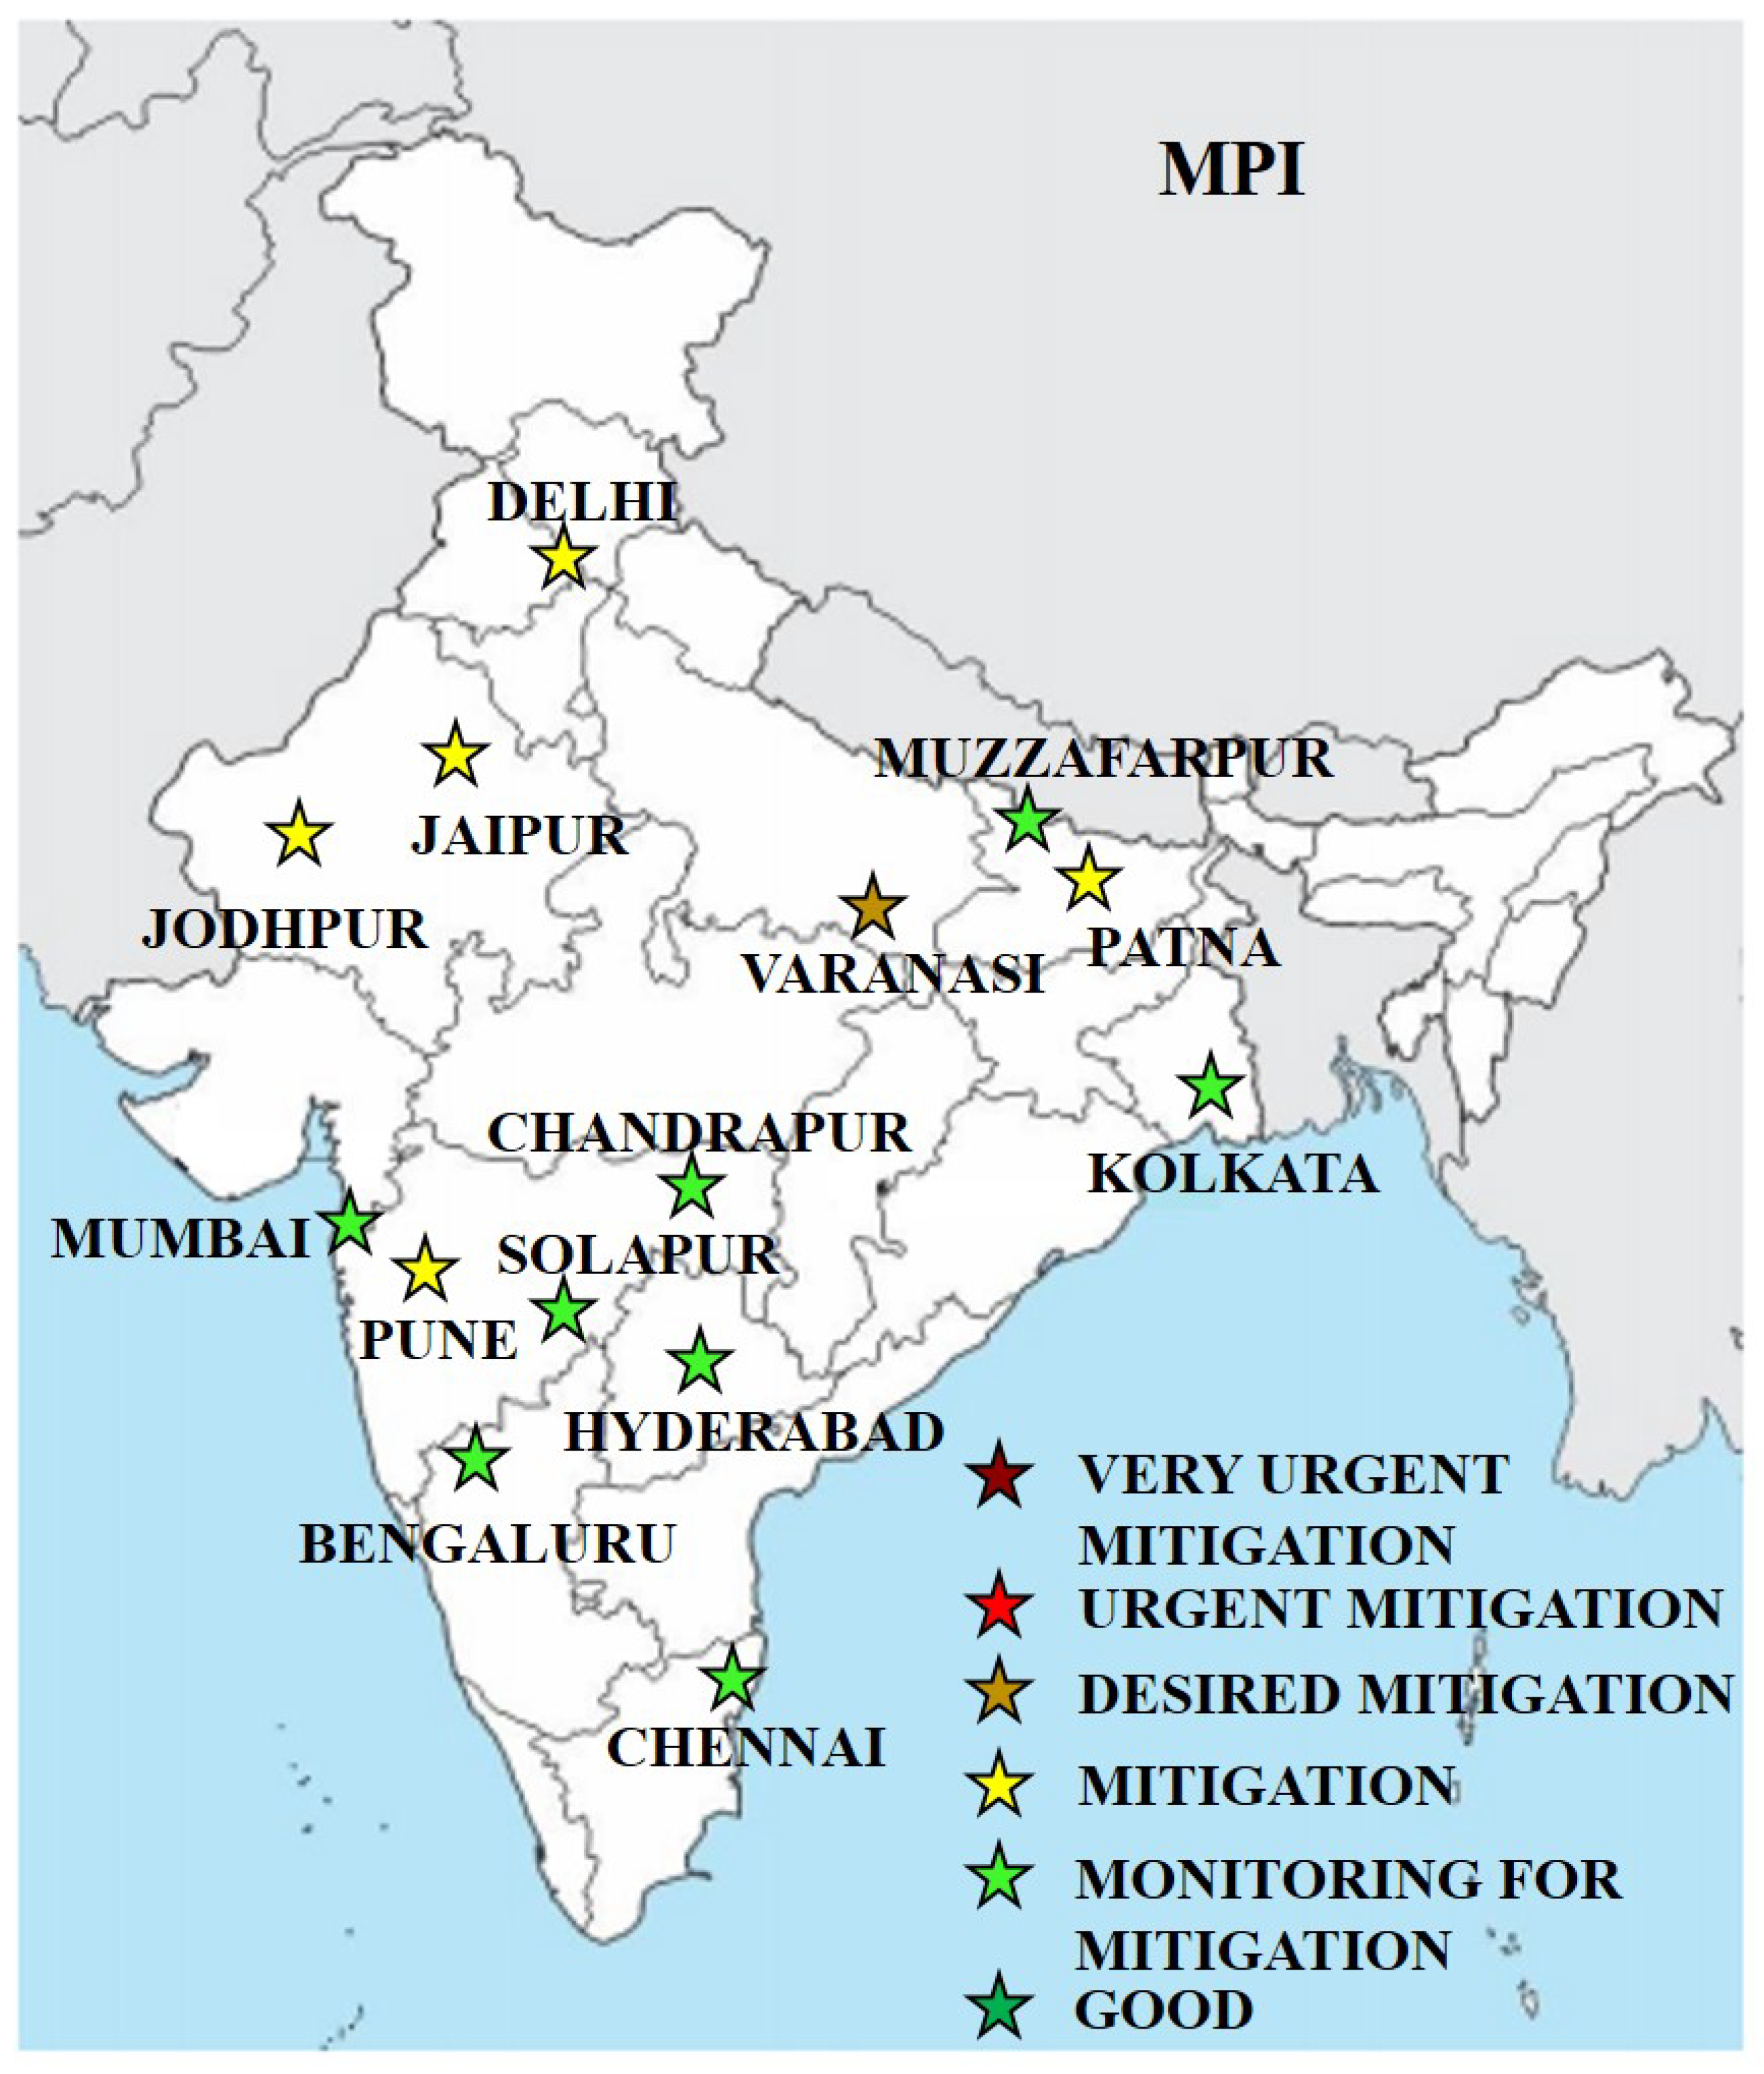
Figure 1. Estimated National Air Quality Index for the entire study period (combined summer and winter).
Urbansci 07 00075 g001
Figure 2. Estimated Mitigation Priority Index for the entire study period (combined summer and winter).
Urbansci 07 00075 g002
Figure 3. Flowchart explaining the details of steps involved in development of PCAT.
Urbansci 07 00075 g003
Figure 4. Daily mean concentration of criteria pollutants (as per air quality assessment guidelines of NAAQS and WHO) averaged over the winter months (November 2015–January 2016). The NAAQS (as twentyfour hourly mean for PM 10 , PM 2.5 , SO 2 , NO 2 , and eight hourly mean for O 3  and CO) and WHO air quality guideline values (as twentyfour hourly mean for PM 10 , PM 2.5 , SO 2  and eight hourly mean for O 3 ) are represented using red and black lines, respectively.
Urbansci 07 00075 g004
Figure 5. Daily mean concentration of criteria pollutants (as per air quality assessment guidelines of NAAQS and WHO) averaged over the winter months (March 2016–May 2016). The NAAQS (as twentyfour hourly mean for PM 10 , PM 2.5 , SO 2 , NO 2 , and eight hourly mean for O 3  and CO) and WHO air quality guideline values (as twentyfour hourly mean for PM 10 , PM 2.5 , SO 2  and eight hourly mean for O 3 ) are represented using red and black lines, respectively.
Urbansci 07 00075 g005
Figure 6. Variation of NAQI and MPI during winter and summer months. The label inside the graph provides NAQI and MPI categories according to the range it falls in. Concentration values were unavailable for Kolkata during summer.
Urbansci 07 00075 g006
Table 1. Categories of Mitigation Priority Index (MPI).
MPICategory
1–1.5Good (G)
1.5–2.5Monitoring for mitigation (MM)
2.5–3.5Mitigation (M)
3.5–4.5Desired mitigation (DM)
4.5–5.5Urgent mitigation (UM)
5.5–6Very urgent mitigation (VUM)
Table 2. Assessment of prioritized air quality management.
Standard/GuidelineSeasonsCities Exceeding Permissible NAQICities Needing Mitigation (as Obtained through PCAT)
NAAQSWinterAll cities except BengaluruDelhi and Varanasi
SummerPatna, Delhi, Pune, Chandrapur, Solapur, Jaipur, Jodhpur, Muzaffarpur, and VaranasiVaranasi
WHOWinterAll cities except BengaluruPune, Patna, Delhi, Jaipur, Jodhpur and Varanasi
SummerPatna, Delhi, Pune, Chandrapur, Solapur, Jaipur, Jodhpur, Muzaffarpur, and VaranasiDelhi, Pune, Solapur, Jaipur, Jodhpur and Varanasi
Disclaimer/Publisher’s Note: The statements, opinions and data contained in all publications are solely those of the individual author(s) and contributor(s) and not of MDPI and/or the editor(s). MDPI and/or the editor(s) disclaim responsibility for any injury to people or property resulting from any ideas, methods, instructions or products referred to in the content.

