Article

Socio-Economic Feasibility for Implementation of Environmental Legislation along the Riparian Buffer Zones in Urban Rivers of Northern Tanzania

by
Janeth Mwile Mwasenga
1,* and
Ibrahimu Chikira Mjemah
2
1
Department of Environmental Engineering and Management, College of Earth Sciences and Engineering, The University of Dodoma, Dodoma P.O. Box 11090, Tanzania
2
Department of Geography and Environmental Studies, College of Natural and Applied Sciences, Sokoine University of Agriculture, Morogoro P.O. Box 3038, Tanzania
*
Author to whom correspondence should be addressed.
Urban Sci. 2023, 7(3), 73; https://doi.org/10.3390/urbansci7030073
Submission received: 19 June 2023 / Accepted: 4 July 2023 / Published: 10 July 2023
(This article belongs to the Special Issue Urban Agenda)

Abstract

:
The development of socio-economic activities within the 60 m buffer zone has imposed change on the characteristics of rivers in northern Tanzania, subjecting rivers to collateral and irreversible damage due to their prolonged exposure to anthropic activities. Time series satellite images were classified to analyze land use/cover (LULC) changes and anthropic development along the buffer zone from 2000 to 2020. Structured questionnaires were used to identify the encroachment factors and level of compliance with alleged environmental legislation. Furthermore, focus group discussions were used to acquire information on the concurrent barriers to environmental legislation implementation. The land use/cover change along the buffer zone showed that agriculture and artificial areas had a credible increase of about 43% and 30% from 2000 to 2020, respectively. Furthermore, forest and semi-natural areas decreased by 71% from 2000 to 2020, whereas wetlands decreased by about 2% within the same timeframe. On the other hand, artificial and agricultural areas increased by 24.5% and 19.5%, respectively. Forest and semi-natural areas decreased by about 44%, whereas wetlands and water showed a flimsy increase from 2000 to 2020. This trend shows that high land use/cover changes occurred along the riparian buffer zone. The results suggest that urbanization is the main driving force for riparian buffer zone encroachment, threatening ecological well-being and water resource sustainability in urban rivers. The findings of this study are useful for advancing regional and national policies and practices for sustainable water resource management.

1. Introduction

Watersheds and rivers provide ecological features that are essential for community well-being from their hydrological services [1]. However, water resources are afflicted by the direct association between increased population and urban growth [2]. Africa is projected to have a high rate of urban residents worldwide, leaving Asia aside [3]. The high rate of increase in its urban population mirrors the demand for water for domestic, agricultural, and industrial uses, which might exceed the current supply capacity [4]. This phenomenon is expected to increase pressure on water resources, likely leading to the encroachment of riparian buffers, especially regarding urban rivers in sub-Saharan Africa.
In Tanzania, anthropic activities afflict the ecological functions of urban rivers in many dimensions. For example, the Msimbazi River in Dar es Salaam has an appreciable self-purification capacity; however, the pollution plight has overweighed this. Thus, rivers fail to maintain their functional attributes due to an inadequate or inefficient self-purification capacity [5]. Deforestation and river bank encroachment are the main agents of soil erosion, siltation, and even landslides in the middle section of the rivers [6].
Buffer zones are essential for conserving and safeguarding against protected areas or sensitive areas; in Tanzania, laws and policies have been set to protect riparian buffers. One among them is the Environmental Management Act of 2004 [7], which prohibits conducting human activities within 60 m of the water source [8]. There are increased socio-economic activities like agriculture within the 60 m strip of the riverbanks of Tengeru, Nduruma, Themi, and Maji ya Chai; this violation can be termed an act of encroachment.
One of the most pressing issues is the urban growth of Arusha city due to being a tourist hub that has attracted the population growth of rural dwellers and other dwellers in the country into the urban. Furthermore, population growth has been experienced in relative districts like Meru, which has led to the overexploitation of water resources. Economic water stress often increases due to population growth in urban areas. Since the water available is insufficient for economic use, urban dwellers extend to the nearby streams for easy access [9]. Rivers in the Arusha region pass through human settlements and downstream to areas with several human activities, including inefficiently treated effluent wastewater and inappropriate urban planning [10].
The practice of socio-economic activities in the buffer zones has affected the water quality, especially at the flood plains and downstream points of the rivers. Studies have shown fecal coliform in the Tengeru, Maji ya Chai, and Nduruma rivers beyond the permissible limit [10]. The report further showed high levels of electrical conductivity of up to 1722 µS/cm and BOD, nitrates, and total soluble phosphates levels of 10 mg/L, 50 mg/L, and 0.1 mg/L, respectively. These figures exceed the World Health Organization (WHO) standards, reflecting increased anthropic activities in urban rivers. The encroachment of riparian buffer zones also affects the stability of the river, water velocity, turbidity, and nutrient overloading, which are essential factors for the growth and breeding of amphibians and macroinvertebrates (Properties et al., 2015) [11].
Mckenzie et al. [12] warned that increased human activities along the riparian buffer zone could increase the impacts on water sources beyond the current knowledge. The aforementioned diverse pollutant sources and high populations along these rivers trigger the need to conduct a detailed analysis of the activities undertaken in riparian buffer zones. However, information on the levels of encroachment and the activities undertaken in the riparian buffer zone is scant or absent. Furthermore, the informed implementation of environmental legislation was envisaged to provide management needs for the sustainability of these rivers. Therefore, this paper aimed to quantify socio-economic development along the buffer zone and determine community compliance with the environmental legislation governing riparian buffer zones.

2. Material and Methods

2.1. The Study Area

The study focused on four rivers, Nduruma, Tengeru, Themi, and Maji ya Chai, located in the Arusha region of Tanzania (Figure 1). Tengeru, Nduruma, and Maji ya Chai are in the Meru district, while Themi is in the Arusha district. These rivers originate from the foothills of Mount Meru, which is the second-highest mountain in East Africa. These rivers join other rivers to form the Kikuletwa catchment in the Simanjiro district, which is situated in the northwestern part of the Pangani River basin, as documented by Kitalika et al., 2018 [10].
Arusha city lies between latitudes 2° and 6° south and longitudes 34.50° and 38° east. The city lies below Mount Meru on the eastern edge of the eastern branch of the Great Rift Valley. Despite its proximity to the equator, the elevation of Arusha is approximately 1400 m (4600 ft), resulting in a temperate climate. By understanding the specific geographic and climatic attributes of Arusha and its surrounding regions, researchers and policymakers can better appreciate the environmental challenges and opportunities that are inherent in the area.

2.1.1. Climate

The study area was characterized by a mild, warm, and temperate climate that experienced an annual average temperature of 20 °C. There were two distinct wet seasons, October–December and February–June, that received an average rainfall of about 1717 mm. The highest average rainfall was observed in April. There were two distinct dry seasons in January and July–September. February was the hottest month, while July had the lowest average temperature of about 16.8 °C.

2.1.2. Socio-Economic Activities

Arusha City is famously known for its tourism industry, significantly contributing to its growth. Moreover, its proximity to the tourist attractions such as national parks and conservation areas has made Arusha a center for foreign interaction. Other socio-economic activities in Arusha include agriculture, livestock keeping, and small-scale industries [13]. Agriculture is currently leading, for it has threatened the ecosystem of riparian buffers due to its expansion from economically planned zones into protected zones which could be considered encroachment. The growth of industries has accounted for the increase in impervious areas, even in the regions to be protected and used for recharge purposes. In return, the rate of surface runoff has increased, as well as water stress, with a higher occurrence of floods due to a lack of flood attenuation.

2.2. Data Collection and Analysis

2.2.1. Data Acquisition

Time series satellite images from the years 2000, 2010, and 2020. Additionally, the river networks and shapefiles of this boundary were accessed from different sources (Table 1).
A survey was conducted on the respective riparian buffer to observe and identify the socio-economic activities in the buffer zones. The selected land use/cover classes followed the Corine land cover classification (Table 2). During this survey, 50–60 ground truthing points were collected to assess accuracy.
Structured questionnaires were used to gain information on the perception of the community regarding compliance and factors influencing the encroachment of buffer zones. A total of 195 were determined through the Taro Yamane Equation (1):
n = N 1 + N e 2
where n is the sample size, N is the population, and e represents the acceptable sampling error. For example, the population size of Meru District used was 268,144, which was found according to the 2022 census.
A focus group discussion was held with experts from the Pangani Basin Water Board (PBWB), National Environment Management Council (NEMC), and Meru District Council. The aim was to identify the challenges hindering environmental law implementation. The discussion looked further into the impacts of encroachment, the recent efforts made by the organization to limit further encroachment activities, and factors influencing encroachment within the buffer zone.

2.2.2. Data Analysis

The acquired Landsat images were atmospherically and radiometrically corrected before classification. Quantum GIS was used to remove the scan lines in the Landsat 7 images using the provided supplementary data. Other image corrections, like contrast stretching, enhanced the color contrast in images before classification. Figure 2 presents the summary of the image classification workflow.
The images were classified by supervised classification. Training samples for each class were allocated to the image; the training samples were combined to form a signature file that was used to perform a supervised classification by maximum likelihood. Satellite images of the year 2000, 2010, and 2020 were acquired from the United States Geological Survey (USGS) website through USGS Global Visualization Viewer (GloVis) (https://glovis.usgs.gov/ (accessed on 18 March 2020)). Some of the satellite images had scanline errors, like Landsat 7 satellite images. These errors were corrected to remove the scan lines and prepare them for classification; this was conducted using a Quantum Geographic Information System (QGIS). Additionally, the pre- and post-processing of the images was conducted before and after classification.
An accuracy assessment was performed to determine the accuracy of the classification output. The Kappa Coefficient was used, and it was determined by using Equation (2).
K a p p a   C o e f f i c i e n t = N i = 1 m C M i i i = 1 m C i c o r r C i p r e d N 2 i = 1 m C i c o r r C i p r e d
where N is the total number of selected classified pixels or points, m is the number of rows, C M i i is the number of points that were correctly classified for a particular land use class and C i c o r r and C i p r e d were marginal totals for the row and column.
To determine the amount of encroachment (% encroachment), Equation (3) was used.
%   e n c r o a c h m e n t = A r e a   o f   t h e   b u f f e r   e n c r o a c h e d A r e a   o f   t h e   60   m e t r e s   b u f f e r   z o n e × 100 %
The structured questionnaires from Kobotoolbox were imported to R, where the statistical analysis of the factors influencing the buffer zone, the level of compliance with the regulations, the challenges encountered in implementing environmental legislation, and the relationship between these variables was performed.
Buffer zone analysis was performed upon the overlay of the rivers before a buffered shapefile was created; the shapefile was used as a clipping tool to determine the classes within the buffer zone and their respective areas. The buffer field was set at 60 m as stated in the Environmental Policy 2021, EMA, 2004, and the Water Resource Management Act, no 11 of 2009.

3. Results and Discussions

3.1. Accuracy of LULC Classification

The Kappa coefficient, overall accuracy, producer accuracy, and user accuracy for the satellite images of 2000, 2010, and 2020 were determined after the classification. The confusion matrix brought about the user accuracy (UA) and the producer accuracy (PA) for each class, as summarized in Table 3.
The overall accuracy ranged from 81.48% to 85.37%, while the Kappa coefficient ranged from 0.8 to 0.83 (Table 4).
These values signify that the classification attained the minimum threshold required for land use/cover analysis and modeling [14]; thus, the results of this study were authentic, using minimum requirements for image classification accuracy [15].

3.2. Spatial and Temporal LULUC Changes

The changes in areas under each class are summarized in Table 5 and depicted in Figure 3. The observed changes across the three time periods show that the area of artificial areas continued to increase, from 157.86 in 2000 to 293.12 in 2010 and further to 452.23 km2 in 2020. This increment suggests ongoing urbanization and development. Furthermore, the area of agricultural land also showed a steady increase, from 325.56 in 2000 to 481.80 in 2010 and further to 560.58 km2 in 2020. This expansion indicates sustained agricultural activities and the potential expansion of farmland. Additionally, the changes in these classes signified an increase in population, increasing the demand for more food and shelter.
The forest and semi-natural areas decreased significantly from 718.18 in 2000 to 427.374 in 2010 and further to 193.23 in 2020. This decrease implies the substantial loss of natural and semi-natural habitats over these two decades. The area of wetlands decreased gradually from 4.73 in 2000 to 3.852 in 2010 and further to 0.261 in 2020; this trend highlights a continuing decline in wetland ecosystems. The decline in wetland ecosystems goes in tandem with a slight fluctuation in water. However, due to perennial rivers, the water area remained relatively stable over these years, with slight fluctuations from 0.49 in 2000 to 0.558 km2 in 2010 and eventually to 0.522 km2 in 2020.
Water showed a minimal change in its area between 2000 and 2020. However, there was a reduction in water between 2010 and 2020. In 2000, water and wetlands covered an area of about 0.4 km2; a reduction of about 0.004% in water was observed in 2010, and an overall increment of about 0.005% was recorded between 2000 and 2020 for water and wetlands, respectively. This indicates no significant changes in water bodies during this decade. It is worth mentioning that a portion of water may be absorbed or obscured by the surrounding forest, shrub land or grassland. Conventionally, land that was initially occupied by forest and semi-natural covers may have been converted to agricultural areas and artificial surfaces. This trend is depicted in Figure 4.
There was a significant increase in artificial areas between 2000 and 2010, with a percentage change of 11.28% and an almost similar increment rate of 13.18% in the total area of the catchment between 2010 and 2020. This increase indicates rapid urbanization and infrastructure development during this period, albeit at a slightly increased rate compared to the previous decade. Furthermore, agricultural areas experienced a sharp increase, with a percentage change of 12.92% between 2000 and 2010 and expansion at a decreased rate of 6.53% between 2010 and 2020. These changes indicate expansion in agricultural activities and possibly an increased focus on food production during this period, probably exhausting most fertile areas in the previous decade.
Forest and semi-natural areas significantly declined between 2000 and 2010, with a percentage change of 25%. However, a similar decline with a comparatively reduced rate of 19.4% in forest and semi-natural areas was observed between 2010 and 2020. This indicated a substantial loss of forested and natural lands, possibly due to deforestation, urbanization, or land conversion for agricultural purposes. In line with this decline in forest and semi-natural areas, wetlands experienced a slight decrease, with a percentage change of 0.319% between 2000 and 2010. Furthermore, a flimsy increase of 0.298% was observed between 2010 and 2020; this indicates a minor loss of wetland habitats during this decade, indicating a strengthening of conservation strategies or encroachment of most wetlands.
Generally, between 2000 and 2020, there was a significant increase in artificial areas from 2000 to 2020 with a percentage change of 24.46%, which was relative to the total area. This indicates that urbanization and infrastructure development have expanded over the years. Agricultural areas have also experienced growth, with a percentage change of 19.45%, which is relative to the total area. This expansion suggests an expansion in agricultural activities and possibly increased food production. Furthermore, forest and semi-natural areas have shown a declining trend, with a percentage change of 44.4% relative to the total area. This indicates a significant reduction in forested and natural lands, possibly due to deforestation, urbanization, or the conversion of land for agricultural production. Additionally, wetlands have experienced a slight decrease, with a percentage change of 0.357%, which is relative to the total area. This suggests a minor loss of wetland habitats, which could impact the biodiversity and ecosystem services associated with wetland areas. In line with this, the area covered by water has remained relatively stable, with a small percentage change of 0.005% relative to the total area, indicating that there have been no significant changes in water bodies over the years.
Generally, the trends between 2000 and 2010 indicated rapid urbanization, moderate growth in agricultural areas, the significant loss of forest and semi-natural areas, a slight decrease in wetlands, and minor changes in water bodies. Between 2010 and 2020, these trends showed continued urban expansion at a slower rate, continued growth in agricultural areas but at a reduced pace, and a further decline in forest and semi-natural areas, including the significant loss of wetlands and relatively stable water bodies. These trends highlight the ongoing challenges of urbanization, deforestation, and land use changes, emphasizing the need for sustainable land management practices, conservation efforts, and the careful consideration of the environmental impact of human activities.
The land use/cover changes observed in the study area could have significant environmental, economic, and social implications, such as habitat loss, changes in ecosystem services, agricultural productivity, and urban development. Monitoring and managing these trends is important to ensure sustainable land use practices and minimize negative environmental and ecosystem impacts.
Previous studies in other Arusha City catchments have reported a similar agricultural land increment. Agricultural land was expected to increase by about 21.1% and 29.2% between 1985 and 2000 and from 1985 to 2015, respectively. This increase would likely continue for about 38.2% and 42.7%, from 1985 to 2030 and 1985 to 2050, respectively [16]. Similarly, the agricultural land on the slopes of Mount Meru were reported to increase from 46.85% to 50.42% between 1986 and 1996 and 42.8% between 1996 and 2006 [10]. The report further shows a general increase in the built-up area by 96.8 km2 and 53.9 km2 between 2006 and 2016, respectively. A large proportion of this increase was reported to align with a decrease in bushlands (from 31.5% to 24.19%), some of which could be found along the riparian buffer zone.
The reports show that urban growth in Arusha was approximately 287% from 1995 to 2015; the future projection shows an increment of 180% in the urban footprint by 2050 [17]. Kitalika et al. [10] reported that significant land use transitions from bushland and agricultural land into human settlements resulted from upgrading the conversion of Arusha town into a city status. A similar decrease in the forest was also reported in the northern [18,19,20], southern highlands [21], central regions, and coastal regions of Tanzania [22]. This indicates an increased pressure on water resources, predominantly urban rivers, which is likely to affect sustainability.

3.3. Socio-Economic Development along the Riparian Buffer Zones

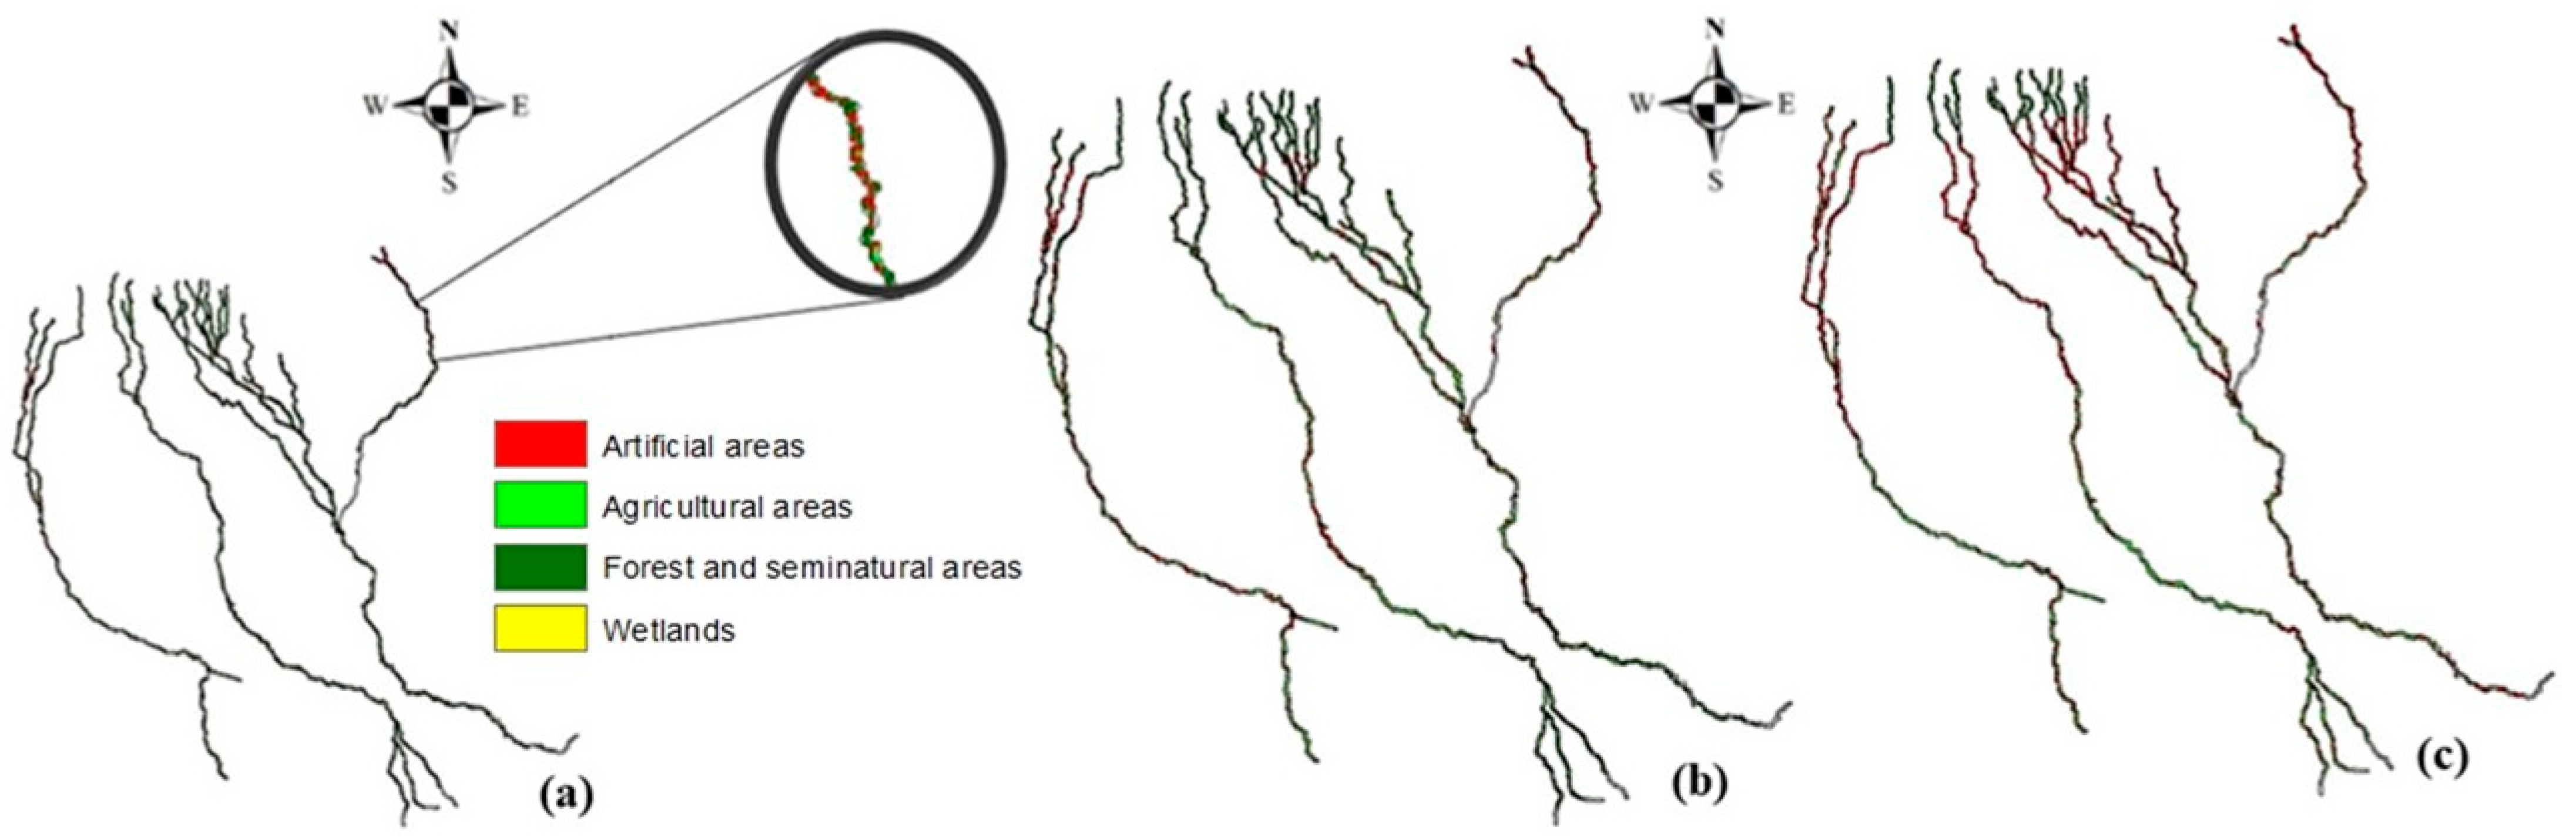
Changes in land use/cover in the buffer zone are summarized in Table 6 and depicted in Figure 5. Between 2000 and 2020, the land cover in the buffer zone continuously showed persistent change as the driving factors exceeded the carrying capacity of the buffer zone. Within the buffer zone, there was an increase in artificial areas from 2.538 km2 in 2000 to 8.361 km2 in 2010 and, finally, 16.47 km2 in 2020. This change was equivalent to 18.07% from 2000 to 2010, 25.06% from 2010 to 2020, and a total change of about 43.13% from 2000 to 2020. This change mirrored environmental destruction along the buffer zone, suggesting water quality and quantity change.
On the other hand, there was an increase in agricultural areas by 7.533 km2 from 2000 to 2010 and a slight decrease of 2.759 km2 from 2010 to 2020. This change mirrored an equivalent increase of about 23.31% from 2000 to 2010, 6.92% from 2010 to 2020, and an overall increase of about 30.23% from 2000 to 2020.
There was a significant decrease in forest and semi-natural areas of 39.63% from 2000 to 2010 and a further shrinking in forest and semi-natural areas by 31.73%. This decrease was equivalent to a total decrease in forest and semi-natural areas by 71.36% from 2000 to 2020. Wetlands, on the other hand, showed a slight decrease of 1.7% from 2000 to 2010, a slight increase of about 0.24% from 2010 to 2020, and an overall shrinking of about 1.94% from 2000 to 2020.
The intermittent change that took place between the years 2000 and 2010 in LULC has been contemplated to be the result of a population increase, which intensified anthropic activities, thus, posing stress in areas once considered buffer zone. As the need for economic growth, food, and settlements increase, some classes tend to triumph over others in keeping up with the current demands. Land use classes that were part of the buffer zone ecosystem were converted into agriculture and artificial areas to suffice the community’s needs and, thus, buffer zone encroachment.
These results are similar to those reported by [6] in the Bagmati River in the Kathmandu Valley. The general land cover in the Bagmati River showed that between 2006 and 2014, the vegetation and grassland class had a tremendous fall of 35.53% and 29.20%, respectively. Artificial areas, represented by built-up areas, increased by 14.82%, and road expansions increased by 0.37%, while open spaces and water bod stayed relatively constant. The hinted results are similar to the ones obtained in this study regardless of the difference in the description of land use classes. This phenomenon implies that the driving factors of encroachment in the buffer zones are almost the same, with the leading factor of encroachment being urbanization. The encroachment of smallholder farmers and the expansion of tea plantations were also reported in the Sigi sub-catchment [23].

3.4. Community Perception of the Factors Influencing River Buffer Zone Encroachment

The factors influencing river buffer zone encroachment include population growth, urbanization, poverty, water scarcity, and a shortage of fertile land and poverty. These are factors that other researchers in their studies have reprimanded; some of these factors exist in the respective study areas of Themi, Nduruma, Maji ya Chai, and Tengeru.
The existing encroachment factors at the site area are urbanization and poor urban planning, which contributes about 42%, water scarcity, which contributes 8.33%, and poverty, which contributes 16.67% (Figure 6). The urban growth rate before the enactment of EMA 2004 appeared to be low by 20% when compared to the current rate of 38.33%.
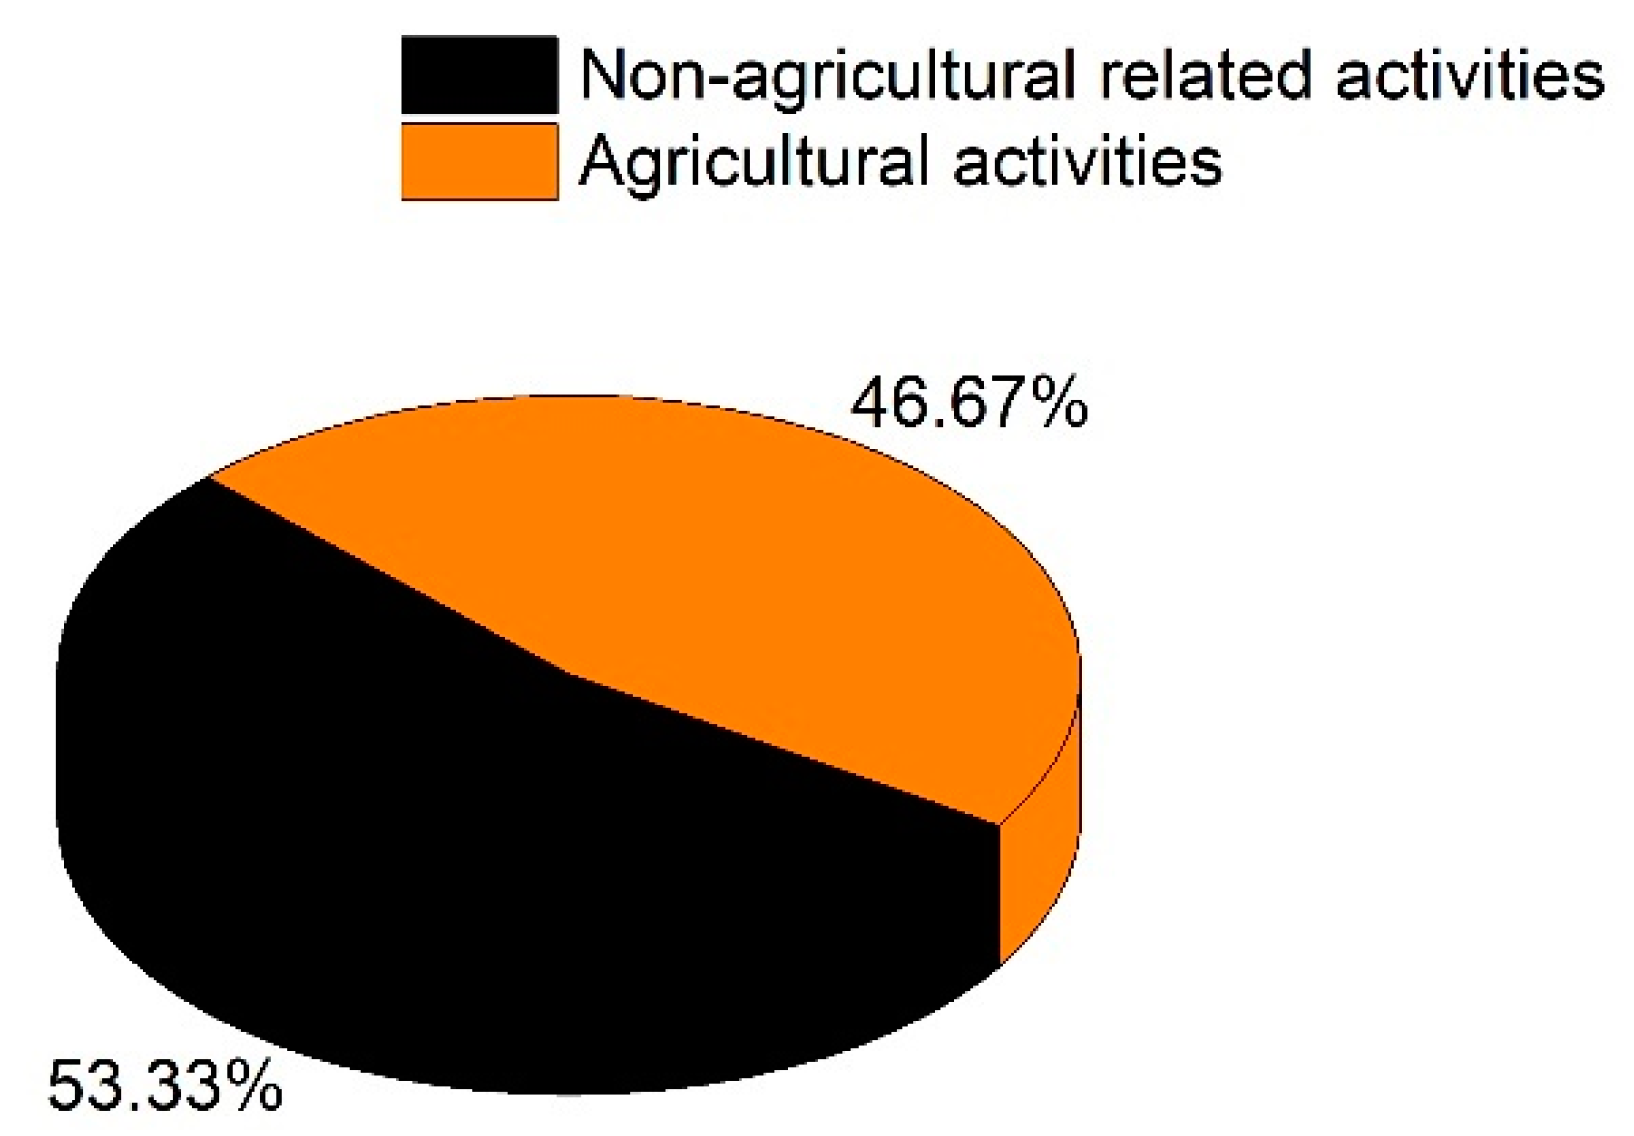
The socio-economic activities in the selected case studies included agricultural activities such as maize plantations, floriculture, and olericulture. During the site survey, flower gardens were sported at Sekei near the river Themi and salad gardens on the river Nduruma’s banks. About 46.67% of the respondents conducted agriculture-related activities, while 53.33% were involved in non-agricultural activities, including shopkeeping, lumbering, and garages along the buffer zone (Figure 7). Considering the nature of socio-economic activities performed in this area, it is evident that the increasing population led to economic water stress and thus forced peasants and other business owners to invade the restricted area for easy accessibility to water.
Studies indicate that urbanization is the major factor leading to the encroachment of the buffer zone in urban rivers [24]. Land use for the sake of residence and commercial purposes has become extremely lucrative such that it has infringed or constrained other important land use developments. Shrestha [6] reported that rapid urbanization has led to land scarcity with very high prices, which triggers people to encroach on the buffer zones. However, it is worth stating that the absence of the demarcation of the buffer zone of the river has not produced significant changes in the encroachment of the riparian buffer zones. These results have shown that the growth of urban areas has resulted in the shrinkage of forest and semi-natural areas and influenced the growth of built-up areas. This phenomenon can only imply that urbanization has subjected cities to land scarcity, thus invading buffer zones.

Level of Awareness and Compliance with Environmental Legislation

The results indicate that about 53.33% of the interviewed community members were aware of the regulations restricting the conduction of anthropic activities along the buffer zones. Furthermore, 46.67% of the community was unaware of the buffer zone regulations (Figure 8). Awareness is not adherence, and the level of adherence of the community to regulations governing the buffer zone was 70% adhered to, while those who did not adhere to these regulations comprised 30%.
In establishing the link between awareness and adherence, 76.9% of the community who responded to the survey and were aware of the buffer zone regulations did not adhere to the environmental legislation (Table 7). Furthermore, 76.7% of the community members were unaware of the environmental regulations and did not comply with the buffer zone regulations. This means that the level of awareness did not contribute to the adherence to environmental regulations in the study area.
The results showed that a small proportion of community members established their residents within the river buffer zone before enacting the environmental management act, no 20 of 2004 [7]. However, a large proportion of the population established settlements along the river buffer zone, even after enacting the Environmental Management Act of 2004 (EMA, 2004). The results showed that 15%, 13.6%, and 37.5% of people aged 15–29, 30–44, and above 45 years had settled or dwelled in the area before enacting EMA, 2004. However, 75% of people aged 15–29 years, 86.4% aged 30–44 years, and 62.5% of those above 45 years started dwelling in the buffer zone after enacting EMA, 2004 (Table 8).
The link between education level and environmental legislation awareness showed a linear increase in awareness as the level of education increased. About 70% and 48.1% of those with no formal education and those with primary education were aware of the regulations. In contrast, the level of awareness increased to 70% for those with a university/college education (Table 9). This observation suggests that increasing awareness campaigns may reduce the rate of encroachment in riparian buffer zones.
The results indicate that most people aged 15–29 and 30–44 years were more aware of environmental legislation by 60% and 54.5%, respectively (Table 10). However, a significant proportion (40% and 45.5%) of this active group were still unaware of the environmental regulation governing the buffer zones of rivers. This trend implies the need for intensive sensitization for sustainable buffer zone management in the future. However, for the elderly under the category above 45 years, only 37.5% of people were aware, and 62.5% were unaware (Table 10). This triggers the need to extend sensitization training to the elderly group, which can be used to educate young ones in the villages.

3.5. Community Perception of the Challenges Hindering the Enforcement of the Regulation Governing River Buffer Zones

Political intervention is where the politician protects the interests of those who elected them without considering the potential impacts that may be imposed on the environment. This challenge means there is a need to separate political interests from enforcing environmental legislation. Furthermore, the absence of demarcation along the buffer zones of rivers, especially urban rivers, resulted in some anthropic activities along the buffer zone. The installation of signs and symbols near river areas was not effectively implemented until recently when permanent river changes were observed to have signposts along the main roads.
An unawareness of environmental legislation is another challenge afflicting the buffer zones; most people are unaware of the environmental laws regarding the conservation of water resources and the need to leave a buffer zone, as presented in Table 10. Furthermore, land scarcity is one of the driving forces that has influenced society to encroach on buffer zones. Arusha city is under the pressure of development and is a center of tourist attractions that are prone to rapid growth and requires an increase in land. Therefore, buffer zones are the only sustainable fertile land for most low-income communities to conduct small-scale farming for income generation. Thus, river buffer zones and other open spaces succumbed to encroachment.
Climate change has greatly affected water availability for most domestic, agricultural, and industrial uses. Eventually, the community near rivers sought the most affordable and easily accessible water sources like river streams. Farmers and horticultural practitioners of the Nduruma River are famously known for the deviation of River streams for irrigation purposes into their farms, and the same case applies to the Tengeru River in Manyatta village. Furthermore, the recent rapid increase in population in the city has also led to an increased demand for development and other human needs. This increase in demand requires a large amount of land; thus, more interest is taken in open space areas like buffer zones.
Initiatives taken by the authorities include evacuation, especially in new developments apart from the existing ones. Another initiative was to charge fines for anthropic activities like sand mining or quarrying along the buffer zones. However, the plan was to install beacons for demarcating the buffer zones and inform the surrounding community that the law protected the buffer zone area. However, socio-economic activities that existed before the environmental legislation was allowed to occupy the buffer zones only if they were keen enough to protect the buffer zones against any environmental destruction. Since it has proved impossible to fully evacuate people from buffer zones since some of these areas have been leased to these people since colonial times; thus, these organizations have chosen to address this problem from different aspects.

3.6. Riparian Buffer Zone Encroachment as a Threat to Urban Rivers

Buffer zone encroachment is a challenge in many parts of the world. Abubakari and Romanus [25] reported the enormous encroachment of the Subin and the Aboabo Rivers buffer zones in Ghana. This study further showed that 33% of the structures along the riparian buffer zones of rivers were permanent, whereas 67% were temporary structures. In Nigeria, the encroachment of the buffer zone along the Ogun River by a built-up area increased from 34.1 Ha in 1964 to 123 Ha in 2008 [26]. A similar trend was reported in Sir Lanka, where the Pinga Oya tributary in the upper Mahaweli River was reported to have encroached with 80% of the built-up area and in areas with a moderate population [27]. This report further showed high nutrient levels resulting from agricultural pollution. This trend signified that population pressure over water resources should be properly integrated into sustainable supply plans.
In India, the reports showed the encroachment of the Swarnrekha River and its tributaries in urbanized areas by about 0.73 km2 within a 50 m buffer [28]. In Korea, the water quality in the Han River Basin was reported to decline due to increasing land development and natural activities in the watershed [29]. These reports indicate that increased anthropic activities such as urbanization and agriculture threaten water resources worldwide.

4. Conclusions

Regardless of the recently implemented efforts to limit encroachment activities, the incapacity to eliminate socio-economic activities along the riparian buffer zones threatens the sustainability of these rivers. The persisting increase in socio-economic activities like agriculture along buffer zones imperils the river ecosystems, guaranteeing little survival for aquatic biodiversity. Eutrophication is one of the existing impacts of agricultural activities, which is likely to create anoxic conditions and thus lead to the loss of aquatic biodiversity.
Increased artificial areas in buffer zones due to the collective demand for population growth and economic expansion affected river characteristics like river flow and flood attenuation. Rivers have become more susceptible to floods, stream perturbation, and sedimentation; far worse, some rivers are in the blink of disappearing due to drying. The corresponding increase in agricultural land and the built-up area in the buffer zone implies a significant decrease in forest cover and Shrub lands. Deforestation practices threatens the recharge capacity of rivers during dry seasons, considering the unreliable hydrologic patterns influenced by climate change. The removal of Shrub lands and forests threaten the disappearance of species like fig trees, alongside an increase in the sediment level and excess evapotranspiration from rivers. The surrounding community may also endure water stress scarcity in the near future.
An increase in fallow land impaired fertile soils by exposing them to active agents of soil erosion like wind and water. The loss of soil fertility succumbed the soil to stress from manure and chemical fertilizers. The soil has also accumulated a questionable number of pesticides and herbicides that are used to kill weeds and pests. Deteriorating soil quality has also affected the compactness of soil particles and, thus, increased sediments.
The authors recommend that water managers and decision-makers redefine the strategies that increase the effectiveness of governing buffer zones for sustainable management amid climate change. Further studies should focus on predicting future changes which could occur due to encroachment activities and the cost that the government will experience in remediating these changes if quick measures are not implemented. The economic feasibility of implementing EMA, 2004 should be reviewed to identify its areas of weakness and to recognize the areas that require re-enforcement.

Author Contributions

All authors contributed equally to this manuscript. All authors have read and agreed to the published version of the manuscript.

Funding

This research received no external funding.

Data Availability Statement

The National Bureau of Standards and Tanzania Meteorological Authority are the custodian of the raw data.

Conflicts of Interest

The authors declare no conflict of interest.

References

  1. Lalika, M.C.S.; Meire, P.; Ngaga, Y.M.; Chang’a, L. Understanding watershed dynamics and impacts of climate change and variability in the Pangani River Basin, Tanzania. Ecohydrol. Hydrobiol. 2015, 15, 26–38. [Google Scholar] [CrossRef]
  2. Thomas, K.J.; Zuberi, T. Demographic Change, the IMPACT Model, and Food Security in Sub-Saharan Africa; UNDP Regional Bureau for Africa Working Paper; UNDP: New York, NY, USA, 2012; pp. 1–23. [Google Scholar]
  3. Parnell, S.; Walawege, R. Sub-Saharan African urbanisation and global environmental change. Glob. Environ. Change 2011, 21, S12–S20. [Google Scholar] [CrossRef]
  4. Taylor, R.G.; Barrett, M.H.; Tindimugaya, C. Urban areas of Sub-Saharan Africa; weathered crystalline aquifer systems. In Urban Groundwater Pollution; Lerner, D., Ed.; Balkema: Boca Raton, FL, USA, 2003; pp. 155–179. [Google Scholar]
  5. Mbuligwe, S.E.; Kaseva, M.E. Pollution and Self-Cleansing of an Urban River in a Developing Country: A Case Study in Dar es Salaam, Tanzania. Environ. Manag. 2005, 36, 328–342. [Google Scholar] [CrossRef]
  6. Shrestha, S. Assessment of Bagmati River Encroachment through Application of GIS and Remote Sensing. Bachelor’s Thesis, Pokhara University, Lekhnath, Nepal, 2015. [Google Scholar]
  7. URT. Environmental Management Act (EMA) No. 20 of 2004; United Republic of Tanzania, Vice Presidents Office, Division of Environment: Dar es Salaam, Tanzania, 2004. [Google Scholar]
  8. Tudor, F. Environmental Management Activities. Qual. -Access Success 2013, 14, 124–128. [Google Scholar]
  9. Loewenson, R. Trends in Water Resources in East and Southern Africa. Training and Research Support Centre in the Regional Network for Equity in Health in East and Southern Africa (EQUINET). 2020, p. 17. Available online: https://equinetafrica.org/sites/default/files/uploads/documents/EQ%20ESA%20Trends%20in%20water%20resources%20May2020.pdf (accessed on 18 March 2023).
  10. Kitalika, A.; Machunda, R.; Komakech, H.; Njau, K. Land-Use and Land Cover Changes on the Slopes of Mount Meru-Tanzania. Curr. World Environ. 2018, 53, 331–352. [Google Scholar] [CrossRef] [Green Version]
  11. Emmanuel, H.; Peter, K.; Alex, W. Amphibian and Benthic Macro Invertebrate Response to Physical and Chemical Properties of Themi River, Arusha, Tanzania. Res. Rev. J. Ecol. Environ. Sci. 2015, 3, 38–50. [Google Scholar]
  12. Mckenzie, J.M.; Mark, B.G.; Thompson, L.G.; Schotterer, U.; Lin, P.-N. A hydrogeochemical survey of Kilimanjaro (Tanzania): Implications for water sources and ages. Hydrogeol. J. 2010, 18, 985–995. [Google Scholar] [CrossRef]
  13. de Bont, C.; Veldwisch, G.J.; Komakech, H.C.; Vos, J. The fluid nature of water grabbing: The on-going contestation of water distribution between peasants and agribusinesses in Nduruma, Tanzania. Agric. Hum. Values 2016, 33, 641–654. [Google Scholar] [CrossRef]
  14. Ahmed, B.; Ahmed, R.; Zhu, X. Evaluation of Model Validation Techniques in Land Cover Dynamics. ISPRS Int. J. Geo-Inf. 2013, 2, 577–597. [Google Scholar] [CrossRef]
  15. Jensen, J.R. Introductory Digital Image Processing: A Remote Sensing Perspective; Prentice-Hall Inc.: Hoboken, NJ, USA, 1996. [Google Scholar]
  16. Msovu, U.E.; Mulungu, D.M.; Nobert, J.K.; Mahoo, H. Land Use/Cover Change and their Impacts on Streamflow in Kikuletwa Catchment of Pangani River Basin, Tanzania. Tanzan. J. Eng. Technol. 2019, 38, 171–192. [Google Scholar] [CrossRef]
  17. Olarinoye, T.; Foppen, J.W.; Veerbeek, W.; Morienyane, T.; Komakech, H. Exploring the future impacts of urbanization and climate change on groundwater in Arusha, Tanzania. Water Int. 2020, 45, 497–511. [Google Scholar] [CrossRef]
  18. Hemp, A. Continuum or zonation? Altitudinal gradients in the forest vegetation of Mt. Kilimanjaro. Plant Ecol. 2006, 184, 27–42. [Google Scholar]
  19. Said, M.; Hyandye, C.; Mjemah, I.C.; Komakech, H.C.; Munishi, L.K. Evaluation and Prediction of the Impacts of Land Cover Changes on Hydrological Processes in Data Constrained Southern Slopes of Kilimanjaro, Tanzania. Earth 2021, 2, 225–247. [Google Scholar] [CrossRef]
  20. Mmbaga, N.E.; Munishi, L.K.; Treydte, A.C. How dynamics and drivers of land use/land cover change impact elephant conservation and agricultural livelihood development in Rombo, Tanzania. J. Land Use Sci. 2017, 12, 168–181. [Google Scholar] [CrossRef]
  21. Hyandye, C.; Martz, L.W. A Markovian and cellular automata land-use change predictive model of the Usangu Catchment. Int. J. Remote Sens. 2017, 38, 64–81. [Google Scholar] [CrossRef]
  22. Ngondo, J.; Mango, J.; Liu, R.; Nobert, J.; Dubi, A.; Cheng, H. Land-Use and Land-Cover (LULC) Change Detection and the Implications for Coastal Water Resource Management in the Wami–Ruvu Basin, Tanzania. Sustainability 2021, 13, 4092. [Google Scholar] [CrossRef]
  23. Yanda, P.; Munishi, P. Hydrologic and Land Use/Cover Change Analysis for the Ruvu River (Uluguru) and Sigi River (East Usambara) Watersheds; WWF/CARE International: Dar es Salaam, Tanzania, 2007. [Google Scholar]
  24. Aabeyir, R.; Aduah, M.S. Assessment of encroachment of urban streams in Ghana: The case study of Wa Municipality. J. Nat. Resour. Dev. 2014, 4, 10–17. [Google Scholar] [CrossRef]
  25. Abubakari, A.; Romanus, D.D. Impact of land use activities on Subin and Aboabo Rivers in Kumasi Metropolis. Int. J. Water Resour. Environ. Eng. 2012, 4, 241–251. [Google Scholar]
  26. Adeofun, C.; Oyedepo, J.; Lasisi, T. An assessment of Urban encroachment on Ogun river bank protection zone in Abeokuta City, Nigeria. J. Agric. Sci. Environ. 2011, 11, 78–89. [Google Scholar]
  27. Dissanayake, L. Stream corridor encroachment and its consequences: The case of Pinga Oya tributary in the upper Mahaweli River in Sri Lanka. Model. Earth Syst. Environ. 2021, 7, 1907–1916. [Google Scholar] [CrossRef]
  28. Pandey, A.C.; Kumar, A. Spatio-temporal variability of surface water quality of fresh water resources in Ranchi Urban Agglomeration, India using geospatial techniques. Appl. Water Sci. 2015, 5, 13–26. [Google Scholar] [CrossRef] [Green Version]
  29. Chang, H. Spatial analysis of water quality trends in the Han River basin, South Korea. Water Res. 2008, 42, 3285–3304. [Google Scholar] [CrossRef] [PubMed]
Figure 1. The study area.
Urbansci 07 00073 g001
Figure 2. Remote sensing process flow chart.
Urbansci 07 00073 g002
Figure 3. Classified land use/cover images for the years. 2000 (a), 2010 (b) and 2020 (c).
Urbansci 07 00073 g003
Figure 4. Change in the land use classes over the years 2000, 2010 and 2020.
Urbansci 07 00073 g004
Figure 5. Buffer analysis of River Themi, Nduruma, Tengeru, and Maji ya Chai for the 2000 (a), 2010 (b), and 2020 (c).
Urbansci 07 00073 g005
Figure 6. Factors influencing buffer zone encroachment.
Urbansci 07 00073 g006
Figure 7. Socio-economic activities.
Urbansci 07 00073 g007
Figure 8. The level of compliance and the level of adherence to the environmental legislation.
Urbansci 07 00073 g008
Table 1. Data used in this study.
Data CategoryDescriptionRow/PathYearData Source
Satellite image Landsat 8 OLI-TRIS168/0622020www.glovis.usgs.gov, accessed on 18 March 2022.
Satellite image Landsat7 ETM+168/0622000www.glovis.usgs.gov, accessed on 18 March 2022.
Satellite image Landsat 7 ETM+168/0622010www.glovis.usgs.gov, accessed on 18 March 2022.
ElevationDigital Elevation Model168/0622022www.glovis.usgs.gov, accessed on 20 March 2022.
BoundaryTanzania District and Wards shape file 168/0622022www.nbs.go.tz, accessed on 23 January 2023.
River networkRiver network-2022Pangani Basin Water Board
Table 2. Description of land use classes.
Land Use ClassDescription
Agricultural areasIncludes arable land, permanent crops, pastures, and heterogeneous agricultural areas.
Artificial SurfacesUrban fabric, industrial, commercial and transport units, mine, dump and construction sites, artificial, non-agricultural vegetated areas.
Forest and semi-natural areasForest, shrub and/or herbaceous vegetation associations, and open spaces with little or no vegetation.
WetlandsInland wetlands and coastal wetlands
WaterInland waters and marine waters.
Table 3. User accuracy and producer accuracy for the years 2000, 2010 and 2020.
Land Use ClassesYears
200020102020
UA (%)PA (%)UA (%)PA (%)UA (%)PA (%)
Agriculture areas83.3371.43807983.3379.67
Water80100100100100100
Artificial Surfaces801008010083.33100
Forest and semi-natural areas7585.7110010090.9166.67
Wetlands7566.67805081.8281.82
Table 4. Accuracy assessment.
Accuracy Assessment
YearOverall Accuracy (%)Kappa Coefficient (%)
200083.0880.10
201085.3783.24
202081.4880.5
Table 5. A real change in LULC from 2000 to 2020.
Land Use ClassesArea (km2)Change (%)
2000201020202000–20102010–20202000–2020
Artificial areas157.86293.12452.2311.2813.1824.46
Agricultural areas325.56481.80560.5812.926.5319.45
Forest and semi-natural areas718.18427.374193.23−25−19.4−44.4
Wetlands4.733.8520.2610.3190.2980.357
Water0.490.5580.5220.00426−0.0040.005
Table 6. Land use/cover changes within the buffer zone of Themi, Nduruma, Tengeru, and Maji ya Chai rivers.
Land Use ClassesArea (Km2)Change (%)
2000201020202000–20102010–20202000–2020
Artificial areas2.5388.36116.4718.0725.0643.13
Agricultural areas2.1339.66611.90723.316.9230.23
Forest and semi-natural areas27.02714.2023.951−39.63−31.73−71.36
Wetlands0.6390.090.009−1.70.24−1.94
Table 7. Level of awareness versus the level of adherence.
Level of AwarenessLevel of Adherence (%)
AdhereDo Not Adhere
Aware23.176.9
Not aware23.376.7
Table 8. Age versus settlement period.
Age (Years)Settlement Period (%)
Before Enacting EMA, 2004After Enacting EMA, 2004
15–291575
30–4413.686.4
Above 4537.562.5
Table 9. Level of education versus level of awareness.
Level of EducationLevel of Awareness of the Environmental Legislation (%)
AwareNot Aware
Not educated3070
Primary level4060
Secondary level48.151.9
University level7030
Table 10. Age versus level of awareness.
Age (Years)Level of Awareness (%)
AwareNot Aware
15–296040
30–4454.545.5
Above 4537.562.5
Disclaimer/Publisher’s Note: The statements, opinions and data contained in all publications are solely those of the individual author(s) and contributor(s) and not of MDPI and/or the editor(s). MDPI and/or the editor(s) disclaim responsibility for any injury to people or property resulting from any ideas, methods, instructions or products referred to in the content.

